Attached files
Table of Contents
UNITED STATES
SECURITIES AND EXCHANGE COMMISSION
WASHINGTON, D.C. 20549
FORM 10-K
(Mark One)
| x | ANNUAL REPORT PURSUANT TO SECTION 13 OR 15(d) OF THE SECURITIES EXCHANGE ACT OF 1934 |
| For the fiscal year ended December 31, 2009 |
OR
| ¨ | TRANSITION REPORT PURSUANT TO SECTION 13 OR 15(d) OF THE SECURITIES EXCHANGE ACT OF 1934 |
| For the transition period from to |
Commission File No. 0-50534
ATHEROS COMMUNICATIONS, INC.
(Exact name of registrant as specified in its charter)
| Delaware | 77-0485570 | |
| (State or other jurisdiction of incorporation or organization) |
(I.R.S. Employer Identification No.) |
5480 Great America Parkway, Santa Clara, CA 95054-3644
(Address of principal executive offices, Zip Code)
(408) 773-5200
(Registrant’s telephone number, including area code)
Securities registered pursuant to Section 12(b) of the Act:
Common stock, $0.0005 par value per share The NASDAQ Stock Market LLC
Securities registered pursuant to Section 12(g) of the Act:
None
Indicate by check mark if the registrant is a well-known seasoned issuer, as defined in Rule 405 of the Securities Act. Yes x No ¨
Indicate by check mark if the registrant is not required to file reports pursuant to Section 13 or Section 15(d) of the Act. Yes ¨ No x
Indicate by check mark whether the registrant (1) has filed all reports required to be filed by Section 13 or 15(d) of the Securities Exchange Act of 1934 during the preceding 12 months (or for such shorter period that the registrant was required to file such reports), and (2) has been subject to such filing requirements for the past 90 days. Yes x No ¨
Indicate by check mark whether the registrant has submitted electronically and posted on its corporate Web site, if any, every Interactive Data File required to be submitted and posted pursuant to Rule 405 of Regulation S-T (§ 232.405 of this chapter) during the preceding 12 months (or for such shorter period that the registrant was required to submit and post such files). Yes ¨ No ¨
Indicate by check mark if disclosure of delinquent filers pursuant to Item 405 of Regulation S-K is not contained herein, and will not be contained, to the best of registrant’s knowledge, in definitive proxy or information statements incorporated by reference in Part III of this Form 10-K or any amendment to Form 10-K. x
Indicate by check mark whether the registrant is a large accelerated filer, an accelerated filer, a non-accelerated filer or a smaller reporting company. See the definitions of “large accelerated filer,” “accelerated filer” and “smaller reporting company” in Rule 12b-2 of the Exchange Act. (Check one):
| Large accelerated filer | x | Accelerated filer | ¨ | |||
| Non-accelerated filer | ¨ (Do not check if a smaller reporting company) | Smaller reporting company | ¨ | |||
Indicate by check mark whether the registrant is a shell company (as defined in Rule 12b-2 of the Act). Yes ¨ No x
The aggregate market value of the registrant’s common stock held by non-affiliates of the registrant was approximately $767,193,000 based upon the closing price of $19.24 of such common stock on the NASDAQ Global Select Market on June 30, 2009 (the last business day of the registrant’s most recently completed second quarter). Shares of common stock held as of June 30, 2009 by each director and executive officer of the registrant, as well as shares held by each holder of 5% of the common stock known to the registrant, have been excluded for purposes of the foregoing calculation. This determination of affiliate status is not a conclusive determination for other purposes.
As of February 9, 2010, there were 68,717,471 shares of common stock of the registrant outstanding.
DOCUMENTS INCORPORATED BY REFERENCE:
Items 10 (as to directors, executive officers and Section 16(a) Beneficial Ownership Reporting Compliance), 11, 12 (as to beneficial ownership), 13 and 14 of Part III incorporate by reference information from the registrant’s Definitive Proxy Statement to be filed with the Securities and Exchange Commission in connection with the registrant’s 2010 Annual Meeting of Stockholders to be held on May 21, 2010.
Table of Contents
2
Table of Contents
ATHEROS COMMUNICATIONS, INC.
| Item 1. | Business |
When used in this Report, the words “will,” “shall,” “may,” “expects,” “anticipates,” “intends,” “estimates,” “plans,” “believes,” and similar expressions are intended to identify forward-looking statements. These are statements that relate to future periods and include statements about our future results, sources of revenue, our continued growth, our gross margins, market trends, our product development, technological developments, the features, benefits and performance of our current and future products, the ability of our products to address a variety of markets, the adoption of the IEEE 802.3 Local Area Network technologies as the standard for wired networking technology, the conversion to Gigabit Ethernet, our growth strategies, future price reductions, our dependence on any one third party license, benefits of open source license agreements, qualification of foundries and our foundries’ capacities, our competitive status, our original design manufacturer, or ODM, customer base, our sales in Asia and subsequent resales outside of Asia, our dependence on our senior management and our ability to attract and retain key personnel, dependency and concentration of customer base, our employee relations, the benefits of equity compensation and the related charges, current and potential litigation, the effects of government regulations, our compliance with laws and regulations related to our encryption technologies, our participation in wireless standards bodies and the effects of the adoption of standards, the expected benefits of our intellectual property and the potential outcomes of intellectual property disputes, our future office space needs, our expected future operating expenses and expenditure levels for research and development, sales and marketing, and general and administrative expenses, fluctuations in operating results, our future capital expenditures, fluctuations in our stock price, our payment of dividends, our future liquidity and cash needs, our credit facility, impact of changes in interest rates, future acquisitions of and investments in complimentary businesses, possible additional impairment charges from the auction-rate securities we hold and the liquidity of those securities, and the expected impact of various accounting policies and rules adopted by the Financial Accounting Standards Board. Forward-looking statements are subject to risks and uncertainties that could cause actual results to differ materially from those projected. These risks and uncertainties include, but are not limited to, factors affecting our quarterly results, our ability to manage our growth, our ability to sustain or increase profitability, demand for our chipsets, the effect of declines in average selling prices for our products, our ability to compete, our ability to rapidly develop new technology and introduce new products, our ability to successfully integrate our recent acquisitions, our ability to safeguard our intellectual property, uncertainties in the credit markets, trends in the semiconductor industry and fluctuations in general economic conditions, and the risks set forth throughout this Report, including under Item 1, “Business” and under Item 1A, “Risk Factors.” These forward-looking statements speak only as of the date hereof. We expressly disclaim any obligation or undertaking to release publicly any updates or revisions to any forward-looking statements contained herein to reflect any change in our expectations with regard thereto or any change in events, conditions or circumstances on which any such statement is based.
In this Report, references to “Atheros,” “we,” “us,” “our” or the “Company” mean Atheros Communications, Inc. and its subsidiaries, except where it is made clear that the term means only the parent company.
Atheros, Align, AMP, ETHOS, FYX, Intellon, U-Nav, ROCm, Universal Wireless Cooperation, WLAN/Bluetooth Coexistence Agent and XSPAN are Atheros trademarks. HomePlug is a registered trademark of the HomePlug Powerline Alliance, Inc. We also refer to trademarks of other corporations and organizations in this document.
Overview
Our Company
We are a global leader in innovative technologies for wireless and wired communications products that are used by a broad base of customers, including manufacturers of personal computers, or PCs, networking equipment for digital home, small office/home office, or SOHO, enterprise and carrier deployments, and consumer electronics for home and mobile applications. With our wireless and wired systems and software expertise, and our high-performance radio frequency, or RF, mixed signal and digital semiconductor design skills, we provide highly integrated chipsets that are manufactured on low-cost, standard complementary metal-oxide semiconductor, or CMOS, processes. Our ability to design communications solutions using standard CMOS processes provides us with increased manufacturing flexibility and, we believe, a competitive advantage. Our product portfolio includes solutions for Wireless Local Area Network, or WLAN, Mobile WLAN, Ethernet, Bluetooth, Global Positioning System, or GPS, and Powerline Communications, or PLC.
We were founded in 1998 with a focus on using advanced digital signal processing techniques to compensate for design limitations of CMOS, a cost-effective semiconductor technique not previously used for radio technologies. The result was our entry into the WLAN market, with cost-effective solutions that helped make the technology broadly accessible to businesses and consumers. While we initially focused on WLAN technology, we have expanded our portfolio to offer other related connectivity technologies through internal development efforts and four acquisitions, including:
| • | ZyDAS Technology Corporation, or ZyDAS, a Taiwan-based developer of integrated circuits and software for universal serial bus, or USB, solutions for WLAN, which we acquired in August 2006; |
3
Table of Contents
| • | Attansic Technology Corporation, or Attansic, a Taiwan-headquartered, provider of Fast and Gigabit Ethernet solutions to the personal computing and networking markets, substantially all of which we acquired in December 2006 and the remainder in November 2007; |
| • | u-Nav Microelectronics Corporation, or u-Nav, a privately held fabless semiconductor company specializing in GPS solutions and software that enable mobile location-based products and services, substantially all of which we acquired in December 2007; and |
| • | Intellon Corporation, a public United States, or U.S., fabless semiconductor company, specializing in PLC solutions, which we acquired in December 2009. |
The results of operations from these acquisitions have been included in our consolidated statements of operations since their respective acquisition dates.
We were incorporated as T-Span Systems Corporation in Delaware in May 1998. In May 2000, we changed our corporate name to Atheros Communications, Inc. Our website address is http://www.atheros.com. The information contained in our website does not form any part of this Annual Report on Form 10-K. However, we make available free of charge through our website our annual reports on Form 10-K, our quarterly reports on Form 10-Q, our current reports on Form 8-K and amendments to those reports filed or furnished pursuant to Section 13(a) or 15(d) of the Securities Exchange Act of 1934 as soon as reasonably practicable after we electronically file this material with, or furnish it to, the Securities Exchange Commission.
Our Business
Our ability to design complex digital and analog connectivity solutions in standard digital CMOS enables us to cost-effectively address a variety of high volume markets with our semiconductor products. We currently market our solutions to manufacturers of networking equipment, PCs and consumer electronics devices for use in both wireless and wired connected products. Having established a leadership position in the WLAN market, we continue to expand the breadth and strength of our technology portfolio to address the multiple connectivity requirements of our customers and to deliver increasingly more complex connectivity platform solutions.
The Connectivity Markets
The worldwide demand for PCs, networking devices and consumer electronics products has grown steadily over the past decade as these products have become more user friendly, added increased functionality and declined in price. Ongoing feature enhancements have resulted in their accelerated adoption across multiple demographics and geographies. In particular, notebooks, netbooks, routers, access points, cellular handsets and consumer electronics such as gaming devices, digital cameras, camcorders, personal media players, or PMPs, and personal navigation devices, or PNDs, are now being used by consumers on a daily basis. With the increase in digital content and the growing demand for access to email, media, location-based services, e-commerce, entertainment content and home monitoring and control, access to the Internet and other information sources has become an important feature for these devices. Broadband access, once confined to the workplace, is now widely accessible at home and through mobile devices, enabling consumers to create their own personal networks with wired and wireless equipment. As connection speeds and quality have improved, consumers are increasingly accessing rich multimedia content such as audio files, Internet Protocol Television, or IPTV, and videos on their PCs, handsets and other consumer electronics devices through multimedia routers, gateways and set-top boxes. With a growing number of applications and an increasing amount of content residing on more devices, the demand for connectivity is expanding beyond the Internet to device-to-device connections used within and outside of the home and workplace.
The devices and networking equipment enabling these growing trends in the home, enterprise and mobile environments require semiconductor integrated circuits, or ICs, that provide increasing levels of performance, ease-of-use, and affordability to provide wired or wireless connectivity. As the consumer demands greater ease-of-use in more compact devices, the ICs that enable connectivity have become increasingly complex, requiring the highest levels of engineering design skill.
Given the variety of connectivity requirements, several key technologies have emerged to become popular modes of connection:
| • | Cellular networks worldwide to support mobile handsets, smartphones, smartbooks, netbooks and notebooks; |
| • | Ethernet providing Internet and device-to-device connections in wired networks in the enterprise and homes, and embedded in devices such as PCs, routers and consumer electronics; |
| • | WLAN also supporting Internet and device-to-device connections for wireless network infrastructure in homes, businesses and hotspots, and embedded in an increasing number of devices including PCs, smartphones, gaming devices and televisions; |
| • | Bluetooth for personal network connectivity, primarily linking devices such as PCs to keyboards and handsets to headsets; |
4
Table of Contents
| • | GPS providing navigational and location-based information; and |
| • | PLC providing Internet access and networking throughout the home over its existing electrical wiring. |
As application requirements grow, some devices include multiple connectivity technologies, such as cellular handsets that feature Bluetooth technology for connecting to headsets and Wi-Fi for connecting to the Internet. This trend places an added demand on makers of connectivity ICs to devise the most effective and efficient combinations of technologies in their solutions.
We believe the wide adoption of connectivity solutions in the home, enterprise, and public hotspots is due to several factors, including:
| • | the creation of industry connectivity standards, such as the Institute of Electrical and Electronics Engineers’, or IEEE’s, 802.11 wireless and 802.3 wired industry standards, which enabled interoperability among connectivity devices; |
| • | the growing demand for anytime, anywhere access to email, instant messaging, or IM, the Internet, media content and location based services; and |
| • | the cost effectiveness of CMOS-based solutions. |
In WLAN, for example, we believe the above factors have driven the adoption of our solutions in networking devices including access points, routers, broadband gateways, media adapters, video game consoles and network storage devices. WLAN is enabling the emerging market for Internet-connected TVs, multi-room audio systems and new automotive applications. WLAN is now featured in virtually all notebook and netbook computers, and is increasing its penetration in desktop PCs. WLAN is also used in consumer devices including mobile video game products, Voice-over-Internet-Protocol, or VoIP, phones, cellular handsets, PMPs, printers, cameras, digital picture frames, e-book readers, and multimedia equipment, including wireless speakers, set-top boxes, personal video recorders, or PVRs, and televisions, or TVs.
Ethernet technology is used in conjunction with wireless and wired technologies in products such as networking equipment, PCs and fixed consumer electronics such as set-top boxes, PVRs, media adapters, printers, video game platforms, TVs and PLC wall adapters. In 1990, the IEEE introduced Ethernet technology with its 802.3 Local Area Network, or LAN, standard. Since that time, it has become the industry standard for wired networking technology. We believe that Fast Ethernet, also known as 10/100 Ethernet, has become the primary wired backbone for home and office networks and has the largest installed base for connecting wired devices such as PCs and for delivering multimedia throughout the home. In recent years, there has been a transition to the faster Gigabit Ethernet standard, also known as 100/1000, which is backward compatible to Fast Ethernet. We believe conversion to Gigabit Ethernet is being accelerated by the increased throughput requirements such as those of 802.11n being placed on LANs, media transmissions requiring greater network capacity and a reduction in the cost of Gigabit Ethernet semiconductors.
Adoption of cellular services and devices has been driven by consumer demand for anytime, anywhere voice service, and more recently for mobile access to the Internet’s data and multimedia content and GPS’s navigational data. To address the growing demand for mobile data and content, carriers and handset manufacturers are enabling a variety of multiple connectivity technologies including WLAN, Bluetooth, GPS and frequency modulation radio, or FM, in a new class of mobile devices that delivers many of the features typically found on the computer desktop. Subscribers now have the option of choosing handsets capable of providing access to email and other Internet services via WLAN, time-sensitive information such as location-based services from GPS and broadcast entertainment and traffic updates via FM capabilities. A variety of these features are currently being offered in enhanced handsets known as smartphones, and are gradually being introduced to lower-cost feature phones. We believe the advent of high-performance, multi-function smartphones has encouraged consumers to increasingly use mobile handsets to download and send content. This trend is placing increasing traffic demands on the third generation, or 3G, networks of cellular service providers, many of whom are now encouraging greater use of WLAN for accessing high-bandwidth content to offload network traffic.
The adoption of Bluetooth personal area network technology has been driven by the growing desire for cost-effective, short-range cable replacement solutions that enable wireless connectivity between devices. Bluetooth solutions are integrated into mobile handsets and headsets to provide consumers with hands-free connectivity for voice communications. Additionally, Bluetooth technology is increasingly becoming an integrated feature in notebook computers to connect directly to other nearby PCs, mobile handsets, gaming devices and PMPs as well as to a variety of peripheral devices such as headsets, mice, keyboards and printers. Bluetooth has also become popular in gaming consoles by enabling wireless connectivity of game controllers. Bluetooth is also being used to connect GPS receivers to mobile handsets, to deliver supplemental location data, and in automotive equipment, bar code scanners, medical equipment, test equipment and traffic control devices.
Consumer demand for real-time location data in a variety of portable applications is growing worldwide. GPS-enabled products are designed to provide location information and enable an array of emerging location-based services through high-volume mobile consumer and commercial applications. GPS-enabled consumer devices in the market today include PNDs, cellular handsets, on-board automotive installations, asset tracking devices and personal products such as watches and cameras. Tracking capabilities in
5
Table of Contents
navigation devices may be enhanced using auxiliary data accessed from carrier servers and the Internet over 3G and WLAN networks, which can be transmitted between receivers via WLAN or Bluetooth links. This is resulting in the growth of navigational devices and handsets that employ GPS in combination with WLAN and/or Bluetooth technologies.
PLC is used in broadband-connected homes to deliver Internet access and content, such as IPTV and video throughout the home. The technology, which travels over the home’s electrical circuits and is accessible through the common electrical wall outlet, is used in routers that connect to the Internet through broadband modems. PLC is also contained in wall adapters that plug into the home’s electrical outlet and distribute the Internet connection and content to fixed digital devices such as desktop computers, media adapters, set-top boxes and gaming equipment, through an Ethernet or Wi-Fi connection to the PLC adapter. With PLC technology, power lines can serve as a network backbone in the home, accessible from every electrical wall outlet. PLC is sometimes paired in combination with Wi-Fi to expand capacity or extend the coverage of the home’s connectivity network.
Strategy
Our objective is to leverage the growing demand for connectivity in PC, networking and consumer devices and be a leading provider of a broad range of innovative and cost-effective networking solutions to deliver complete connectivity platforms to our customers. We are using our design capabilities and worldwide customer support organization to achieve this objective with a focus on the following strategies:
| • | Leverage our radio design and engineering expertise in CMOS IC design to deliver competitive new technology solutions. Our core competency is our ability to design, develop and deliver highly integrated analog and digital connectivity solutions in standard digital CMOS for our customers. By utilizing this capability across multiple markets, we expect to significantly expand our opportunities for revenue growth while enabling our customers to introduce low-cost, feature-rich solutions that expand the overall market for their solutions. |
| • | Expand our product portfolio with complementary technologies. We believe that the need for and use of multiple connectivity technologies is increasing within product platforms that use our connectivity technologies. By providing a superior selection of technology options, we expect to capture a greater share of the total semiconductor market opportunity present in our customers’ designs. |
| • | Leverage our strong customer base. Many developers of PCs, networking equipment and consumer electronics devices have implemented our solutions in a variety of their products. We believe that these customers will continue to require an increased number of connectivity options for their products including WLAN, Ethernet, Bluetooth, GPS and PLC, which we believe will enable us to significantly expand the size of our total addressable market. |
Our Products and Technology
WLAN Solutions
We have been shipping production volumes of our WLAN semiconductors, hardware designs and software for WLAN applications since 2001. We offer customers guidelines known as reference designs that can be used to design a wide variety of systems, including networking cards and routers, broadband gateways, mobile devices and handsets. Our WLAN solutions provide standards-compliant connectivity and other features such as substantial throughput and range enhancements to support video, voice and outdoor broadband access. Our products support several encryption and authentication security standards including the industry’s standardized Wi-Fi Protected Setup™ network management protocols, operating systems, and interfaces to non-computing environments, such as consumer electronics.
We provide a comprehensive portfolio of single and multi-chip WLAN products ranging from entry-level wireless networking products for the PC and SOHO markets to sophisticated wireless infrastructure systems-on-chip, or SoCs, with advanced network management capabilities for the enterprise networking market. Our wireless systems solutions target applications in the PCs, enterprise access, broadband gateway, SOHO networking, consumer electronics and mobile communications markets. Our WLAN products support the IEEE family of WLAN standards, including 802.11a, 802.11b, 802.11g and 802.11n.
We currently provide the following WLAN system solutions:
| • | Radio-on-a-chip, or RoC, is one or more CMOS radio transmitters and receivers for either or both of the frequency bands in which our products operate and is primarily an analog RF circuit. |
6
Table of Contents
| • | MAC + Baseband is an implementation of mixed signal circuitry containing low frequency analog circuits and data converters integrated with a digital interface, media access controller, or MAC, and baseband processor. The MAC contains a silicon implementation to support the protocol for network communications. |
| • | Network Processing Unit, or NPU, is our stand-alone processor which supports a variety of clock speeds and network interfaces. The NPU is typically used in products that provide dedicated wireless networking infrastructure solution. |
| • | Wireless system-on-a-chip, or WiSoC, incorporates an integrated MAC + baseband with a network processor and network interfaces, which have traditionally been offered as separate or discrete components. The processor is an integrated digital device that reduces the overall solution cost for wireless networking infrastructure products. In 2008, we began shipping our single-chip WiSoC with an integrated Ethernet switch to support products that provide wireless networking infrastructure solutions. |
| • | Single-chip solutions are highly integrated, complete wireless solutions, including one or more ROCs, MACs, baseband processors and optionally, a network processor and network interfaces. These devices encapsulate substantially all of the digital and analog circuitry within a single chip. |
Our WLAN products not only meet the appropriate IEEE 802.11 WLAN standards for which they are designed, but also offer enhanced capabilities that benefit users with enhanced performance and functionality. Some of the key features are:
| • | XSPAN® products utilize multiple radio streams and smart antenna technologies including multiple-input multiple-output, or MIMO, designs to increase the performance of wireless networks. Our XSPAN family of products is designed to meet the IEEE 802.11n standard, backwards compatible to the 802.11abg standards, and is part of the Wi-Fi Alliance 11n certification test bed. Our highest performance XSPAN solution, XSPAN with Signal Sustain Technology-3, or SST3, uses a unique triple-radio, 3-stream design on a single chip. Our XSPAN solutions deliver up to 450 megabits per second, or Mbps, physical data rate in each radio band. |
| • | Align™ solutions are based on the IEEE 802.11n standard for 1-stream implementations, and deliver up to 150 Mbps physical data rate. Align solutions are backwards compatible to the 802.11bg standards, and compatible to single and multi-stream implementations of the 802.11n standard. Client devices based on Align can obtain Wi-Fi Alliance certification for 11n, and router products based on Align can obtain certification for 802.11g. |
| • | Power Management Technologies employ a variety of power-saving protocols and techniques as well as advanced circuit designs, enabling our solutions to use significantly less power in transmit, receive and sleep operating modes, and thus deliver the benefit of longer battery life for client devices. Our products are designed to comply with the major national standards for low-power operation, such as the European Code of Conduct, or CoC, on Energy Efficiency and the European Union’s Energy-using Products, or EuP, Directive for low-power, green energy operation. |
We believe that WLAN and other wireless products will continue to improve by transitioning from multi-chip systems to more highly integrated systems providing radio, baseband and MAC functionality on a single chip such as those we offer. We have released a wide variety of single and multi-chip WLAN solutions supporting the 802.11g, 802.11a/g and 802.11n standards, and expect to continue to integrate additional functionality in these solutions. In addition to our single-chip integration, we focus our design efforts on integrating more functions onto the chip to reduce total system cost and end-product design complexity.
Radio-on-Chip for Mobile, or ROCm® WLAN Solutions
In 2005, we introduced our single-chip, CMOS-based ROCm family of WLAN solutions developed to meet the growing demand for WLAN in mobile devices such as smartphones and mobile consumer products including mobile video game devices, digital cameras and PMPs. Since then, we have introduced two generations of 802.11g and 802.11a/g, and our first generation of 802.11n mobile WLAN single-chip solutions. These products feature very low-power consumption and small form factors, making them ideal for portable consumer electronics products.
To enable the success of our ROCm WLAN solutions, we have developed a number of key strategic alliances including: a joint reference program for dual-mode WLAN/cellular handsets with QUALCOMM Incorporated’s code divisional multiple access/wideband code divisional multiple access, or CDMA/WCDMA, solutions; pre-qualification and pre-testing of our WLAN software drivers for Microsoft® Windows® Mobile; a joint reference platform for smartphones with applications processors from NVIDIA, Incorporated; and joint reference platforms for PNDs with Samsung Electronics, Semiconductor Division, System LSI’s applications processor technology and our GPS. We also partner with major module manufacturers such as Samsung Electro-Mechanics Co. Ltd. and Murata Manufacturing Co., Ltd.
7
Table of Contents
Our ROCm solutions achieve coexistence between WLAN and Bluetooth by employing our Universal Wireless Cooperation™, a suite of advanced techniques consisting of channel protection and timesharing mechanisms, 3G coexistence optimizations and our proprietary WLAN/Bluetooth Coexistence Agent™, consisting of patented algorithms that allow switching WLAN and Bluetooth transmissions accordingly, and algorithms that allow synchronization for both uplink and downlink traffic designed to avoid Bluetooth traffic.
Fast and Gigabit Ethernet ETHOS™ Solutions
Through our acquisition of Attansic in 2006, we entered the Ethernet business and have since shipped over 100 million Ethernet chipsets that we market under our ETHOS brand. Our ETHOS portfolio features single-chip CMOS Fast and Gigabit Ethernet switch, local area network-on-motherboard, or LOM, controller and transceiver solutions. These technologies enable us to offer end-to-end, silicon platforms to our networking and computing customers for both wireless and wired products. Our ETHOS products complement our portfolio of wireless and powerline connectivity solutions for access points, routers and gateways, which typically include Ethernet physical layer, transceivers and switches, our computing portfolio for PC customers’ LOM applications and powerline adapters which incorporate an Ethernet transceiver. These Ethernet products provide connectivity in accordance with the IEEE 802.3u Fast Ethernet or IEEE 802.3ab Gigabit Ethernet standards.
Our Fast and Gigabit Ethernet ETHOS controller solutions provide wired connectivity for desktop and PC platforms. Our family of single-chip controllers integrates our Fast and Gigabit Ethernet physical integrated circuit, or PHY, and MAC, with a comprehensive software suite. These cost-effective solutions are targeted to client network interface cards, or NICs, and LOM applications.
Our Fast and Gigabit Ethernet ETHOS transceivers are designed for use in PCs, access points, routers, broadband gateways, wired switches and powerline adapters. These transceivers utilize sophisticated signal processing algorithms and advanced power management features to achieve high performance and low power consumption. Our solutions comply with the IEEE Ethernet standards for performance and our newest Gigabit controller complies with the IEEE 802.3az, an Energy Efficient Ethernet draft specification.
Our Fast and Gigabit Ethernet switch products are based on single-chip configurations and are primarily sold in conjunction with our WLAN chipsets as part of reference designs for routers, access points and broadband gateways. Additionally, in 2008, we began integrating our Ethernet switches into WiSoC solutions.
ROCm Bluetooth Solutions
In 2007, we introduced our Bluetooth products and today we serve our PC customers with these single-chip CMOS Bluetooth solutions. Our solutions leverage our expertise in RF design and integration to deliver highly compact designs that meet the footprint, power and cost requirements for PCs. Our products, which are based on the most recently ratified Bluetooth 2.1 + Enhanced Data Rate, or EDR, standard, provide optimized coexistence and performance with WLAN and 3G technologies. We deliver Bluetooth solutions for PCs and also offer a two-chip combination solution featuring our Bluetooth and Align single stream WLAN products.
The market for Bluetooth 2.1 + EDR has historically been limited to low throughput uses such as connecting handsets to headsets and computing platforms to peripheral devices. In 2009, the Bluetooth Special Interest Group, or SIG, ratified the new Bluetooth 3.0 standard and we later launched our Bluetooth 3.0 solution for PCs. Within the new performance grade for Bluetooth is the High Speed, or HS, version that employs the 802.11 Physical Application Layer, or PAL. Bluetooth 3.0 + HS utilizes Bluetooth pairing profiles for secure and simple device-to-device connections and the 802.11 PAL to achieve significantly higher throughput for data and content transfers. We believe that the Bluetooth 3.0 + HS standard will expand the market for PC Bluetooth solutions by enabling a broader range of applications that require the increased throughput Bluetooth 3.0 + HS provides.
GPS Solutions featuring FYX™ Location Technology
In 2007, we introduced our family of GPS location aware solutions. Our FYX™ GPS portfolio features single-chip receivers and a software suite enable us to offer complete GPS system solutions for signal acquisition, tracking, data extraction and GPS navigation. Our GPS product portfolio, which targets high-volume, embedded GPS applications including PNDs, PCs, PMPs, portable gaming devices and smartphones, complements our WLAN, Bluetooth and Ethernet offerings. Our products feature assisted GPS capabilities to enhance location fix times and navigational accuracy in challenging environments where views to satellites are obstructed or unavailable.
Our FYX Location Core features a patented dual-engine design, with one engine optimized for fast searching while the other provides for accurate navigation tracking. This approach is designed to provide a more precise tracking capability as well as low power utilization enabling quicker location identification while consuming less power.
8
Table of Contents
AMP™ Powerline Solutions
Our AMP Powerline technology solutions are used by customers to enable high-speed video and data networking over the home’s existing electrical wiring and accessed through the common electrical wall outlets located throughout the home. In the digital home, our ICs are used both in powerline-to-Ethernet adapters, which can be used to connect products with Ethernet ports, and in embedded products, where our ICs are incorporated directly into the product. Most of our powerline IC products are used in powerline-to-Ethernet wall adapters and networking devices to provide connectivity between broadband modems or routers and PCs, set-top boxes, gaming consoles and other electronic products.
We also sell our PLC ICs for use in electric utility and other commercial markets. In the utility market, our ICs enable various smart grid applications, which help utilities and consumers monitor and manage in-home electricity consumption. In the commercial market, our ICs enable the distribution of broadband services over existing electrical wiring and coaxial cable to individual units within apartment buildings and other multiple dwelling units.
Our solutions are currently delivered in 2-chip configurations, consisting of a MAC/PHY transceiver chip and an analog front end, or AFE, line driver chip. These products support the HomePlug AV standard and the recently released IEEE 1901 draft standard for wireline communications.
Industry Standards
We actively participate in the on-going development of industry standards that enable enhanced product performance and end-product interoperability between multiple vendors. We believe that industry-wide standards are important in order to simplify and enhance the consumer connectivity experience and the presence of agreed upon standards will increase the total available market for our products. Some of the key standards that our solutions support are:
| • | WLAN – IEEE 802.11 and Wi-Fi CERTIFIED; |
| • | Bluetooth – Bluetooth 2.1, 3.0, 3.0 + HS |
| • | Ethernet – IEEE 802.3, the European CoC on Energy Efficiency and the European Union’s EuP Directive for low power, green energy operation; |
| • | GPS – U.S. NAVSTAR GPS, Russia’s GLONASS; Third Generation Partnership Project, or 3GPP, Secure User Plane Location, or SUPL; and |
| • | PLC – HomePlug AV, IEEE 1901, the European CoC on Energy Efficiency and the European Union’s EuP Directive. |
Customers
Our products are sold to customers in three target markets as outlined below:
| Products Incorporating Our Solutions
|
Atheros Products
| |||
| Networking 43% of 2009 Revenue |
Wireless access points and routers Broadband gateways (DSL, Cable and Passive Optical Networking) Ethernet switches Powerline adapters Cardbus and USB adapters |
Wireless LAN RoC, Mac+ Baseband, single chip and WiSoCs Network processor chips Ethernet transceivers Ethernet switches Powerline SoCs
| ||
| Personal Computing 37% of 2009 Revenue |
Notebook computers Netbook computers Desktop computers Smartbook computers Cardbus cards LAN on motherboard applications
|
Wireless LAN RoC, Mac+ Baseband and single chips Ethernet controllers Ethernet transceivers and controllers Bluetooth SoCs GPS SoCs
| ||
| Consumer 20% of 2009 Revenue |
Mobile gaming devices Cellular handsets and smartphones Media adapters Personal Navigation Devices Printers Televisions Blu-Ray players VoIP phones
|
ROCm Wireless LAN products Ethernet transceivers Bluetooth SoCs GPS SoCs |
9
Table of Contents
We sell our products directly to original equipment manufacturers, or OEMs, who include our chipsets in their products, and to original design manufacturers, or ODMs, who in turn include our chipsets in products they supply to OEMs. For direct sales to OEMs, the OEM incorporates our wireless and wired networking system solutions directly into their products, and the OEM is the licensee and the end-user of the technology. A large portion of our sales are made directly to ODMs, as many OEMs choose to specify an ODM to integrate our technology into a module, which is then delivered to the OEM customer. For OEMs who use an ODM as an intermediary, our shipments and revenue are directly with the ODM. Regardless of the sales channel, we maintain close relationships with the target OEMs, selling and marketing to them directly, and the initial technology design win is generally awarded by the OEM. We also have ongoing contact with the OEM for forecasting and technology update purposes.
In 2009, 2008 and 2007, Hon Hai Precision Industry Co. Ltd. accounted for 17%, 19% and 25% of our net revenue, respectively. In 2009, Nintendo Co., Ltd. accounted for 13% of our net revenue.
While we primarily sell directly to ODMs, the ODM generally identifies on its purchase order the OEM for whom they are purchasing our product. Based on the sell-through information provided to us by the ODMs, the following companies or their subsidiaries are among those that have incorporated our products directly or through ODMs during the year ended December 31, 2009:
2Wire, Inc.
Acer, Inc.
Apple, Inc.
Aruba Wireless Networks, Inc.
AsusTeK Computer, Inc.
AVM GmbH
Belkin Corp.
Buffalo, Inc.
Dell Inc.
Cisco Systems, Inc. (including the Linksys Group, Inc.)
D-Link Systems, Inc.
Fujitsu Ltd.
Hewlett-Packard Co.
Intel Corporation
Microsoft Corporation
MikroTik Ltd.
Murata Manufacturing Co., Ltd.
NEC Electronics Corp.
NETGEAR, Inc.
Nintendo Co., Ltd.
Ruckus Wireless, Inc.
Sagem Communications
Samsung Group
Sony Corporation
Toshiba Technology Corp.
TP-Link Technologies Co., Ltd.
Ubiquiti Networks, Inc.
Sales and Marketing
We have direct sales and support staff strategically located near our major customers in the U.S., Asia and Europe. Generally, each salesperson has specific end-user market expertise in the market or markets on which they focus.
We also have field application engineers, or FAEs, and applications engineers, or AEs, who provide technical support and assistance to existing and potential customers in designing, testing and qualifying systems that incorporate our products. Our FAE and AE personnel are organized by end-user markets as well as core competencies in hardware, software and RF necessary to support our customers.
To supplement our direct sales, we have and may use independent sales representatives and distributors with locations throughout the world. We select these independent representatives and distributors based on their ability to provide effective field sales and technical support for our products. With our independent sales representatives, our customers place orders directly with us
10
Table of Contents
rather than with the representatives and our representatives do not generally maintain product inventory. With our distributors, our customers generally place orders directly with the distributor and our distributors generally maintain product inventory.
We also work with third-party design centers that provide expertise in RF design, board layout, operating system and driver development, and industrial design and prototyping to customize our software or hardware for smaller customers’ requirements. These third-party design centers typically provide their services on a contract engineering basis and enable rapid time-to-market in their areas of expertise.
In addition to providing chipsets, we also license software in source code form to some of our customers. Since the licensing of software in source code requires that we enter into a technology license directly with end customers, we usually maintain a direct relationship with the end customer whether they have purchased chipsets directly from us or through one of our ODMs or independent representatives.
Our marketing groups focus on our product strategy, product development road maps, new product introduction process, demand assessment, competitive analysis, customer application support, customer program management, brand development and management, standards management and corporate communications. These groups also ensure that product development activities, product launches, channel marketing program activities, and on-going demand and supply planning occur in a well-managed, timely basis in coordination with our development, operations, and sales groups, as well as our ODMs, OEMs and representatives.
Our sales are made primarily pursuant to standard purchase orders. Because industry practice allows customers to reschedule or cancel orders on relatively short notice, we believe that backlog is not a good indicator of our future sales.
Substantially all of our sales are to customers outside the U.S. and Canada. Sales to customers in Asia, which includes China, Hong Kong, India, Japan, Korea, Malaysia, the Philippines, Singapore and Taiwan, accounted for 87% of net revenue in 2009, 90% of net revenue in 2008, and 97% of net revenue in 2007. Our net revenue consisted of sales to customers in the following countries for the periods indicated in the following table:
| Year Ended December 31, | |||||||||
| 2009 | 2008 | 2007 | |||||||
| Taiwan |
36 | % | 41 | % | 49 | % | |||
| China |
21 | 29 | 37 | ||||||
| Japan |
15 | 7 | 3 | ||||||
| Hong Kong |
14 | 10 | 3 | ||||||
| U.S. |
3 | 1 | 1 | ||||||
| Other |
11 | 12 | 7 | ||||||
Regulatory Environment and Industry Standards
Our wireless products and our customers’ products transmit and receive radio signals across both licensed and unlicensed regulated spectrum. To certify our products for use in a broad geographic market, we maintain communication with a variety of government and certification agencies in the U.S. and international markets. As the wireless communications market is particularly influenced by regulations and policy on spectrum allocations and licensing provisions, this direct contact gives us insight into market requirements and appropriate product plans. We have developed and obtained necessary certifications for certain proprietary technologies and algorithms that enable our products to roam between and adapt to various standards and to international regulatory and operational requirements. These technologies are not necessarily exclusive to us, but have been refined by us and are a requirement for many multinational equipment manufacturers.
The rights to use spectrum are subject to changes made by the government entities that allocate and regulate radio spectrum. Changes in U.S. and international spectrum policy may limit our ability to sell or prevent us from selling products, require substantial engineering effort and expense to address and work around any such changes, and substantially and adversely affect the time it takes our customers to bring their products to market and our future revenue. In addition, our products and our customers’ products could be denied the regulatory certifications required to sell these products, or the time and cost required to obtain regulatory certifications could reduce our revenue and profitability.
Our products include encryption technologies that are regulated by the U.S. and foreign governments. We believe we are in compliance with all export and import laws and regulations related to our encryption technologies. However, these laws and regulations may change and limit our ability to continue to export and import our products internationally until we can adapt to these changes.
11
Table of Contents
GPS technology is restricted and its export is controlled by the U.S. government, and the U.S. government may restrict specific uses of GPS technology in some applications for privacy or other reasons. The U.S. government may also block the civilian GPS signal at any time or in hostile areas. In addition, the policies of the U.S. government for the use of GPS without charge may change. The growth of the GPS market could be limited by government regulation or other action. These regulations or actions could interrupt or increase our cost of doing business. We cannot be certain that the U.S. government will remain committed to the operation and maintenance of GPS satellites over a long period. Any of the foregoing factors could affect the willingness of buyers of our products to select GPS-based systems instead of products based on competing technologies. Laws and regulations, as well as policies, may change and limit our ability to grow this market.
Devices containing our PLC products are subject to various U.S. and foreign governmental regulations, including, for example, regulations regarding transmission power, permissible frequencies of operation, electromagnetic interference and electrical wiring. These regulations and the interpretation and enforcement of the regulations may vary from country to country and are subject to change. Changes to current laws and regulations, or the imposition of new laws and regulations, could restrict or eliminate our ability to sell our powerline products in the applicable country, reduce the performance of our powerline products below customer requirements, require us or our customers to redesign products to comply with the new regulatory requirements, or require the use of products already sold into the marketplace to be terminated, which could harm our business. Devices containing our powerline products may also be subject to regulations specifying the maximum amount of electric current that the product may use when in operation, in standby mode or not in use. These provisions, which are intended to promote power conservation, are sometimes referred to as code of conduct regulations. If our PLC products do not allow a product manufacturer to meet applicable code of conduct regulations for a product, if our competitors offer PLC products with lower power consumption, or if we were required to redesign a product to meet new code of conduct or other power consumption requirements, our business could be harmed.
We intend to continue to participate in, support our employees’ participation in, or monitor, as appropriate, the activities of various standards bodies, including the IEEE standards group, the European Telecommunications Standards Institute, the International Telecommunications Union, the WiFi Alliance, WiMax, a nonprofit group formed to create and promote the development of IEEE wireless broadband standard 802.16, Digital Living Networking Alliance, Home Gateway Initiatives, the Peripheral Component Interconnect Special Interest Group, Wireless Gigabit Alliance, the BluetoothTM SIG and the HomePlug Powerline Alliance.
Intellectual Property
Our success will depend in part on our ability to protect our intellectual property. We rely on a portfolio of intellectual property rights, both foreign and domestic, including intellectual property rights in patents, trademarks, copyrights and trade secrets. We also protect our proprietary technologies, processes and other intellectual property through contractual provisions and licenses. Many of our issued patents and pending patent applications relate to algorithms, semiconductor designs, software and systems related to wireless and wired communications. Our patent focus is on innovations which we believe we have achieved in our implementations of industry standards-compliant wireless and wired connectivity solutions.
Patents
As of December 31, 2009, we held 194 issued U.S. patents and 251 pending U.S. patent applications, in addition to international patents and pending patent applications. We continue to pursue actively the filing of additional patent applications in both the U.S. and foreign jurisdictions. Our domestic patents and applications have expiration dates ranging from November 2010 through October 2028.
We may not receive competitive advantages from the rights granted under our patents and other intellectual property rights. Our continued success and future growth is based on execution capability, technical expertise, speed of implementation and process management abilities of our employees and our ability to defend our intellectual property. Our existing and future patents may be circumvented, blocked, licensed to others or challenged as to inventorship, ownership, scope, validity or enforceability. It is possible that publications we may be advised of by third parties in the future could negatively affect the scope or enforceability of either our present or future patents. Furthermore, our pending and future patent applications may not issue with the scope of claims sought by us, if at all, or the scope of claims we are seeking may not be sufficiently broad to protect our proprietary technologies. Others may develop technologies that are similar or superior to our proprietary technologies, duplicate our proprietary technologies or design around the patents owned or licensed by us. If our products, patents or patent applications are found to conflict with any patents held by third parties, we could be prevented from selling our products, our patents may be declared invalid or our patent applications may not result in issued patents. In addition, in foreign countries, we may not receive effective patent protection. We cannot be sure that steps we take to protect our proprietary technologies will prevent misappropriation of our technologies.
Intellectual Property Litigation
The wireless communications and networking industries are characterized by frequent litigation and other vigorous protection and pursuit of intellectual property rights or positions. There are also numerous patents in our industry and new patents are being
12
Table of Contents
issued at a rapid rate. This often results in significant and often protracted and expensive litigation. Questions of infringement involve highly technical and subjective analyses. Litigation may be necessary to enforce any patents we may be granted and other intellectual property rights, to protect our trade secrets, to determine the validity and scope of the proprietary rights of others, or to defend against claims of infringement or invalidity made against our products or our customers’ products, and we may not prevail in any current or future litigation. We and our customers have received and may continue to receive, written notices and license offers from research institutions, intellectual property holding firms, our competitors and others claiming to have patent and other intellectual property rights that apply to the IEEE family of WLAN standards, Ethernet, GPS, Bluetooth and Powerline technologies as well as other intellectual property relevant to our chips, software, and system solutions. These notices or offers have been made directly to us and to our U.S. and foreign customers. We have responded directly or indirectly through our customers, to these notices, and continue to correspond regarding the offers with some of the parties that have sent the notices. In addition, we and our customers may be and have been sued in the U.S. for allegedly infringing patents related to WLAN, GPS, Bluetooth, Ethernet and Powerline technology. We believe that the disputed rights and rights offered are either already licensed to us or our products do not infringe any valid claim to the issued patents identified to date. However, we cannot assure that adverse results will not occur. We also cannot assure that any of these or other third-parties will not pursue litigation or assert their patent and other intellectual property rights against us in the future. We have certain indemnification obligations to customers and strategic partners with respect to infringement of third-party patents and intellectual property rights by our products. We cannot assure that our potential obligations to indemnify such customers will not harm us, our business or our financial condition and results of operations. We have intervened and may intervene in litigation on behalf of certain of our customers. The results of any litigation are inherently uncertain. Any successful infringement claim or litigation against us or our customers could have a significant adverse impact on our business.
If it is necessary or desirable, we may seek licenses under third-party patents or other intellectual property rights. However, we cannot be sure that third parties will offer licenses to us or that we will find and secure acceptable terms for any offered licenses. If we or our customers fail to obtain a license from a third party for proprietary technologies that we use, we could incur substantial liabilities, or suspend sales or use of our products or our use of processes requiring the technologies. Whether or not any litigation is determined in our favor or settled, it could cause us to incur significant expenses, harm our sales of the challenged technologies or products and divert the attention and efforts of our technical and management personnel, whether or not a court decides the litigation in our favor. Adverse determinations in litigation could result in the loss or impairment of our proprietary rights, subject us to significant liabilities and money damages, require us to seek licenses from third parties, cause us to spend significant resources and revenues to design around or develop non-infringing technology, or prevent us from licensing our technology or selling our products, any of which could harm our business.
For additional information regarding our material legal proceedings, please see Part I, Item 3 of this Form 10-K.
Copyrights and Trademarks
We claim copyright and trademark protection for proprietary documentation and a variety of branding marks. We also pursue foreign copyrights and trademarks where applicable and necessary. The branding marks are sublicensed to our customers and used by them to identify and promote their products’ capabilities. As of December 31, 2009, we held 24 registered U.S. trademarks.
Licenses
We also rely on third-party licensors for certain technologies embedded in our semiconductor, hardware and software designs. These are typically non-exclusive contracts for general capabilities provided under royalty-accruing or paid-up licenses. These licenses are generally perpetual or automatically renewed if we continue to pay any royalty that may be due. We have entered into a number of licensing arrangements pursuant to which we license third-party technologies. We do not believe our business is dependent to any significant degree on any individual third-party license.
We generally enter into confidentiality agreements with our employees, vendors, industry partners and customers, as well as generally control access to and distribution of our documentation and other proprietary information. Despite this protection, unauthorized parties may copy aspects of our current or future products or obtain and use information that we regard as proprietary.
Certain software compatible with our chipsets has been made available to others through open source licensing agreements. We believe that this has been a source of benefit and differentiation as it expands the market for our products and enables these products to benefit from the design efforts of the open source community. This practice does provide to others some level of insight into the design and the features of our products, although we maintain and retain proprietary rights to the substantial portion of our capabilities.
Research and Development
We engage in substantial research and development to develop new products and integrate additional capabilities in product designs. We conduct research into digital and analog semiconductor design, hardware reference board design, software reference code
13
Table of Contents
development, systems integration and manufacturing process flow development and perform test emulation, digital design verification and application software development at our corporate headquarters in Santa Clara, California, and at our research and development facilities in California, Florida, Canada, China, Finland, India and Taiwan. We use a number of proprietary design tools and processes that enable us to deliver high-performance wireless capabilities using low-cost manufacturing facilities. We employ a team of engineers with extensive experience in mixed signal design, systems and communications architecture, CMOS technology and software development. Our research and development expense was $130.6 million in 2009, $121.6 million in 2008 and $100.9 million in 2007.
Manufacturing
We design and develop our proprietary designs and provide them to third-party foundries, contract manufacturers, ODMs, assembly and test companies and other licensees and contractors to produce silicon wafers and semiconductors. We produce a variety of digital, analog and mixed-signal chip designs generally using standard digital CMOS production facilities. The use of this process enables us to produce cost-effective products, and we have proprietary rights to the particular design methodologies that we use to maintain high-performance levels on generic processes. By utilizing standard digital CMOS processes, we are able to work with a large number of independent foundries that provide us operational and cost efficiencies. By subcontracting our manufacturing requirements, we are able to focus our resources on design and test applications where we believe we have greater competitive advantages. This strategy also eliminates the high cost of owning and operating semiconductor wafer fabrication facilities.
We currently have in production CMOS chips ranging from 0.5 micron to 65 nanometer process geometries at a variety of foundries. We depend on a range of foundry contractors to manufacture substantially all of our products. Our primary silicon foundries for wafer production are GLOBALFOUNDRIES Inc., or GLOBALFOUNDRIES, in Singapore, Semiconductor Manufacturing International Corporation, or SMIC, in China, Silterra Malaysia Sdn. Bhd., or Silterra, in Malaysia, Taiwan Semiconductor Manufacturing Corporation, or TSMC, in Taiwan, Tower Semiconductor Ltd. in Israel and United Microelectronics Corporation, or UMC, in Taiwan. Limitation of any of our independent foundry subcontractors to provide the necessary capacity or output for our products could result in significant production delays and could materially and adversely affect our business, financial condition and results of operations. While we currently believe we have adequate capacity to support our current sales levels, we continue to work with our existing foundries to obtain more production capacity, and we intend to qualify new foundries to provide additional production capacity. It is possible that from time to time adequate foundry capacity may not be available on acceptable terms, if at all. In the event a foundry experiences financial difficulties, or if a foundry suffers any damage to or destruction of its facilities, or in the event of any other disruption of foundry capacity, we may not be able to qualify alternative manufacturing sources for existing or new products in a timely manner.
Our wafer probe testing is conducted by independent wafer probe test subcontractors. Following completion of the wafer probe tests, the die are assembled into packages and the finished products are tested by one of our key test and assembly subcontractors including, but not limited to Advanced Semiconductor Engineering, Inc., or ASE, in Taiwan, Amkor Technology, Inc. in China, Taiwan and Korea, Orient Semiconductor Electronics, Ltd., or OSE, in Taiwan, Signetics Corporation in Korea, Siliconware Precision Industries Co., Ltd. in China and Taiwan and United Test and Assembly Center Ltd. in Singapore. We store and distribute our finished goods inventory from contracted warehouses in Hong Kong and Singapore. While we have not experienced material disruptions in supply from assembly subcontractors to date, we and others in our industry have experienced shortages in the supply of packaging materials from time to time, and we could experience shortages or assembly problems in the future. The availability of assembly and testing services from these subcontractors could be materially and adversely affected in the event a subcontractor experiences financial difficulties, or if a subcontractor suffers any damage to or destruction of its facilities, or in the event of any other disruption of assembly and testing capacity.
We also maintain pre-production hardware and software test facilities at our corporate headquarters and at our research and development facilities in California, Florida, Canada, China, Finland, India and Taiwan. This enables us to operate certain test processes on demand, so as to reduce the time-to-market of our designs and improve their reliability.
Competition
The communications semiconductor markets and the overall semiconductor industry are intensely competitive with a variety of large and small companies providing semiconductors, hardware and software designs. We believe that we compete favorably in these markets with respect to the following factors:
| • | product performance; |
| • | feature set and quality, including network throughput, product range, power efficiency, security features, reliability and consistency; |
| • | level of integration; |
| • | time-to-market; |
14
Table of Contents
| • | price; |
| • | ability to respond quickly to customer needs; |
| • | customer support and application support; |
| • | ability to comply with, and influence, industry standards and international regulatory requirements; |
| • | intellectual property; and |
| • | reputation. |
We compete with a number of large U.S. and international semiconductor suppliers. Our primary competitors in our communications and connectivity semiconductor markets include Broadcom Corporation, CSR plc, which acquired SiRF Technology Holdings, Inc. in 2009, Intel Corporation, Marvell Technology Group Ltd., Ralink Technology Corporation, Realtek Semiconductor Corp. and Texas Instruments, Incorporated. This competition has resulted and will continue to result in declining average selling prices for our products. In all of our target markets, we also may face competition from newly established competitors, suppliers of products based on new or emerging technologies, and customers that choose to develop their own silicon solutions. We also expect to encounter further consolidation in the markets in which we compete.
Many of our current and potential competitors have longer operating histories, significantly greater resources and name recognition, and a larger base of customers than we do. Many of our competitors also have significant influence in the semiconductor industry. We may not be able to compete effectively against current and potential competitors, especially those with significantly greater resources and market leverage. As a result, these competitors may respond more quickly than we do to new or emerging technologies or changes in customer requirements. In addition, some of our larger competitors may be able to provide greater incentives to customers through rebates and marketing development funds and similar programs. Furthermore, some of our competitors with multiple product lines may integrate wireless functionality into products that we do not sell or bundle their products to offer a broader product portfolio, which may make it difficult for us to gain or maintain market share. Our competitors may be able to adopt more aggressive pricing policies and devote greater resources to the development, promotion and sale of their products than we can. In addition, new competitors, including lower cost Asian semiconductor companies or alliances among existing competitors, could emerge.
Some of our customers and partners are also large, established semiconductor suppliers. Our sales to and support of such customers may enable them to become a source of competition to us, despite our efforts to protect our intellectual property rights. Competition could increase pressure on us to lower our prices and lower our margins. If we do not compete successfully, we will be unable to gain or retain market share.
Employees
As of December 31, 2009, we employed 1,302 full-time employees, including 897 in research and development and operations, 304 in sales and marketing and 101 in general and administration. We have never had a work stoppage and none of our employees are represented by a labor organization or under any collective bargaining arrangements. We consider our employee relations to be good.
| Item 1A. | Risk Factors |
Fluctuations in our operating results on a quarterly and annual basis could cause the market price of our common stock to decline.
Our revenue and operating results have fluctuated significantly from period to period in the past and are likely to do so in the future. These fluctuations could cause the market price of our common stock to decline. As a result, you should not rely on period to period comparisons of our operating results as an indication of our future performance. In future periods, our revenue and results of operations may be below the expectations of analysts and investors, which would likely cause the market price of our common stock to decline. Factors that are likely to cause our revenue and operating results to fluctuate include those discussed in the risk factors below.
The current global recession and the downturn in the semiconductor industry could adversely affect our operating results and stock price in a material manner.
The semiconductor industry in which we operate is highly cyclical and has, from time to time, experienced significant downturns, often connected with, or in anticipation of, maturing product cycles of both semiconductor companies’ and their customers’ products and declines in general economic conditions. The industry experienced a significant downturn in the fourth quarter of 2008 and during 2009 in conjunction with the global recession. These downturns are frequently characterized by decreases in product demand, excess customer inventories, and accelerated erosion of prices. These factors could cause substantial fluctuations
15
Table of Contents
in our revenue and results of operations, as evidenced by the 29% and 11% sequential decreases in our revenue during the fourth quarter of 2008 and the first quarter of 2009, respectively. In addition, during these downturns some competitors may become more aggressive in their pricing practices, which would adversely impact our gross profits. Any downturns in the semiconductor industry may be severe and prolonged, and any failure of the industry or wired and wireless communications markets to fully recover from downturns could negatively impact our revenue, business, financial condition and results of operations. The semiconductor industry also periodically experiences increased demand and production capacity constraints, which may affect our ability to ship sufficient products to meet our customers’ purchase requests. Accordingly, our operating results may vary significantly as a result of the general conditions in the semiconductor industry, which could cause large fluctuations in our stock price.
General worldwide economic conditions significantly deteriorated in the second half of 2008 due to many factors including credit conditions and liquidity concerns resulting from the financial crisis affecting the banking system and financial markets, slower economic activity, decreased consumer confidence, reduced corporate profits and capital spending and adverse business conditions. Although conditions in the semiconductor market in which we participate have recently improved, if general global economic conditions do not improve or deteriorate further, it could adversely affect the semiconductor market and be extremely difficult for us, our customers and our vendors to accurately forecast and plan future business activities, and it could cause U.S. and foreign businesses to slow spending on our products and services, which would delay and lengthen sales cycles. Furthermore, during challenging economic times, our customers may face issues gaining timely access to sufficient credit, which could impair their ability to make timely payments. If that were to occur, we may be required to increase our allowance for doubtful accounts and our accounts receivable days sales outstanding would be negatively impacted. The current economic downturn and any future downturn may reduce our revenue or our percentage of revenue growth on a quarter-to-quarter basis and result in our having excess inventory. We cannot predict the timing, strength or duration of any economic slowdown or subsequent economic recovery, either worldwide, or in the semiconductor industry or the wired and wireless communications markets. If the economy does not improve from its current condition or if it continues to deteriorate, or if the semiconductor market deteriorates or does not continue to improve, our customers or potential customers could reduce or delay their purchases of our products, which would adversely impact our revenues and our ability to manage inventory levels, collect customer receivables and, ultimately, our profitability. In addition, we may record additional charges related to the restructuring of our business and the impairment of our goodwill and other long-lived assets, and our business, financial condition and results of operations may be materially and adversely affected. Additionally, the combination of our lengthy sales cycle coupled with challenging macroeconomic conditions could have a negative impact on our results of operations.
If demand for our chipsets declines or does not grow, we will be unable to increase or sustain our revenue and our business will be severely harmed.
We have derived substantially all of our revenue from the sale of chipsets for wireless applications, and we expect our chipsets for WLAN applications and, to a lesser extent, our Bluetooth, Ethernet, GPS and PLC solutions, to account for substantially all of our revenue for the foreseeable future. Our success will depend in large part on the growth of these markets and our ability to gain marketshare. If these markets do not achieve the growth we expect or we do not increase our marketshare, the growth and success of our business could be limited. In addition, if we are unable to develop new products in a timely manner or demand for our chipsets declines as a result of competition or technological changes, it would have a material negative impact on our business, operating results and financial position and our competitive position.
Since we have limited visibility as to the volume of sales of our products by our customers and inventory levels of our products held by our customers, our ability to forecast accurately future demand for and sales of our products is limited.
We sell our chipsets to OEMs who integrate our chipsets into their products or to ODMs who include our chipsets in the products they supply to OEMs. We have limited visibility as to the volume of our products that our OEM and ODM customers are selling to their customers or carrying in their inventory. If our customers have excess inventory or experience a slowing of products sold through to their end customers, it would likely result in a slowdown in orders from our customers and adversely impact our future sales and inventory.
Although we achieved profitability in the last three fiscal years, we may not sustain or increase profitability in the future.
During 2009, we incurred $241.4 million in operating expenses and generated net income of $46.4 million. During 2008, we incurred $210.1 million in operating expenses and generated net income of $18.9 million. During 2007, we incurred $172.4 million in operating expenses and generated net income of $40.0 million. We did, however, incur a net loss in the first and second quarters of 2009 and the fourth quarter of 2008 and may incur losses in the future. To sustain profitability, we will need to maintain or increase our revenue while maintaining reasonable cost and expense levels, or to decrease expense levels in the event of declining revenues. In addition, since we expect average selling prices of our products to continue to decrease in the future, we will need to continue to reduce the average unit costs of our products and increase sales volumes in our existing markets as well as successfully introduce additional products for new and existing markets in order to maintain profitability. We expect to increase our expenses in absolute dollars in the near future from current expense levels to support increased research and development efforts related to new and existing product development and sales and marketing efforts. Because many of our expenses are fixed in the short term, or
16
Table of Contents
are incurred in advance of anticipated sales, we may not be able to decrease our expenses in a timely manner to offset any shortfall of sales. We may not be able to sustain or increase profitability on a quarterly or an annual basis. If we do not sustain or increase profitability or otherwise meet the expectations of securities analysts or investors, the market price of our common stock will likely decline. In addition, if we do not sustain or increase profitability, we may be unable to invest in the necessary level of research and development to remain competitive.
Our products typically have lengthy sales cycles. A customer may decide to cancel or change its product plans, which could cause us to lose anticipated sales. In addition, our average product life cycles tend to be short and, as a result, we may hold excess or obsolete inventory that could adversely affect our operating results.
After we have developed and delivered a product to a customer, the customer will usually evaluate our product prior to designing its own equipment to incorporate our product. Our customers may need several months to test, evaluate and choose whether to adopt our product, and to begin volume production of equipment that incorporates our product. Due to these lengthy sales cycles, we may experience significant delays from the time we increase our operating expenses and make investments in inventory until the time that we generate revenue from these products. It is possible that we may never generate any revenue from these products after incurring such expenditures. Even if a customer selects our solution to incorporate into its product, we have no assurances that the customer will ultimately market and sell its product or that such efforts by our customer will be successful. The delays inherent in our lengthy sales cycle also increase the risk that a customer will decide to cancel or curtail, reduce or delay its product plans. Such a cancellation or change in plans by a customer could cause us to lose sales that we had anticipated.
While our sales cycles can be long, our average product life cycles tend to be short as a result of the environment of rapidly changing technology and rapid introduction of next generation products in which we operate. As a result, the resources devoted to product sales and marketing may not generate material revenue for us, and from time to time, we may need to write off excess and obsolete inventory, which could reduce our gross margins and adversely affect our operating performance. If we incur significant marketing expenses and investments in inventory in the future that we are not able to recover, and we are not able to compensate for those expenses, our operating results could be adversely affected. In addition, if we sell our products at reduced prices in anticipation of cost reductions but still hold higher cost products in inventory, our operating results would be harmed.
The average selling prices of products in our markets have historically decreased rapidly and will likely do so in the future, which could harm our revenue and gross profits.
The products we develop and sell are used for high volume applications and many of them are subject to rapid declines in average selling prices over the life of the products. We have historically decreased the average selling prices of many of our products in order to meet market demand, and we expect that we will continue to reduce prices in the future. Reductions in our average selling prices to one customer could impact our average selling prices to all customers. A decline in average selling prices could harm our gross margins. Historically, we have generally been able to substantially offset reductions in our average selling prices with decreases in our product costs and increases in our unit volumes. Our financial results will suffer if we are unable to offset any future reductions in our average selling prices by increasing our unit volumes, reducing our costs or developing new or enhanced products on a timely basis with higher selling prices or gross profit. While gross profit may decline as a result of reductions in average selling prices, we may continue to incur research and development costs at higher or existing levels to develop future products. This continued spending would have an adverse impact on our immediate operating results if our revenue does not continue to grow or our gross margins decline.
Changes to the mix of products we sell may have a significant impact on our financial results.
We sell many products with differing functionality, prices and costs. The mix of our products sold to customers in any particular period may affect the average selling price and average cost of our products, which could substantially impact our revenue and gross margins. Our gross margin may vary from quarter-to-quarter for a number of reasons, including market conditions, customer demand, changes in our customer base, product mix and our sales volume, average selling price, and cost for each product sold. To the extent that our sales mix results in a decline in our gross margins, our ability to recover our fixed costs and investments associated with a particular product and our business, results of operations and financial condition could be materially adversely affected.
We may not be able to compete effectively and increase or maintain revenue and market share.
We may not be able to compete successfully against current or potential competitors. If we do not compete successfully, our market share and revenue may decline. Within each of our markets, we compete with large semiconductor manufacturers and designers and start-up integrated circuit companies. Some of our competitors are also our customers and partners. Many of our current and potential competitors have longer operating histories, significantly greater financial, manufacturing, technical, marketing, sales and other resources than we do. This may allow them to respond more quickly than us to new or emerging technologies or changes in customer requirements. In addition, these competitors may have greater credibility with our existing and potential customers. Some of our larger competitors may be able to provide greater incentives to customers through rebates and marketing development funds
17
Table of Contents
and similar programs, and some of our competitors with multiple product lines may bundle their products to offer a broader product portfolio or integrate wireless functionality into other products that we do not sell, which may make it difficult for us to gain or maintain market share. In addition, as a result of our recent acquisition of Intellon, we have entered a new market in which we have limited familiarity.
We will continue to expend substantial resources developing products for new applications or markets and may never achieve the sales volume that we anticipate for these products, which may limit our future growth and harm our results of operations.
We have entered a variety of new wireless and wired communications markets that are outside of our traditional WLAN markets. Through the acquisition of Intellon in 2009 and Attansic in 2006, and the purchase of assets and certain liabilities of u-Nav in 2007, we now offer our customers Powerline, Ethernet and GPS products. In addition, we have internally developed Bluetooth solutions that we actively sell to our customers. Although we plan to continue to diversify our revenue base outside of our WLAN market, the vast majority of our historical revenue has come from the sale of our WLAN products. Our future success will depend in part upon our ability to offer products outside of the WLAN market, and we face a number of risks in connection with these products, including those described in other risk factors in this report. We have in the past, and will likely in the future, expend substantial resources in developing new and additional products for new applications and markets. We may experience unforeseen difficulties and delays in developing these products and defects upon volume production and broad deployment. In addition, we will have limited experience in these new markets, and we may be unsuccessful in marketing and selling any products we develop for these or other new markets. The markets we choose to enter will likely be highly competitive and many of our competitors will have substantially more experience in these markets. Our success will depend on the growth of the markets we enter, the competitiveness of our products and our ability to increase our market share in these markets. If we choose to enter markets that do not achieve or sustain the growth we anticipate, or if our products are not competitive, we may not achieve volume sales, which may limit our future growth and would harm our results of operations.
If we fail to appropriately scale our operations in response to changes in demand for our existing products or for new products, our business could be materially and adversely affected.
We have significantly grown and expanded our operations in a short period of time, and to achieve our business objectives, we expect to continue to grow. Through internal growth and the acquisition of ZyDAS, Attansic, u-Nav and Intellon, we have significantly increased the scope of our operations and expanded our workforce, from 260 full-time employees as of December 31, 2004, to 1,302 employees as of December 31, 2009. Although we slowed the expansion of our workforce during 2009 in connection with the global economic downturn, we anticipate that we will in the future further expand our workforce through internal growth and possible acquisitions. Nonetheless, we may not be able to expand our workforce and operations in a sufficiently timely manner to respond effectively to changes in demand for our current and future products and services. In that event, we may be unable to meet competitive challenges or exploit potential market opportunities, and our current or future business could be materially and adversely affected. Conversely, if we expand our operations and workforce too rapidly in anticipation of increased demand for our products, and such demand does not materialize at the pace at which we expect, the rate of increase in our operating expenses may exceed the rate of increase in our revenue, which would adversely affect our operating results. In addition, if our revenues decrease and we are unable to reduce our operating expenses at a rate at least as rapid as the rate of the decrease in revenues, our operating results would be adversely affected.
Our past growth has placed, and any future growth is expected to continue to place, a significant strain on our management personnel, systems and resources. To implement our current business and product plans, we will need to continue to expand, train, manage and motivate our workforce. All of these endeavors will require substantial management effort. In 2007 we began implementing an enterprise resource planning system and are in the process of implementing additional modules to help us improve our management, operational and planning processes, and we anticipate that we will also need to continue to implement a variety of new and upgraded operational and financial systems, as well as additional procedures and other internal management systems. These processes can be time consuming and expensive, increase management responsibilities, and divert management attention.
In the past few years, we have entered into leases for new or additional office space in almost all of our worldwide locations, including California, Central Florida, Canada, China, Finland, Germany, India, Japan, Korea and Taiwan. We anticipate the need to lease additional office space in the future to accommodate our growth and we may also be required to relocate our employees from time to time. Our leases for our headquarters and research and development facilities in Northern California expire in July 2010, and if we are unable to extend these leases on acceptable terms and secure additional space to accommodate our anticipated growth, we will need to secure alternative space for these facilities in the near future, which would require us to relocate all of our Northern California employees. Such relocation of employees at any of our worldwide offices could result in temporary disruptions of our operations or a diversion of our management’s attention and resources. If we are unable to effectively manage our expanding operations, we may be unable to scale our business quickly enough to meet competitive challenges or exploit potential market opportunities, or conversely, we may scale our business too quickly and the rate of increase in our expenses may exceed the rate of increase in our revenue, either of which would materially and adversely affect our current or future business. In addition, the rate of any decrease in our revenues may exceed the rate at which we are able to reduce our expenses, which would materially and adversely affect our current or future business.
18
Table of Contents
We may not be able to sustain our recent growth rate in the near future, and we may not be able to manage our future growth effectively.
We have experienced significant growth in a short period of time. Our revenue increased from $417.0 million in 2007, to $472.4 million in 2008 and to $542.5 million in 2009. We may not be able to achieve similar revenue growth rates for 2010 or in future periods. In the event that we do achieve continued growth, the expansion of our business and operations will likely place a significant strain on our resources and increased demands on our management information and reporting systems, financial and management controls and personnel. We may not be able to develop the internal capabilities or collaborative relationships required to manage future growth and expansion or to support future operations. If we are unable to manage growth effectively, our financial results could be adversely affected.
We intend to evaluate acquisitions of or investments in businesses, and we may not realize the anticipated benefits of these acquisitions or investments, which could reduce our profitability and adversely affect our stock price.
An important part of our growth strategy includes expansion through acquisitions. We plan to continually evaluate acquisitions of or investments in businesses that may offer complementary products and technologies, augment our market segment coverage, or enhance our technological capabilities, if appropriate opportunities arise. For example, in December 2009, we acquired Intellon, a publicly-traded U.S.-based fabless PLC IC design company; in 2007, we acquired certain assets and liabilities of u-Nav, a privately held U.S.-based fabless GPS IC design company; and in 2006, we acquired ZyDAS, a privately held Taiwan-based fabless wireless IC design company, and Attansic, a privately held Taiwan-based fabless Ethernet IC design company.
Our ability to realize the anticipated benefits of our acquisitions or investments, including the recently completed Intellon acquisition, will depend, in part, on our ability to integrate the business of the acquired company successfully and efficiently with our business. The combination of two independent companies is a complex, costly and time-consuming process. The integration process may disrupt the business of either or both of the companies and, if implemented ineffectively, preclude realization of the full benefits we expect. If we are not successful in this integration, our financial results could be adversely impacted. Our management will be required to dedicate significant time and effort to this integration process, which could divert their attention from other business concerns. In addition, the overall integration of two companies may result in unanticipated problems, expenses, liabilities, competitive responses, loss of customer and other relationships, a loss of key employees, and diversion of management’s attention, and may cause our stock price to decline. Risks arising from our past or future acquisitions or investments could include among other things:
| • | our ability to accurately assess the business and prospects of an acquisition or the anticipated benefits of an acquisition; |
| • | delays in or failure to complete the development and application of the acquired technology or products; |
| • | our ability to successfully integrate acquired technologies, operations and personnel; |
| • | failure to achieve projected results of the acquisition; |
| • | unanticipated changes in general business or market conditions that might interfere with our ability to carry out all of our integration plans; |
| • | disruption of our ongoing business; |
| • | challenges associated with minimizing the diversion of management and employees’ attention from our business; |
| • | risks associated with entering into a geographic region or business market in which we have little or no prior experience, managing personnel in these regions, coordinating and combining international operations, relationships, and facilities, and eliminating duplicative operations; |
| • | difficulties in establishing and maintaining uniform standards, controls, policies and procedures; |
| • | unanticipated issues in integrating information, communications and other systems; |
| • | deficiencies in the internal control of any acquired company could result in a material weakness in our overall internal control; |
| • | our ability to recover costs of the acquisition or investment; |
| • | unanticipated costs and expenditures; |
| • | amortization expenses or impairment charges related to goodwill or other intangible assets; |
19
Table of Contents
| • | negative impact on our relationships with customers, suppliers, strategic partners or contractors; |
| • | challenges associated with retaining key employees and maintaining employee morale, particularly in areas where we do not currently have personnel; and |
| • | potentially dilutive issuance of equity securities. |
Moreover, to the extent we acquire a company with existing products, those products may have lower gross margins than our customary products, which could adversely affect our gross margin and operating results.
Even if our operations and those of an acquired company, such as Intellon, are integrated successfully, we may not realize the full potential benefits of the transaction, including the synergies, cost savings, benefits of product diversification or sales or growth opportunities that are expected. Such benefits may not be achieved within the anticipated time frame, or at all. As a result, we cannot assure you that our combination with any acquired company, including Intellon, will result in the realization of the full benefits anticipated from the transaction. In addition, future acquisitions could result in cash expenditures, accounting charges, the incurrence of debt or contingent liabilities, adverse tax consequences, deferred compensation charges, dilution to future earnings and amortization of amounts related to deferred compensation and certain purchased intangible assets and large and immediate write-offs, any of which could negatively impact our results of operations and could cause our stock price to decline. We may be unable to identify suitable acquisition candidates or investment opportunities in the future or be able to consummate any such transactions on terms and conditions that are acceptable to us, if at all. We may not realize the anticipated benefits of any acquisition or investment.
We may not be successful in expanding into the markets served by an acquired business and in addressing the potential new opportunities that may arise out of the combination.
We may acquire businesses, such as that of Intellon, that serve different markets than ours, and we would not have experience competing in these markets. Further, due to our inexperience in these new markets, we may overestimate the benefits. The success of any expansion into these new markets by us will depend on a number of factors, including:
| • | the ability to incorporate each company’s strengths to provide improved solutions to key customers and applications; |
| • | the ability to assimilate and retain key personnel of the acquired company who have expertise in conducting the acquired company’s business; |
| • | the ability to preserve and grow the acquired company’s existing customer, distributor and strategic relationships; |
| • | the ability to design and develop innovative products and solutions in these new markets and to continue the acquired company’s success in achieving “design wins” with key customers; |
| • | the ability to provide high quality customer services and support; and |
| • | the ability to compete effectively against a larger number and broader range of competitors resulting from our entry into new markets. |
We depend on key personnel to operate our business, and if we are unable to retain our current personnel and hire additional personnel, our ability to develop and successfully market our products could be harmed.
We believe our future success will depend in large part upon our ability to attract and retain highly skilled managerial, engineering and sales and marketing personnel. The loss of any key employees or the inability to attract or retain qualified personnel, including engineers and sales and marketing personnel, could delay the development and introduction of, and harm our ability to sell, our products and harm the market’s perception of us. We believe that our future success is highly dependent on the contributions of our senior management, including our President and Chief Executive Officer, certain other executive officers and our senior engineering personnel. We do not have long-term employment contracts with these or any other key personnel, and their knowledge of our business and industry would be extremely difficult to replace.
There is currently intense competition for qualified personnel with significant experience in the design, development, manufacture, marketing and sales of integrated circuits for use in our various products. Our key personnel and consultants represent a significant asset and serve as the source of our technological and product innovations. We may not be successful in attracting and retaining sufficient numbers of personnel to support our business plan.
Equity awards generally comprise a significant portion of our compensation packages for all employees. In the event of a decline in our stock price, many of our key employees could hold options with exercise prices in excess of our current stock price, and therefore retention of these key employees may be difficult in a highly competitive market. In addition, as a result of the applicability of current authoritative accounting guidance, and the requirement to expense the fair value of stock options awarded to employees, we have modified and may continue to modify our compensation policies by, for example, increasing cash compensation to certain employees and/or instituting awards of restricted stock units, while simultaneously reducing awards of stock options. These
20
Table of Contents
modifications of our compensation policies and the applicability of current authoritative accounting guidance requirement to expense the fair value of stock options awarded to employees and officers have increased our operating expenses. We cannot be certain that these and any other changes in our compensation policies will or would improve our ability to attract, retain and motivate employees. Our inability to attract and retain additional key employees and the increase in stock-based compensation expense could each have an adverse effect on our business, financial condition and results of operations.
If we fail to develop and introduce new products and enhancements or to manage product transitions, or if our proprietary features do not achieve market acceptance on a timely basis, our ability to attract and retain customers could be impaired, our competitive position may be harmed, and our revenues, earnings and stock price may decline.
The wireless and wired communications markets are characterized by rapidly changing technology, intense competition, evolving industry standards, rapid changes in customer requirements and frequent product introductions. We must continually design, develop and introduce new products with improved features to be competitive. Our current and future products may not achieve market acceptance or adequately address the changing needs of the market, and we may not be successful in developing and marketing new products or enhancements to our existing products on a timely basis. The introduction of products embodying new technologies, the emergence of new industry standards or changes in customer requirements could render our existing products obsolete and unmarketable. In addition, if we or our customers are unable to manage product transitions in a timely and cost-effective manner, our business and results of operations will suffer. We introduce from time to time products with proprietary enhancements. Although we believe our products are fully compliant with applicable industry standards, proprietary enhancements may not in the future result in full conformance with existing industry standards under all circumstances. Our introduction of proprietary features involves risks associated with market acceptance of these new products and certification by industry standards groups. We have reviewed the rules and regulations of the various standards bodies and related industry organizations to which we belong or with which we are affiliated, and we believe there is not a significant risk that action would be taken that would undermine our ability to continue to leverage our affiliation with these organizations.
The development of our products is highly complex. We occasionally have experienced delays in completing the development and introduction of new products and product enhancements, and we could experience delays in the future. Unanticipated problems in developing wireless products could also divert substantial engineering resources, which may impair our ability to develop new products and enhancements and could substantially increase our costs. Even if the new and enhanced products are introduced to the market, we may not be able to achieve market acceptance of these products and our proprietary features in a timely manner.
Our PLC solutions may not gain widespread acceptance, which could materially adversely affect our business.
The PLC market currently lacks broad consumer market awareness and acceptance. PLC generally, and the HomePlug standards in particular, face competition from other wireline communications technologies, including coaxial cable and telephone line, as well as Ethernet and wireless technologies. Many of the competing technologies are actively supported by companies with longer operating histories and greater resources, and some offer features that PLC products cannot provide. Some of these competing communications technologies have a longer history of availability, stronger industry alliance support, greater market acceptance, the benefit of higher economies of scale associated with larger product volumes, and may provide better performance at a more competitive price. Although we offer products based on several of these competing technologies, if powerline communications technology generally, and our powerline solutions in particular, do not achieve widespread market acceptance, there may be less demand or no demand for some of our powerline products which may cause our business to suffer and our stock price to decline.
In addition, we have limited experience in applying our PLC technology to other media, such as coaxial cable and telephone wiring. Although some service providers are using our powerline solutions for communications over coaxial cable and telephone wiring, we intend to continue to evaluate whether we can successfully extend the use of our PLC technology and solutions to these other media. Because of interest from customers and standards organizations in single solutions that can enable communications over multiple wired media, including powerline, coaxial cable and telephone wiring, sometimes referred to as anywire technology, we expect that our future product roadmap will need to include solutions with these capabilities and we have limited experience with these other media. As a result, we may be unable to gain, or may need to incur significant costs in order to obtain, the necessary experience and expertise required to apply our PLC technology to these other media or to develop and obtain other wireline communications technology and intellectual property. In pursuing this business, we will be competing with companies that have substantially greater experience with, and technologies specifically designed to optimize communications over, these other media. In addition, some applications of our products on these other media may interfere with other technologies that use the same wires, potentially making commercialization of these applications impractical. If we are unsuccessful in our efforts, our business could be harmed.
21
Table of Contents
We face business, political, regulatory, operational, financial and economic risks because most of our operations and sales activities take place outside of the U.S.
A significant portion of our products is sold to customers outside the U.S. and Canada. Sales to customers in Asia have accounted for substantially all of our revenue since 2003. Because most of our ODMs and our other direct customers are located in Asia, we anticipate that substantially all of our revenue will continue to be represented by sales to customers in that region. In addition, our primary suppliers are located in Asia and Israel. We also conduct research and development activities in Canada, China, Finland, India, and Taiwan and have sales, marketing and support personnel in China, Hong Kong, France, Germany, Japan, Korea, Macao, Taiwan, and the United Kingdom. Approximately one-half of our total workforce is currently located in Asia. Our success depends upon continued expansion of our international operations. Our international business involves a number of risks, including:
| • | multiple, conflicting and changing laws and regulations, tax laws, export and import restrictions, employment laws, regulatory requirements and other governmental approvals, permits and licenses; |
| • | difficulties in staffing and managing foreign operations as well as cultural differences; |
| • | trade restrictions or higher tariffs that favor local competition in some countries; |
| • | difficulties of managing sales representatives, especially because we expect to increase our sales through our sales representatives; |
| • | inadequate local infrastructure and transportation delays; |
| • | financial risks, such as longer payment cycles, greater difficulty collecting accounts receivable and exposure to foreign currency exchange rate fluctuations; |
| • | failure by us or our customers to gain regulatory approval for use of our products; |
| • | government-imposed travel restrictions for our employees, which could negatively impact communication between our offices and with our customers and vendors; and |
| • | political and economic instability, including wars, terrorism, natural disasters, and political unrest, recurrence of the SARS, avian flu, or any other outbreak, boycotts, curtailment of trade and other business restrictions. |
Also, there may be reluctance in some foreign markets to purchase products based on GPS technology, due to the control of GPS by the U.S. government. Any of these factors could significantly harm our future international sales and operations, and consequently, our revenue and results of operations and business and financial condition. In addition, all of the independent foundries that manufacture our products and the subcontractors that test and assemble our products are located outside of the U.S., and their business and ability to provide products and services to us are therefore subject to many of these risks.
We rely on a limited number of independent foundries and subcontractors for the manufacture, assembly and testing of our chipsets and on a third party logistics provider to ship products to our customers. The failure of any of these third-party vendors to deliver products or otherwise perform as requested could damage our relationships with our customers, decrease our sales and limit our growth.
We depend on six independent foundries to manufacture substantially all of our products. Our key silicon foundries for wafer production are GLOBALFOUNDRIES in Singapore, SMIC in China, Silterra in Malaysia, TSMC in Taiwan, Tower Semiconductor Ltd. in Israel and UMC in Taiwan. We also plan to produce products at other foundries. The failure of any of these foundries to provide the necessary capacity or output for our products could result in significant production delays and could materially and adversely affect our business, financial condition and results of operations. While we currently believe we have adequate capacity to support our current sales levels, we continue to work with our existing foundries to obtain more production capacity, and we intend to qualify new foundries to provide additional production capacity. It is possible that from time to time adequate foundry capacity may not be available on acceptable terms, if at all. In the event a foundry experiences financial difficulties, suffers any damage to or destruction of its facilities, is enjoined or otherwise precluded from manufacturing our products in connection with an intellectual property lawsuit with another foundry relating to manufacturing processes, or experiences any other disruption of foundry capacity, we may not be able to qualify alternative manufacturing sources for existing or new products in a timely manner.
Our wafer probe testing is conducted by independent wafer probe test subcontractors. Following completion of the wafer probe tests, the die are assembled into packages and the finished products are tested by one of our key test and assembly subcontractors including, but not limited to, Advanced Semiconductor Engineering, Inc., or ASE, in Taiwan, Amkor Technology, Inc. in China, Taiwan and Korea, Orient Semiconductor Electronics, Ltd., or OSE, in Taiwan, Signetics Corporation in Korea, Siliconware Precision Industries Co., Ltd. in China and Taiwan and United Test and Assembly Center Ltd. in Singapore. We store and distribute our finished goods inventory from contracted warehouses in Hong Kong and Singapore. While we have not experienced material disruptions in supply from assembly subcontractors to date, we and others in our industry have experienced shortages in the supply of packaging materials from time to time, and we could experience shortages or assembly problems in the future. The availability of
22
Table of Contents
assembly and testing services from these subcontractors could be materially and adversely affected in the event a subcontractor experiences financial difficulties, or if a subcontractor suffers any damage to or destruction of its facilities, or in the event of any other disruption of assembly and testing capacity.
In addition, natural disasters, terrorist acts or other conflicts or acts of war could disrupt product supply from our vendors in Israel or Asia, which could undermine our ability to provide products to our customers and harm our operating results.
We do not have long-term supply contracts with our third-party manufacturing vendors and they may not allocate sufficient capacity to us to meet future demands for our products.
We currently do not have long-term supply contracts with any of our third-party vendors. Therefore, they are not obligated to perform services or supply products to us for any specific period, in any specific quantities, or at any specific price, except as may be provided in a particular accepted purchase order. None of our third-party foundry or assembly and test vendors has provided contractual assurances to us that adequate capacity will be available to us to meet future demand for our products. Our manufacturing vendors have from time to time experienced production capacity constraints due to upturns in the semiconductor market, and they may do so again in the future. In addition, we may experience difficulties in obtaining adequate allocation at our manufacturing vendors as we move our design and manufacturing to smaller geometries. Under these circumstances, these foundries and assembly and test vendors may allocate capacity to the production of other companies’ products while reducing deliveries to us on short notice. In particular, other customers that are larger and better financed than us, those that pay a higher price, or those that have long-term agreements with our foundries or assembly and test vendors may cause these foundries or assembly and test vendors to reallocate capacity to those customers, decreasing the capacity available to us. In addition, a number of foundry consolidations have recently occurred in the industry. As foundries are acquired, the priorities of the new entities may change and they may terminate current foundry customers, including us, in an effort to support the new strategic direction. If we enter into costly arrangements with suppliers that include nonrefundable deposits or loans in exchange for capacity commitments, commitments to purchase specified quantities over extended periods or investment in a foundry, our operating results could be harmed. To date, we have not entered into such arrangements with our suppliers. If we need another integrated circuit foundry or assembly and test subcontractor because of increased demand, or the inability to obtain timely and adequate deliveries from our providers, we might not be able to cost-effectively and quickly retain other vendors to satisfy our requirements.
If our third-party foundries or suppliers do not achieve satisfactory yields or quality, our relationships with our customers and our reputation will be harmed.
The fabrication of chipsets is a complex and technically demanding process. Minor deviations in the manufacturing process can cause substantial decreases in yields, and in some cases, cause production to be suspended. Our third-party foundries and suppliers have from time to time experienced manufacturing defects and reduced manufacturing yields. In addition, we plan to begin production of certain of our products at other foundries and suppliers, and these suppliers may not meet our quality and volume requirements. Changes in manufacturing processes or the inadvertent use of defective or contaminated materials by our foundries could result in lower than anticipated manufacturing yields or unacceptable performance. Many of these problems are difficult to detect at an early stage of the manufacturing process and may be time consuming and expensive to correct. In addition, designing RF circuits using standard, complementary metal-oxide semiconductor processes is difficult and can result in unsatisfactory yields. Because we primarily purchase wafers, our exposure to low wafer yields from our foundries is increased. Poor yields from our foundries or defects, integration issues or other performance problems in our products could cause us significant customer relations and business reputation problems, or force us to sell our products at lower gross margins and therefore harm our financial results. In addition, manufacturing defects may not be detected by our testing, or may be caused by defective packaging of our products by our third-party suppliers. If these defects arise or are discovered after we have shipped our products, our reputation and business would suffer.
Our customers may purchase our chipsets indirectly from wireless module vendors, in the form of packaged wireless modules. We have in the past and may in the future enter into contracts with wireless module vendors to build and sell modules we have designed, and for which we provide warranty and indemnity, plus financial responsibility for certain potential liabilities of the wireless module vendor. If wireless modules of our design and purchased from a wireless module vendor are defective or fail in the field, we could suffer substantial monetary damages and damage to our reputation and business. We could also be held responsible for liability and damages related to intellectual property risks created by the sale of wireless modules, even if we would not be held responsible for similar liabilities related just to our wireless chipsets.
We may experience difficulties in transitioning to smaller geometry process technologies or in achieving higher levels of design integration, which may result in reduced manufacturing yields, delays in product deliveries and increased expenses.
To remain competitive, we continually work to improve our chipsets and, in particular, our high-performance wireless and wired networking products, to be manufactured using increasingly smaller geometries and to achieve higher levels of design integration. These ongoing efforts are costly and difficult and require us from time to time to modify the manufacturing processes for our products
23
Table of Contents
and to redesign some products. We must also redesign our chipsets from time to time to compete successfully and to address new technological developments, which may result in delays in product deliveries. We periodically evaluate the benefits, on a product-by-product basis, of migrating to smaller geometry process technologies to reduce our costs. We have experienced in the past and may continue to experience some difficulties in shifting to smaller geometry process technologies or new manufacturing processes, resulting in reduced manufacturing yields, delays in product deliveries and increased development expenses. The costs of manufacturing products at smaller geometries is significantly greater than the cost applicable to geometries at which we currently manufacture our products and we expect our development costs will significantly increase as a result. In addition, while we purchase wafers from foundries, we typically assume the yield risk related to production. We depend on our relationships with our foundries to transition to smaller geometry processes successfully and cannot assure that our foundries will be able to effectively manage the transition. If our foundries, or we, experience significant delays in this transition or fail to efficiently implement these transitions, our business, financial condition and results of operations could be adversely affected.
We depend on a small number of customers for a significant portion of our revenue. If we fail to retain or expand customer relationships, our revenue could decline.
We derive a significant portion of our revenue from a small number of customers, most of which are ODMs that in turn sell to multiple OEMs, and we anticipate that we will continue to do so in the foreseeable future. These customers may decide not to purchase our products at all, to purchase fewer products than they did in the past, for example due to an increase in inventory, or to alter their purchasing patterns in some other way, particularly because substantially all of our sales are made on a purchase order basis, which permits our customers to cancel, change or delay product purchase commitments with little or no notice to us and without penalty.
In 2009, 2008 and 2007, Hon Hai Precision Industry Co. Ltd. accounted for 17%, 19% and 25% of the Company’s net revenue, respectively. In 2009, Nintendo Co., Ltd. accounted for 13% of the Company’s net revenue.
Some of our OEM customers are also ODM customers, which may increase the impact of the loss of any customer. We must obtain orders from new customers on an ongoing basis to increase our revenue and grow our business. Our largest customers are typically ODMs who generally provide products incorporating our chips to multiple OEMs. Sales to our largest customers have fluctuated significantly from period to period primarily due to OEMs that incorporate our products changing their designated ODM and the continued diversification of our OEM customer base in our current markets. We believe that sales will likely continue to fluctuate significantly in the future as we enter into new markets. The loss of any significant customer, a significant reduction in sales we make to them, or any problems collecting receivables from them would likely harm our financial condition and results of operations. In addition, we design some of our products to incorporate customer specifications. If our customers purchase fewer products than anticipated or if we lose a customer, we may not be able to sell these products to other customers, which would result in excess inventory and could negatively impact our operating results.
Some of our customers could become our competitors.
Some of our customers are also large integrated circuit suppliers and some of our large customers already have similar expertise in-house. These customers have longer operating histories, significantly greater resources and name recognition, and a larger base of customers than we do. The process of licensing our technology to and support of such customers entails the transfer of technology that may enable them to become a source of competition to us, despite our efforts to protect our intellectual property rights. In addition, we compete with divisions within some of our customers. Further, each new design by a customer presents a competitive situation. In the past, we have lost design wins to divisions within our customers and this may occur again in the future. We cannot assure you that these customers will not continue to compete with us, that they will continue to be our customers or that they will continue to buy products from us at the same volumes. Competition could increase pressure on us to lower our prices and could negatively impact our profit margins.
We will have difficulty selling our products if customers do not design our products into their product offerings or if our customers’ product offerings are not commercially successful.
We sell our products directly to OEMs, who include our chipsets in their products, and to ODMs, who include our chipsets in the products they supply to OEMs. Our products are generally incorporated into our customers’ products at the design stage. As a result, we rely on OEMs to design our products into the products they sell. Without these design wins, our business would be materially and adversely affected. We often incur significant expenditures when developing new product without any assurance that an OEM will select our product for design into its own product. Once an OEM designs a competitor’s product into its product offering, it becomes significantly more difficult for us to sell our products to that customer because changing suppliers involves significant cost, time, effort and risk for the customer. Furthermore, even if an OEM designs one of our products into its product offering, we cannot be assured that its product will be commercially successful, that we will receive any revenue from that manufacturer or that a successor design will include one of our products.
24
Table of Contents
The complexity of our products could result in unforeseen delays or expenses from undetected defects, errors or bugs in hardware or software, which could reduce the market acceptance for our new products, damage our reputation with current or prospective customers and adversely affect our operating costs.
Highly complex products such as our chipsets and the related reference designs we provide to our customers frequently contain defects, errors and bugs when they are first introduced or as new versions are released. We have in the past and may in the future experience these defects, errors and bugs. If any of our products have reliability, quality, or compatibility problems, we may not be able to successfully correct these problems. In addition, if any of our proprietary features contain defects, errors or bugs when first introduced or as new versions are released, we may be unable to correct these problems. Consequently, our reputation may be damaged and customers may be reluctant to buy our products, which could harm our ability to retain existing customers and attract new customers and our financial results. In addition, these defects, errors or bugs could interrupt or delay sales to our customers. If any of these problems are not found until after we have commenced commercial production of a new product, we may be required to incur additional development costs and product recalls, repairs or replacement costs. These problems may also result in claims against us by our customers or others.
Because we do not have long-term commitments from our customers, we must estimate customer demand, and errors in our estimates can have negative effects on our inventory levels, sales and operating results.
Our sales are largely made on the basis of individual purchase orders rather than long-term purchase commitments. Our customers have the right to cancel or defer some purchase orders. We have experienced in the past cancellations or deferrals of purchase orders, and additional cancellations and deferrals may occur from time to time. We have historically placed firm orders for products with our foundries up to approximately 16 to 20 weeks prior to the anticipated delivery date and typically prior to receiving an order for the product. Therefore, our order volumes are based on our forecasts of demand from our customers. This process requires us to make multiple demand forecast assumptions, each of which may introduce error into our estimates. If we overestimate customer demand or incorrectly estimate product mix, we may allocate resources to manufacturing products that we may not be able to sell when we expect or at all. As a result, we would have excess inventory, which would harm our financial results. Conversely, if we underestimate customer demand or if insufficient manufacturing capacity is available, we would forego revenue opportunities, lose market share and damage our customer relationships. On occasion, we have been unable to adequately respond to increases in customer purchase orders, and therefore, were unable to complete, or needed to delay, sales. We have in the past, and may in the future, allocate our supply among our customers. Product allocation may result in the loss of current customers, and if we are unable to commit to provide specified quantities of products over a given period of time, we will not attract new customers. The failure to maintain customer relationships would decrease our revenue and harm our business.
We recorded impairment charges during the years ended December 31, 2009, 2008 and 2007 to reduce the carrying value of certain auction-rate securities we hold, and we may incur additional impairment charges with respect to these securities in 2010.
Credit concerns in the capital markets have significantly reduced our ability to liquidate auction-rate securities that we classify as long term available-for-sale securities on our balance sheet. Auction-rate securities represent our interest in insurance capital notes, issued by special purpose entities sponsored by insurance companies. A portion of these securities are insured by third party bond insurers and are collateralized by tradable short-term corporate and government notes, bonds and commercial paper. As of December 31, 2009, we held auction-rate securities and preferred stock with a par value of $30.6 million and an estimated fair value of $13.5 million. To date we have recorded $19.8 million in losses as other-than-temporary impairments. Each of these securities had been subject to multiple auction processes for which there had been insufficient bidders on the scheduled rollover dates. The investment bank who organized the auctions for these securities filed for bankruptcy during the quarter ended September 30, 2008, and since such time, no auctions have occurred. We do not know if or when future auctions will be held. We will not be able to liquidate any of our remaining auction-rate securities until a future auction is successful, a buyer is found outside of the auction process, or the notes are redeemed. In November 2008, the insurance companies sponsoring two of the auction-rate securities we hold exercised their put rights and have exchanged preferred stock for all the underlying assets collateralizing these securities. One of these insurance companies is currently not paying dividends on the preferred stock. Since September 30, 2007, we have re-classified these auction-rate securities as long-term available-for-sale securities and have maintained this classification. In December 2009, we sold two of our auction-rate securities with an original par value of $2.1 million and a fair value of $1.6 million for $1.5 million. In future periods, the estimated fair value of our auction-rate securities could decline further based on market conditions, which could result in additional impairment charges. These charges could be substantial.
Potential problems with our information systems could interfere with our business and operations.
We rely on our information systems and those of third parties for processing customer orders, shipping of products, billing our customers, tracking inventory, supporting accounting functions and financial statement preparation, and otherwise running our business. Any disruption in our information systems and those of the third parties upon whom we rely could have a significant impact on our business. In addition, in 2007, we implemented enhanced information systems to meet the demands resulting from our growth and to provide additional capabilities and functionality and we are in the process of implementing additional modules to help us
25
Table of Contents
improve our management, operational and planning processes. We anticipate that we will also need to continue implementing a variety of new and upgraded operational and financial systems, as well as additional procedures and other internal management systems. The implementation of new systems and enhancements is frequently disruptive to the underlying business of an enterprise, and can be time consuming and expensive, increase management responsibilities and divert management attention. Any disruptions relating to our systems enhancements or any problems with the implementation, particularly any disruptions impacting our operations or our ability to accurately report our financial performance on a timely basis during the implementation period, could adversely affect our business in a number of respects. Even if we do not encounter these adverse effects, the implementation of these enhancements may be much more costly than we anticipated. If we are unable to successfully implement the information systems enhancements as planned, our financial position, results of operations, and cash flows could be negatively impacted.
Changes to financial accounting standards may affect our results of operations and could cause us to change our business practices.
We prepare our financial statements to conform to generally accepted accounting principles, or GAAP, in the U.S. These accounting principles are subject to interpretation by the American Institute of Certified Public Accountants, the Securities and Exchange Commission and various bodies formed to interpret and create appropriate accounting rules and regulations. A change in those accounting rules can have a significant effect on our reported results and may affect our reporting of transactions completed before a change is announced. Changes to those rules or the questioning of current practices may adversely affect our reported financial results or the way we conduct our business. For example, in December 2004, the Financial Accounting Standards Board, or FASB, issued updated authoritative accounting guidance, which has required us, starting in our first quarter of 2006, to record a charge to earnings for employee stock option grants and other equity incentives. Since we historically used equity-related compensation as a component of our total employee compensation program, the accounting change has made the use of equity-related compensation less attractive to us and therefore has made it more difficult to attract and retain employees. As a result, this change has led us to consider other equity and non-equity forms of compensation. However, because we believe that providing equity-related compensation for our employees is a competitive necessity, we will likely incur significant and ongoing accounting charges resulting from option grants and other equity incentive expensing that could adversely affect our overall results of operations. Moreover, we have implemented the requirements of the updated authoritative accounting guidance using the modified prospective method and accordingly we have not restated prior period financial statements to reflect the historical impact of option grants. This may potentially cause readers of our financial statements to draw incorrect conclusions regarding our operating performance.
Similarly, in July 2006, the FASB issued updated guidance which clarifies the accounting for uncertainty in tax positions. The new guidance requires that we recognize the financial statement effects of a tax position when it is more likely than not, based on the technical merits, that the position will be sustained upon examination. The provisions of this amendment became effective for us, and we implemented them, in the first quarter of 2007. This may potentially cause readers of our financial statements to draw incorrect conclusions regarding our future operating performance since our financial statements going forward, which will reflect the provisions of this amendment, may not be comparable to our prior period financial statements that exclude its application.
In addition, in December 2007 the FASB issued updated authoritative accounting guidance related to business combinations. The updated guidance establishes principles and requirements for how the acquirer of a business recognizes and measures in its financial statements the identifiable assets acquired, the liabilities assumed, and any noncontrolling interest in the acquiree. The statement also provides guidance for recognizing and measuring the goodwill acquired in the business combination and determines what information to disclose to enable users of the financial statement to evaluate the nature and financial effects of the business combination. The updated standard also provides guidance for recognizing changes in an acquirer’s existing income tax valuation allowances and tax uncertainty accruals that result from a business combination transaction as adjustments to income tax expense. The updated guidance became effective for us in the first quarter of 2009. The updated guidance had a material impact on our consolidated financial statements during the year ended December 31, 2009. In August 2009, we recognized a one-time tax benefit of $21.7 million upon favorable resolution of a foreign tax obligation relating to a prior acquisition. Under prior accounting standards, the amount would have been recorded as an adjustment of goodwill. In December 2009, we completed the acquisition of Intellon. Under the updated guidance, we are expensing the transaction and employee termination costs associated with the Intellon acquisition, while under the prior accounting standards such costs would have been capitalized. In addition, we acquired in-process research and development of $7.7 million which has been capitalized in accordance with the updated guidance, whereas under prior authoritative guidance the amount would have been expensed immediately. Therefore, we believe the updated guidance will have a material impact on our future consolidated financial statements.
We have acquired numerous intangible assets from our recent acquisitions which may be subject to write-downs if business deteriorates.
Through our acquisitions of ZyDAS, Attansic, u-Nav and Intellon, we have acquired various intangible assets including developed technology, customer relationships, covenants not-to-compete, backlog, and goodwill. As of December 31, 2009 the company has goodwill associated with our acquisitions of $188.9 million and net acquired intangible assets of $135.4 million. Goodwill must be tested for impairment at least on an annual basis. We performed our annual impairment assessment of the carrying
26
Table of Contents
value of the goodwill recorded in connection with our various acquisitions in October 2009 and determined the goodwill balance was not impaired. We are required to perform testing for impairment losses for long-lived assets used in operations when indicators of impairment, such as reductions in demand or significant economic slowdowns in the semiconductor industry, are present. To date, we have not recorded any impairment charges related to our long-lived assets. Although during 2009 we tested our goodwill and long-lived assets for impairment and concluded that the assets were not impaired, we cannot be certain that these assets will not be subject to write-downs in future periods which could seriously harm our financial condition and operating results.
Unanticipated changes in our tax rates could affect our future results.
Since we operate in different countries and are subject to taxation in different jurisdictions, our future effective tax rates could be impacted by changes in such countries’ tax laws or their interpretations. Both domestic and international tax laws are subject to change as a result of changes in fiscal policy, changes in legislation, evolution of regulation and court rulings. The application of these tax laws and related regulations is subject to legal and factual interpretation, judgment and uncertainty. Recently, U.S. President Barack Obama’s administration proposed significant changes to the U.S. international tax laws that could limit U.S. deductions for expenses related to un-repatriated foreign-source income, and modify the U.S. foreign tax credit and “check-the-box” rules. We cannot determine whether these proposals will be enacted into law or what, if any, changes may be made to such proposals prior to their being enacted into law. If the U.S. tax laws change in a manner that increases our tax obligation, it could result in a material adverse impact on our net income and our financial position.
Our future effective tax rate could be unfavorably affected by unanticipated changes in the valuation of our deferred tax assets and liabilities. Changes in our effective tax rate could have a material adverse impact on our results of operations. We record a valuation allowance to reduce our net deferred tax assets to the amount that we believe is more likely than not to be realized. In assessing the need for a valuation allowance, we consider historical levels of income, expectations and risks associated with estimates of future taxable income and ongoing prudent and practical tax planning strategies. On a periodic basis we evaluate our deferred tax asset balance for realizability. To the extent we believe it is more likely than not that some portion of our deferred tax assets will not be realized, we will increase the valuation allowance against the deferred tax assets. Realization of our deferred tax assets is dependent primarily upon future U.S. taxable income. During the year ended December 31, 2009, we increased the valuation allowance in the amount of $6.0 million, of which $3.9 million resulted from the Intellon acquisition. In 2008, we increased the valuation allowance in the amount of $5.4 million against our deferred tax assets, and in 2007, we released a portion of the valuation allowance in the amount of $3.0 million previously recorded against our deferred tax assets. This release resulted in a reduced tax provision in the year recorded.
The final determination of our income tax liability may be materially different from our income tax provision.
The final determination of our income tax liability may be materially different from our income tax provision. We are subject to income taxes in both the U.S. and international jurisdictions. Significant judgment is required in determining our worldwide provision for income taxes. In the ordinary course of our business, there are many transactions where the ultimate tax determination is uncertain. Additionally our calculations of income taxes are based on our interpretations of applicable tax laws in the jurisdictions in which we file. Although we believe our tax estimates are appropriate, there is no assurance that the final determination of our income tax liability will not be materially different than what is reflected in our income tax provisions and accruals.
We are also subject to the periodic examination of our income tax returns by the Internal Revenue Service, or IRS, in the U.S. and other tax authorities. We regularly assess the likelihood of adverse outcomes resulting from these examinations to determine the adequacy of our provision for income taxes. The outcomes from these examinations may have an adverse effect on our operating results and financial condition. Our U.S. Federal income tax return for the year ended December 31, 2006 is under examination by the Internal Revenue Service, or IRS. While we believe that we have made adequate provisions related to the audits of these tax returns, the final determination of our obligations may exceed the amounts reflected in our income tax provisions and accruals.
Should additional taxes be assessed as a result of new legislation, an audit or litigation; or if our effective tax rate should change as a result of changes in federal, international or state and local tax laws; or if we were to change the locations where we operate, there could be a material adverse effect on our income tax provision and results of operations in the period or periods in which that determination is made, and potentially to future periods as well.
Furthermore, our provision for income tax could increase as we expand our international operations, adopt new products, implement changes to our operating structure or undertake intercompany transactions in light of acquisitions, changing tax laws, expiring rulings, and our current and anticipated business and operational requirements.
27
Table of Contents
If we fail to secure or protect our intellectual property rights, competitors may be able to use our technologies, which could weaken our competitive position, reduce our revenue or increase our costs.
We rely on a combination of patent, copyright, trademark and trade secret laws, confidentiality procedures and licensing arrangements to establish and protect our proprietary rights. If we fail to protect our intellectual property rights, competitors could sell products based on our technology, which could harm our competitive position and decrease our revenue. Our pending patent applications may not result in issued patents, and our existing and future patents may not be sufficiently broad to protect our proprietary technologies or may be held invalid or unenforceable in court. Policing unauthorized use of our products is difficult, expensive and time-consuming, and we cannot be certain that the steps we have taken will prevent the misappropriation or unauthorized use of our technologies, particularly in foreign countries where the laws may not protect our proprietary rights as fully as U.S. law. Any patents we have obtained, or may obtain in the future, may not be adequate to protect our proprietary rights. Our competitors may independently develop or may have already developed similar technology, duplicate our products or design around any patents issued to us or other intellectual property rights. In addition, we may be required to license our patents as a result of our participation in various standards organizations.
We maintain trademarks on certain of our products and services and claim copyright protection for certain proprietary software and documentation. However, we can give no assurance that our trademarks and copyrights will be upheld or successfully deter infringement by third parties. We license our software under signed license agreements, which impose restrictions on the licensee’s ability to utilize the software. We protect our trade secrets and other proprietary information through confidentiality and other agreements with our customers, suppliers, employees and consultants and through other security measures. Further, we cannot be sure that steps we take to protect our proprietary information will prevent misappropriation of our proprietary information. In addition, we may not receive effective protection of our intellectual property rights in foreign countries to the same extent as in the U.S.
Certain of our and our suppliers’ software may contain or may be derived from open source software. License for such software may impose certain obligations on us if we were to distribute derivative works of the open source software. For example, these obligations may require us to make source code for the derivative works available to the public, or license such derivative works under a particular type of license different than what we customarily used to protect our intellectual property.
We cannot be sure that steps we take to protect our proprietary information will prevent misappropriation of our proprietary information. In addition, we may not receive effective protection of our intellectual property rights in foreign countries to the same extent as in the U.S. Our business and operating result could be negatively impacted if we are unable to protect our intellectual property rights.
Because we license some of our software source code directly to customers, we face increased risks that our trade secrets will be exposed through inadvertent or intentional disclosure, which could harm our competitive position or increase our costs.
We license some of our software source code to our customers, which increases the number of people who have access to some of our trade secrets and other proprietary rights. Contractual obligations of our licensees and their sublicensees not to disclose or misuse our source code may not be sufficient to protect us from disclosure or misuse. The costs of enforcing contractual rights could substantially increase our operating costs and may not ultimately succeed in protecting our proprietary rights. If our competitors access our source code, they may gain further insight into the technology and design of our products, which would harm our competitive position.
Intellectual property litigation and disputes, which are common in our industry, could be costly, harm our reputation, limit our ability to license or sell our proprietary technologies or products and divert the attention of management and technical personnel.
The wireless and wired communications markets are characterized by frequent litigation regarding patent and other intellectual property rights. From time to time, we have received, and we may continue to receive, written notices or offers from our competitors and others claiming to have patent and other intellectual property rights in certain technology and inviting us to license this technology and related patents, including technology and patents that may apply to the IEEE family of standards, such as the WLAN standards, or other wireless or wired standards, as well as to other technology and patents relevant to our chips, software and system solutions. These notices or offers have been made directly to us and through our U.S. and foreign customers and other third parties. We have responded, or are in the process of responding, directly, or indirectly through our customers and other third parties to notices and allegations of infringement that we or our customers have received, and continue to correspond regarding the offers with some of the parties that have sent the notices. Moreover, we are currently engaged in litigation with parties that claim our products infringe their patents as discussed in Part I, Item 3 of this Report. Questions of infringement and misappropriation in our markets involve highly technical and subjective analyses. In addition to the litigation in which we are currently involved, future litigation may be necessary to enforce any patents we may receive and other intellectual property rights, to protect our trade secrets, to determine the validity and scope of the proprietary rights of others, or to defend against claims of infringement or misappropriation, and we may not prevail in our current or any future litigation. Our business could be harmed as a result of litigation or acceptance of offers to license or
28
Table of Contents
otherwise settle claims of infringement. Litigation, whether or not determined in our favor or settled, could be costly, could harm our reputation and could divert the efforts and attention of our management and technical personnel from normal business operations. In addition, adverse determinations in litigation could result in the loss of our proprietary rights, subject us to significant liabilities, and require us to seek licenses from third parties or prevent us from licensing our technology or selling our products, any of which could seriously harm our business. Any of these consequences could result from litigation whether initiated by our competitors or others, including those that have already sent notices or offers to us and our customers claiming patent rights and offering licenses.
In addition, certain of our customers and other third parties are involved in litigation or disputes with third parties that claim products that are compliant with certain industry standards infringe certain patents, and several of our customers have been sued in the U.S. for allegedly infringing patents related to WLAN, Ethernet, GPS and Bluetooth technologies or have received notices of written offers from our competitors and others claiming to have patent rights in certain technology and inviting our customers to license this technology. We have indemnification obligations to our customers and other third parties with respect to infringement of third-party patents and intellectual property rights by our products. We have been asked or will likely be asked to indemnify these customers and other third parties for any losses they incur in connection with such litigation, including damages, legal expenses and settlement payments, and we could also incur substantial expenses in providing technical support to our customers in connection with such litigation. For example, certain of our customers and other third parties have been involved in patent infringement litigation and in April 2009 agreed to settle these claims. We have been asked by certain of these customers and other third parties and are likely to be asked by others to indemnify them for all or a portion of the losses they incur in connection with this litigation, including damages, legal expenses and settlement payments. At this time we are unable to determine if or when we would be required to make payments under these indemnification obligations or the amount of any such payments. However, the amounts of any such payments could be significant. In addition to the time and expense required for us to supply support or indemnification to our customers, any such litigation could severely disrupt or shut down the business of our customers, which in turn could hurt our relations with our customers and cause the sale of our proprietary technologies and products to decrease.
Our headquarters are located in California, and we have sales offices throughout Asia, and research and development facilities in California, Florida, India, Taiwan and China. Our third-party foundries and subcontractors are concentrated in Asia and elsewhere in the Pacific Rim and Israel. These areas are subject to significant weather and in some locations, earthquake-related risks. Any disruption to the operations of these offices, foundries and subcontractors resulting from typhoons, hurricanes, earthquakes or other natural disasters could cause significant delays in the development, production, shipment and sales of our products.
TSMC, SMIC, Chartered, GLOBALFOUNDRIES, UMC, Silterra and other foundries we may use in the future, which manufacture our chipsets, and subcontractors which perform substantially all of our assembly and testing, are located in Asia. Tower Semiconductor Ltd., which also manufactures our chipsets, is located in Israel. In addition, our headquarters are located in Northern California, and we have sales offices in Japan, Taiwan, Hong Kong, China and elsewhere in Asia, research and development facilities in Southern California, Florida, India, Taiwan and China and administrative offices in Macao. These areas are subject to hurricanes or typhoons, and the risk of an earthquake or an earthquake-related disaster such as a tsunami in the Pacific Rim region, the Indian Ocean region, or the Middle East, is significant due to the proximity of major earthquake fault lines. In the past, major earthquakes in Taiwan have disrupted the facilities of several of these third-party contractors, as well as other providers of these services, and impaired their production capacity. In addition, a tsunami in December 2004 caused widespread destruction and disruption of business in India and throughout the Indian Ocean coastal region. The occurrence of additional earthquakes or other natural disasters could result in the disruption of our foundry, assembly and test capacity or research and development efforts, or our ability to market and sell our products. We may not be able to obtain alternate capacity on favorable terms, if at all and our research and development efforts could be slowed.
We rely upon third parties for technology that is integrated into some of our products, and if we are unable to continue to use this technology and future technology or the technology fails to operate, our ability to sell technologically advanced products would be limited.
We rely on third parties for technology that is integrated into some of our products. If we are unable to continue to use or license on reasonable terms third-party technologies used in some of our products or the technology fails to operate, we may not be able to secure alternatives in a timely manner and our business would be harmed.
If our internal control over financial reporting does not comply with the requirements of the Sarbanes-Oxley Act, investor perceptions of our company may be adversely affected and could cause a decline in the market price of our stock.
Section 404 of the Sarbanes-Oxley Act of 2002 requires our management to report on, and our independent auditors to attest to, the effectiveness of our internal control structure and procedures for financial reporting. We have an ongoing program to perform the system and process evaluation and testing necessary to comply with these requirements. We have incurred and expect to continue to incur significant expense and to devote significant management resources to Section 404 compliance. In the event that our chief executive officer, chief financial officer, chief accounting officer, or independent registered public accounting firm determine that our internal control over financial reporting is not effective as defined under Section 404, investor perceptions of our company may be adversely affected and could cause a decline in the market price of our stock.
29
Table of Contents
Changes in current laws or regulations or the imposition of new laws or regulations could impede the sale of our products or otherwise harm our business.
Wireless networks can only operate in the frequency bands, or spectrum, allowed by regulators and in accordance with rules governing how the spectrum can be used. The Federal Communications Commission, or FCC, in the U.S., as well as regulators in foreign countries, have broad jurisdiction over the allocation of frequency bands for wireless networks. We therefore rely on the FCC and international regulators to provide sufficient spectrum and usage rules. For example, countries such as China, Japan or Korea heavily regulate all aspects of their wireless communications industries, and may restrict spectrum allocation or usage, or may impose requirements that render our products or our customers’ products unmarketable in these jurisdictions. If this were to occur, it would make it difficult for us to sell our products in that region. In addition, some of our chipsets operate in the 5 gigahertz, or GHz, band, which is also used by government and commercial services such as military and commercial aviation. The FCC and European regulators have traditionally protected government uses of the 5 GHz bands by setting power limits and indoor and outdoor designation and requiring that wireless local area networking devices not interfere with other users of the band such as government and civilian satellite services.
In addition, devices for PLC, including those containing our products, are subject to various U.S. and foreign governmental regulations, including regulations regarding transmission power, permissible frequencies of operation, electromagnetic interference and electrical wiring. These regulations and the interpretation and enforcement of the regulations may vary from country to country and are subject to change. For example, in the U.S., rules governing power limits and measuring techniques for broadband over powerline devices have been adopted by the FCC. The U.S. Court of Appeals for the District of Columbia recently ordered the FCC to review its “access” broadband over powerline rules, which govern systems installed and operated by an electric utility on the supply side of the customer’s premises. If, in response to this ruling or otherwise, the FCC were to amend the access or in-home broadband over powerline rules, we could experience a material adverse effect on our business, results of operations and financial condition. In most countries outside of the U.S. regulations governing PLC devices are generally based upon standards adopted by International Electrotechnical Commission/Comité International Spécial des Perturbations Radioélectriques, or IEC/CISPR. The IEC/CISPR rules and test procedures on PLC are currently in a state of flux, and there is no guarantee that favorable IEC/CISPR standards will eventually be adopted. In the absence of adoption of IEC/CISPR or other international standards, PLC regulations are based upon specific country requirements. In some countries, including Japan, the regulations limit use of PLC to in-home devices, thereby prohibiting use of broadband over the power grid, and require in-home transmission power levels that are below those permitted in the U.S. Other countries may require that certain frequency bands, such as those used for search and rescue, be filtered out of the spectrum being used for PLC, which reduces throughput.
Products containing our powerline solutions may also be subject to regulations specifying the maximum amount of electric current that the product may use when in operation, in standby mode or not in use. These provisions, which are intended to promote power conservation, are sometimes referred to as “code of conduct” regulations. If our PLC products do not allow a product manufacturer to meet applicable code of conduct regulations for a product, if our competitors offer PLC products with lower power consumption, or if we were required to redesign a product to meet new code of conduct or other power consumption requirements, our business could be harmed.
GPS technology is restricted and its export is controlled. Our business may be impacted by both domestic and international regulations because our technology relies on the GPS satellite network and radio frequency bands. For example, the U.S. government may restrict specific uses of GPS technology in some applications for privacy or other reasons and block the civilian GPS signal at any time or in hostile areas. In December 2004, the President of the U.S. authorized a new national policy that established guidance and implementation actions for space-based positioning, navigation, timing programs, augmentations and activities for U.S. national and homeland security, civil, scientific, and commercial purposes with which our products comply.
Further, radio frequency bands are globally allocated for radio navigation satellite services. International allocations of radio frequency bands are made by the International Telecommunications Union, a specialized technical agency of the United Nations. These allocations are also governed by radio regulations that have treaty status and are subject to modification every two to three years by the World Radio Communication Conference. Further, the FCC continually receives proposals for new technologies and services that may seek to operate in, or across, the radio frequency bands currently used by GPS and other public services.
Changes in current laws or regulations, reversal of usage rights, changes in the interpretation or testing methods used to demonstrate compliance with the regulations, or the imposition of new laws and regulations in the U.S. or elsewhere that regulate our products or our customers’ products or the industries in which we operate may materially and adversely impact the sale of our products and our business, financial condition and results of operations.
30
Table of Contents
Personal privacy concerns may limit the growth of the high-volume consumer and commercial GPS-based applications and demand for our GPS products.
GPS-based consumer and commercial applications rely on the ability to receive, analyze and store location information. Consumers may not accept some GPS applications because of the fact that their location can be tracked by others and that this information could be collected and stored. Also, federal and state governments may disallow specific uses of GPS technology for privacy or other reasons or could subject this industry to regulation. If consumers view GPS-based applications as a threat to their privacy, demand for some GPS-based products could decline.
Rapidly changing standards could make our products uncompetitive or obsolete, which would cause our operating results to suffer.
The emergence of markets for our chipsets is affected by a variety of factors beyond our control. In particular, some of our products are designed to conform to standards set by industry standards bodies and alliances such as the IEEE, the Bluetooth Special Interest Group and the HomePlug Powerline Alliance. We also depend on industry groups such as the WiFi Alliance to certify and maintain certification of our products. If our customers adopt new or competing industry standards with which our products are not compatible, or such industry groups fail to adopt standards with which our products are compatible, our existing products would become less desirable to our customers, our sales would suffer, and we could be required to make significant expenditures to develop new products. In addition, most of our powerline products are based upon specifications adopted by the HomePlug Powerline Alliance. The HomePlug Powerline Alliance could adopt changes to these specifications or adopt new or additional specifications that would require us to make changes to our products or develop new products in order to comply with the new specifications. In addition, other industry associations formed to promote PLC have already established their own specifications which conflict with the HomePlug specifications. Furthermore, other groups that have more international recognition as independent standards development organizations, such as the IEEE and the International Telecommunication Union (ITU), are also working on the adoption of powerline and anywire wireline communications standards that may be different from, and incompatible with, the HomePlug specifications used by most of our powerline products. For example, we do not believe that our HomePlug products would interoperate or coexist with the physical layer of the proposed G.hn anywire communications standard. We are unable to predict whether or when a G.hn standard will be ratified by the ITU or, if it is, the degree to which the final specification, or subsequent changes to the specification, will require us to make changes to our existing powerline products or to designs we have in progress.
Our use of standards-based technology reduces the value of our intellectual property and exposes us to additional competition.
As we believe that some of our customers and potential customers prefer to use products that are based on industry standards rather than proprietary technologies, we have in the past elected, and may in the future elect, to base our products on specifications approved by standards bodies or industry alliances and to have our intellectual property included in these specifications. The applicable standards bodies and alliances typically require that participating companies license their necessary patent claims on non-exclusive, reasonable and non-discriminatory terms to other members, including competitors, who elect to produce products compliant with the applicable standard. For example, as a contributor member of the HomePlug Powerline Alliance, we are obligated to license our necessary patent claims on non-exclusive, reasonable and non-discriminatory terms to other HomePlug Powerline Alliance members, including competitors, who elect to produce products compliant with the HomePlug specifications, as well as any future HomePlug specifications, to the extent that the necessary claims are needed to allow compatibility. We have similar obligations with respect to technology contributed to other standards bodies and industry alliances. If we are successful in having our intellectual property included in additional industry standards, the scope of these licensing obligations could increase. These obligations to license our necessary patent claims may allow our competitors to use our patents to develop and sell products that compete with our products without spending the time and expense that we incurred to develop the technology covered by the patents, thereby potentially reducing any time to market advantage we might have as a result of these patents. These obligations also substantially restrict and may eliminate our ability to use our patents as a barrier to entry or as a significant source of revenue. Moreover, because the specifications for these industry standards are generally available to members of the applicable standards bodies and alliances for little or no cost, competitors can more easily create ICs that compete with our products.
If our customers or the industries using wireless technology prefer to integrate wireless capability into other products in which we do not specialize, we may not be able to compete effectively and we will lose customers and our revenue will decline and our business will be harmed.
Currently, we maintain wireless technology on a chipset that is separate from functionality contained on other chips within a product. Our customers or the industries using wireless technology may prefer to integrate wireless capability into other products such as DSL modems or cellular basebands, or determine that an integrated chip with multiple functionality results in products that perform better or are less expensive or more efficient to manufacture. If wireless functionality becomes commonly integrated with other functionality, the market for our products may decline. Consequently, we may miss product cycles in order to redesign our products,
31
Table of Contents
and we may not be able to forge strategic relationships necessary in order to design and arrange for the production of chips that include multiple functionality. If we miss product cycles, we will lose customers, our revenue will decline and our business will be harmed.
The proliferation of wireless devices may expand beyond the capacity of the channels available in the 2.4GHz or 5 GHz bands, which may overload the networks and result in decreased market demand for our products.
WLAN currently operates in the 2.4 GHz or 5 GHz bands, within which there are a limited number of channels available for use. The increasing number of wireless devices and networks may overburden the frequency bands and overload the networks. Recent studies have predicted that congestion in the 2.4 GHz band could result from the increasing number of wireless devices using that band with limited channel availability. If this occurs, our customers or the industries in which we operate may be adversely affected because the networks become inoperable or because only a limited number of devices will be able to access the networks. In turn, we may experience a decrease in market demand for our products that would adversely impact our business and results of operations.
Because the NASDAQ Global Select Market is likely to continue to experience extreme price and volume fluctuations, the price of our stock may decline.
Since we completed our initial public offering in February 2004, the market price of our shares has been and likely will continue to be highly volatile and could be subject to wide fluctuations in response to numerous factors, including the following:
| • | actual or anticipated variations in our quarterly operating results or those of our competitors; |
| • | announcements by us or our competitors of new products or technological innovations; |
| • | introduction and adoption of new industry standards; |
| • | changes in financial estimates or recommendations by securities analysts; |
| • | changes in the market valuations of our competitors; |
| • | announcements by us or our competitors of significant acquisitions or partnerships; and |
| • | sales of our common stock. |
Many of these factors are beyond our control and may negatively impact the market price of our common stock, regardless of our performance. In addition, the stock market in general, and the market for technology and semiconductor companies in particular, have been highly volatile. Our common stock may not trade at the same levels of shares as that of other semiconductor and technology companies, and shares of semiconductor and technology companies, in general, may not sustain their current market prices. In the past, securities class action litigation has often been brought against a company following periods of volatility in the market price of its securities. We may be the target of similar litigation in the future. Securities litigation could result in substantial costs and divert management’s attention and resources, which could seriously harm our business and operating results.
Our ability to raise capital in the future may be limited and our failure to raise capital when needed could prevent us from executing our growth strategy.
We believe that our existing cash and cash equivalents will be sufficient to meet our anticipated cash needs for at least the next 12 months. The timing and amount of our working capital and capital expenditure requirements may vary significantly depending on numerous factors, including:
| • | market acceptance of our products; |
| • | the need to adapt to changing technologies and technical requirements; |
| • | the existence of opportunities for expansion; and |
| • | access to and availability of sufficient management, technical, marketing and financial personnel. |
If our capital resources are insufficient to satisfy our liquidity requirements or should we require additional capital in order to execute acquisitions, we may seek to sell additional equity securities or debt securities or obtain debt financing. The sale of additional equity securities or convertible debt securities would result in additional dilution to our stockholders. Additional debt would result in increased expenses and could result in covenants that would restrict our operations. We have not made arrangements to obtain additional financing and there is no assurance that financing, if required, will be available in amounts or on terms acceptable to us, if at all.
32
Table of Contents
Delaware law and our corporate charter and bylaws contain anti-takeover provisions that could delay or discourage takeover attempts that stockholders may consider favorable.
Provisions in our certificate of incorporation may have the effect of delaying or preventing a change of control or changes in our management. These provisions include the following:
| • | the right of the board of directors to elect a director to fill a vacancy created by the expansion of the board of directors; |
| • | the establishment of a classified board of directors requiring that not all members of the board be elected at one time; |
| • | the prohibition of cumulative voting in the election of directors which would otherwise allow less than a majority of stockholders to elect director candidates; |
| • | the requirement for advance notice for nominations for election to the board of directors or for proposing matters that can be acted upon at a stockholders’ meeting; |
| • | the ability of the board of directors to alter our bylaws without obtaining stockholder approval; |
| • | the ability of the board of directors to issue, without stockholder approval, up to 10,000,000 shares of preferred stock with terms set by the board of directors, which rights could be senior to those of common stock; |
| • | the required approval of holders of at least two-thirds of the shares entitled to vote at an election of directors to adopt, amend or repeal our bylaws or amend or repeal the provisions of our certificate of incorporation regarding the election and removal of directors and the ability of stockholders to take action; |
| • | the required approval of holders of at least two-thirds of the shares entitled to vote at an election of directors to remove directors for cause; and |
| • | the elimination of the right of stockholders to call a special meeting of stockholders and to take action by written consent. |
In addition, because we are incorporated in Delaware, we are governed by the provisions of Section 203 of the Delaware General Corporation Law. These provisions may prohibit large stockholders, in particular those owning 15% or more of our outstanding voting stock, from merging or combining with us. These provisions in our certificate of incorporation, bylaws and under Delaware law could discourage potential takeover attempts and could reduce the price that investors might be willing to pay for shares of our common stock in the future and result in the market price being lower than it would without these provisions.
| Item 1B. | Unresolved Staff Comments |
None.
| Item 2. | Properties |
Our corporate headquarters and primary research and development and operations facilities are located in Santa Clara, California under two building leases. The first lease commenced in July 2005 and expires in July 2010. The second lease commenced in January 2008 and expired in June 2009. We have extended this lease for a period of 13 months expiring in July 2010. We lease additional properties around the world and within the facilities of certain suppliers for use as research and development facilities, sales and support offices, warehouses and logistics centers and test facilities. The size and location of these properties change from time to time based on business requirements. We do not own any manufacturing facilities, and we contract and license to third parties the production and distribution of our chipsets, hardware and software. Our international sales and support offices are in locations within the countries and administrative regions of China, Germany, Hong Kong, Japan, Korea and Taiwan, and we have research and development facilities in California, Florida, Canada, China, Finland, India and Taiwan, and an administrative center in Macao. It will likely become necessary to lease or acquire additional or alternative space in the current year to accommodate future growth, and in particular we will need to extend our leases and secure additional space, or secure alternative space, for our headquarters and research and development facilities in Northern California prior to the expiration of our leases in July 2010.
| Item 3. | Legal Proceedings |
Wi-LAN Inc. v. Acer, Inc. et al. & Wi-LAN Inc. v. Westell Technologies, Inc. et al.
On October 31, 2007, Wi-LAN, Inc. filed two complaints against us and thirteen of our direct and indirect customers in the U.S. District Court for the Eastern District of Texas, Marshall Division. In the complaint, Wi-LAN alleges that certain of our products infringe U.S. patent numbers 5,282,222 and RE37,802. Wi-LAN seeks unspecified damages and other relief. We believe that we have meritorious defenses to such allegations and intend to defend these lawsuits vigorously. We have answered the complaints, denying all allegations and asserting affirmative defenses. We also asserted counterclaims requesting declaratory judgment for non-infringement and invalidity. While we believe we have meritorious defense against Wi-LAN’s claim, there can be no assurance that we will be successful in such defense.
33
Table of Contents
Broadcom Corporation and Atheros Communications, Inc. v. Wi-LAN, Inc.
On December 10, 2008, we and Broadcom filed a complaint for declaratory judgment against Wi-LAN, Inc. in the U.S. District Court for Northern District of California, requesting the court to declare, among other things, that U.S. patent number 6,549,759, or the ‘759 Patent, assigned to Wi-LAN is invalid, unenforceable and that we do not infringe any valid claims of the ‘759 Patent. This declaratory judgment action stemmed from Wi-LAN’s threat to add this patent into the complaints filed by Wi-LAN against Atheros and others, now pending in the Eastern District of Texas. Similar declaratory judgment actions were filed by a number of other companies against Wi-LAN. More recently, our declaratory action against Wi-LAN has been transferred to the U.S. District Court for the Eastern District of Texas. There can be no assurance that we will be successful in seeking declaratory relief from Wi-LAN’s threat.
Atheros Communications, Inc. v. Lehman Brothers, Inc.
On January 30, 2009, we filed a Proof of Claim in the U.S. Bankruptcy Court for the Southern District of New York against Lehman Brothers, Inc. seeking compensatory damages incurred in connection with Lehman Brothers’ investment of our cash in auction-rate securities and resulting losses of income and liquidity, as well as punitive damages. On the same day and for related reasons, we filed a Customer Claim against Lehman Brothers with the federal Securities Investor Protection Corporation. There can be no assurance that we will obtain compensation for our claims.
PACid Group, LLC v. Apple Inc. et al.
On March 30, 2009, PACid Group, LLC, or PACid, filed a complaint against us and 18 other defendants in the U.S. District Court for the Eastern District of Texas, Tyler Division. In the complaint, PACid alleges that certain of our products infringe U.S. Patent Numbers 5,963,646 and 6,049,612 which relate to generation of encryption keys and methods of protecting information files using such keys. PACid seeks unspecified damages and other relief. We have answered the complaints, denying all allegations and asserting affirmative defenses. We also asserted counterclaims requesting declaratory judgment for non-infringement and invalidity. However, there can be no assurance that we will be successful in such defense.
Broadcom Corporation et al. v. Commonwealth Scientific and Industrial Research Organisation
On November 10, 2009, we and Broadcom filed a complaint for declaratory judgment against Commonwealth Scientific and Industrial Research Organisation, or CSIRO, in the U.S. District Court for Eastern District of Texas, requesting the court to declare, among other things, that U.S. patent number 5,487,069, or the “069 Patent, assigned to CSIRO is invalid, unenforceable and that we do not infringe any valid claims of the ‘069 Patent. There can be no assurance that we will be successful in seeking declaratory relief from CSIRO’s threat.
Lonestar Inventions, LP. V. Atheros Communications, Inc et al.
On February 4, 2010, Lonestar Inventions, LP filed a complaint against us and PMC-Sierra, Inc. in the United States District Court for the Eastern District of Texas, Tyler Division. In the complaint, Lonestar Inventions alleges that one of our products infringes U.S. Patent Number 5,208,725. Lonestar Inventions seeks unspecified damages and other relief. While we have undertaken an analysis of the patent, we have not yet answered the complaint.
For an additional discussion of certain risks associated with legal proceedings, see the section entitled “Risk Factors” in Item 1A of this Report.
| Item 4. | Submission of Matters to a Vote of Security Holders |
No matters were submitted to a vote of security holders during the quarter ended December 31, 2009.
34
Table of Contents
| Item 5. | Market for Registrant’s Common Equity, Related Stockholder Matters and Issuer Purchases of Equity Securities |
Market Information
Our shares of common stock are traded on the NASDAQ Global Select Market under the symbol “ATHR.” The following table shows, for the periods indicated, the high and low intra-day sale prices for our common stock on the NASDAQ Global Select Market.
| Year ended December 31, 2008 | ||||||
| High | Low | |||||
| First Quarter |
$ | 30.71 | $ | 20.17 | ||
| Second Quarter |
$ | 34.55 | $ | 21.78 | ||
| Third Quarter |
$ | 34.75 | $ | 21.70 | ||
| Fourth Quarter |
$ | 23.67 | $ | 11.26 | ||
| Year ended December 31, 2009 | ||||||
| High | Low | |||||
| First Quarter |
$ | 16.18 | $ | 11.49 | ||
| Second Quarter |
$ | 19.60 | $ | 14.36 | ||
| Third Quarter |
$ | 29.05 | $ | 18.16 | ||
| Fourth Quarter |
$ | 34.68 | $ | 24.18 | ||
As of February 9, 2010, the number of record holders of our common stock was 136. Because most of our shares are held by brokers and other institutions on behalf of stockholders, we are unable to estimate the total number of beneficial stockholders represented by these record holders.
Dividends
We have never declared or paid a cash dividend on our common stock and do not anticipate paying any cash dividends in the foreseeable future. Any future determination with respect to the declaration and payment of dividends will be at the discretion of our Board of Directors.
Securities Authorized for Issuance under Equity Compensation Plans
Information regarding the securities authorized for issuance under our equity compensation plans can be found under Item 12 of this Annual Report on Form 10-K.
35
Table of Contents
Stock Performance Graph
The graph below compares the cumulative total stockholder return on our common stock with the cumulative total return on The NASDAQ Composite Index and The Philadelphia Semiconductor Index. The period shown commences on December 31, 2004 and ends on December 31, 2009, the end of our last fiscal year. The graph assumes an investment of $100 on December 31, 2004, and the reinvestment of any dividends.
The comparisons in the graph below are required by the Securities and Exchange Commission and are not intended to forecast or be indicative of possible future performance of our common stock.
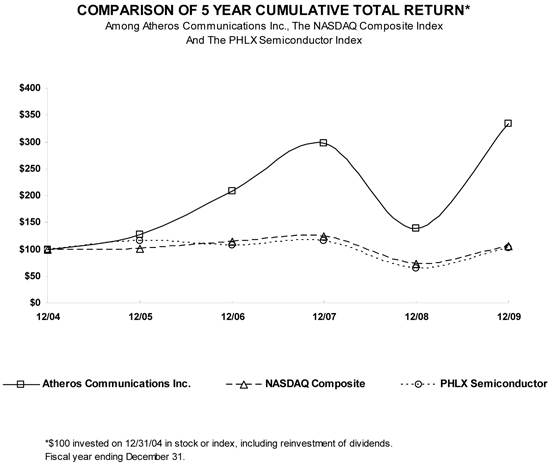
36
Table of Contents
| Item 6. | Selected Financial Data |
The following selected consolidated financial data should be read in conjunction with the consolidated financial statements and the notes to the consolidated financial statements and “Management’s Discussion and Analysis of Financial Condition and Results of Operations,” which are included elsewhere in this report.
| Year Ended December 31, | |||||||||||||||||||
| In thousands, except per share data |
2009 | 2008 | 2007 | 2006 | 2005 | ||||||||||||||
| Consolidated Statements of Operations Data: |
|||||||||||||||||||
| Net revenue |
$ | 542,468 | $ | 472,396 | $ | 416,960 | $ | 301,691 | $ | 183,485 | |||||||||
| Cost of goods sold(1) |
278,865 | 236,431 | 209,579 | 157,918 | 102,483 | ||||||||||||||
| Gross profit |
263,603 | 235,965 | 207,381 | 143,773 | 81,002 | ||||||||||||||
| Operating expenses: |
|||||||||||||||||||
| Research and development(1) |
130,592 | 121,565 | 100,936 | 71,084 | 47,788 | ||||||||||||||
| Sales and marketing(1) |
59,315 | 51,154 | 38,010 | 27,189 | 17,358 | ||||||||||||||
| General and administrative(1) |
29,414 | 25,109 | 21,189 | 15,315 | 10,306 | ||||||||||||||
| Amortization of acquired intangible assets |
11,570 | 12,231 | 7,402 | 1,484 | — | ||||||||||||||
| Acquisition-related charges |
10,534 | — | — | — | — | ||||||||||||||
| Acquired in-process research and development |
— | — | 4,897 | 10,836 | — | ||||||||||||||
| Total operating expenses |
241,425 | 210,059 | 172,434 | 125,908 | 75,452 | ||||||||||||||
| Income from operations |
22,178 | 25,906 | 34,947 | 17,865 | 5,550 | ||||||||||||||
| Interest income, net |
6,004 | 8,878 | 11,516 | 8,659 | 4,854 | ||||||||||||||
| Impairment of long-term investments |
(2,018 | ) | (15,490 | ) | (2,277 | ) | — | — | |||||||||||
| Income before income taxes |
26,164 | 19,294 | 44,186 | 26,524 | 10,404 | ||||||||||||||
| Income tax benefit (provision) (2) |
20,243 | (422 | ) | (4,206 | ) | (7,846 | ) | 6,284 | |||||||||||
| Net income |
$ | 46,407 | $ | 18,872 | $ | 39,980 | $ | 18,678 | $ | 16,688 | |||||||||
| Basic net income per share |
$ | 0.75 | $ | 0.32 | $ | 0.71 | $ | 0.36 | $ | 0.34 | |||||||||
| Diluted net income per share |
$ | 0.73 | $ | 0.30 | $ | 0.67 | $ | 0.34 | $ | 0.31 | |||||||||
| Shares used in computing basic net income per share |
62,040 | 59,804 | 55,917 | 51,760 | 48,777 | ||||||||||||||
| Shares used in computing diluted net income per share |
63,933 | 62,070 | 59,330 | 55,494 | 53,572 | ||||||||||||||
| December 31, | |||||||||||||||||||
| In thousands |
2009 | 2008 | 2007 | 2006 | 2005 | ||||||||||||||
| Consolidated Balance Sheet Data: |
|||||||||||||||||||
| Cash, cash equivalents and short-term marketable securities |
$ | 402,235 | $ | 293,758 | $ | 219,544 | $ | 185,906 | $ | 173,645 | |||||||||
| Working capital |
416,560 | 341,844 | 252,283 | 204,465 | 190,399 | ||||||||||||||
| Long-term investments |
15,523 | 16,963 | 30,453 | — | — | ||||||||||||||
| Total assets |
915,349 | 615,708 | 522,137 | 364,058 | 239,179 | ||||||||||||||
| Total stockholders’ equity |
731,860 | 471,478 | 401,457 | 280,942 | 196,966 | ||||||||||||||
| (1) | Prior to 2006, we elected to follow the intrinsic value-based method rather than adopting the alternative fair value accounting method. Therefore, we did not record any compensation expense for stock options we granted to our employees where the exercise price equaled the fair market value of the stock on the date of grant and the exercise price, number of shares eligible for issuance under the options and vesting period were fixed. During 2006, we adopted the fair value recognition provisions of the Financial Accounting Standards Board’s, or FASB’s, updated accounting guidance related to stock based compensation using the modified prospective application method. |
| (2) | During 2009, we recorded a tax benefit of $21.7 million related to the favorable settlement of a foreign tax liability resulting from a prior acquisition. In 2008, we recorded a tax benefit of $1.1 million from a change in a state tax filing position. During 2007, 2006 and 2005, we recorded an income tax benefit of $3.0 million, $1.9 million and $7.5 million, respectively, related to the release of a portion of the valuation allowance previously recorded against our deferred tax assets. |
37
Table of Contents
| Item 7. | Management’s Discussion and Analysis of Financial Condition and Results of Operations |
Overview
We are a global leader in innovative technologies for wireless and wired communications products that are used by a broad base of customers, including manufacturers of personal computers, or PCs, networking equipment and consumer electronics devices. We combine our wireless and wired systems and software expertise with our high-performance radio frequency, or RF, mixed signal and digital semiconductor design skills to provide highly integrated chipsets that are manufactured on low-cost, standard complementary metal-oxide semiconductor, or CMOS, processes. Our ability to design radios in semiconductors using standard CMOS processes provides us with increased manufacturing flexibility and, we believe, a competitive advantage. Our product portfolio includes solutions for WLAN, Mobile WLAN, PLC, Ethernet, Bluetooth and GPS.
An element of our business strategy involves the acquisition of businesses, assets, products or technologies that allow us to reduce the time required to develop new technologies and products and bring them to market, incorporate enhanced functionality into and complement our existing product offerings, augment our engineering workforce, and enhance our technological capabilities. We plan to continue to evaluate strategic opportunities as they arise, including acquisitions and other business combination transactions, strategic partnerships and the purchase or sale of assets. The acquisitions made in 2009, 2008 and 2007 were as follows:
| • | Intellon, a public U.S. fabless semiconductor company, specializing in PLC solutions, which we acquired in December 2009; |
| • | u-Nav, a privately held fabless semiconductor company based in California specializing in GPS solutions and software that enable mobile location-based products and services, substantially all of which was acquired in December 2007; and |
| • | Attansic, a Taiwan-headquartered, provider of Fast and Gigabit Ethernet solutions to the personal computing and networking markets, substantially all of which we acquired in December 2006 and the remainder in November 2007. |
The accompanying consolidated financial statements include the results of operations of the acquired companies commencing on their respective acquisition dates. The revenue and operating results contributed by Intellon during 2009 were not material. See Note 2 of Notes to Consolidated Financial Statements for information related to these acquisitions.
The semiconductor industry in which we operate is highly cyclical and has, from time to time, experienced significant downturns, often connected with, or in anticipation of, maturing product cycles of both semiconductor companies’ and their customers’ products and declines in general economic conditions. The industry experienced a significant downturn during the recent global recession. These downturns are frequently characterized by decreases in product demand, excess customer inventories, and accelerated erosion of prices. These factors could cause substantial fluctuations in the revenue and results of our operations as evidenced by the 29% and 11% sequential decreases in our revenue during the fourth quarter of 2008 and the first quarter of 2009, respectively. In addition, during these downturns some competitors may become more aggressive in their pricing practices, which would adversely impact our gross profits. Any downturns in the semiconductor industry may be severe and prolonged, and any failure of the industry or wired and wireless communications markets to fully recover from downturns could negatively impact the revenue, business, financial condition and our results of operations. The semiconductor industry also periodically experiences increased demand and production capacity constraints, which may affect our ability to ship sufficient products to meet our customers’ purchase requests. Accordingly, our operating results may vary significantly as a result of the general conditions in the semiconductor industry, which could cause large fluctuations in our stock price. Although conditions in the semiconductor industry have recently improved and we have experienced sequential revenue growth during the second, third and fourth quarters of 2009, there is no assurance that this trend will continue or at what rate.
Revenue. Our revenue is derived primarily from the sale of wired and wireless chipsets. Our sales have historically been made on the basis of purchase orders rather than long-term agreements. Original equipment manufacturers, or OEMs, utilize our chipsets in developing their wireless and wired system solutions such as access points, routers, wired and wireless switches, embedded laptop clients, handsets, cardbus, minicards, hand-held and console video game devices, set-top boxes, powerline adapters and PNDs. Some OEMs purchase chipsets directly from us and manufacture their products. Other OEMs utilize original design manufacturers, or ODMs, to design and build subsystem products that the OEM then purchases from the ODM and incorporates into the OEM’s system solution. Accordingly, we ship our products either directly to the OEM or to the ODM based on the requirements of each OEM. Purchase orders are received from an OEM or an ODM and we generally recognize revenue based on the shipment of chipsets to this customer. A single ODM usually provides our chipsets to numerous OEMs. However, we attempt to maintain a close relationship with the target OEM to monitor end-market demand. Due to the use of ODMs, our direct customer base is relatively concentrated, although we believe that the number of total OEMs who purchase our chipsets through ODMs is broader. We anticipate that we may continue to experience changes in our ODM customer base as our end customers change ODMs for a variety of reasons while still using our chipsets.
We provide customer incentives to some of our direct and indirect customers. These obligations are estimated and recorded as a reduction of revenue when we ship product to the customers based on approved quotes provided to the customer. Estimating incentive amounts requires that we make estimates regarding the percentage of committed incentives that will be submitted by our customers and the value of the incentives at the time of redemption. These estimates are adjusted on a quarterly basis to reflect actual sales data submitted by customers. These adjustments may have the effect of significantly increasing or decreasing net revenue in particular periods.
38
Table of Contents
We defer recognition of revenue and the related cost of goods sold on shipments to distributors that have rights of return or price protection privileges on unsold products until the products are sold by the distributors to their customers. Price protection rights grant distributors the right to a credit in the event of declines in the price of our products. As of December 31, 2009, we did not conduct any business with customers that had arrangements providing them with rights of return, other than for normal warranty returns, or price protection that would have required deferral of revenues upon shipment.
During the year ended December 31, 2009, Hon Hai Precision Industry Co. Ltd and Nintendo Co., Ltd. accounted for 17% and 13% of our net revenue, respectively. During the year ended December 31, 2008 and 2007, Hon Hai Precision Industry Co. Ltd accounted for 19% and 25% of our net revenue, respectively. We expect to continue to have major concentrations of sales to a relatively small number of ODM and OEM customers.
Substantially all of our sales are to customers outside the U.S. and Canada. Sales to customers in Asia accounted for 87%, 90% and 97% of net revenue in the years ended December 31, 2009, 2008 and 2007, respectively. Because many of our ODM customers are located in Asia, we anticipate that a majority of our revenue will continue to come from sales to customers in that region. Although a large percentage of our sales are made to customers in Asia, we believe that a significant number of the systems designed by these customers are then sold through to OEMs outside of Asia. All of our sales are denominated in U.S. dollars.
Cost of Goods Sold. Cost of goods sold relates primarily to the purchase of silicon wafers, costs associated with assembly, test and inbound and outbound shipping of our chipsets, fluctuations in the price of raw materials such as gold used in the manufacturing of our chips, costs of personnel, materials and occupancy associated with manufacturing support and quality assurance, royalty costs and write downs to state inventory at the lower of cost or market caused by product obsolescence and transitions from older to newer products. Additionally, our cost of goods sold includes accruals for estimated warranty obligations, which we record when revenue is recognized. Estimated warranty obligations are adjusted each period to reflect actual warranty experience. Because we do not have long-term, fixed supply agreements, our wafer, assembly and test costs are subject to changes based on the cyclical demand for semiconductors. In addition, after we purchase wafers from foundries, we also typically bear the yield risk related to manufacturing these wafers into finished goods.
Research and Development. Research and development expense relates primarily to compensation and associated costs related to research and development employees and contractors, mask and reticle costs, prototype wafers, software and computer-aided design software licenses, intellectual property license costs, reference design development costs, development testing and evaluation costs, regulatory testing costs, depreciation expense and allocated occupancy costs. All research and development costs are expensed as incurred.
Sales and Marketing. Sales and marketing expense relates primarily to compensation and associated costs for marketing and sales personnel, sales commissions to independent sales representatives, public relations, promotional and other marketing expenses, expenses for travel, trade shows, depreciation and amortization and allocated occupancy costs.
General and Administrative. General and administrative expense relates primarily to compensation and associated costs for general and administrative personnel, legal and professional fees, charges related to allowance for doubtful accounts, depreciation and amortization and allocated occupancy costs.
Amortization of Acquired Intangible Assets. Amortization of acquired intangible assets relates to acquired identified intangible assets, which are amortized on a straight-line basis over the estimated economic lives of three to five years for purchased technology, two to seven years for customer relationships and two to four years for covenants-not-to-compete.
Acquisition-Related Charges. Acquisition-related charges include expenses incurred in connection with our acquisition activities including legal and accounting costs, investment banking costs, government filing fees and severance and stock-based compensation costs related to employees terminated post acquisition. Beginning January 1, 2009, as a result of changes in accounting standards (see Note 2 of Notes to the Consolidated Financial Statements), acquisition-related costs are recognized separately from the acquisition consideration and are expensed as incurred. Previously, acquisition-related transaction costs were capitalized as part of the purchase price.
Interest Income and Expense. Interest income consists of interest earned on cash and cash equivalents and investment balances and realized gains or losses from the sale of marketable securities and auction-rate securities.
Impairment of Long-Term Investments. Impairment of long-term investments relates to the other-than-temporary, non-operating write down of the carrying value of our investments in auction-rate securities and the related perpetual, non-cumulative preferred stock, or Preferred Stock, that resulted from the involuntarily exchange of certain auction-rate securities; these auction-rate securities were rated AAA and AA at the date of purchase. The liquidity and fair value of these securities has been negatively impacted by the failure of these markets and the exposure of these securities to the financial condition of bond insurance companies. All of our auction-rate securities have been subject to multiple auction processes for which there have been insufficient bidders on the scheduled
39
Table of Contents
rollover dates and the auctions have subsequently failed. The investment bank that organized the auctions for these securities filed for bankruptcy during the three months ended September 30, 2008, and since such time, no auctions have occurred. Additionally, there is currently no market for the Preferred Stock we hold. Therefore, we have used a discounted cash flow model to estimate the fair value of these investments as of December 31, 2009. To date, we have determined that, for our auction-rate securities and Preferred Stock, other-than-temporary-impairment, or OTTI, has occurred and we intend to sell these investment securities prior to recovery and therefore, we have recorded OTTI charges as a reduction to earnings.
Provision for Income Taxes. We make certain estimates and judgments in determining income tax expense for financial statement purposes. These estimates and judgments occur in the calculation of certain tax assets and liabilities, which arise from differences in the timing of recognition of revenue and expenses for tax and financial statement purposes and the realizability of assets in future years.
Critical Accounting Policies and Estimates
Our discussion and analysis of our financial condition and the results of operations are based on our financial statements which have been prepared in accordance with U.S. generally accepted accounting principles. The preparation of these financial statements requires us to make estimates and judgments that affect the reported amounts of assets, liabilities, revenue and expenses. We base our estimates on historical experience and on various other assumptions that we believe to be reasonable under the circumstances, the results of which form the basis for making judgments about the carrying values of assets and liabilities that are not readily apparent from other sources. Actual results may differ from these estimates under different assumptions or conditions. Our critical accounting policies are set forth below.
Revenue Recognition. We derive revenue primarily from the sale of our communication ICs. We recognize revenue at the time the following criteria are met: (1) persuasive evidence of an arrangement exists; (2) delivery has occurred or services have been rendered; (3) the fee is fixed or determinable; and (4) collectibility is reasonably assured. Determination of criteria (3) and (4) are based on management’s judgment regarding the fixed nature of the fee charged for the products delivered and the collectibility of those fees. Should changes in conditions cause management to determine these criteria are not met for certain future transactions, revenue recognized for any reporting period could be adversely impacted.
We provide incentives to some of our direct and indirect customers. These obligations are estimated and recorded as a reduction of revenue at the time at which we ship product to the customers. Estimated incentive amounts are recorded as a reduction of revenue and are based on agreements between us and our customers. Estimating incentive amounts requires that we make estimates regarding the percentage of committed incentives that will be submitted by our customers and the value of the incentives at the time of redemption. These estimates may require revisions at later dates if the actual claims submitted by the customers differ significantly from the original estimates, which may have the effect of increasing or decreasing net revenue and gross profit as a percentage of revenue in a particular period.
We defer recognition of revenue and the related cost of goods sold on shipments to distributors that have rights of return or price protection privileges on unsold products until the products are sold by the distributor to its customers. Price protection rights grant distributors the right to a credit in the event of declines in the price of our products. As of December 31, 2009, we did not conduct any business with customers that had arrangements providing them with rights of return, other than for normal warranty returns, or price protection that would have required deferral of revenues upon shipment.
Fair Value of Financial Instruments. Our financial instruments consist primarily of cash and cash equivalents, marketable securities, auction-rate securities, accounts receivable and accounts payable. We believe that the carrying amounts of the financial instruments approximate their respective fair values. We regularly review our investment portfolio to identify and evaluate investments that have indications of possible impairment. Factors considered in determining whether a loss is temporary include: the length of time and extent to which fair value has been lower than the cost basis; the financial condition, credit quality and near-term prospects of the investee; and whether it is more likely than not that we will be required to sell the security prior to any anticipated recovery in fair value. When there is no readily available market data, we may make fair value estimates, which may not necessarily represent the amounts that could be realized in a current or future sale of these assets.
Marketable Securities. We classify marketable securities as available-for-sale. We view our available-for-sale-portfolio as available for use in current operations. Accordingly, we have classified all investments with a readily available market as short-term, even though the maturity dates may be one year or more beyond the current balance sheet date, because of the intent to sell these securities prior to maturity to meet liquidity needs or as part of a risk management program. When we find that a readily available market does not currently exist for the securities, we classify these securities as long-term due to the potential inability to sell the securities within one year of the current balance sheet date.
Available-for-sale securities are recorded at fair value, and we record temporary unrealized holding gains and losses as a separate component of accumulated other comprehensive income. We charge unrealized losses against net earnings when a decline in fair value is determined to be other-than-temporary. We review several factors to determine whether a loss is other-than-temporary. These factors include but are not limited to: (1) the length of time a security is in an unrealized loss position, (2) the extent to which
40
Table of Contents
fair value is less than cost, (3) the financial condition and near term prospects of the issuer and, (4) whether it is more likely than not that we will be required to sell the security prior to any anticipated recovery in fair value. Realized gains and losses are accounted for on the specific identification method.
Inventory Valuation. We continually assess the recoverability of our inventory based on assumptions about demand and market conditions. Forecasted demand is determined based on historical sales and expected future sales. We value our inventory at the lower of standard cost (which approximates actual cost on a first-in, first-out basis) or its current estimated market value. We reduce our inventory to the estimated lower of cost or market value to account for its obsolescence or lack of marketability. Reductions are calculated as the difference between the cost of inventory and the estimated market value based upon assumptions about future demand and market conditions. If actual market conditions are less favorable than those projected by management, additional inventory write-downs may be required that may adversely affect our operating results. If actual market conditions are more favorable, we may have higher gross margins when products are sold. Inventory reserves once established are not reversed until the related inventory has been sold or scrapped.
Stock-Based Compensation. We account for our stock-based compensation in accordance with the fair value recognition provisions of current authoritative guidance using the modified prospective application method. Under the modified prospective application method, compensation expense for stock-based awards granted by us as a public company prior to, but not yet vested as of January 1, 2006, is recorded in accordance with the fair value-based method. For stock-based awards granted before November 26, 2003 (the date on which we filed our registration statement for our initial public offering), we recorded compensation expense using the intrinsic value-based method. Stock-based compensation expense for all stock-based compensation awards granted after December 31, 2005 is based on the grant-date fair value estimated in accordance with the provisions of current authoritative guidance. Results for prior periods have not been restated. At December 31, 2009 there was $93.8 million of total unrecognized compensation cost related to non-vested compensation arrangements granted under all equity compensation plans, net of estimated forfeitures. We expect to recognize that cost over a weighted average period of 2.7 years.
We estimate the fair value of options granted using the Black-Scholes option valuation model and the assumptions used shown in Note 11 to the Consolidated Financial Statements in Item 8 of this Form 10-K. For 2006, 2007, and the first six months of 2008, we based our expected term on the expected terms used by similar entities since we did not have sufficient historical experience for determining the expected term of the stock option awards granted. For the final six months of 2008 and the first six months of 2009, we estimated the expected term based on our historical financial data and estimates of future option exercise activity, as well as the expected terms used by similar entities. For the final six months of 2009, we estimated expected term based on our historical financial data and estimates of future option exercise activity. For stock options assumed as a result of the Intellon acquisition in December 2009, expected term was calculated using the simplified method because we did not have sufficient historical exercise data related to the Intellon stock options to provide a reasonable basis upon which to estimate expected term. For options granted after December 31, 2005, we estimated volatility based on considerations of the implied volatility of long-term options traded on the open market and the average historical volatilities of our stock and those of similar entities. For the final six months of 2008 and all of 2009, we estimated the volatility of our common stock at the date of grant based entirely on considerations of the implied volatility of long-term options traded on the open market and our average historical volatilities.
Allowance for Doubtful Accounts. We perform ongoing credit evaluations of our customers and adjust credit limits and their credit worthiness, as determined by our review of current credit information. We continuously monitor collections and payments from our customers and maintain an allowance for doubtful accounts based upon our historical experience, our anticipation of uncollectible accounts receivable and any specific customer collection issues that we have identified. While our credit losses have historically been within our expectations and the allowance established, we might not continue to experience the same credit loss rates that we have in the past. Our receivables are concentrated in a relatively few number of customers. Therefore, a significant change in the liquidity or financial position of any one customer could make collection of our accounts receivable more difficult, require us to increase our allowance for doubtful accounts and negatively affect our working capital.
Product Warranty Provision. We provide for the estimated cost of product warranties at the time revenue is recognized. While we engage in extensive product quality programs and processes, including actively monitoring and evaluating the quality of our chipset suppliers, our warranty obligation is affected by product failure rates, the cost of replacement chipsets, rework and inbound and outbound freight costs incurred in replacing a chipset after failure. We continuously monitor chipset returns for warranty and maintain an accrual for the related warranty expenses based on historical experience of similar products as well as various other assumptions that we believe to be reasonable under the circumstances and we adjust the warranty accrual rate based on these actual experiences and specific expected obligations. When actual failure rates, cost of chipset replacement, rework and inbound and outbound freight costs differ from our estimates, revisions to the estimated warranty accrual are made. Any such revisions may have the effect of increasing or decreasing gross profit both in dollars and as a percentage of revenue in a particular period in which these estimates are adjusted.
Income Taxes. We account for income taxes under the asset and liability approach. We record a valuation allowance to reduce our net deferred tax assets to the amount that we believe is more likely than not to be realized. In assessing the need for a valuation allowance, we consider historical levels of income, projections of future income, expectations and risks associated with estimates of
41
Table of Contents
future taxable income, and ongoing prudent and practical tax planning strategies. To the extent we believe it is more likely than not that some portion of our deferred tax assets will not be realized, we would increase the valuation allowance against the deferred tax assets. Realization of our deferred tax assets is dependent primarily upon future U.S. taxable income. Our judgments regarding future profitability may change due to future market conditions, changes in U.S. or international tax laws and other factors. These changes, if any, may require possible material adjustments to these deferred tax assets, resulting in a reduction in net income or an increase in net loss in the period when such determinations are made.
We are subject to income taxes in the U.S. and foreign countries, and we are subject to routine corporate income tax audits in many of these jurisdictions. We believe that our tax return positions are fully supported, but tax authorities are likely to challenge certain positions, which may not be fully sustained. However, our income tax expense includes amounts intended to satisfy income tax assessments that result from these challenges. Determining the income tax expense for these potential assessments and recording the related assets and liabilities requires management judgment and estimates. We evaluate our uncertain tax positions and believe that our provision for uncertain tax positions, including related interest and penalties, is adequate based on information currently available to us. The amount ultimately paid upon resolution of audits could be materially different from the amounts previously included in income tax expense and therefore could have a material impact on our tax provision, net income and cash flows. Our provision for uncertain tax positions is attributable to uncertainties concerning the tax treatment of our international tax operations. Our overall provision requirement could change due to the issuance of new regulations or new case law, negotiations with tax authorities, resolution with respect to individual audit issues, or the entire audit, or the expiration of statutes of limitations.
Goodwill and Acquired Intangible Assets. We record goodwill when the consideration paid for an acquisition exceeds the fair value of net tangible and intangible assets acquired. We amortize acquisition-related identified intangibles on a straight-line basis over their estimated economic lives of three to five years for purchased technology, two to seven years for customer relationships and two to four years for covenants-not-to-compete.
We measure and test goodwill on an annual basis on October 31 or more frequently if we believe indicators of impairment exist. The performance of the test involves a two-step process. The first step requires comparing the fair value of the reporting unit to its net book value, including goodwill. For goodwill analysis, we operate under one reporting unit. We determine the fair value of the reporting unit by taking the market capitalization of the reporting unit as determined through quoted market prices. A potential impairment exists if the fair value of the reporting unit is lower than its net book value. The reporting unit was not at risk of failing step one of the annual goodwill impairment test for the years ended December 31, 2009 and 2008. We only perform the second step of the process if a potential impairment exists, and it involves determining the difference between the fair value of the reporting unit’s net assets other than goodwill to the fair value of the reporting unit and if the difference is less than the net book value of goodwill, impairment exists and is recorded. We have not been required to perform this second step of the process because the fair value of the reporting unit has exceeded the net book value at every measurement date.
Long-lived Assets. We account for long-lived assets, including other purchased finite-lived intangible assets, in accordance with current authoritative guidance, which requires impairment losses to be recorded on long-lived assets used in operations when indicators of impairment, such as reductions in demand or significant economic slowdowns in the semiconductor industry, are present. Reviews are performed to determine whether the carrying value of an asset is impaired, based on comparisons to undiscounted expected future cash flows. If this comparison indicates that there is impairment, the impaired asset is written down to fair value, which is typically calculated using: (1) quoted market prices or (2) discounted expected future cash flows. Impairment is based on the excess of the carrying amount over the fair value of those assets. Our estimates regarding future anticipated net revenue and cash flows, the remaining economic life of the products and technologies, or both, may differ from those used to assess the recoverability of assets. In that event, impairment charges or shortened useful lives of certain long-lived assets may be required, resulting in a reduction in net income or an increase to net loss in the period when such determinations are made. To date, we have not recorded any impairment losses on our long-lived assets.
Litigation and Settlement Costs. We are periodically involved in litigation and other legal proceedings. We prosecute and defend these matters aggressively. However, there are many uncertainties associated with any litigation, and we cannot assure that these actions or other third party claims against us will be resolved without costly litigation including any potential substantial settlement charges. In addition, the determination of intellectual property litigation may require us to pay damages for past infringement or to obtain a license under the opposing party’s intellectual property rights and pay license fees and royalties, which could adversely impact our profitability in future periods, or prevent us from selling certain of our products or to cease in the development of a certain type of technology. If any of those events were to occur, our business, financial condition and results of operations could be materially and adversely affected. We would record a charge equal to at least the minimum estimated liability for a loss contingency if information available prior to issuance of financial statements indicates that it is probable that an asset had been impaired or a liability had been incurred as of the date of the financial statements and the loss can be reasonably estimated. Actual liabilities in any such disputes or litigation may be materially different from our estimates, which could result in the need to record additional costs.
42
Table of Contents
Results of Operations
The following table shows the percentage relationships of the listed items from our consolidated statements of operations, as a percentage of net revenue for the periods indicated.
| Years Ended December 31, | |||||||||
| 2009 | 2008 | 2007 | |||||||
| Consolidated Statements of Operations Data: |
|||||||||
| Net revenue |
100 | % | 100 | % | 100 | % | |||
| Cost of goods sold |
51 | 50 | 50 | ||||||
| Gross profit |
49 | 50 | 50 | ||||||
| Operating expense: |
|||||||||
| Research and development |
24 | 26 | 24 | ||||||
| Sales and marketing |
11 | 11 | 9 | ||||||
| General and administrative |
6 | 5 | 5 | ||||||
| Amortization of acquired intangible assets |
2 | 3 | 2 | ||||||
| Acquisition-related charges |
2 | — | — | ||||||
| Acquired in-process research and development |
— | — | 1 | ||||||
| Total operating expenses |
45 | 45 | 41 | ||||||
| Income from operations |
4 | 5 | 9 | ||||||
| Interest income, net |
1 | 2 | 3 | ||||||
| Impairment of long-term investments |
— | (3 | ) | (1 | ) | ||||
| Income tax benefit (provision) |
4 | — | (1 | ) | |||||
| Net income |
9 | % | 4 | % | 10 | % | |||
Years Ended December 31, 2009 and 2008
(tables presented in thousands, except percentage amounts)
Net Revenue
| Years Ended December 31, |
% Change in 2009 |
||||||||
| Target market: |
2009 | 2008 | |||||||
| Networking |
$ | 234,085 | $ | 254,379 | (8 | )% | |||
| PC OEM |
201,919 | 171,405 | 18 | % | |||||
| Consumer |
106,464 | 46,612 | 128 | % | |||||
| Net revenue |
$ | 542,468 | $ | 472,396 | 15 | % | |||
Revenue for the year ended December 31, 2009 from our Networking customers decreased eight percent due to a reduction in retail and enterprise spending as a result of the recent worldwide economic recession. The reduction in revenue in our Networking channel during 2009 compared with 2008 resulted primarily from decreased demand for our older 802.11g and ag wireless networking products. This was partially offset by increased shipments of our 802.11n wireless networking and Ethernet products to our networking customers. Additionally, our 802.11g and 802.11n wireless networking products have experienced decreases in average selling prices during 2009 compared with 2008.
In our PC OEM channel, revenue increased 18% during the year ended December 31, 2009 compared to 2008. Increased demand for our 802.11n wireless networking products as well as increases in demand for our Ethernet solutions were partially offset by decreased demand for our older 802.11g and ag solutions. Additionally, our 802.11g, 802.11n and Ethernet chipsets have all experienced decreases in average selling prices during 2009 compared with 2008.
The 128% increase in revenue in our Consumer channel during the year ended December 31, 2009 compared with 2008 resulted from the adoption of our mobile WLAN solutions in an increasing number of gaming, consumer electronics and mobile phone devices. These increases were partially offset by decreased sales of our GPS products and our discontinued Personal Access System, or PAS, cellular solution. In February 2009, China’s Ministry of Industry and Information Technology requested carriers terminate their PAS networking service by 2011 as the country adopts other cellular technologies. Additionally, our 802.11g and ag and GPS chipsets experienced decreased average selling prices in 2009 compared with 2008.
43
Table of Contents
We expect first quarter of 2010 revenue to increase compared with the fourth quarter of 2009 based on increased product demand in our networking channel and the impact of our acquisition of Intellon Corporation which closed in December 2009, partially offset by decreases in our consumer channel, however, overall revenue and anticipated channel and product mix may differ from our current expectations.
Gross Profit
| Years Ended December 31, |
% Change in 2009 |
||||||||||
| 2009 | 2008 | ||||||||||
| Gross profit |
$ | 263,603 | $ | 235,965 | 12 | % | |||||
| % of net revenue |
49 | % | 50 | % | |||||||
Gross profit as a percentage of revenue decreased during the year ended December 31, 2009 compared with 2008, primarily due to declining average selling prices, partially offset by a decline in product costs related to supply chain efficiencies. We expect our gross margin as a percentage of revenue to remain relatively flat in the first quarter of 2010 compared with the 2009 annual gross margin percentage based on anticipated changes in the product mix and lower average selling prices for existing products. However, the anticipated product mix and overall revenue levels could differ from our current expectations.
Research and Development
| Years Ended December 31, | % Change in 2009 |
||||||||||
| 2009 | 2008 | ||||||||||
| Research and development |
$ | 130,592 | $ | 121,565 | 7 | % | |||||
| % of net revenue |
24 | % | 26 | % | |||||||
The increase in research and development expenses of $9.0 million during the year ended December 31, 2009 compared with 2008 was primarily due to additional compensation-related costs of $13.4 million, partly attributable to a 19% increase in the number of employees engaged in research and development activities. Of the increase in compensation related costs, $5.4 million was due to an increase in stock-based compensation. The increase in compensation-related costs was partially offset by decreased consulting costs of $2.0 million and decreased other fees and taxes expenses of $1.1 million. We expect that research and development expenses will increase in the first quarter of 2010 compared with the fourth quarter of 2009.
Sales and Marketing
| Years Ended December 31, | % Change in 2009 |
||||||||||
| 2009 | 2008 | ||||||||||
| Sales and marketing |
$ | 59,315 | $ | 51,154 | 16 | % | |||||
| % of net revenue |
11 | % | 11 | % | |||||||
The increase in sales and marketing expenses of $8.2 million during the year ended December 31, 2009 compared with 2008 was primarily due to additional compensation-related costs of $10.4 million, partly attributable to a 27% increase in the number of employees engaged in sales and marketing activities. Of the increase in compensation related costs, $4.7 million was due to an increase in stock-based compensation. The increase in compensation-related costs was partially offset by decreased travel expenses of $1.0 million. We anticipate that sales and marketing expenses will increase in the first quarter of 2010 compared with the fourth quarter of 2009.
General and Administrative
| Years Ended December 31, | % Change in 2009 |
||||||||||
| 2009 | 2008 | ||||||||||
| General and administrative |
$ | 29,414 | $ | 25,109 | 17 | % | |||||
| % of net revenue |
6 | % | 5 | % | |||||||
General and administrative expenses increased $4.3 million during the year ended December 31, 2009 compared with 2008, primarily due to increases in compensation-related costs of $4.7 million, partially attributable to a 16% increase in the number of employees engaged in general and administrative activities. Of the increase in compensation costs, $3.5 million was due to an increase in stock-based compensation. We expect that general and administrative expenses will increase in the first quarter of 2010 compared with the fourth quarter of 2009.
44
Table of Contents
Amortization of Acquired Intangible Assets
| Years Ended December 31, | % Change in 2009 |
||||||||||
| 2009 | 2008 | ||||||||||
| Amortization of acquired intangible assets |
$ | 11,570 | $ | 12,231 | (5 | )% | |||||
| % of net revenue |
2 | % | 3 | % | |||||||
Amortization of acquired intangible assets decreased by $661,000 during the year ended December 31, 2009 compared with 2008, as certain intangible assets related to our acquisition of ZyDAS in 2006 became fully amortized during the third quarters of 2009 and 2008. We expect that amortization of our acquired intangible assets will increase in the first quarter of 2010 compared with the fourth quarter of 2009 due to amortization of additional intangible assets acquired as a result of our acquisition of Intellon in December 2009.
Acquisition-Related Charges
Beginning January 1, 2009, as a result of changes in accounting standards, acquisition related costs are recognized separately from the acquisition consideration and are expensed as incurred. We recognized a total of $10.5 million of acquisition-related charges during 2009 in connection with our acquisition of Intellon, consisting primarily of legal and accounting costs, investment banking costs, government filing fees and severance and stock-based compensation costs related to employees of Intellon terminated post acquisition. We expect acquisition-related charges to decrease in the first quarter of 2010 as compared to the fourth quarter of 2009.
Interest Income, Net
| Years Ended December 31, | % Change in 2009 |
||||||||||
| 2009 | 2008 | ||||||||||
| Interest income, net |
$ | 6,004 | $ | 8,788 | (32 | )% | |||||
| % of net revenue |
1 | % | 2 | % | |||||||
During the year ended December 31, 2009, interest income decreased 32% compared to 2008 due primarily to decreased interest rates on our cash, cash equivalents, marketable securities and long-term investments. The impact of the interest rate decline was partially offset by an increase in our average cash, cash equivalents and marketable securities invested during 2009 resulting primarily from the generation of cash from operations, the exercise of employee stock options and the purchase of stock by our employees through our Employee Stock Purchase Plan. This increase was partially offset by cash paid in connection with our acquisition of Intellon.
Impairment of Long-Term Investments
Our long-term investments consist primarily of auction-rate securities and Preferred Stock. In the year ended December 31, 2009 and 2008, we determined that our auction-rate securities and Preferred Stock were other-than-temporarily impaired and recorded impairment charges of $2.0 million and $15.5 million, respectively, to reduce the carrying value of certain of these auction-rate securities and Preferred Stock. The additional impairment charge in 2009 is due to the continued deterioration in the financial markets that has negatively impacted the liquidity and potential recovery rates for the auction-rate securities and Preferred Stock we hold. We intend to sell these securities. See the discussion at “Liquidity and Capital Resources” in Part II Item 6, “Quantitative and Qualitative Disclosures About Market Risk” in Part II Item 7A, as well as Note 6 to the Consolidated Financial Statements in Item 8 of this Form 10-K for more detailed information on our investments in auction-rate securities and this impairment charge. The estimated fair value of these securities could decrease or increase significantly in the future based on market conditions and we may be required to record additional losses for impairment if we determine there are further declines in fair value.
Provision for Income Taxes
| Years Ended December 31, | % Change in 2009 |
||||||||||
| 2009 | 2008 | ||||||||||
| Income tax benefit (provision) |
$ | 20,243 | $ | (422 | ) | 4897 | % | ||||
| % of net revenue |
4 | % | — | % | |||||||
The benefit for income taxes was $20.2 million for the year ended December 31, 2009 as compared with the provision for income taxes of $422,000 for the year ended December 31, 2008. These amounts represent approximately 77.4% and 2.2% of pre-tax income for the years ended December 31, 2009 and 2008, respectively.
45
Table of Contents
Our 2009 effective tax rate includes a benefit of $21.7 million related to the favorable settlement of a foreign tax liability resulting from a prior acquisition. Excluding this benefit, our 2009 effective tax rate was lower than the 35.0% statutory rate primarily due to profits earned in jurisdictions where the tax rate is lower than the U.S. tax rate and due to the benefit from federal and state research and development tax credits, partially offset by non-deductible stock-based compensation expense and non-deductible acquisition-related charges from the Intellon acquisition.
Our 2008 effective tax rate was lower than the 35.0% statutory rate primarily due to profits earned in jurisdictions where the tax rate is lower than the U.S. tax rate and due to the benefit from federal and state research and development tax credits, partially offset by income tax expense from non-deductible stock-based compensation expense and an increase in the valuation allowance recorded against our net deferred tax assets.
Our Federal income tax return for the year ended December 31, 2006 is under examination by the IRS.
Years Ended December 31, 2008 and 2007
(tables presented in thousands, except percentage amounts)
Net Revenue
| Years Ended December 31, |
% Change in 2008 |
||||||||
| Target market: |
2008 | 2007 | |||||||
| Networking |
$ | 254,379 | $ | 219,669 | 16% | ||||
| PC OEM |
171,405 | 174,213 | ( | 2)% | |||||
| Consumer |
46,612 | 23,078 | 102% | ||||||
| Net revenue |
$ | 472,396 | $ | 416,960 | 13% | ||||
The increase in net revenue in our Networking channel during the year ended December 31, 2008 compared to 2007 resulted primarily from an increase in the volume of chipsets shipped resulting from the further acceptance of our 802.11g and further adoption of our 802.11n wireless networking products, particularly with our carrier and retail customers, partially offset by declining average selling prices for our chipsets and a decrease in the volume of 802.11ag chipsets shipped. We believe the effects of the economic downturn in 2008 also slowed our revenues in the Networking channel significantly, especially in the fourth quarter of 2008.
In our PC OEM channel, net revenue decreased two percent during the year ended December 31, 2008 compared to 2007. While we experienced increased unit demand due to further customer acceptance of our 802.11g and Ethernet chipsets and further adoption of our 802.11n solutions, these increases were more than offset by declining average selling prices for our chipsets. We believe the effects of the economic downturn in 2008 also slowed our revenues in the PC OEM channel significantly, especially in the fourth quarter of 2008.
The increase in revenue in our Consumer channel during the year ended December 31, 2008 compared to 2007 resulted from the further acceptance of our 802.11g mobile wireless networking products in gaming devices and mobile phones and the introduction of our GPS products in December 2007, partially offset by decreased demand for our PAS products.
Gross Profit
| Years Ended December 31, |
% Change in 2008 |
||||||||||
| 2008 | 2007 | ||||||||||
| Gross profit |
$ | 235,965 | $ | 207,381 | 14 | % | |||||
| % of net revenue |
50 | % | 50 | % | |||||||
Gross profit as a percentage of revenue remained flat during the year ended December 31, 2008 compared to 2007, primarily due to a 10% decline in product costs related to supply chain efficiencies and changes in product mix, partially offset by average selling price declines of 10%.
46
Table of Contents
Research and Development
| Years Ended December 31, | % Change in 2008 |
||||||||||
| 2008 | 2007 | ||||||||||
| Research and development |
$ | 121,565 | $ | 100,936 | 20 | % | |||||
| % of net revenue |
26 | % | 24 | % | |||||||
The increase in research and development expenses of $20.6 million during the year ended December 31, 2008 compared to 2007 was primarily due to additional compensation-related costs of $17.2 million, partially attributable to a 19% increase in the number of employees engaged in research and development activities to support our growth in the comparable periods. The headcount increase was due primarily to an expansion of our research and development personnel in our six design centers and to a lesser extent, the additional headcount added as part of the u-Nav acquisition in December of 2007. Of the increase in compensation-related expenses, $4.0 million was due to an increase in stock-based compensation. Further, there were increases in software expenses of $1.7 million and consulting expenses of $1.5 million resulting from increased chip development efforts for new and existing markets.
Sales and Marketing
| Years Ended December 31, | % Change in 2008 |
||||||||||
| 2008 | 2007 | ||||||||||
| Sales and marketing |
$ | 51,154 | $ | 38,010 | 35 | % | |||||
| % of net revenue |
11 | % | 9 | % | |||||||
The increase in sales and marketing expenses of $13.1 million during the year ended December 31, 2008 compared to 2007 was primarily due to additional compensation-related costs of $10.4 million, partly attributable to a 39% increase in the number of employees engaged in sales and marketing activities to support our growth. Of the increase in compensation-related expenses, $3.7 million was due to the increase in stock-based compensation.
General and Administrative
| Years Ended December 31, | % Change in 2007 |
||||||||||
| 2008 | 2007 | ||||||||||
| General and administrative |
$ | 25,109 | $ | 21,189 | 19 | % | |||||
| % of net revenue |
5 | % | 5 | % | |||||||
The increase in general and administrative expenses of $3.9 million during the year ended December 31, 2008 compared to 2007 was primarily due to additional compensation-related costs of $3.1 million, primarily attributable to a 23% increase in the number of employees engaged in general and administrative activities to support our growth, which includes a $1.7 million increase in stock-based compensation.
Amortization of Acquired Intangible Assets
| Years Ended December 31, | % Change in 2008 |
||||||||||
| 2008 | 2007 | ||||||||||
| Amortization of acquired intangible assets |
$ | 12,231 | $ | 7,402 | 65 | % | |||||
| % of net revenue |
3 | % | 2 | % | |||||||
Amortization of acquired intangible assets increased by $4.8 million during the year ended December 31, 2008 compared to 2007 as a result of additional acquired intangible assets recorded in the fourth quarter of 2007 from the completion of the u-Nav acquisition and the second close of the Attansic acquisition. Acquisition-related identified intangibles are amortized on a straight-line basis over the estimated economic lives of three to four years for purchased technology, two to six years for customer relationships and two to four years for covenants not-to-compete.
47
Table of Contents
Acquired In-Process Research and Development
| Years Ended December 31, | % Change in 2007 |
||||||||||
| 2008 | 2007 | ||||||||||
| Acquired in-process research and development |
$ | — | $ | 4,897 | (100 | )% | |||||
| % of net revenue |
— | % | 1 | % | |||||||
The acquired in-process research and development, or IPR&D, charges of $4.9 million for 2007 related to the acquisitions of the remaining 12.3% of the capital stock of Attansic and u-Nav. No IPR&D charges were recognized in 2008. The amounts allocated to IPR&D were determined through estimates and valuation techniques based on the terms and details of each acquisition. The amounts allocated to IPR&D were expensed upon acquisition as it was determined that the underlying projects had not reached technological feasibility and no alternative future use existed at the date of acquisition.
The fair value of the IPR&D for each of the acquisitions was determined using the income approach as described above. The IPR&D charges include only the fair value of IPR&D performed as of the respective acquisition dates. The fair value of any developed technology is included in intangible assets and is amortized accordingly. The amounts recorded as IPR&D represent the estimated fair values and approximate amounts at which an independent third party would value these projects as of the respective acquisition dates.
At December 31, 2009, the single-chip GPS device project associated with our acquisition of u-Nav was completed, and actual results were materially consistent with our assumptions at the time of the acquisition. At December 31, 2009, the Ethernet controller and switch projects associated with our acquisition of Attansic were complete, and actual results were materially consistent with our assumptions at the time of the acquisition. As of December 31, 2008, the mobile communications IC projects associated with our acquisition of ZyDAS were discontinued. The discontinuation of the project did not have a material impact on our consolidated results of operations or financial condition. The original assumptions consisted of expected completion dates for the IPR&D projects, estimated costs to complete the projects, and revenue and expense projects for the products once they entered the market.
Interest Income, Net
| Years Ended December 31, | % Change in 2008 |
||||||||||
| 2008 | 2007 | ||||||||||
| Interest income, net |
$ | 8,878 | $ | 11,516 | (23 | )% | |||||
| % of net revenue |
2 | % | 3 | % | |||||||
During the year ended December 31, 2008, interest income decreased compared to 2007 due primarily to significantly decreased yields on our cash, cash equivalents and marketable securities. This yield decline was partially offset by an increase in our cash, cash equivalents and marketable securities, excluding auction-rate securities, of $74.2 million during the year ended December 31, 2008 compared to 2007, resulting primarily from the generation of cash from operations, the exercise of employee stock options and employee stock purchases through our Employee Stock Purchase Plan. This increase was partially offset by outlays for purchases of property and equipment.
Impairment of Long-Term Investments
Our long-term investments consist primarily of auction-rate securities. During 2008 and 2007, we recorded impairment charges of $15.5 million and $2.3 million, respectively, to reduce the carrying value of certain of these auction-rate securities. We have determined that the impairment charges are other-than-temporary in nature. The additional impairment charge in 2008 is due to the continued deterioration in the financial markets that have negatively impacted the liquidity and potential recovery rates for the auction-rate securities we hold. See the discussion at “Liquidity and Capital Resources” in Part II Item 6, “Quantitative and Qualitative Disclosures About Market Risk” in Part II Item 7A, as well as Note 6 to the Consolidated Financial Statements in Item 8 of this Form 10-K for more detailed information on our investments in auction-rate securities and this impairment charge.
Provision for Income Taxes
| Years Ended December 31, | % Change in 2008 |
||||||||||
| 2008 | 2007 | ||||||||||
| Income tax provision |
$ | 422 | $ | 4,206 | (90 | )% | |||||
| % of net revenue |
— | % | 1 | % | |||||||
48
Table of Contents
The provision for income taxes was $422,000 for the year ended December 31, 2008 as compared to the provision for income taxes of $4.2 million for the year ended December 31, 2007, which represents approximately 2.2% and 9.5% of pre-tax income for the years ended December 31, 2008 and 2007, respectively.
Our 2008 effective tax rate was lower than the 35.0% statutory rate primarily due to profits earned in jurisdictions where the tax rate is lower than the U.S. tax rate and due to the benefit from federal and state research and development tax credits, partially offset by income tax expense from non-deductible stock-based compensation expense and an increase in the valuation allowance recorded against our net deferred tax assets. The effective tax rate for 2007 was lower than the 35.0% statutory rate primarily due to foreign tax rate differences and by an income tax benefit of $3.0 million related to the release of valuation allowance against our deferred tax assets, which consisted of research and development tax credits.
Liquidity and Capital Resources
Sources and Uses of Cash
Our principal source of liquidity is cash provided by operations, the exercise of stock options and purchases of our common stock pursuant to our employee stock purchase plan. Cash, cash equivalents and short-term marketable securities increased from $293.8 million at December 31, 2008 to $402.2 million at December 31, 2009. Our working capital generation is primarily used to fund our operating, investing and financing needs.
Consolidated Cash Flow Data
| Years Ended December 31, | ||||||||||||
| 2009 | 2008 | 2007 | ||||||||||
| (in thousands) |
||||||||||||
| Net cash provided by (used in) |
||||||||||||
| Operating Activities |
$ | 142,831 | $ | 63,431 | $ | 71,529 | ||||||
| Investing Activities |
(132,230 | ) | (143,263 | ) | (21,646 | ) | ||||||
| Financing Activities |
23,245 | 20,106 | 25,990 | |||||||||
| Net increase (decrease) in cash and cash equivalents |
$ | 33,846 | $ | (59,726 | ) | $ | 75,873 | |||||
Operating Activities
For the year ended December 31, 2009, cash flow from operations of $142.8 million resulted primarily from our net income of $46.4 million and the following additional reasons:
| • | Our net income included substantial non-cash charges in the form of depreciation and amortization, stock-based compensation, an impairment of our long-term investments, amortization of acquired intangible assets and taxes. These non-cash charges totaled $46.3 million. |
| • | We generated $50.1 million in cash from a decrease in working capital for the year ended December 31, 2009. |
Working capital is comprised primarily of accounts receivable, inventory, prepaid expenses and other current assets, accounts payable and accrued and other current liabilities. The following discussion excludes the impact of assets and liabilities acquired from Intellon. Accounts receivable decreased by $11.6 million in 2009, due to the timing of shipments and the timing of customer payments. Inventory decreased $7.6 million in 2009 due primarily to timing of inventory shipments and receipts. Prepaid expenses and other current assets increased by $2.0 million in 2009 due primarily to increased employee contributions to our employee stock purchase plan. Accounts payable and accrued and other current liabilities increased by $33.7 million in 2009, primarily due to the timing of inventory received and payments to our vendors.
For the year ended December 31, 2008, cash flow from operations of $63.4 million resulted primarily from our net income of $18.9 million and the following additional reasons:
| • | Our net income included substantial non-cash charges in the form of depreciation and amortization, stock-based compensation, an impairment of our long-term investments, amortization of acquired intangible assets and taxes. These non-cash charges totaled $63.5 million. |
| • | We invested $19.0 million in working capital for the year ended December 31, 2008. |
49
Table of Contents
Working capital is comprised primarily of accounts receivable, inventory, accounts payable and accrued and other current liabilities. Inventory increased $35.0 million in 2008, primarily as a result of slower than anticipated sales in the fourth quarter of 2008 due to the recent economic downturn. Accounts payable and accrued and other current liabilities increased by $18.4 million in 2008, primarily due to the timing of inventory received, payments to our vendors and an increase in accrued customer incentives.
For the year ended December 31, 2007, cash flow from operations of $71.5 million resulted primarily from our net income of $40.0 million and the following additional reasons:
| • | Our net income included substantial non-cash charges in the form depreciation and amortization, stock-based compensation, an impairment of our long-term investments, amortization of acquired intangible assets, taxes and a write-off of acquired IPR&D. These non-cash charges totaled $43.4 million. |
| • | We invested $11.9 million in working capital for the year ended December 31, 2007. |
Working capital is comprised primarily of accounts receivable, inventory, accounts payable and accrued and other current liabilities. Accounts payable increased $11.9 million, related to increases in inventory and the timing of payments to vendors, partially offset by an increase in accounts receivable of $10.7 million related to increased revenue and the timing of customer payments, an increase in inventory of $7.7 million to support increased demand for our products and a decrease in other accrued liabilities of $4.0 million, primarily related to the timing of customer incentive payments.
Investing Activities
Net cash used in investing activities during the year ended December 31, 2009 was primarily a result of the net cash paid in the acquisition of Intellon of $70.7 million and the purchase of marketable securities, net of proceeds from maturities, of $57.9 million. Net cash used in investing activities during the year ended December 31, 2008 was primarily a result of the purchase of marketable securities, net of proceeds from maturities, of $133.6 million. Net cash used in investing activities during the year ended December 31, 2007 was primarily due to the $23.7 million, net of cash acquired, we paid to acquire the outstanding 12.3% of Attansic common stock and certain assets and liabilities of u-Nav in 2007, partially offset by maturities of marketable securities, net of purchases of $9.8 million. Our investments are primarily in money market funds, U.S. government notes and bonds, corporate notes and bonds, commercial paper, long-term auction-rate securities, preferred stock and other long-term cost-based investments.
We purchased $3.9 million, $7.4 million and $9.7 million of property and equipment in the years ended December 31, 2009, 2008 and 2007, respectively.
Financing Activities
Net cash provided by financing activities during the years ended December 31, 2009, 2008, and 2007 consisted primarily of proceeds from stock option exercises and purchases of our common stock pursuant to our employee stock purchase plan of $22.6 million, $18.6 million and $23.1 million, respectively.
Effective August 11, 2009, our line of credit agreement with a bank expired and was not renewed. As of December 31, 2009, we had standby letters of credit outstanding totaling $2.1 million to secure operating leases for equipment. These standby letters of credit are secured by certificates of deposit.
Long-term investments consist primarily of auction-rate securities representing our interest in insurance capital notes, issued by special purpose entities sponsored by insurance companies; such securities were rated AAA and AA at the date of purchase. Additionally, we acquired Preferred Stock issued by two monoline insurance companies that is currently illiquid, with an original par value of $7.5 million, in the fourth quarter of 2008, resulting from the forced conversion of two auction-rate securities we held. In December 2009, we sold two of our auction-rate securities with an original par value of $2.1 million and a fair value of $1.6 million for $1.5 million. As of December 31, 2009, we held auction-rate securities and Preferred Stock with an aggregate par value of $30.6 million and a fair value of $13.5 million. A portion of the auction-rate securities are collateralized by tradable short-term corporate and government notes, bonds and commercial paper. Since September 2007, there have been no active markets for these auction-rate securities and Preferred Stock. We will not be able to liquidate any of our remaining auction-rate securities or Preferred Stock until a buyer is found for these instruments or the securities are redeemed.
We expect to experience increases in our operating expenses in absolute dollars, in research, and development, sales and marketing and general and administrative expenses, for the foreseeable future in order to execute our business strategy. As a result, we anticipate that operating expenses as well as planned capital expenditures will constitute a material use of our cash resources.
We believe that research and development is essential to expanding our core technologies and product offerings. Our research and development expenses were $130.6 million, $121.6 million and $100.9 million in 2009, 2008 and 2007, respectively. These
50
Table of Contents
expenditures resulted in enhancement of our product offerings, technological know-how and inventions that have yielded numerous issued and pending U.S. patents. We expect to continue to incur significant research and development expenses and intend to fund these expenses with operating cash flow, cash and cash equivalents and short-term marketable securities.
We believe that our existing cash, cash equivalents and short-term marketable securities will be sufficient to meet our anticipated cash needs for at least the next 12 months. Our future capital requirements will depend on many factors including our rate of revenue growth, the timing and extent of spending to support development efforts, the expansion of sales and marketing activities, the timing of introductions of new products and enhancements to existing products, the costs to ensure access to adequate manufacturing capacity, the continuing market acceptance of our products and potential future acquisitions. In August 2006, we acquired ZyDAS for an aggregate of approximately $26.0 million in cash and stock at closing and agreed to pay additional consideration upon attaining certain defined milestones. These milestones were met as of December 31, 2007 and the respective payments have been made and have been recorded as compensation expense. In December 2006, we acquired 87.7% of the outstanding shares of Attansic for $62.4 million consisting of $37.6 million in cash and $24.8 million in our common stock. In November 2007, we acquired the remaining 12.3% of the outstanding shares of Attansic for approximately $8.8 million in cash. In December 2007, we acquired certain assets of u-Nav for approximately $54.1 million in cash, stock and assumed liabilities. In December 2009, we acquired Intellon Corporation for $254.0 million consisting of $113.6 million in cash and $140.4 million in our common stock. We may enter into arrangements in the future with respect to potential investments in, acquisitions of, complementary businesses, products or technologies, which could also require us to seek additional equity or debt financing. The sale of additional equity securities or convertible debt securities would result in additional dilution to our stockholders. Additional debt would result in increased interest expense and could result in covenants that would restrict our operations. We have not made arrangements to obtain additional financing and there is no assurance that such financing, if required, will be available in amounts or on terms acceptable to us, if at all.
Contractual Obligations and Off-Balance Sheet Arrangements
As of December 31, 2009, we had no off-balance sheet arrangements as defined in SEC regulations. The following summarizes our contractual obligations at December 31, 2009 and the effect those obligations are expected to have on our liquidity and cash flow in future periods (in millions):
| Payments due by period | ||||||||||||
| Less Than 1 Year |
1-3 Years |
After 3 Years |
Total | |||||||||
| Contractual obligations |
||||||||||||
| Operating leases |
$ | 4.7 | $ | 3.7 | $ | 1.0 | $ | 9.4 | ||||
| Commitments under licensing agreements |
8.8 | 8.3 | — | 17.1 | ||||||||
| Purchase of goods and services |
243.9 | — | — | 243.9 | ||||||||
| Total |
$ | 257.4 | $ | 12.0 | $ | 1.0 | $ | 270.4 | ||||
We have excluded $31.9 million in unrecognized tax benefits from the contractual obligations table because we cannot make a reasonably reliable estimate of the periodic cash settlements with the respective taxing authorities. See Note 13 to the Consolidated Financial Statements in Item 8 of this Form10-K for a discussion of income taxes.
Recent Accounting Pronouncements
Effective July 1, 2009, we adopted the FASB Accounting Standards Codification, or the Codification, as the source of authoritative accounting principles recognized by the FASB to be applied by nongovernmental entities in the preparation of financial statements in conformity with U.S. GAAP. Rules and interpretive releases of the SEC under authority of federal securities laws are also sources of authoritative U.S. GAAP for SEC registrants. All guidance contained in the Codification carries an equal level of authority. The Codification superseded all existing non-SEC accounting and reporting standards. All other non-grandfathered, non-SEC accounting literature not included in the Codification is non-authoritative. The FASB will not issue new standards in the form of Statements, FASB Staff Positions or Emerging Issues Task Force Abstracts. Instead, it will issue Accounting Standards Updates, or ASUs. The FASB will not consider ASUs as authoritative in their own right. ASUs will serve only to update the Codification, provide background information about the guidance and provide the bases for conclusions on the change(s) in the Codification. References made to FASB guidance throughout this document have been updated for the Codification.
Effective January 1, 2009, we adopted the FASB’s updated guidance related to business combinations. The updated guidance establishes principles and requirements for how the acquirer of a business recognizes and measures in its financial statements the identifiable assets acquired, the liabilities assumed, and any non-controlling interest in the acquiree. The updated standard also provides guidance for recognizing and measuring the goodwill acquired in the business combination and determines what information to disclose to enable users of the financial statements to evaluate the nature and financial effects of the business combination. The updated standard also provides guidance for recognizing changes in an acquirer’s existing income tax valuation allowances and tax
51
Table of Contents
uncertainty accruals that result from a business combination transaction as adjustments to income tax expense. The updated guidance had a material impact on our consolidated financial statements during the year ended December 31, 2009. In August 2009, we recognized a one-time tax benefit of $21.7 million upon favorable resolution of a foreign tax obligation relating to a prior acquisition. Under prior accounting standards, the amount would have been recorded as an adjustment of goodwill. In December 2009, we completed our acquisition of Intellon. Under the updated guidance we expensed the transaction costs associated with the Intellon acquisition, while under the prior accounting standards such costs would have been capitalized. In addition, we acquired in-process research and development of $7.7 million which has been capitalized in accordance with the updated guidance, whereas under prior authoritative guidance the amount would have been expensed immediately. Therefore, the adoption of the updated guidance related to business combinations has had and likely will continue to have a material impact on our future consolidated financial statements.
In April 2009, the FASB issued updated guidance related to business combinations to address application issues regarding initial recognition and measurement, subsequent measurement and accounting and disclosure of assets and liabilities arising from contingencies in a business combination. In circumstances where the acquisition-date fair value for a contingency cannot be determined during the measurement period and it is concluded that it is probable that an asset or liability exists as of the acquisition date and the amount can be reasonably estimated, a contingency is recognized as of the acquisition date based on the estimated amount. This updated guidance is effective for assets or liabilities arising from contingencies in business combinations completed by us on or after January 1, 2009. Adoption of this guidance did not have any material impact on our financial statements.
Effective January 1, 2008, we adopted the FASB’s updated guidance related to fair value measurements and disclosures with respect to its financial assets and liabilities. In February 2008, the FASB issued updated guidance related to fair value measurements. The updated guidance provided a one year deferral of the effective date of the fair value guidance for non-financial assets and non-financial liabilities, except those that are recognized or disclosed in the financial statements at fair value at least annually. Therefore, we adopted the provisions of the fair value guidance for non-financial assets and non-financial liabilities effective January 1, 2009, and such adoption did not have a material impact on our consolidated results of operations or financial condition.
Effective April 1, 2009, we adopted the FASB’s updated guidance related to investments and debt securities, which amends the other-than-temporary impairment, or OTTI, guidance in U.S. GAAP to make the guidance more operational and to improve the presentation of other-than-temporary impairments in the financial statements. Under prior authoritative guidance, if OTTI was determined to exist, we recognized an OTTI charge into earnings in an amount equal to the difference between the investment’s amortized cost basis and its fair value as of the balance sheet date of the reporting period. Under the updated guidance, if OTTI has been incurred, and it is more-likely-than-not that we will not sell the investment security before the recovery of its amortized cost basis, then the OTTI is separated into (a) the amount representing the credit loss and (b) the amount related to all other factors. The amount of the total OTTI related to the credit loss is recognized in earnings. The amount of the total OTTI related to other factors is recognized in accumulated other comprehensive income, or AOCI. The total OTTI, which includes both credit and non-credit losses, is presented gross in our statements of operations and is reduced by the non-credit loss amount of the total OTTI that is recognized in AOCI. There was no initial effect of adoption on April 1, 2009 as we have the intent to sell the securities we had previously deemed as other-than-temporarily impaired.
Effective April 1, 2009, we adopted the FASB’s updated guidance related to fair value measurements and disclosures, which provides additional guidance for estimating fair value in accordance with the guidance related to fair value measurements when the volume and level of activity for an asset or liability have significantly decreased. The updated standard also includes guidance on identifying circumstances that indicate a transaction is not orderly. The adoption of the updated guidance did not have an impact on our consolidated results of operations or financial condition.
Effective April 1, 2009, we adopted the FASB’s updated guidance on financial instruments, which amends prior authoritative guidance to require disclosures about fair value of financial instruments in interim financial statements as well as in annual financial statements and also amends prior guidance to require those disclosures in all interim financial statements. The adoption of the updated guidance did not have a material impact on our consolidated results of operations or financial condition.
Effective April 1, 2009, we adopted the FASB’s updated guidance related to subsequent events, which establishes general standards of accounting for and disclosure of events that occur after the balance sheet date but before financial statements are issued or are available to be issued. It requires the disclosure of the date through which an entity has evaluated subsequent events and the basis for that date—that is, whether that date represents the date the financial statements were issued or were available to be issued. This disclosure should alert all users of financial statements that an entity has not evaluated subsequent events after that date in the set of financial statements being presented. Adoption of the updated guidance did not have a material impact on our consolidated results of operations or financial condition. We have evaluated subsequent events through February 12, 2010, the date the financial statements were issued.
Effective July 1, 2009, we adopted the FASB’s updated guidance related to fair value measurements and disclosures for the fair value measurement of liabilities. The updated guidance provides clarification that in circumstances in which a quoted price in an active market for the identical liability is not available, a reporting entity is required to measure fair value using certain techniques. The updated guidance also clarifies that when estimating the fair value of a liability, a reporting entity is not required to include a
52
Table of Contents
separate input or adjustment to other inputs relating to the existence of a restriction that prevents the transfer of a liability. The updated guidance also clarifies that both a quoted price in an active market for the identical liability at the measurement date and the quoted price for the identical liability when traded as an asset in an active market when no adjustments to the quoted price of the asset are required are Level 1 fair value measurements. Adoption of the updated guidance did not have a material impact on our consolidated results of operations or financial condition.
In October 2009, the FASB issued updated guidance related to revenue recognition in multiple-deliverable revenue arrangements and certain arrangements that include software elements. The updated guidance requires entities to allocate revenue in an arrangement using estimated selling prices of the delivered goods and services based on a selling price hierarchy. The amendments eliminate the residual method of revenue allocation and require revenue to be allocated using the relative selling price method. The updated guidance also removes tangible products from the scope of software revenue guidance and provides guidance on determining whether software deliverables in an arrangement that includes a tangible product are covered by the scope of the software revenue guidance. The updated guidance should be applied on a prospective basis for revenue arrangements entered into or materially modified in fiscal years beginning on or after June 15, 2010, with early adoption permitted. We do not expect adoption of the updated guidance to have a material impact on our consolidated results of operations or financial condition.
In January 2010, the FASB issued updated guidance related to fair value measurements and disclosures, which requires a reporting entity to disclose separately the amounts of significant transfers in and out of Level 1 and Level 2 fair value measurements and to describe the reasons for the transfers. In addition, in the reconciliation for fair value measurements using significant unobservable inputs, or Level 3, a reporting entity should disclose separately information about purchases, sales, issuances and settlements (that is, on a gross basis rather than one net number). The updated guidance also requires that an entity should provide fair value measurement disclosures for each class of assets and liabilities and disclosures about the valuation techniques and inputs used to measure fair value for both recurring and non-recurring fair value measurements for Level 2 and Level 3 fair value measurements. The updated guidance is effective for interim or annual financial reporting periods beginning after December 15, 2009, except for the disclosures about purchases, sales, issuances and settlements in the roll forward activity in Level 3 fair value measurements, which are effective for fiscal years beginning after December 15, 2010 and for interim periods within those fiscal years. We do not expect adoption of the updated guidance to have a material impact on our consolidated results of operations or financial condition.
| Item 7A. | Quantitative and Qualitative Disclosures About Market Risk |
The primary objectives of our investment activities are, in order of importance, to preserve principal, provide liquidity and maximize income without significantly increasing risk. As of December 31, 2009, our investments were primarily in money market funds, corporate notes, corporate bonds, commercial paper, U.S. government securities and to a lesser extent, auction-rate securities, Preferred Stock and other cost-based investments. Some of the securities we invest in are subject to market risk. This means that a change in prevailing interest rates may cause the principal amount of the investment to fluctuate. To minimize this risk, we maintain our portfolio of cash equivalents and short-term investments in a variety of securities, including money market funds and government and non-government debt securities. Our long-term investments primarily consist of auction-rate securities and Preferred Stock, which have been classified as long-term due to the lack of a liquid market for these securities. The risk associated with fluctuating interest rates is limited to our investment portfolio and we believe that a 10% change in interest rates will not have a significant impact on the fair value of our portfolio or on our interest income.
Long-term investments consist primarily of auction-rate securities representing our interest in insurance capital notes, issued by special purpose entities sponsored by insurance companies; such securities were rated AAA and AA at the date of purchase. Additionally, we acquired Preferred Stock issued by two monoline insurance companies that is currently illiquid, with an original par value of $7.5 million, in the fourth quarter of 2008, resulting from the forced conversion of two auction-rate securities we held. In December 2009, we sold two of our auction-rate securities with an original par value of $2.1 million and a fair value of $1.6 million for $1.5 million. As of December 31, 2009, we held auction-rate securities and Preferred Stock with an aggregate par value of $30.6 million and a fair value of $13.5 million. A portion of the auction-rate securities are collateralized by tradable short-term corporate and government notes, bonds and commercial paper. Since September 2007, there have been no active markets for these auction-rate securities and Preferred Stock. We will not be able to liquidate any of our remaining auction-rate securities or Preferred Stock until a buyer is found for these instruments or the securities are redeemed.
These auction-rate securities generally continue to earn and receive interest at the maximum contractual rate which averaged 2.51% of face value as of December 31, 2009. One of the Preferred Stocks ceased paying dividends in December 2008. As there is currently no market for the Preferred Stock and auction-rate securities, we have used a discounted cash flow model to estimate the fair value of the auction-rate securities and the Preferred Stock. The assumptions used in preparing the discounted cash flow model include recovery rate in the event of a default, liquidity risk premium, probability of earning maximum interest rate to maturity, probability of passing an auction at some point in the future, probability of default, estimates for interest rates and timing of cash flows. As of December 31, 2009, we have determined that, for our auction-rate securities and Preferred Stock, OTTI has occurred and we intend to sell these investment securities prior to recovery. In the years ended December 31, 2009, 2008 and 2007, we recorded OTTI charges for these securities of $2.0 million, $15.5 million and $2.3 million, respectively. To date, all OTTI losses on our long-term investments have been recorded in earnings.
53
Table of Contents
The following table presents the amounts of cash equivalents and marketable securities (in thousands, except percentages) that are subject to market risk by range of expected maturity and weighted-average interest rates as of December 31, 2009. Our variable rate securities consist of money market funds and auction-rate securities.
| Maturing in Three Months or Less |
Maturing Between Three Months and One Year |
Maturing Greater Than One Year |
Total | |||||||||||||
| Fixed Rate |
$ | 89,875 | $ | 147,953 | $ | 64,154 | $ | 301,982 | ||||||||
| Weighted Average Interest Rate |
1.31 | % | 1.63 | % | 1.60 | % | 1.53 | % | ||||||||
| Variable Rate |
$ | 91,625 | $ | — | $ | 13,523 | $ | 105,148 | ||||||||
| Weighted Average Interest Rate |
0.11 | % | — | % | 5.74 | % | 0.83 | % | ||||||||
Effective August 11, 2009, our line of credit agreement with a bank expired and was not renewed. As of December 31, 2009, we had standby letters of credit outstanding totaling $2.1 million to secure operating leases for equipment. These standby letters of credit are secured by certificates of deposit.
Currently, our direct exposure to foreign exchange rate fluctuations for revenues and cost of goods sold is not material. Our sales agreements generally provide for pricing and payment in U.S. dollars and, therefore, are not subject to exchange rate fluctuations. Similarly, the majority of our purchases related to cost of goods sold are denominated and paid in U.S. dollars and, therefore, are not subject to exchange rate fluctuations. The risk associated with fluctuating currency exchange rates is generally limited to our operating expenses and capital expenditures denominated in currencies other than the U.S. dollar as over 50% of our employees are located outside of the U.S. Increases or decreases in the value of the U.S. dollar relative to other currencies could make our products more or less expensive, which could have an impact on our business. Future fluctuations in currency exchange rates could have a material impact on our business.
We do not currently engage in foreign currency hedging transactions, nor do we believe that we currently have material exposure to foreign currency exchange rate risk.
| Item 8. | Financial Statements and Supplementary Data |
The response to this Item is submitted as a separate section of this Form 10-K. See Item 15.
| Item 9. | Changes and Disagreements with Accountants on Accounting and Financial Disclosure |
Not applicable.
| Item 9A. | Controls and Procedures |
Evaluation of Disclosure Controls and Procedures
We maintain “disclosure controls and procedures”, as such term is defined in Rule 13a-15(e) under the Securities Exchange Act of 1934, or the Exchange Act, that are designed to ensure that information required to be disclosed by us in the reports that we file or submit under the Exchange Act is recorded, processed, summarized and reported, within the time periods specified in the Commission’s rules and forms and that such information is communicated to our management, including our principal executive and principal financial officers, as appropriate, to allow timely decisions regarding required disclosure. In designing and evaluating our disclosure controls and procedures, management recognized that disclosure controls and procedures, no matter how well conceived and operated, can provide only reasonable, but not absolute, assurance that the objectives of the disclosure controls and procedures are met. Our disclosure controls and procedures have been designed to meet the reasonable assurance standards. Additionally, in designing disclosure controls and procedures, our management necessarily was required to apply its judgment in evaluating the cost-benefit relationship of possible disclosure controls and procedures. The design of any disclosure controls and procedures is also based in part upon certain assumptions about the likelihood of future events, and there can be no assurance that any design will succeed in achieving its stated goals under all potential future conditions.
Based on their evaluation, our principal executive officer and our principal financial officer concluded that as of December 31, 2009, our disclosure controls and procedures were effective at the reasonable assurance level.
54
Table of Contents
Management’s Report on Internal Control over Financial Reporting
Our management is responsible for establishing and maintaining adequate internal control over financial reporting, as such term is defined in Exchange Act Rules 13a-15(f) and 15d-15(f). Management, with the participation of our principal executive officer and principal financial officer, has conducted an evaluation of the effectiveness of our internal control over financial reporting based on the framework set forth in Internal Control—Integrated Framework issued by the Committee of Sponsoring Organizations of the Treadway Commission. Based on our evaluation under the framework set forth in Internal Control—Integrated Framework, our management concluded that our internal control over financial reporting was effective as of December 31, 2009.
We excluded Intellon Corporation from our assessment of the effectiveness of our internal control over financial reporting as of December 31, 2009 because it was acquired by us in a purchase business combination on December 15, 2009. Intellon Corporation, our wholly owned subsidiary, constituted less than 3% of total assets and less than 1% of net revenues of the related amounts reported in our consolidated financial statements for the year ended December 31, 2009.
The effectiveness of our internal control over financial reporting as of December 31, 2009 has been audited by PricewaterhouseCoopers LLP, an independent registered public accounting firm, as stated in their report which appears herein.
Changes in Internal Control Over Financial Reporting
There were no changes in internal control over financial reporting during the quarter ended December 31, 2009 that have materially affected, or are reasonably likely to materially affect, our internal control over financial reporting.
| Item 9B. | Other Information |
Not applicable.
| Item 10. | Directors and Executive Officers and Corporate Governance |
The information required by Item 10 with respect to our directors and executive officers is incorporated by reference from the information set forth under the captions “Election of Directors—Executive Officers and Directors” in our Definitive Proxy Statement in connection with our 2010 Annual Meeting of Stockholders to be held on May 21, 2010, or the 2010 Proxy Statement, which will be filed with the Securities and Exchange Commission no later than 120 days after December 31, 2009.
Item 405 of Regulation S-K calls for disclosure of any known late filing or failure by an insider to file a report required by Section 16(a) of the Exchange Act. This information is contained in the section called “Section 16(a) Beneficial Ownership Reporting Compliance” in the 2009 Proxy Statement and is incorporated herein by reference.
We have adopted a code of ethics that applies to all of our directors, officers (including our chief executive officer (our principal executive officer), chief financial officer (our principal financial officer), chief accounting officer (our principal accounting officer), controller and any person performing similar functions) and employees. The Code of Ethics is available on our web site at www.atheros.com. We will disclose on our web site amendments to, or waivers from, our Code of Ethics applicable to our directors and executive officers, including our chief executive officer (our principal executive officer), our chief financial officer (our principal financial officer) and our chief accounting officer (our principal accounting officer), in accordance with applicable laws and regulations.
We have a separately designated standing Audit Committee established in accordance with Section 3(a) (58) (A) of the Securities Exchange Act of 1934. The members of the Audit Committee are Marshall Mohr (Chairperson), Daniel Artusi and Christine King. All of such members meet the independence standards established by the NASDAQ Stock Market for serving on an audit committee. SEC regulations require us to disclose whether a director qualifying as an “audit committee financial expert” serves on our Audit Committee. Our Board of Directors has determined that Marshall Mohr qualifies as an “audit committee financial expert” within the meaning of such regulations.
| Item 11. | Executive Compensation |
The information required by Item 11 is incorporated by reference from the information set forth under the captions “Executive Compensation,” “Election of Directors—Directors’ Compensation” and “Election of Directors—Compensation Committee Interlocks and Insider Participation” in our 2010 Proxy Statement.
55
Table of Contents
| Item 12. | Security Ownership of Certain Beneficial Owners and Management and Related Stockholder Matters |
The information required by Item 12 with respect to security ownership of certain beneficial owners and management is incorporated by reference from the information set forth under the caption “Security Ownership of Certain Beneficial Owners and Management” in our 2010 Proxy Statement.
The following chart sets forth certain information as of December 31, 2009, with respect to our equity compensation plans, specifically our 1998 Stock Incentive Plan, or the 1998 Plan, 2004 Stock Incentive Plan, or the 2004 Plan, 2009 Inducement Grant Incentive Plan, 2004 Employee Stock Purchase Plan, or the ESPP, and certain options previously granted by Intellon Corporation and Attansic Technology Corporation and assumed by us in connection with the acquisition of Intellon and Attansic, respectively. Each of the 1998 Plan, the 2004 Plan and the ESPP has been approved by our stockholders.
Equity Compensation Plan Information
(in 000s, except per share data)
| Plan Category |
Number of securities to be issued upon exercise of outstanding options, warrants and rights |
Weighted average exercise price of outstanding options, warrants and rights |
Number of securities remaining available for future issuance under equity compensation plans(1) | ||||
| Equity compensation plans approved by security holders |
10,939 | $ | 13.81 | 4,034 | |||
| Equity compensation plans not approved by security holders |
1,100 | $ | 10.67 | None | |||
| Total |
12,039 | $ | 13.52 | 4,034 | |||
| (1) | Includes shares reserved for issuance under the 2004 Plan. The number of shares reserved for issuance under the 2004 Plan automatically increases on January 1st of each year by the lesser of (i) 3,750,000 shares, (ii) five percent (5%) of the number of shares of our common stock outstanding on the last day of the immediately preceding fiscal year or (iii) the number of shares determined by the board of directors. In addition, the number of shares reserved for issuance under the 2004 Plan is increased from time to time in an amount equal to the number of shares subject to outstanding options under the 1998 Plan that are subsequently forfeited or terminate for any other reason before being exercised and unvested shares that are forfeited pursuant to the 1998 Plan. Also includes shares reserved for issuance under the ESPP. The number of shares reserved for issuance under the ESPP automatically increases on January 1st of each year by the lesser of (i) 750,000 shares, or (ii) one and one-quarter percent (1.25%) of the number of shares of our common stock outstanding on the last trading day of the immediately preceding fiscal year. |
| Item 13. | Certain Relationships and Related Transactions, and Director Independence |
The information required by Item 13 is incorporated by reference from the information set forth under the caption “Certain Relationships and Related Party Transactions” and “Election of Directors—Committees of the Board of Directors” in our 2010 Proxy Statement.
| Item 14. | Principal Accounting Fees and Services |
The information required by Item 14 is incorporated by reference from the information set forth under the caption “Ratification of the Appointment of Independent Registered Public Accounting Firm—Audit and Non-Audit Fees” and “—Audit Committee Pre-Approval Policies” in our 2010 Proxy Statement.
56
Table of Contents
| Item 15. | Exhibits, Financial Statement Schedules |
(a) 1. Financial Statements
The financial statements filed as part of this report are identified in the Index to Consolidated Financial Statements on page F-1.
2. Financial Statement Schedules
See item 15(c) below.
3. Exhibits
See Item 15(b) below.
(b) Exhibits
The following exhibits are filed herewith or are incorporated by reference to exhibits previously filed with the Securities and Exchange Commission. Atheros Communications, Inc. (the “Registrant”) shall furnish copies of exhibits for a reasonable fee (covering the expense of furnishing copies) upon request.
| Exhibit |
Description | |
| 2.1 | Agreement and Plan of Merger dated September 8, 2009, by and among the Registrant, Iceman Acquisition One Corporation, Iceman Acquisition Two LLC and Intellon Corporation (filed as Exhibit 2.1 to the Registrant’s Current Report on Form 8-K filed September 8, 2009, and incorporated herein by reference).
The following exhibits and schedule to the Agreement and Plan of Merger have been omitted. The Registrant will furnish copies of the omitted exhibits and schedule to the SEC upon request. | |
| Exhibit A Form of Support Agreement Exhibit B Form of Parent Tax Representation Letter Exhibit C Form of Company Tax Representation Letter Exhibit D Form of License Agreement Exhibit E Form of Pillsbury Winthrop Shaw Pittman LLP Tax Opinion | ||
| Schedule A Certain Employee Arrangements | ||
| 3.1 | Restated Certificate of Incorporation of the Registrant (filed as Exhibit 3.2 to the Registrant’s Registration Statement on Form S-1, file no. 333-110807, and incorporated herein by reference | |
| 3.2 | Amended and Restated Bylaws of the Registrant (filed as Exhibit 3.4 to the Registrant’s Registration Statement on Form S-1, file no. 333-110807, and incorporated herein by reference). | |
| 10.1(1) | Form of Indemnification Agreement between the Registrant and its officers and directors (filed as Exhibit 10.1 to the Registrant’s Registration Statement on Form S-1, file no. 333-110807, and incorporated herein by reference). | |
| 10.2(1) | 1998 Stock Incentive Plan and form of agreements thereunder (filed as Exhibit 10.2 to the Registrant’s Registration Statement on Form S-1, file no. 333-110807, and incorporated herein by reference). | |
| 10.3(1) | 2004 Stock Incentive Plan (filed as Exhibit 10.1 to the Registrant’s Quarterly Report on Form 10-Q for the quarter ended March 31, 2008, and incorporated herein by reference). | |
| 10.4(1) | Amendment dated October 22, 2008, to 2004 Stock Incentive Plan (filed as Exhibit 10.1 to the Registrant’s Quarterly Report on Form 10-Q for the quarter ended September 30, 2008, and incorporated herein by reference). | |
| 10.5(1) | Form of stock option agreement under 2004 Stock Incentive Plan. | |
57
Table of Contents
| Exhibit |
Description | |
| 10.6(1) | Form of restricted stock award agreement under 2004 Stock Incentive Plan (filed as Exhibit 10.2 to the Registrant’s Quarterly Report on Form 10-Q for the quarter ended March 31, 2005, and incorporated herein by reference). | |
| 10.7(1) | Form of restricted stock unit agreement under 2004 Stock Incentive Plan. | |
| 10.8(1) | Intellon Corporation Third Amended and Restated 2000 Employee Incentive Plan (filed as Exhibit 99.1 to the Registrant’s Registration Statement on Form S-8, file no. 333-163735, and incorporated herein by reference). | |
| 10.9(1) | Intellon Corporation 2007 Equity Incentive Plan (filed as Exhibit 99.2 to the Registrant’s Registration Statement on Form S-8, file no. 333-163735, and incorporated herein by reference). | |
| 10.10(1) | Form of Stock Option Assumption Agreement (filed as Exhibit 99.3 to the Registrant’s Registration Statement on Form S-8, file no. 333-163735, and incorporated herein by reference). | |
| 10.11(1) | Form of Stock Unit Assumption Agreement (filed as Exhibit 99.4 to the Registrant’s Registration Statement on Form S-8, file no. 333-163735, and incorporated herein by reference). | |
| 10.12(1) | 2009 Inducement Grant Incentive Plan (filed as Exhibit 99.5 to the Registrant’s Registration Statement on Form S-8, file no. 333-163735, and incorporated herein by reference). | |
| 10.13(1) | Form of restricted stock unit agreement under 2009 Inducement Grant Incentive Plan. | |
| 10.14(1) | 2004 Employee Stock Purchase Plan (filed as Exhibit 10.1 to the Registrant’s Current Report on Form 8-K, filed on April 21, 2006, and incorporated herein by reference). | |
| 10.15 | Lease Agreement dated as of April 8, 2005, between Registrant and Prentiss Properties Acquisition Partners, L.P., (filed as Exhibit 10.1 to the Registrant’s Current Report on Form 8-K filed on April 18, 2005, and incorporated herein by reference). | |
| 10.16 | Warrant to Purchase Shares of Preferred Stock of Atheros Communications, Inc. dated September 6, 2001 by and between the Registrant and GATX Ventures, Inc. (filed as Exhibit 10.8 to the Registrant’s Registration Statement on Form S-1, file no. 333-110807, and incorporated herein by reference). | |
| 10.17(1) | Offer Letter, dated April 9, 2003, by and between the Registrant and Craig Barratt (filed as Exhibit 10.13 to the Registrant’s Registration Statement on Form S-1, file no. 333-110807, and incorporated herein by reference). | |
| 10.18(1) | Severance and Change in Control Agreement, dated February 13, 2009, by and between the Registrant and Craig Barratt (filed as Exhibit 10.12 to the Registrant’s Annual Report on Form 10-K for the year ended December 31, 2008, and incorporated herein by reference). | |
| 10.19(1) | Offer Letter, dated September 26, 2003, by and between the Registrant and Jack Lazar (filed as Exhibit 10.14 to the Registrant’s Registration Statement on Form S-1, file no. 333-110807, and incorporated herein by reference). | |
| 10.20(1) | Severance and Change in Control Agreement, dated February 13, 2009, by and between the Registrant and Jack Lazar (filed as Exhibit 10.14 to the Registrant’s Annual Report on Form 10-K for the year ended December 31, 2008, and incorporated herein by reference). | |
| 10.21(1) | Offer Letter, dated May 14, 2007, by and between the Registrant and Ben Naskar (filed as Exhibit 10.13 to the Registrant’s Annual Report on Form 10-K for the year ended December 31, 2007, and incorporated herein by reference). | |
| 10.22(1) | Severance and Change in Control Agreement, dated February 13, 2009, by and between the Registrant and Ben Naskar (filed as Exhibit 10.16 to the Registrant’s Annual Report on Form 10-K for the year ended December 31, 2008, and incorporated herein by reference). | |
| 10.23(1) | Offer Letter, dated December 29, 2005, by and between the Registrant and Gary Szilagyi (filed as Exhibit 10.12 to the Registrant’s Annual Report on Form 10-K for the year ended December 31, 2005, and incorporated herein by reference). | |
58
Table of Contents
| Exhibit |
Description | |
| 10.24(1) | Severance and Change in Control Agreement, dated February 12, 2009, by and between the Registrant and Gary Szilagyi (filed as Exhibit 10.18 to the Registrant’s Annual Report on Form 10-K for the year ended December 31, 2008, and incorporated herein by reference). | |
| 10.25(1) | Exempt Employee Letter Agreement, dated September 13, 2000, by and between the Registrant and Adam Tachner (filed as Exhibit 10.19 to the Registrant’s Annual Report on Form 10-K for the year ended December 31, 2008, and incorporated herein by reference). | |
| 10.26(1) | Severance and Change in Control Agreement, dated February 12, 2009, by and between the Registrant and Adam Tachner (filed as Exhibit 10.20 to the Registrant’s Annual Report on Form 10-K for the year ended December 31, 2008, and incorporated herein by reference). | |
| 10.27(1) | Amended and Restated Exempt Employee Letter Agreement, dated May 8, 2001 by and between the Registrant and Hing Chu (filed as Exhibit 10.21 to the Registrant’s Annual Report on Form 10-K for the year ended December 31, 2008, and incorporated herein by reference). | |
| 10.28(1) | Severance and Change in Control Agreement, dated February 12, 2009, by and between the Registrant and Hing Chu (filed as Exhibit 10.22 to the Registrant’s Annual Report on Form 10-K for the year ended December 31, 2008, and incorporated herein by reference). | |
| 10.29(1) | Exempt Employee Letter Agreement, dated January 3, 2000, by and between the Registrant and David Torre (filed as Exhibit 10.23 to the Registrant’s Annual Report on Form 10-K for the year ended December 31, 2008, and incorporated herein by reference). | |
| 10.30(1) | Severance and Change in Control Agreement, dated February 12, 2009, by and between the Registrant and David Torre (filed as Exhibit 10.24 to the Registrant’s Annual Report on Form 10-K for the year ended December 31, 2008, and incorporated herein by reference). | |
| 10.31(1) | Summary of 2009 Executive Bonus Plan, adopted by the Compensation Committee of the Board of Directors on February 6, 2009 (filed under Item 5.02 in the Registrant’s Current Report on Form 8-K, filed on February 6, 2009, and incorporated herein by reference). | |
| 10.32 | Form of Support Agreement, in connection with Agreement and Plan of Merger by and among Atheros Communications, Inc, Iceman Acquisition One Corporation, Iceman Acquisition Two LLC and Intellon Corporation (filed as Exhibit 10.1 to the Registrant’s Current Report on Form 8-K, filed on September 8, 2009, and incorporated herein by reference). | |
| 10.33 | Amendment dated December 13, 2008 to 2004 Stock Incentive Plan. | |
| 21.1 | List of Subsidiaries of the Registrant. | |
| 23.1 | Consent of Deloitte & Touche LLP, independent registered public accounting firm. | |
| 23.2 | Consent of PricewaterhouseCoopers LLP, independent registered public accounting firm. | |
| 24 | Power of Attorney (see page 62). | |
| 31.1 | Certificate of Chief Executive Officer pursuant to Section 302 of the Sarbanes-Oxley Act of 2002 (18 U.S.C. Section 1350). | |
| 31.2 | Certificate of Chief Financial Officer pursuant to Section 302 of the Sarbanes-Oxley Act of 2002 (18 U.S.C. Section 1350). | |
| 32.1(2) | Certificate of Chief Executive Officer pursuant to Section 906 of the Sarbanes-Oxley Act of 2002 (18 U.S.C. Section 1350). | |
| 32.2(2) | Certificate of Chief Financial Officer pursuant to Section 906 of the Sarbanes-Oxley Act of 2002 (18 U.S.C. Section 1350). | |
59
Table of Contents
| (1) | Indicates management contract or compensatory plan or arrangement. |
| (2) | The material contained in Exhibit 32.1 and Exhibit 32.2 is not deemed “filed” with the SEC and is not to be incorporated by reference into any filing of the Company under the Securities Act of 1933 or the Securities Exchange Act of 1934, whether made before or after the date hereof and irrespective of any general incorporation language contained in such filing, except to the extent that the registrant specifically incorporates it by reference. |
(c) Financial Statement Schedules.
Schedules not listed above have been omitted because they are not applicable or required, or the information required to be set forth therein is included in the Consolidated Financial Statements or Notes thereto.
60
Table of Contents
Pursuant to the requirements of Section 13 or 15(d) of the Securities Exchange Act of 1934, the registrant has duly caused this report to be signed on its behalf by the undersigned, thereunto duly authorized.
Date: February 12, 2010
| ATHEROS COMMUNICATIONS, INC. |
| /s/ CRAIG H. BARRATT |
| Craig H. Barratt President and Chief Executive Officer (Principal executive officer) |
| /s/ JACK R. LAZAR |
| Jack R. Lazar Chief Financial Officer, Vice President of Corporate Development and Secretary (Duly authorized officer and principal financial officer) |
| /s/ DAVID D. TORRE |
| David D. Torre Vice President and Chief Accounting Officer (Duly authorized officer and principal accounting officer) |
61
Table of Contents
POWER OF ATTORNEY
KNOW ALL MEN BY THESE PRESENTS, that each person whose signature appears below constitutes and appoints Craig H. Barratt and Jack R. Lazar and each of them, his true and lawful attorneys-in-fact and agents, each with full power of substitution and resubstitution, for him and in his name, place and stead, in any and all capacities, to sign any and all amendments to this Annual Report on Form 10-K, and to file the same, with exhibits thereto and other documents in connection therewith, with the Securities and Exchange Commission granting unto said attorneys-in-fact and agents, and each of them, full power and authority to do and perform each and every act and thing requisite and necessary to be done, as fully to all intents and purposes as he might or could do in person, hereby ratifying and confirming all that each of said attorneys-in-fact and agents, or his substitute or substitutes may lawfully do or cause to be done by virtue hereof.
Pursuant to the requirements of the Securities Exchange Act of 1934, this report has been signed below by the following persons on behalf of the registrant and in the capacities and on the dates indicated.
| Signature |
Title |
Date | ||
| /s/ JOHN L. HENNESSY |
Chairman of the Board of Directors |
February 12, 2010 | ||
| John L. Hennessy | ||||
| /s/ CRAIG H. BARRATT |
President and Chief Executive |
February 12, 2010 | ||
| Craig H. Barratt | Officer (Principal Executive Officer) and Director |
|||
| /s/ JACK R. LAZAR Jack R. Lazar |
Vice President of Corporate Development, Chief Financial Officer and Secretary (Principal Financial Officer) |
February 12, 2010 | ||
| /s/ DAVID D. TORRE |
Vice President and Chief Accounting Officer (Principal Accounting Officer) |
February 12, 2010 | ||
| David D. Torre | ||||
| /s/ DANIEL A. ARTUSI |
Director |
February 12, 2010 | ||
| Daniel A. Artusi | ||||
| /s/ CHARLES E. HARRIS Charles E. Harris |
Director |
February 12, 2010 | ||
| /s/ CHRISTINE KING |
Director |
February 12, 2010 | ||
| Christine King | ||||
| /s/ TERESA H. MENG |
Director |
February 12, 2010 | ||
| Teresa H. Meng | ||||
| /s/ MARSHALL L. MOHR |
Director |
February 12, 2010 | ||
| Marshall L. Mohr | ||||
| /s/ ANDREW S. RAPPAPORT |
Director |
February 12, 2010 | ||
| Andrew S. Rappaport | ||||
| /s/ WILLY C. SHIH |
Director |
February 12, 2010 | ||
| Willy C. Shih | ||||
62
Table of Contents
ATHEROS COMMUNICATIONS, INC.
INDEX TO CONSOLIDATED FINANCIAL STATEMENTS
| Page | ||
| F-2 | ||
| F-3 | ||
| F-4 | ||
| F-5 | ||
| Consolidated Statements of Stockholders’ Equity and Comprehensive Income |
F-6 | |
| F-7 | ||
| F-8 | ||
Table of Contents
REPORT OF INDEPENDENT REGISTERED PUBLIC ACCOUNTING FIRM
To the Board of Directors and Stockholders of
Atheros Communications, Inc.
In our opinion, the accompanying consolidated balance sheet and the related consolidated statements of operations, stockholders’ equity and comprehensive income, and cash flows for the year ended December 31, 2009 present fairly, in all material respects, the financial position of Atheros Communications, Inc. and its subsidiaries (the Company) at December 31, 2009, and the results of their operations and their cash flows for the year then ended in conformity with accounting principles generally accepted in the United States of America. Also in our opinion, the Company maintained, in all material respects, effective internal control over financial reporting as of December 31, 2009, based on criteria established in Internal Control—Integrated Framework issued by the Committee of Sponsoring Organizations of the Treadway Commission (COSO). The Company’s management is responsible for these financial statements, for maintaining effective internal control over financial reporting and for its assessment of the effectiveness of internal control over financial reporting, included in Management’s Report on Internal Control over Financial Reporting appearing under Item 9A. Our responsibility is to express opinions on these financial statements and on the Company’s internal control over financial reporting based on our integrated audit. We conducted our audit in accordance with the standards of the Public Company Accounting Oversight Board (United States). Those standards require that we plan and perform the audit to obtain reasonable assurance about whether the financial statements are free of material misstatement and whether effective internal control over financial reporting was maintained in all material respects. Our audit of the financial statements included examining, on a test basis, evidence supporting the amounts and disclosures in the financial statements, assessing the accounting principles used and significant estimates made by management, and evaluating the overall financial statement presentation. Our audit of internal control over financial reporting included obtaining an understanding of internal control over financial reporting, assessing the risk that a material weakness exists, and testing and evaluating the design and operating effectiveness of internal control based on the assessed risk. Our audit also included performing such other procedures as we considered necessary in the circumstances. We believe that our audit provides a reasonable basis for our opinions.
As discussed in Note 1 of the Notes to Consolidated Financial Statements, in 2009 the Company changed the manner in which it accounts for business combinations.
A company’s internal control over financial reporting is a process designed to provide reasonable assurance regarding the reliability of financial reporting and the preparation of financial statements for external purposes in accordance with generally accepted accounting principles. A company’s internal control over financial reporting includes those policies and procedures that (i) pertain to the maintenance of records that, in reasonable detail, accurately and fairly reflect the transactions and dispositions of the assets of the company; (ii) provide reasonable assurance that transactions are recorded as necessary to permit preparation of financial statements in accordance with generally accepted accounting principles, and that receipts and expenditures of the company are being made only in accordance with authorizations of management and directors of the company; and (iii) provide reasonable assurance regarding prevention or timely detection of unauthorized acquisition, use, or disposition of the company’s assets that could have a material effect on the financial statements.
Because of its inherent limitations, internal control over financial reporting may not prevent or detect misstatements. Also, projections of any evaluation of effectiveness to future periods are subject to the risk that controls may become inadequate because of changes in conditions, or that the degree of compliance with the policies or procedures may deteriorate.
As described in Management’s Report on Internal Control over Financial Reporting, management has excluded Intellon Corporation from its assessment of internal control over financial reporting as of December 31, 2009 because it was acquired by the Company in a purchase business combination during December 2009. We have also excluded Intellon Corporation from our audit of internal control over financial reporting. Intellon Corporation is a wholly-owned subsidiary whose total assets and net revenues represent less than 3% and less than 1%, respectively, of the related consolidated financial statement amounts as of and for the year ended December 31, 2009.
| /s/ PricewaterhouseCoopers LLP |
| San Jose, California |
| February 12, 2010 |
F-2
Table of Contents
REPORT OF INDEPENDENT REGISTERED PUBLIC ACCOUNTING FIRM
To the Board of Directors and Stockholders of Atheros Communications, Inc.:
We have audited the accompanying consolidated balance sheet of Atheros Communications, Inc. and subsidiaries (the “Company”) as of December 31, 2008, and the related consolidated statements of operations, stockholders’ equity and comprehensive income, and cash flows for the years ended December 31, 2008 and 2007. These consolidated financial statements are the responsibility of the Company’s management. Our responsibility is to express an opinion on these consolidated financial statements based on our audits.
We conducted our audits in accordance with the standards of the Public Company Accounting Oversight Board (United States). Those standards require that we plan and perform the audit to obtain reasonable assurance about whether the financial statements are free of material misstatement. An audit includes examining, on a test basis, evidence supporting the amounts and disclosures in the financial statements. An audit also includes assessing the accounting principles used and significant estimates made by management, as well as evaluating the overall financial statement presentation. We believe that our audits provide a reasonable basis for our opinion.
In our opinion, such consolidated financial statements present fairly, in all material respects, the financial position of the Company at December 31, 2008, and the results of its operations and its cash flows for the years ended December 31, 2008 and 2007, in conformity with accounting principles generally accepted in the United States of America.
| /s/ Deloitte & Touche LLP |
| San Jose, California |
| February 13, 2009 |
F-3
Table of Contents
CONSOLIDATED BALANCE SHEETS
In thousands, except per share amounts
| December 31, | ||||||
| 2009 | 2008 | |||||
| ASSETS |
||||||
| Current assets: |
||||||
| Cash and cash equivalents |
$ | 148,376 | $ | 114,530 | ||
| Short-term marketable securities |
253,859 | 179,228 | ||||
| Accounts receivable, net |
58,012 | 58,385 | ||||
| Inventory |
70,396 | 69,813 | ||||
| Prepaid expenses, deferred income taxes and other current assets |
26,985 | 15,889 | ||||
| Total current assets |
557,628 | 437,845 | ||||
| Property and equipment, net |
14,955 | 14,789 | ||||
| Long-term investments |
15,523 | 16,963 | ||||
| Goodwill |
188,877 | 101,687 | ||||
| Acquired intangible assets, net |
135,352 | 23,305 | ||||
| Deferred income taxes and other assets |
3,014 | 21,119 | ||||
| Total assets |
$ | 915,349 | $ | 615,708 | ||
| LIABILITIES AND STOCKHOLDERS’ EQUITY |
||||||
| Current liabilities: |
||||||
| Accounts payable |
$ | 59,866 | $ | 30,511 | ||
| Accrued and other current liabilities |
81,202 | 65,490 | ||||
| Total current liabilities |
141,068 | 96,001 | ||||
| Deferred income taxes and other long-term liabilities |
42,421 | 48,229 | ||||
| Commitments and contingencies |
||||||
| Stockholders’ equity: |
||||||
| Common stock, $0.0005 par value, 200,000 shares authorized; 67,787 and 60,794 shares issued and outstanding at December 31, 2009 and 2008, respectively |
663,474 | 451,066 | ||||
| Accumulated other comprehensive income |
1,869 | 302 | ||||
| Retained earnings |
66,517 | 20,110 | ||||
| Total stockholders’ equity |
731,860 | 471,478 | ||||
| Total liabilities and stockholders’ equity |
$ | 915,349 | $ | 615,708 | ||
See notes to consolidated financial statements.
F-4
Table of Contents
CONSOLIDATED STATEMENTS OF OPERATIONS
In thousands, except per share amounts
| Years Ended December 31, | ||||||||||||
| 2009 | 2008 | 2007 | ||||||||||
| Net revenue |
$ | 542,468 | $ | 472,396 | $ | 416,960 | ||||||
| Cost of goods sold |
278,865 | 236,431 | 209,579 | |||||||||
| Gross profit |
263,603 | 235,965 | 207,381 | |||||||||
| Operating expenses: |
||||||||||||
| Research and development |
130,592 | 121,565 | 100,936 | |||||||||
| Sales and marketing |
59,315 | 51,154 | 38,010 | |||||||||
| General and administrative |
29,414 | 25,109 | 21,189 | |||||||||
| Amortization of acquired intangible assets |
11,570 | 12,231 | 7,402 | |||||||||
| Acquisition-related charges |
10,534 | — | — | |||||||||
| Acquired in-process research and development |
— | — | 4,897 | |||||||||
| Total operating expenses |
241,425 | 210,059 | 172,434 | |||||||||
| Income from operations |
22,178 | 25,906 | 34,947 | |||||||||
| Interest income, net |
6,004 | 8,878 | 11,516 | |||||||||
| Impairment of long-term investments |
(2,018 | ) | (15,490 | ) | (2,277 | ) | ||||||
| Income before income taxes |
26,164 | 19,294 | 44,186 | |||||||||
| Income tax benefit (provision) |
20,243 | (422 | ) | (4,206 | ) | |||||||
| Net income |
$ | 46,407 | $ | 18,872 | $ | 39,980 | ||||||
| Basic net income per share |
$ | 0.75 | $ | 0.32 | $ | 0.71 | ||||||
| Shares used in computing basic net income per share |
62,040 | 59,804 | 55,917 | |||||||||
| Diluted net income per share |
$ | 0.73 | $ | 0.30 | $ | 0.67 | ||||||
| Shares used in computing diluted net income per share |
63,933 | 62,070 | 59,330 | |||||||||
See notes to consolidated financial statements.
F-5
Table of Contents
CONSOLIDATED STATEMENTS OF STOCKHOLDERS’ EQUITY AND COMPREHENSIVE INCOME
In thousands
| Common Stock | Deferred Stock-Based Compensation |
Accumulated Other Comprehensive Income (Loss) |
Retained Earnings (Accumulated Deficit) |
Total Stockholders’ Equity |
||||||||||||||||||
| Shares | Amount | |||||||||||||||||||||
| BALANCES, January 1, 2007 |
54,304 | $ | 319,580 | $ | (156 | ) | $ | (81 | ) | $ | (38,401 | ) | $ | 280,942 | ||||||||
| Components of comprehensive income: |
||||||||||||||||||||||
| Net income |
39,980 | 39,980 | ||||||||||||||||||||
| Other comprehensive income |
266 | 266 | ||||||||||||||||||||
| Total comprehensive income |
40,246 | |||||||||||||||||||||
| Cumulative effect of adoption of updated accounting guidance related to uncertain tax positions |
(5,777 | ) | (341 | ) | (6,118 | ) | ||||||||||||||||
| Exercise of stock options and issuance of restricted stock |
2,869 | 17,290 | 17,290 | |||||||||||||||||||
| Issuance of common stock in connection with acquisitions |
1,280 | 38,630 | 38,630 | |||||||||||||||||||
| Issuance of common stock pursuant to employee stock purchase plan |
275 | 5,767 | 5,767 | |||||||||||||||||||
| Stock-based compensation, net of cancellations |
21,068 | 146 | 21,214 | |||||||||||||||||||
| Tax benefit on employee stock transactions |
3,486 | 3,486 | ||||||||||||||||||||
| BALANCES, December 31, 2007 |
58,728 | 400,044 | (10 | ) | 185 | 1,238 | 401,457 | |||||||||||||||
| Components of comprehensive income: |
||||||||||||||||||||||
| Net income |
18,872 | 18,872 | ||||||||||||||||||||
| Other comprehensive income |
117 | 117 | ||||||||||||||||||||
| Total comprehensive income |
18,989 | |||||||||||||||||||||
| Exercise of stock options and issuance of restricted stock |
1,701 | 11,649 | 11,649 | |||||||||||||||||||
| Issuance of common stock pursuant to employee stock purchase plan |
365 | 6,912 | 6,912 | |||||||||||||||||||
| Stock-based compensation, net of cancellations |
30,636 | 10 | 30,646 | |||||||||||||||||||
| Tax benefit on employee stock transactions |
1,825 | 1,825 | ||||||||||||||||||||
| BALANCES, December 31, 2008 |
60,794 | 451,066 | — | 302 | 20,110 | 471,478 | ||||||||||||||||
| Components of comprehensive income: |
||||||||||||||||||||||
| Net income |
46,407 | 46,407 | ||||||||||||||||||||
| Other comprehensive income |
1,567 | 1,567 | ||||||||||||||||||||
| Total comprehensive income |
47,974 | |||||||||||||||||||||
| Exercise of stock options and issuance of restricted stock |
2,212 | 14,193 | 14,193 | |||||||||||||||||||
| Issuance of common stock in connection with acquisitions |
4,216 | 140,348 | 140,348 | |||||||||||||||||||
| Issuance of common stock pursuant to employee stock purchase plan |
565 | 8,381 | 8,381 | |||||||||||||||||||
| Stock-based compensation, net of cancellations |
48,810 | 48,810 | ||||||||||||||||||||
| Tax benefit on employee stock transactions |
676 | 676 | ||||||||||||||||||||
| BALANCES, December 31, 2009 |
67,787 | $ | 663,474 | $ | — | $ | 1,869 | $ | 66,517 | $ | 731,860 | |||||||||||
See notes to consolidated financial statements.
F-6
Table of Contents
CONSOLIDATED STATEMENTS OF CASH FLOWS
In thousands
| Years Ended December 31, | ||||||||||||
| 2009 | 2008 | 2007 | ||||||||||
| CASH FLOWS FROM OPERATING ACTIVITIES: |
||||||||||||
| Net income |
$ | 46,407 | $ | 18,872 | $ | 39,980 | ||||||
| Adjustments to reconcile net income to net cash provided by operating activities: |
||||||||||||
| Depreciation and amortization |
6,892 | 6,543 | 5,362 | |||||||||
| Stock-based compensation |
48,810 | 30,446 | 21,214 | |||||||||
| Impairment of long-term investments |
2,018 | 15,490 | 2,277 | |||||||||
| Amortization and write-off of acquired intangible assets, acquired in-process research and development and other |
11,570 | 12,803 | 12,483 | |||||||||
| Deferred income taxes |
(22,983 | ) | (2,028 | ) | 1,560 | |||||||
| Tax benefit from employee stock-based awards |
676 | 1,825 | 3,486 | |||||||||
| Excess tax benefit from employee stock-based awards |
(671 | ) | (1,545 | ) | (2,933 | ) | ||||||
| Change in assets and liabilities, net of impact of acquisitions: |
||||||||||||
| Accounts receivable |
11,556 | (366 | ) | (10,740 | ) | |||||||
| Inventory |
7,599 | (35,045 | ) | (7,699 | ) | |||||||
| Prepaid expenses and other current assets |
(2,013 | ) | (1,882 | ) | (1,708 | ) | ||||||
| Accounts payable |
20,242 | 605 | 11,859 | |||||||||
| Deferred revenue |
(770 | ) | (58 | ) | 401 | |||||||
| Accrued and other current liabilities |
13,498 | 17,771 | (4,013 | ) | ||||||||
| Net cash provided by operating activities |
142,831 | 63,431 | 71,529 | |||||||||
| CASH FLOWS FROM INVESTING ACTIVITIES: |
||||||||||||
| Net cash paid for acquisitions |
(70,701 | ) | (505 | ) | (23,676 | ) | ||||||
| Purchase of property and equipment, net |
(3,869 | ) | (7,389 | ) | (9,710 | ) | ||||||
| Purchase of marketable securities |
(222,042 | ) | (194,600 | ) | (123,597 | ) | ||||||
| Maturities of marketable securities |
164,151 | 60,997 | 133,368 | |||||||||
| Other non-current assets |
231 | (2,466 | ) | (331 | ) | |||||||
| Proceeds from disposal of assets held for sale from acquisition |
— | 700 | 2,300 | |||||||||
| Net cash used in investing activities |
(132,230 | ) | (143,263 | ) | (21,646 | ) | ||||||
| CASH FLOWS FROM FINANCING ACTIVITIES: |
||||||||||||
| Issuance of common stock |
22,574 | 18,561 | 23,057 | |||||||||
| Excess tax benefit from employee stock-based awards |
671 | 1,545 | 2,933 | |||||||||
| Net cash provided by financing activities |
23,245 | 20,106 | 25,990 | |||||||||
| NET INCREASE (DECREASE) IN CASH AND CASH EQUIVALENTS |
33,846 | (59,726 | ) | 75,873 | ||||||||
| CASH AND CASH EQUIVALENTS, Beginning of year |
114,530 | 174,256 | 98,383 | |||||||||
| CASH AND CASH EQUIVALENTS, End of year |
$ | 148,376 | $ | 114,530 | $ | 174,256 | ||||||
| SUPPLEMENTAL DISCLOSURE OF CASH FLOW INFORMATION: |
||||||||||||
| Unpaid property and equipment additions |
$ | 124 | $ | 1,062 | $ | 611 | ||||||
| Cash paid for income taxes |
$ | 648 | $ | 1,403 | $ | 259 | ||||||
| Common stock issued in connection with acquisitions |
$ | 140,348 | $ | — | $ | 38,630 | ||||||
See notes to consolidated financial statements.
F-7
Table of Contents
NOTES TO CONSOLIDATED FINANCIAL STATEMENTS
1. Summary of Significant Accounting Policies
Organization—Atheros Communications, Inc. (the “Company”), was incorporated in May 1998 in the state of Delaware and commenced operations in December 1998. The Company is a developer of semiconductor system solutions for communications products.
Basis of Presentation—The consolidated financial statements include the accounts of the Company and all its wholly–owned and majority-owned subsidiaries. All intercompany accounts and transactions have been eliminated in consolidation.
Use of Estimates—The preparation of financial statements in conformity with accounting principles generally accepted in the United States of America (“U.S. GAAP”) requires management to make estimates and assumptions that affect the reported amounts of assets, liabilities and disclosures of contingent assets and liabilities at the date of the financial statements and the reported amounts of expenses during the reporting period. On an ongoing basis, the Company evaluates its estimates, including those related to income taxes, revenue recognition, inventory, stock-based compensation and the recoverability of goodwill and intangible assets. The Company bases its estimates on historical experience and on various other assumptions that it believes to be reasonable under the circumstances. Actual results may differ from these estimates.
Certain Significant Risks and Uncertainties—The Company operates in a dynamic industry and, accordingly, can be affected by a variety of factors. For example, changes in any of the following areas could have a negative effect on the Company in terms of its future financial position, results of operations or cash flows: a downturn in the overall semiconductor industry or communications semiconductor market; regulatory changes; fundamental changes in the technology underlying telecommunications products or incorporated in customers’ products; market acceptance of the Company’s products under development; development of sales channels; litigation or other claims against the Company; the hiring, training and retention of key employees; integration of businesses acquired by the Company; successful and timely completion of product development efforts; and new product introductions by competitors.
Accounting Standards Codification—Effective July 1, 2009, the Company adopted the Financial Accounting Standards Board’s (“FASB’s”) Accounting Standards Codification as the source of authoritative accounting principles recognized by the FASB to be applied by nongovernmental entities in the preparation of financial statements in conformity with U.S. GAAP. Rules and interpretive releases of the Securities and Exchange Commission (“SEC”) under authority of federal securities laws are also sources of authoritative U.S. GAAP for SEC registrants. All guidance contained in the Codification carries an equal level of authority. The Codification superseded all existing non-SEC accounting and reporting standards. All other non-grandfathered, non-SEC accounting literature not included in the Codification is non-authoritative. The FASB will not issue new standards in the form of Statements, FASB Staff Positions or Emerging Issues Task Force Abstracts. Instead, it will issue Accounting Standards Updates (“ASUs”). The FASB will not consider ASUs as authoritative in their own right. ASUs will serve only to update the Codification, provide background information about the guidance and provide the bases for conclusions on the change(s) in the Codification.
Fair Value of Financial Instruments—The Company’s financial instruments consist primarily of cash and cash equivalents, marketable securities, auction-rate securities and preferred stock, accounts receivable and accounts payable. The Company believes that the carrying amounts of the financial instruments approximate their respective fair values. The Company regularly reviews its investment portfolio to identify and evaluate investments that have indications of possible impairment. Factors considered in determining whether a loss is temporary include: the length of time and extent to which fair value has been lower than the cost basis; the financial condition, credit quality and near-term prospects of the investee; and whether it is more likely than not that the Company will be required to sell the security prior to any anticipated recovery in fair value. When there is no readily available market data, fair value estimates may be made by the Company, which may not necessarily represent the amounts that could be realized in a current or future sale of these assets.
Cash Equivalents—Cash equivalents consist of highly liquid debt instruments purchased with a maturity of three months or less from date of purchase.
Marketable Securities—Marketable securities are classified as available for sale and are reported at fair value with unrealized gains and losses reported as other comprehensive income (loss) in stockholders’ equity. The Company views its available-for-sale portfolio as available for use in its current operations. Accordingly, the Company has classified all investments in available for sale securities with readily available markets as short-term, even though the stated maturity date may be one year or more beyond the current balance sheet date, because of the intent and ability to sell these securities prior to maturity to meet liquidity needs or as part of a risk management program. When the Company finds that a readily available market does not currently exist for the securities, the Company classifies these securities as long term. The cost of securities sold is based on the specific-identification method. The amortized cost of securities is adjusted for the accretion of discounts to maturity.
F-8
Table of Contents
ATHEROS COMMUNICATIONS, INC.
NOTES TO CONSOLIDATED FINANCIAL STATEMENTS—(Continued)
The Company reviews its investments for impairment to determine if the impairment is “temporary” or “other-than-temporary.” A temporary impairment charge results in an unrealized loss being recorded in the other comprehensive income component of stockholders’ equity. It occurs if a loss in an investment is determined to be temporary in nature and the Company concludes it has the ability to hold the investment until a recovery in market value takes place. Such an unrealized loss does not reduce the Company’s net income for the applicable accounting period because the loss is not viewed as other-than-temporary. An other-than-temporary impairment charge is recorded to the Statement of Operations to the extent the Company determines there is a loss in fair value that is other-than-temporary. In making this determination, the Company reviews several factors to determine whether the losses were other-than-temporary, including but not limited to: i) the length of time each security was in an unrealized loss position, ii) the extent to which fair value was less than cost, iii) the financial condition and near term prospects of the issuer or insurer and, iv) whether it is more likely than not that the Company will be required to sell the security prior to any anticipated recovery in fair value.
Inventory—Inventory cost is recorded at the lower of market value or standard cost basis (which approximates actual cost on a first-in, first-out basis). Inventory reserves once established are not reversed until the related inventory has been sold or scrapped.
Property and Equipment—Property and equipment are stated at cost and depreciated using the straight-line method over estimated useful lives as follows: furniture and fixtures—five years; test equipment, computer software and hardware—three to six years. Amortization of leasehold improvements is computed using the straight-line method over the shorter of the lease term or the estimated useful lives of the related assets.
Goodwill and Acquired Intangibles Assets—Goodwill is recorded when the consideration paid for an acquisition exceeds the fair value of net tangible and intangible assets acquired. Acquisition-related intangible assets are amortized on a straight-line basis over their economic lives of three to five years for purchased technology, two to seven years for customer relationships and two to four years for covenants-not-to-compete as the Company believes this method would most closely reflect the pattern in which the economic benefits of the assets will be consumed.
Goodwill is measured and tested on an annual basis or more frequently if the Company believes indicators of impairment exist. The performance of the test involves a two-step process. The first step requires comparing the fair value of the reporting unit to its net book value, including goodwill. The Company has one reporting unit, the fair value of which is determined to equal the market capitalization of the Company as determined through quoted market prices, adjusted for a reasonable control premium. A potential impairment exists if the fair value of the reporting unit is lower than its net book value. The reporting unit was not at risk of failing step one of the annual goodwill impairment test for the years ended December 31, 2009 and 2008. The second step of the process is only performed if a potential impairment exists, and it involves determining the difference between the fair value of the reporting unit’s net assets other than goodwill to the fair value of the reporting unit and if the difference is less than the net book value of goodwill an impairment exists and is recorded. The Company has not been required to perform this second step of the process because the fair value of the reporting unit has exceeded the net book value at every measurement date.
Long-Lived Assets—The Company accounts for long-lived assets, including other purchased finite-lived intangible assets acquired in business combinations, in accordance with the authoritative accounting guidance related to property, plant and equipment, which requires impairment losses to be recorded on long-lived assets used in operations when indicators of impairment, such as reductions in demand or significant economic slowdowns in the semiconductor industry, are present. Reviews are performed to determine whether the carrying value of an asset is impaired, based on comparisons to undiscounted expected future cash flows. If this comparison indicates that there is impairment, the impaired asset is written down to fair value, which is typically calculated using: (i) quoted market prices and/or (ii) discounted expected future cash flows. Impairment is based on the excess of the carrying amount over the fair value of those assets. The Company’s estimates regarding future anticipated net revenue and cash flows, the remaining economic life of the products and technologies, or both, may differ from those used to assess the recoverability of assets. In that event, impairment charges or shortened useful lives of certain long-lived assets may be required, resulting in a reduction in net income or an increase to net loss in the period when such determinations are made.
Income Taxes—The Company accounts for income taxes under an asset and liability approach. Deferred income taxes reflect the impact of temporary differences between assets and liabilities recognized for financial reporting purposes and such amounts recognized for income tax reporting purposes, net operating loss carryforwards and other tax credits measured by applying currently enacted tax laws. Valuation allowances are provided when necessary to reduce deferred tax assets to an amount that is more likely than not to be realized.
F-9
Table of Contents
ATHEROS COMMUNICATIONS, INC.
NOTES TO CONSOLIDATED FINANCIAL STATEMENTS—(Continued)
Effective January 1, 2007, the Company adopted guidance that clarifies the accounting for uncertainty in income taxes recognized in an enterprise’s financial statements. This topic prescribes a recognition threshold and measurement attribute for the financial statement recognition and measurement of a tax position taken or expected to be taken in a tax return. It also provides guidance on the derecognition of tax benefits, classification on the balance sheet, interest and penalties, accounting in interim periods, disclosure, and transition. The guidance requires significant judgment in determining what constitutes an individual tax position, as well as assessing the outcome of each tax position. Changes in judgment as to recognition or measurement of tax positions can materially affect the estimate of the effective tax rate and consequently, affect the Company’s operating results.
Revenue Recognition—The Company derives revenue primarily from the sale of its wired and wireless chipsets. In addition, the Company generates revenue from arrangements to license its software and arrangements to provide services. Revenue from software licenses and services represented less than 1% of total revenue for all periods presented. The Company recognizes revenue at the time the following criteria are met: (1) persuasive evidence of an arrangement exists; (2) delivery has occurred or services have been rendered; (3) the fee is fixed or determinable; and (4) collectibility is reasonably assured. Determination of criteria (3) and (4) are based on management’s judgment regarding the fixed nature of the fee charged for the products delivered and the collectibility of those fees. Should changes in conditions cause management to determine these criteria are not met for certain future transactions, revenue recognized for any reporting period could be adversely impacted.
The Company provides customer incentives to some of its direct and indirect customers. These obligations are estimated and recorded as a reduction of revenue at the time at which the Company ships product to customers. Estimated incentive amounts are recorded as a reduction of revenue and are based on agreements between the Company and its customers. Estimating incentive amounts requires that the Company make estimates regarding the percentage of committed incentives that will be submitted by its customers and the value of the incentives at the time of redemption. These estimates may require revisions at later dates if the actual claims submitted by the customers differ significantly from the original estimates.
The Company defers recognition of revenue and the related cost of goods sold on shipments to distributors that have rights of return or price protection privileges on unsold products until the products are sold by the distributor to its customers. Price protection rights grant distributors the right to a credit in the event of declines in the price of the Company’s products.
Product Warranty—The Company generally provides a warranty on its products for a period of one year, however it may be longer for certain customers. Accordingly, the Company provides for the warranty costs at the time of sale based on historical activity. The determination of such provisions requires the Company to make estimates of product return rates and expected costs to repair or replace the products under warranty. If actual return rates and/or repair and replacement costs differ significantly from these estimates, adjustments to recognize additional cost of sales may be required in future periods. Components of the obligation for warranty costs during the years ended December 31, 2009 and 2008 consisted of the following (in thousands):
| December 31, | ||||||||
| 2009 | 2008 | |||||||
| Beginning balance |
$ | 1,433 | $ | 2,638 | ||||
| Additions related to current period sales and acquisitions |
4,125 | 1,786 | ||||||
| Warranty costs incurred in the current period |
(1,869 | ) | (1,125 | ) | ||||
| Adjustments to accruals related to prior period sales |
(1,084 | ) | (1,866 | ) | ||||
| Ending balance |
$ | 2,605 | $ | 1,433 | ||||
Stock-Based Compensation—The Company accounts for stock-based compensation in accordance with the fair value recognition provisions the FASB’s authoritative accounting guidance related to stock-based compensation, using the modified prospective application method. Accordingly, results from prior periods have not been restated. Under the modified prospective transition method, stock-based compensation expense for the year ended December 31, 2006 includes compensation expense for stock-based awards granted by the Company as a public company prior to, but not yet vested as of, January 1, 2006, based on the grant-date fair value estimated in accordance with the fair value-based method. For stock-based awards granted before November 26, 2003 (the date on which the Company filed its registration statement for its initial public offering), the Company recorded compensation expense using the intrinsic value-based method. Stock-based compensation expense for all stock-based compensation awards granted after December 31, 2005 is based on the grant-date fair value estimated using the Black-Scholes model. The Company generally recognizes compensation costs for all stock-based
F-10
Table of Contents
ATHEROS COMMUNICATIONS, INC.
NOTES TO CONSOLIDATED FINANCIAL STATEMENTS—(Continued)
compensation awards granted after December 31, 2005 on a straight-line basis over the requisite service period of the awards, which is generally the option vesting term of four to five years. Compensation costs of awards with performance-based vesting conditions is recognized using the graded vesting method.
Prior to the adoption of the current authoritative accounting guidance related to stock-based compensation, the Company recognized stock-based compensation and complied with the disclosure provisions of prior authoritative guidance. The Company amortized deferred stock-based compensation using the graded vesting method over the vesting periods of the stock options, generally four to five years. The graded vesting method provided for vesting of the overall awards at interim dates and resulted in accelerated expense recognition compared to the straight-line method.
Software Development Costs—Costs for the development of new software products and substantial enhancements to existing software products are expensed as incurred until technological feasibility has been established, at which time any additional costs would be capitalized. The costs to develop such software have not been capitalized as the Company believes its current software development process is essentially completed concurrent with the establishment of technological feasibility.
Research and Development—Costs incurred in research and development are charged to operations as incurred, including mask sets and reticles. The Company expenses all costs for internally developed patents as incurred.
Foreign Currency—The functional currency of the Company’s foreign subsidiaries is the U.S. dollar. For those subsidiaries whose books and records are not maintained in the functional currency, all monetary assets and liabilities are remeasured at the current exchange rate at the end of each period reported, nonmonetary assets and liabilities are remeasured at historical exchange rates and revenues and expenses are remeasured at average exchange rates in effect during the period. Transaction gains and losses, which are included in operating expense in the accompanying consolidated statements of operations were not significant for any period presented.
Net Income per Share—Basic net income per share is computed using the weighted-average number of common shares outstanding during the period, less shares subject to repurchase. Diluted net income per share is computed using the weighted-average number of common shares and dilutive potential common shares outstanding during the period.
Comprehensive Income—Comprehensive income is comprised of two components: net income and other comprehensive income (loss). Other comprehensive income (loss) refers to revenues, expenses, gains and losses that under generally accepted accounting principles are recorded as an element of stockholders’ equity, but are excluded from net income. Statements of comprehensive income for the years ended December 31, 2009, 2008 and 2007 have been included within the consolidated statements of stockholders’ equity. Accumulated other comprehensive income (loss) in the accompanying consolidated balance sheets primarily consists of the unrealized gain (loss) on marketable securities.
Concentration of Credit Risk—Financial instruments that potentially subject the Company to concentrations of credit risk consist primarily of cash and cash equivalents, marketable securities, auction-rate securities and trade receivables. Risks associated with cash and cash equivalents and short-term marketable securities are mitigated by banking with and purchasing money market funds, commercial paper, corporate notes and corporate bonds from creditworthy institutions and U.S. government agencies notes and bonds in accordance with the Company’s investment policy. Risks associated with long-term investments are discussed in Note 6. The Company sells its products primarily to companies in the technology industry and generally does not require its customers to provide collateral to support accounts receivable. To reduce credit risk, management performs ongoing credit evaluations of its customers’ financial condition. The Company increased the allowance for doubtful accounts by $43,000, $9,000 and $122,000 in the years ended December 31, 2009, 2008 and 2007, respectively. Receivables written off against the allowance were not material during the years ended December 31, 2009, 2008 and 2007, respectively. The allowance for doubtful accounts at December 31, 2009, 2008 and 2007 was $881,000, $874,000 and $879,000, respectively.
Recently Issued Accounting Standards—Effective January 1, 2009, the Company adopted the FASB’s updated guidance related to business combinations. The updated guidance establishes principles and requirements for how the acquirer of a business recognizes and measures in its financial statements the identifiable assets acquired, the liabilities assumed, and any non-controlling interest in the acquiree. The updated standard also provides guidance for recognizing and measuring the goodwill acquired in the business combination and determines what information to disclose to enable users of the financial statements to evaluate the nature and financial effects of the business combination. The updated standard also provides guidance for recognizing changes in an acquirer’s existing income tax valuation allowances and tax uncertainty accruals that result from a business combination transaction as adjustments to income tax expense. The updated guidance had a material impact on the Company’s consolidated financial statements during the year ended December 31, 2009. In August 2009, the Company recognized a one-time tax benefit of $21.7 million upon favorable resolution of a foreign tax
F-11
Table of Contents
ATHEROS COMMUNICATIONS, INC.
NOTES TO CONSOLIDATED FINANCIAL STATEMENTS—(Continued)
obligation relating to a prior acquisition. Under prior accounting standards, the amount would have been recorded as an adjustment of goodwill. In December 2009, the Company completed its acquisition of Intellon. Under the updated guidance the Company expensed the transaction costs and employee termination costs associated with the Intellon acquisition, while under the prior accounting standards such costs would have been capitalized. In addition, the Company acquired in-process research and development of $7.7 million which has been capitalized in accordance with the updated guidance, whereas under prior authoritative guidance the amount would have been expensed immediately. Therefore, the adoption of the updated guidance related to business combinations has had and likely will continue to have a material impact on the Company’s future consolidated financial statements.
In April 2009, the FASB issued updated guidance related to business combinations to address application issues regarding initial recognition and measurement, subsequent measurement and accounting and disclosure of assets and liabilities arising from contingencies in a business combination. In circumstances where the acquisition-date fair value for a contingency cannot be determined during the measurement period and it is concluded that it is probable that an asset or liability exists as of the acquisition date and the amount can be reasonably estimated, a contingency is recognized as of the acquisition date based on the estimated amount. This updated guidance is effective for assets or liabilities arising from contingencies in business combinations completed by the Company on or after January 1, 2009. Adoption of this guidance did not have any material impact on the Company’s financial statements.
Effective January 1, 2008, the Company adopted the FASB’s updated guidance related to fair value measurements and disclosures with respect to its financial assets and liabilities. In February 2008, the FASB issued updated guidance related to fair value measurements. The updated guidance provided a one year deferral of the effective date of the fair value guidance for non-financial assets and non-financial liabilities, except those that are recognized or disclosed in the financial statements at fair value at least annually. Therefore, the Company adopted the provisions of the fair value guidance for non-financial assets and non-financial liabilities effective January 1, 2009, and such adoption did not have a material impact on the Company’s consolidated results of operations or financial condition.
Effective April 1, 2009, the Company adopted the FASB’s updated guidance related to investments and debt securities, which amends the other-than-temporary impairment, or OTTI, guidance in U.S. GAAP to make the guidance more operational and to improve the presentation of other-than-temporary impairments in the financial statements. Under prior authoritative guidance, if OTTI was determined to exist, the Company recognized an OTTI charge into earnings in an amount equal to the difference between the investment’s amortized cost basis and its fair value as of the balance sheet date of the reporting period. Under the updated guidance, if OTTI has been incurred, and it is more-likely-than-not that the Company will not sell the investment security before the recovery of its amortized cost basis, then the OTTI is separated into (a) the amount representing the credit loss and (b) the amount related to all other factors. The amount of the total OTTI related to the credit loss is recognized in earnings. The amount of the total OTTI related to other factors is recognized in accumulated other comprehensive income, or AOCI. The total OTTI, which includes both credit and non-credit losses, is presented gross in the Company’s statements of operations and is reduced by the non-credit loss amount of the total OTTI that is recognized in AOCI. There was no initial effect of adoption on April 1, 2009 as the Company has the intent to sell the securities it had previously deemed as other-than-temporarily impaired.
Effective April 1, 2009, the Company adopted the FASB’s updated guidance related to fair value measurements and disclosures, which provides additional guidance for estimating fair value in accordance with the guidance related to fair value measurements when the volume and level of activity for an asset or liability have significantly decreased. The updated standard also includes guidance on identifying circumstances that indicate a transaction is not orderly. The adoption of the updated guidance did not have an impact on the Company’s consolidated results of operations or financial condition.
Effective April 1, 2009, the Company adopted the FASB’s updated guidance on financial instruments, which amends prior authoritative guidance to require disclosures about fair value of financial instruments in interim financial statements as well as in annual financial statements and also amends prior guidance to require those disclosures in all interim financial statements. The adoption of the updated guidance did not have a material impact on the Company’s consolidated results of operations or financial condition.
Effective April 1, 2009, the Company adopted the FASB’s updated guidance related to subsequent events, which establishes general standards of accounting for and disclosure of events that occur after the balance sheet date but before financial statements are issued or are available to be issued. It requires the disclosure of the date through which an entity has evaluated subsequent events and the basis for that date – that is, whether that date represents the date the financial statements were issued or were available to be issued. This disclosure should alert all users of financial statements that an entity has not evaluated subsequent events after that date in the set of financial statements being presented. Adoption of the updated guidance did not have a material impact on the Company’s consolidated results of operations or financial condition. The Company has evaluated subsequent events through February 12, 2010, the date the financial statements were issued.
F-12
Table of Contents
ATHEROS COMMUNICATIONS, INC.
NOTES TO CONSOLIDATED FINANCIAL STATEMENTS—(Continued)
Effective July 1, 2009, the Company adopted the FASB’s updated guidance related to fair value measurements and disclosures for the fair value measurement of liabilities. The updated guidance provides clarification that in circumstances in which a quoted price in an active market for the identical liability is not available, a reporting entity is required to measure fair value using certain techniques. The updated guidance also clarifies that when estimating the fair value of a liability, a reporting entity is not required to include a separate input or adjustment to other inputs relating to the existence of a restriction that prevents the transfer of a liability. The updated guidance also clarifies that both a quoted price in an active market for the identical liability at the measurement date and the quoted price for the identical liability when traded as an asset in an active market when no adjustments to the quoted price of the asset are required are Level 1 fair value measurements. Adoption of the updated guidance did not have a material impact on the Company’s consolidated results of operations or financial condition.
In October 2009, the FASB issued updated guidance related to revenue recognition in multiple-deliverable revenue arrangements and certain arrangements that include software elements. The updated guidance requires entities to allocate revenue in an arrangement using estimated selling prices of the delivered goods and services based on a selling price hierarchy. The amendments eliminate the residual method of revenue allocation and require revenue to be allocated using the relative selling price method. The updated guidance also removes tangible products from the scope of software revenue guidance and provides guidance on determining whether software deliverables in an arrangement that includes a tangible product are covered by the scope of the software revenue guidance. The updated guidance should be applied on a prospective basis for revenue arrangements entered into or materially modified in fiscal years beginning on or after June 15, 2010, with early adoption permitted. The Company does not expect adoption of the updated guidance to have a material impact on its consolidated results of operations or financial condition.
In January 2010, the FASB issued updated guidance related to fair value measurements and disclosures, which requires a reporting entity to disclose separately the amounts of significant transfers in and out of Level 1 and Level 2 fair value measurements and to describe the reasons for the transfers. In addition, in the reconciliation for fair value measurements using significant unobservable inputs, or Level 3, a reporting entity should disclose separately information about purchases, sales, issuances and settlements (that is, on a gross basis rather than one net number). The updated guidance also requires that an entity should provide fair value measurement disclosures for each class of assets and liabilities and disclosures about the valuation techniques and inputs used to measure fair value for both recurring and non-recurring fair value measurements for Level 2 and Level 3 fair value measurements. The updated guidance is effective for interim or annual financial reporting periods beginning after December 15, 2009, except for the disclosures about purchases, sales, issuances and settlements in the roll forward activity in Level 3 fair value measurements, which are effective for fiscal years beginning after December 15, 2010 and for interim periods within those fiscal years. The Company does not expect adoption of the updated guidance to have a material impact on its consolidated results of operations or financial condition.
2. Business Combinations
Intellon Corporation
On December 15, 2009, the Company acquired 100% of the outstanding shares of Intellon Corporation (“Intellon”), a publicly-traded Orlando, Florida-based fabless semiconductor company that designs and sells integrated circuits (“ICs”) for high-speed communications over existing electrical wiring. As a result of this acquisition, the Company expects to enhance its technology portfolio to include Intellon’s Powerline Communications (“PLC”) solutions for home networking, home entertainment, broadband-over-powerline access, Ethernet-over-Coax and smart grid management applications.
Intellon’s results of operations and estimated fair value of assets acquired and liabilities assumed were included in the Company’s consolidated financial statements beginning December 16, 2009. The revenue and operating results contributed by Intellon during the period December 16, 2009 to December 31, 2009 were not material. Acquisition costs related to the merger of Intellon of $10,534,000 were expensed as incurred in the Consolidated Statement of Operations in the year ended December 31, 2009.
Acquisition consideration
Under the terms of the merger agreement, the Company paid an aggregate of $113,627,000 in cash ($70,701,000 net of cash acquired) and exchanged 4,500,000 shares of the Company’s common stock and equivalents for 32,503,000 of Intellon’s outstanding common stock and equivalents, valued at $140,348,000 to Intellon shareholders upon closing, resulting in total acquisition consideration of $253,975,000.
F-13
Table of Contents
ATHEROS COMMUNICATIONS, INC.
NOTES TO CONSOLIDATED FINANCIAL STATEMENTS—(Continued)
Based on Intellon’s shares of common stock and equity awards outstanding as of December 15, 2009, the acquisition consideration is as follows (in thousands):
| Acquisition Consideration: |
|||
| 31,307 shares of Intellon common stock exchanged for: |
|||
| 4,200 shares of Atheros common stock |
$ | 135,159 | |
| Cash |
113,627 | ||
| Employee stock compensation plans: |
|||
| 1,090 Intellon stock options exchanged for 272 Atheros stock options |
4,289 | ||
| 105 Intellon RSUs exchanged for 28 Atheros RSUs |
900 | ||
| Total acquisition consideration |
$ | 253,975 | |
The Company issued to Intellon employees on December 15, 2009, options to purchase 631,000 shares of the Company’s common stock, 189,000 restricted stock units (“RSUs”) of the Company’s common stock and 16,000 restricted stock awards with an aggregate value of approximately $18,183,000, in exchange for their options to purchase shares, restricted stock units, and restricted stock awards of Intellon. Of this amount, 272,000 stock options and 28,000 RSUs were earned prior to the acquisition date, and therefore, the Company recorded $5,189,000 as part of the acquisition consideration. The remaining 359,000 stock options, 161,000 RSUs and 16,000 restricted stock awards will result in compensation expense of $12,994,000, which will be recognized over the remaining vesting period of these equity awards, which ranges from one day to four years, subject to adjustment based on estimated forfeitures. Additionally, on December 15, 2009, the Company issued 356,000 restricted stock units of the Company’s common stock to employees of Intellon valued at $11,456,000, subject to adjustment based on estimated forfeitures, and will recognize this amount as compensation expense over a period ranging from one to four years. The value of the Company’s common stock and equivalents issued was determined based on the Company’s closing share price on December 15, 2009 (the acquisition date), or $32.18 per share.
Recognized amounts of identifiable assets acquired and liabilities assumed
The Company accounted for the transaction using the acquisition method, and accordingly, the consideration has been allocated to the tangible and intangible assets acquired and liabilities assumed on the basis of their respective estimated fair values on the acquisition date. The Company’s allocation of the total purchase price is summarized below (in thousands):
| Acquisition Consideration Allocation |
||||
| Net tangible assets acquired |
$ | 70,092 | ||
| Deferred tax liabilities |
(27,749 | ) | ||
| Amortizable intangible assets: |
||||
| Developed technology |
98,219 | |||
| Customer relationships |
15,786 | |||
| Backlog |
1,906 | |||
| In–process research and development |
7,706 | |||
| Goodwill |
88,015 | |||
| Total acquisition consideration allocation |
$ | 253,975 | ||
F-14
Table of Contents
ATHEROS COMMUNICATIONS, INC.
NOTES TO CONSOLIDATED FINANCIAL STATEMENTS—(Continued)
Identifiable intangible assets
Fair values for developed technology, in-process research and development, customer relationships and backlog were determined based on the income approach and multi-period excess earnings method. The following table presents certain information on the acquired identifiable intangible assets:
| Intangible Assets |
Method of Valuation |
Discount Rate Used |
Estimated Useful Lives | ||||
| Developed technology |
Income Approach | 16.5 | % | 5 years | |||
| Customer relationships |
Income Approach | 16.2 | % | 7 years | |||
| Backlog |
Income Approach | 6.9 | % | less than 1 year | |||
| In–process research and development |
Income Approach | 17.6 | % | — |
The fair value of the acquired in-process research and development (“IPR&D”) was determined through estimates and valuation techniques based on the terms and details of the acquisition. The amounts allocated to IPR&D will not be expensed until completion of the related project, as it was determined that the underlying project had not reached technological feasibility at the date of acquisition. The IPR&D project represents the Company’s next-generation PLC chip which includes enhanced throughput functionality to allow faster and increased processing of data. Upon completion of development, the acquired IPR&D will be amortized over its useful life.
Goodwill
Goodwill represents the excess of the estimated acquisition consideration over the fair value of the underlying net tangible and intangible assets. The Company’s primary reasons for the Intellon acquisition were to accelerate its entrance into the PLC market, to reduce the time to develop new technologies and to provide more complete home networking solutions by providing a wireless networking, Ethernet and powerline combined platform for its customers. The acquisition also enhanced the Company’s engineering team through the addition of Intellon’s PLC research and development team. These significant factors were the basis for the recognition of goodwill. The goodwill is not expected to be deductible for tax purposes.
Deferred tax liabilities
The deferred tax liabilities are primarily associated with the step-up to fair value of identifiable intangible assets.
u-Nav Microelectronics Corporation
On December 14, 2007 the Company acquired certain assets and liabilities of u-Nav Microelectronics Corporation (“u-Nav”), a privately held Irvine, California-based fabless semiconductor company specializing in GPS semiconductors and software to enable mobile location-based products.
Purchase price
Under the terms of the purchase agreement, the Company paid an aggregate of $15,103,000 in cash and issued 1,280,000 shares of the Company’s common stock, valued at approximately $38,630,000 to u-Nav upon closing. In addition, the Company issued 150,000 restricted shares of the Company’s common stock to certain key employees of u-Nav valued at approximately $3,798,000 as of their grant date. This amount is being recognized as compensation expense over the vesting period. The restricted shares vest annually over a four year period based on certain service commitments. A portion of the consideration payable to u-Nav was been placed into escrow pursuant to the terms of the asset purchase agreement, and during 2009 the Company received $825,000 in an escrow settlement which was recorded against the goodwill balance of u-Nav. The total purchase price of u-Nav was $54,149,000, including $416,000 of transaction costs.
The value of the Company’s common stock issued was determined based on the average price over a 5-day period including the two days before and after December 13, 2007 (the announcement date), or $30.18 per share. The value of the Company’s restricted shares was $25.32 per share and was determined as of the closing price of the Company’s common stock on February 6, 2008 the grant date of the restricted shares.
F-15
Table of Contents
ATHEROS COMMUNICATIONS, INC.
NOTES TO CONSOLIDATED FINANCIAL STATEMENTS—(Continued)
Allocation of purchase price
The Company accounted for the acquisition as a purchase transaction, and accordingly, the purchase price has been allocated to the tangible and intangible assets acquired and liabilities assumed on the basis of their respective estimated fair values on the acquisition date. The Company’s allocation of the purchase price is summarized below (in thousands):
| Net assets acquired |
$ | 1,987 | |
| Amortizable intangible assets: |
|||
| Developed technology |
11,600 | ||
| Customer relationships |
5,200 | ||
| Backlog |
150 | ||
| In–process research and development |
3,200 | ||
| Goodwill |
32,012 | ||
| Total purchase price allocation |
$ | 54,149 | |
The Company’s primary reasons for the U-Nav asset acquisition were to accelerate its entrance into the GPS market, to reduce the time required to develop new technologies and to incorporate its GPS solutions as part of future combined product offerings. The acquisition also enhanced its engineering team through the addition of u-Nav’s GPS research and development team. These significant factors were the basis for the recognition of goodwill.
At the date of acquisition, the Company immediately expensed $3,200,000, representing purchased in-process research and development related to a development project that had not yet reached technological feasibility and had, in management’s opinion, no alternative future use. The assigned value was determined by estimating the costs to develop the acquired in-process technologies into commercially viable products, estimating the net cash flows from such projects and discounting the net cash flows back to its present value. The key assumptions used in the valuation include, among others, the expected completion date of the in-process project identified as of the acquisition date, the estimated costs to complete the project, revenue contributions and expense projections assuming the resulting products have entered the market, and the discount rate based on the risks associated with the development life cycle of the in-process technology acquired. The discount rate used in the present value calculations was obtained from a weighted-average cost of capital analysis, adjusted upward to account for the inherent uncertainties surrounding the successful development of the in-process research and development, the expected profitability levels of such technologies, and the uncertainty of technological advances that could potentially impact the estimates. Projected net cash flows for the project were based on estimates of revenues and operating profit (losses) related to the project.
Attansic Technology Corporation
On December 18, 2006, the Company acquired 87.7% of the outstanding shares of Attansic Technology Corporation (“Attansic”), a privately held Taiwan-based fabless IC design company, specializing in Fast and Gigabit Ethernet integrated circuit solutions, as well as power management products. On November 13, 2007, the Company acquired the remaining 12.3% of the outstanding shares of Attansic, as part of the second step close of the Attansic acquisition. As of December 31, 2006, the Company had recorded $516,000 of minority interest related to this transaction which was included in other long-term liabilities on the balance sheet.
Purchase price
Under the terms of the purchase agreement, the Company agreed to pay an aggregate of $46,169,000 in cash and issue 1,111,753 shares of the Company’s common stock in exchange for 100% of the shares of Attansic. Upon the initial closing on December 18, 2006, the Company paid in cash $37,378,000 and issued 1,111,753 shares of the Company’s common stock, valued at approximately $24,563,000 to the Attansic shareholder in exchange for 87.7% of the outstanding shares of Attansic. On November 13, 2007, the Company acquired the remaining 12.3% of the outstanding shares of Attansic for $8,743,000 in cash.
In addition, the Company issued to Attansic employees on December 20, 2006, options to purchase 17,063 shares of the Company’s common stock and 4,356 restricted stock units of the Company’s common stock with an aggregate value of approximately $370,000, in exchange for their unvested options and warrants to purchase shares of Attansic. The Company recorded $194,000 of the value of the stock options and restricted stock units as part of the purchase price, and $176,00 is being recognized as compensation expense over a period ranging from one to twenty-two months, subject to adjustment based on actual forfeiture. Additionally, on December 20, 2006, the Company issued 457,400 restricted stock units of the Company’s common stock to employees of Attansic valued at $9,834,000, subject to adjustment based on actual forfeiture, and is recogizing this amount as compensation expense over a period ranging from two to four years. The total purchase price of Attansic was $71,190,000, including $312,000 of transaction costs.
F-16
Table of Contents
ATHEROS COMMUNICATIONS, INC.
NOTES TO CONSOLIDATED FINANCIAL STATEMENTS—(Continued)
The value of the Company’s common stock issued was determined based on the average price over a 5-day period including the two days before and after December 13, 2006 (the date when the number of the Company’s shares was determinable by formula prescribed in the purchase agreement), or $22.09 per share. The value of the Company’s restricted stock units and stock options was $21.50 per share and was determined as the closing price of the Company’s common stock on the grant date of the restricted shares, which was December 20, 2006.
Allocation of purchase price
In accordance with prior authoritative guidance related to business combinations, the Company accounted for the acquisition as a purchase transaction, and accordingly, the purchase price has been allocated to the tangible and intangible assets acquired and liabilities assumed on the basis of their respective estimated fair values on each of the step acquisition dates. The Company’s allocation of the total purchase price for both closings is summarized below (in thousands):
| Net assets acquired |
$ | 6,933 | ||
| Deferred tax liabilities |
(21,996 | ) | ||
| Amortizable intangible assets: |
||||
| Developed technology |
17,861 | |||
| Customer relationships |
1,712 | |||
| Covenant not-to-compete |
926 | |||
| Backlog |
62 | |||
| In–process research and development |
12,133 | |||
| Goodwill |
53,559 | |||
| Total purchase price allocation |
$ | 71,190 | ||
At the dates of acquisitions of the 87.7% and 12.3% of outstanding shares of Attansic, the Company immediately expensed $10,436,000 and $1,697,000, respectively, representing purchased in-process research and development related to development projects that had not yet reached technological feasibility and had, in management’s opinion, no alternative future use. The assigned value was determined by estimating the costs to develop the acquired in-process technologies into commercially viable products, estimating the net cash flows from such projects, and discounting the net cash flows back to their present value. The key assumptions used in the valuation include, among others, the expected completion date of the in-process projects identified as of the acquisition date, the estimated costs to complete the projects, revenue contributions and expense projections assuming the resulting products have entered the market, and the discount rate based on the risks associated with the development life cycle of the in-process technology acquired. The discount rate used in the present value calculations was obtained from a weighted-average cost of capital analysis, adjusted upward to account for the inherent uncertainties surrounding the successful development of the in-process research and development, the expected profitability levels of such technologies, and the uncertainty of technological advances that could potentially impact the estimates. Projected net cash flows for the projects were based on estimates of revenues and operating profit (losses) related to such projects. The projects acquired in 2006 and 2007 became commercially viable in 2007 and 2008.
As of December 31, 2006, the Company classified $2,769,000 of Attansic assets as being available for sale and included them in the prepaid expenses, deferred income taxes and other current assets section of the balance sheet. These assets were sold for no material gain or loss in January 2007.
The acquisition enabled the Company to provide a complete suite of cost-optimized, high-performance wireless and Ethernet technologies to its networking and PC OEM customers. The synergies between Attansic and the Company’s products represented an opportunity to penetrate an industry in which the Company did not already have a presence. Additionally, the Ethernet technology was used to develop stand-alone Fast and Gigabit switch products which are sold in conjunction with the Company’s wireless networking chips and the Company has integrated portions of the Ethernet technology directly into its wireless networking chips. The acquisition also enhanced the Company’s engineering team through the addition of Attansic’s research and development team. The combination of these factors was the basis for the recognition of goodwill.
F-17
Table of Contents
ATHEROS COMMUNICATIONS, INC.
NOTES TO CONSOLIDATED FINANCIAL STATEMENTS—(Continued)
Pro Forma Financial Information
The results of operations of Attansic, u-Nav and Intellon have been included in the Company’s consolidated statements of operations since the close of the initial acquisition of the 87.7% outstanding shares of Attansic on December 18, 2006 and the remaining 12.3% of the outstanding shares of Attansic on November 13, 2007, the completion of the u-Nav acquisition on December 14, 2007, and the completion of the Intellon acquisition on December 15, 2009, respectively. The following table reflects the unaudited pro forma consolidated results of operations had the Attansic acquisition taken place at the beginning of 2006, the u-Nav acquisition taken place at the beginning of 2007 and the Intellon acquisition taken place at the beginning of 2008 (in thousands):
| Pro Forma Year Ended December 31, | ||||||||||
| 2009 | 2008 | 2007 | ||||||||
| Net revenue |
$ | 615,525 | $ | 547,774 | $ | 425,286 | ||||
| Net income (loss) |
$ | 23,220 | $ | (3,505 | ) | $ | 24,965 | |||
These amounts have been calculated after applying the Company’s accounting policies and adjusting the results of Intellon to reflect the additional cost of goods sold and amortization that would have been charged assuming the fair value adjustments to inventory and intangible assets had been applied from January 1, 2008, together with the consequential tax effects.
3. Financial Instruments
As of December 31, 2009, the Company does not have liabilities that are measured at fair value on a recurring basis.
The following table represents the fair value hierarchy of the Company’s financial instruments measured at fair value as of December 31, 2009 (in thousands):
| Fair Value Measurements as of December 31, 2009 | ||||||||||||
| Total | Level 1 | Level 2 | Level 3 | |||||||||
| Money market funds |
$ | 91,625 | $ | 91,625 | $ | — | $ | — | ||||
| U.S. government debt securities |
140,290 | 23,583 | 116,707 | — | ||||||||
| Corporate bonds |
100,855 | — | 100,855 | — | ||||||||
| Commercial paper |
21,990 | — | 21,990 | — | ||||||||
| Corporate notes |
12,968 | — | 12,968 | — | ||||||||
| Auction-rate securities |
13,523 | — | — | 13,523 | ||||||||
| Total |
$ | 381,251 | $ | 115,208 | $ | 252,520 | $ | 13,523 | ||||
The Company’s Level 3 assets consist of long-term auction-rate securities and preferred stock for which the Company uses a discounted cash flow model to value these investments (see Note 6).
F-18
Table of Contents
ATHEROS COMMUNICATIONS, INC.
NOTES TO CONSOLIDATED FINANCIAL STATEMENTS—(Continued)
The following table provides a summary of changes in fair value of the Company’s Level 3 financial assets as of December 31, 2009 (in thousands):
| Auction-Rate Securities Year Ended December 31, 2009 |
||||
| Balance, January 1, 2009 |
$ | 14,963 | ||
| Total losses–realized/unrealized |
||||
| Included in earnings |
(1,983 | ) | ||
| Included in other comprehensive income |
2,060 | |||
| Purchases, issuances and settlements |
(1,517 | ) | ||
| Transfers in and/or out of Level 3 |
— | |||
| Balance, December 31, 2009 |
$ | 13,523 | ||
| Total losses for the period included in earnings relating to assets still held at December 31, 2009 |
$ | (2,018 | ) | |
Short-term marketable securities consist of (in thousands):
| December 31, 2009 | ||||||||||||||||
| Amortized Cost |
Gross Unrealized Holding Gains |
Gross Unrealized Holding Losses |
Fair Value | |||||||||||||
| Money market funds |
$ | 91,625 | $ | — | $ | — | $ | 91,625 | ||||||||
| U.S. government securities |
139,972 | 456 | (138 | ) | 140,290 | |||||||||||
| Corporate bonds |
100,034 | 829 | (8 | ) | 100,855 | |||||||||||
| Commercial paper |
21,992 | — | (2 | ) | 21,990 | |||||||||||
| Corporate notes |
12,938 | 32 | (2 | ) | 12,968 | |||||||||||
| Total |
366,561 | 1,317 | (150 | ) | 367,728 | |||||||||||
| Less: Amounts included in cash and cash equivalents |
(113,871 | ) | (3 | ) | 5 | (113,869 | ) | |||||||||
| $ | 252,690 | $ | 1,314 | $ | (145 | ) | $ | 253,859 | ||||||||
| December 31, 2008 | ||||||||||||||||
| Amortized Cost |
Gross Unrealized Holding Gains |
Gross Unrealized Holding Losses |
Fair Value | |||||||||||||
| Money market funds |
$ | 83,660 | $ | — | $ | — | $ | 83,660 | ||||||||
| U.S. government securities |
87,030 | 1,262 | — | 88,292 | ||||||||||||
| Corporate bonds |
61,933 | 88 | (513 | ) | 61,508 | |||||||||||
| Corporate notes |
29,449 | 59 | (79 | ) | 29,429 | |||||||||||
| Commercial paper |
19,487 | 10 | — | 19,497 | ||||||||||||
| Total |
281,559 | 1,419 | (592 | ) | 282,386 | |||||||||||
| Less: Amounts included in cash and cash equivalents |
(103,148 | ) | (10 | ) | — | (103,158 | ) | |||||||||
| $ | 178,411 | $ | 1,409 | $ | (592 | ) | $ | 179,228 | ||||||||
F-19
Table of Contents
ATHEROS COMMUNICATIONS, INC.
NOTES TO CONSOLIDATED FINANCIAL STATEMENTS—(Continued)
The contractual maturities of available-for-sale debt securities at December 31, 2009 are presented in the following table (in thousands):
| Amortized Cost |
Estimated Fair Value | |||||
| Due in one year or less |
$ | 57,934 | $ | 57,916 | ||
| Due between one and two years |
194,756 | 195,943 | ||||
| $ | 252,690 | $ | 253,859 | |||
4. Inventory
Inventory consists of (in thousands):
| December 31, | ||||||
| 2009 | 2008 | |||||
| Finished goods |
$ | 37,164 | $ | 31,061 | ||
| Work in process |
18,166 | 28,238 | ||||
| Raw materials |
15,066 | 10,514 | ||||
| Total |
$ | 70,396 | $ | 69,813 | ||
5. Property and Equipment
Property and equipment consist of (in thousands):
| December 31, | ||||||||
| 2009 | 2008 | |||||||
| Machinery and equipment |
$ | 27,017 | $ | 21,503 | ||||
| Software |
5,577 | 5,518 | ||||||
| Furniture and fixtures |
1,485 | 1,294 | ||||||
| Leasehold improvements |
4,614 | 3,753 | ||||||
| 38,693 | 32,068 | |||||||
| Accumulated depreciation and amortization |
(23,738 | ) | (17,279 | ) | ||||
| Property and equipment, net |
$ | 14,955 | $ | 14,789 | ||||
The Company capitalized an additional $162,000 and $1,093,000 of software and related software costs during 2009 and 2008, respectively, related to implementation of additional modules related to its enterprise resource planning system.
6. Long-term Investments
Long-term investments consist of (in thousands):
| December 31, | ||||||
| 2009 | 2008 | |||||
| Auction-rate securities and preferred stock |
$ | 13,523 | $ | 14,963 | ||
| Other long-term investments |
2,000 | 2,000 | ||||
| Total |
$ | 15,523 | $ | 16,963 | ||
Long-term investments consist primarily of auction-rate securities representing the Company’s interest in insurance capital notes, issued by special purpose entities sponsored by insurance companies; such securities were rated AAA and AA at the date of purchase. Additionally, the Company acquired perpetual, non-cumulative preferred stock (“Preferred Stock”) issued by two monoline insurance companies that is currently illiquid, with an original par value of $7,500,000, in the fourth quarter of 2008, resulting from the forced conversion of two auction-rate securities held by the Company. In December 2009, the Company sold two of its auction-rate securities with an original par value of $2,130,000 and a fair value of $1,622,000 for $1,517,000. As of December 31, 2009, the Company held auction-rate securities and Preferred Stock with an aggregate par value of $30,600,000. A portion of the auction-rate securities are collateralized by tradable short-term corporate and government notes, bonds and commercial paper. Since September 2007, there have been no active markets for these auction-rate securities and Preferred Stock. The Company will not be able to liquidate any of its remaining auction-rate securities or Preferred Stock until a buyer is found for these instruments or the securities are redeemed.
F-20
Table of Contents
ATHEROS COMMUNICATIONS, INC.
NOTES TO CONSOLIDATED FINANCIAL STATEMENTS—(Continued)
These auction-rate securities generally continue to earn and receive interest at the maximum contractual rate which averaged 2.51% as of December 31, 2009. One of the Preferred Stocks ceased paying dividends in December 2008. As there is currently no market for the auction rate securities and the Preferred Stock, the Company has used a discounted cash flow model to estimate their fair values. The assumptions used in preparing the discounted cash flow model include recovery rate in the event of a default, liquidity risk premium, probability of earning maximum interest rate to maturity, probability of passing an auction at some point in the future, probability of default, estimates for interest rates and timing of cash flows. As of December 31, 2009, the Company has determined that, for its auction-rate securities and Preferred Stock, OTTI has occurred and the Company intends to sell these investment securities prior to recovery. In the years ended December 31, 2009, 2008 and 2007, the Company recorded OTTI charges for these securities of $2,018,000, $15,490,000 and $2,277,000, respectively. To date, all OTTI losses on the Company’s long-term investments have been recorded in earnings.
7. Goodwill and Acquired Intangible Assets
The following table presents the changes in the carrying amount of goodwill (in thousands):
| Balance at December 31, 2007 |
$ | 100,899 | |
| Adjustments |
788 | ||
| Balance at December 31, 2008 |
101,687 | ||
| Adjustments |
87,190 | ||
| Balance at December 31, 2009 |
$ | 188,877 | |
During 2008, the Company recorded goodwill adjustments of $788,000 related to prior acquisitions. During 2009, goodwill adjustments included the addition of $88,015,000 related to the acquisition of Intellon (see Note 2) and a reduction of $825,000 related to prior acquisitions.
The Company performed an annual impairment assessment of the carrying value of the goodwill recorded in connection with various acquisitions as required under the FASB’s accounting guidance related to goodwill and intangible assets. The Company compared the carrying value of its single reporting unit against the value recorded and determined the goodwill balance was not impaired.
The carrying amounts of the acquired intangible assets as of December 31, 2009 are as follows (in thousands):
| Gross Carrying Value |
Accumulated Amortization |
Net Carrying Amount |
Weighted Average Remaining Amortization Period (Years) | |||||||||
| Developed technology |
$ | 133,280 | $ | (26,879 | ) | $ | 106,401 | 4.0 | ||||
| Customer relationships |
23,298 | (4,175 | ) | 19,123 | 6.1 | |||||||
| Covenant not-to-compete |
1,327 | (1,111 | ) | 216 | 0.9 | |||||||
| Backlog |
2,428 | (522 | ) | 1,906 | 0.3 | |||||||
| Total acquired intangible assets (excluding in-process research and development) |
$ | 160,333 | $ | (32,687 | ) | $ | 127,646 | 3.4 | ||||
In addition, the Company acquired in-process research and development (“IPR&D”) of $7,706,000 in its acquisition of Intellon. The fair value of the IPR&D was determined through estimates and valuation techniques based on the terms and details of the acquisition. The amounts allocated to IPR&D will not be expensed until completion of the related project, as it was determined that the underlying project had not reached technological feasibility at the date of acquisition. The IPR&D project represents the Company’s next-generation PLC chip which includes enhanced throughput functionality to allow faster and increased processing of data. Upon completion of development, the acquired IPR&D will be amortized over its useful life.
The fair value of the IPR&D was determined using the income approach. The income approach focuses on the income-producing capability of an asset. It incorporates the calculation of the present value of future economic benefits such as cash earnings, cost savings, tax deductions and proceeds from disposition. Indications are developed by discounting expected cash flows to the present value at a rate of return that incorporates the risk-free rate for the use of funds, the expected rate of
F-21
Table of Contents
ATHEROS COMMUNICATIONS, INC.
NOTES TO CONSOLIDATED FINANCIAL STATEMENTS—(Continued)
inflation and risks associated with the particular investment. The discount rate selected is generally based on the rate of return available from alternative investments of similar type and quality. The weighted average discount rate used in the valuation of the project was 17.6%. The project was analyzed to determine the unique technological innovations, the existence and reliance on core technology, the existence of any alternative future use or current technological feasibility, and the complexity, cost and time to complete the remaining development. Future cash flows for each project were estimated based on forecasted revenue and costs, taking into account product life cycles, and market penetration and growth rates. At December 31, 2009, the project associated with the Company’s acquisition of Intellon was approximately 60% complete and has approximately one year left to complete at an estimated cost of $6.6 million.
The carrying amounts of the acquired intangible assets as of December 31, 2008 are as follows (in thousands):
| Gross Carrying Value |
Accumulated Amortization |
Net Carrying Amount |
Weighted Average Remaining Amortization Period (Years) | |||||||||
| Developed technology |
$ | 35,061 | $ | (17,062 | ) | $ | 17,999 | 1.8 | ||||
| Customer relationships |
7,512 | (2,658 | ) | 4,854 | 3.3 | |||||||
| Covenant not-to-compete |
1,327 | (875 | ) | 452 | 1.9 | |||||||
| Backlog |
522 | (522 | ) | — | — | |||||||
| Total acquired intangible assets |
$ | 44,422 | $ | (21,117 | ) | $ | 23,305 | 2.0 | ||||
The following table presents future amortization of the Company’s intangible assets at December 31, 2009. If the Company acquires additional purchased intangible assets in the future, its future amortization may be increased by those assets. Furthermore, upon completion of the IPR&D projects, the Company will amortize the IPR&D over the useful life of the asset.
| Amortization | |||
| 2010 |
$ | 31,792 | |
| 2011 |
24,862 | ||
| 2012 |
22,766 | ||
| 2013 |
22,730 | ||
| 2014 |
21,080 | ||
| Thereafter |
4,416 | ||
| Total amortization |
$ | 127,646 | |
8. Accrued Liabilities
Accrued liabilities consist of (in thousands):
| December 31, | ||||||
| 2009 | 2008 | |||||
| Accrued customer incentives |
$ | 37,426 | $ | 37,842 | ||
| Accrued compensation and benefits |
24,090 | 12,908 | ||||
| Other liabilities |
19,686 | 14,740 | ||||
| Total |
$ | 81,202 | $ | 65,490 | ||
9. Line of Credit Facility and Standby Letters of Credit
Effective August 11, 2009, the Company’s line of credit agreement with a bank expired and was not renewed. As of December 31, 2009, the Company had standby letters of credit outstanding totaling $2,127,000 to secure operating leases for equipment. These standby letters of credit are secured by certificates of deposit, which are classified in the Company’s balance sheet as other current assets.
F-22
Table of Contents
ATHEROS COMMUNICATIONS, INC.
NOTES TO CONSOLIDATED FINANCIAL STATEMENTS—(Continued)
10. Commitments and Contingencies
Operating Leases
The Company leases facilities and certain equipment under operating lease agreements. The lease for the Company’s principal facility commenced in July 2005 and expires in July 2010. The Company recognizes rent expense on a straight-line basis over the lease period and accrues for rent expense incurred, but not paid. Consolidated rent expense was $4,203,000, $4,274,000 and $3,140,000 for the years ended December 31, 2009, 2008 and 2007, respectively.
Licensing Agreements
The Company has entered into several licensing agreements which allow it to use certain software or intellectual property for specified periods of time. Research and development expense associated with these licensing agreements was $10,124,000, $10,829,000 and $8,157,000 for the years ended December 31, 2009, 2008 and 2007, respectively.
At December 31, 2009, future minimum annual payments under operating leases and licensing agreements are as follows (in thousands):
| Operating Leases |
Licensing Agreements | |||||
| 2010 |
$ | 4,692 | $ | 8,791 | ||
| 2011 |
2,001 | 5,549 | ||||
| 2012 |
1,645 | 2,724 | ||||
| 2013 |
736 | — | ||||
| 2014 |
301 | — | ||||
| Total minimum lease payments |
$ | 9,375 | $ | 17,064 | ||
Contingencies
The Company is involved in various legal actions. The Company would record a charge equal to at least the minimum estimated liability for a loss contingency if information available prior to issuance of financial statements indicates that it is probable that an asset had been impaired or a liability had been incurred as of the date of the financial statements and the loss can be reasonably estimated. Actual liabilities in any such disputes or litigation may be materially different from the Company’s estimates, which could result in the need to record additional costs. The Company has not recorded any contingent liability or impairment of an asset due to existing litigations.
Wi-LAN Inc. v. Acer, Inc. et al. & Wi-LAN Inc. v. Westell Technologies, Inc. et al.
On October 31, 2007, Wi-LAN, Inc. filed two complaints against the Company and thirteen of the Company’s direct and indirect customers in the United States District Court for the Eastern District of Texas, Marshall Division. In the complaint, Wi-LAN alleges that certain of the Company’s products infringe U.S. patent numbers 5,282,222 and RE37,802. Wi-LAN seeks unspecified damages and other relief. The Company believes that it has meritorious defenses to such allegations and intends to defend these lawsuits vigorously. The Company has answered the complaints, denying all allegations and asserting affirmative defenses. The Company also asserted counterclaims requesting declaratory judgment for non-infringement and invalidity. While the Company believes it has meritorious defense against Wi-LAN’s claim, there can be no assurance that the Company will be successful in such defense.
Broadcom Corporation and Atheros Communications, Inc. v. Wi-LAN, Inc.
On December 10, 2008, the Company and Broadcom filed a complaint for declaratory judgment against Wi-LAN, Inc. in the U.S. District Court for Northern District of California, requesting the court to declare, among other things, that U.S. patent number 6,549,759, or the ‘759 Patent, assigned to Wi-LAN is invalid, unenforceable and that the Company does not infringe any valid claims of the ‘759 Patent. This declaratory judgment action stemmed from Wi-LAN’s threat to add this patent into the complaints filed by Wi-LAN against the Company and others, now pending in the Eastern District of Texas. Similar declaratory judgment actions were filed by a number of other companies against Wi-LAN. More recently, the Company’s declaratory action against Wi-LAN has been transferred to the U.S. District Court for the Eastern District of Texas. There can be no assurance that the Company will be successful in seeking declaratory relief from Wi-LAN’s threat.
F-23
Table of Contents
ATHEROS COMMUNICATIONS, INC.
NOTES TO CONSOLIDATED FINANCIAL STATEMENTS—(Continued)
Atheros Communications, Inc. v. Lehman Brothers, Inc.
On January 30, 2009, the Company filed a Proof of Claim in the United States Bankruptcy Court for the Southern District of New York against Lehman Brothers, Inc. seeking compensatory damages incurred in connection with Lehman Brothers’ investment of the Company’s cash in auction-rate securities and resulting losses of income and liquidity, as well as punitive damages. On the same day and for related reasons, the Company filed a Customer Claim against Lehman Brothers with the federal Securities Investor Protection Corporation. There can be no assurance that the Company will obtain compensation for its claims.
PACid Group, LLC v. Apple Inc. et al.
On March 30, 2009, PACid Group, LLC, or PACid, filed a complaint against the Company and 18 other defendants in the United States District Court for the Eastern District of Texas, Tyler Division. In the complaint, PACid alleges that certain of the Company’s products infringe U.S. Patent Numbers 5,963,646 and 6,049,612 which relate to generation of encryption keys and methods of protecting information files using such keys. PACid seeks unspecified damages and other relief. The Company has answered the complaints, denying all allegations and asserting affirmative defenses. The Company also asserted counterclaims requesting declaratory judgment for non-infringement and invalidity. However, there can be no assurance that the Company will be successful in such defense.
Broadcom Corporation et al. v. Commonwealth Scientific and Industrial Research Organisation
On November 10, 2009, the Company and Broadcom filed a complaint for declaratory judgment against Commonwealth Scientific and Industrial Research Organisation (“CSIRO”) in the U.S. District Court for Eastern District of Texas, requesting the court to declare, among other things, that U.S. patent number 5,487,069, or the ‘069 Patent, assigned to CSIRO is invalid, unenforceable and that the Company does not infringe any valid claims of the ‘069 Patent. There can be no assurance that the Company will be successful in seeking declaratory relief from CSIRO’s threat.
Lonestar Inventions, LP. V. Atheros Communications, Inc et al.
On February 4, 2010, Lonestar Inventions, LP filed a complaint against the Company and PMC-Sierra, Inc. in the United States District Court for the Eastern District of Texas, Tyler Division. In the complaint, Lonestar Inventions alleges that one of the Company’s products infringe U.S. Patent Number 5,208,725. Lonestar Inventions seeks unspecified damages and other relief. While the Company has undertaken an analysis of the patent, it has not yet answered the complaint.
Indemnifications
Pursuant to its Restated Certificate of Incorporation, the Company has entered into indemnification agreements with its directors and executive officers. These agreements require the Company to indemnify these individuals to the fullest extent permitted under Delaware law against liabilities that may arise by reason of their service to the Company, and to advance expenses incurred as a result of any proceeding against them as to which they could be indemnified. The Company has not incurred any costs in connection with these indemnification agreements through December 31, 2009.
Under the indemnification provisions of the Company’s standard software license agreements and standard terms and conditions of semiconductor sales, the Company agrees, subject to restrictions and after certain conditions are met to defend the customer/licensee against third-party claims asserting infringement of certain intellectual property rights, which may include patents, copyrights, trademarks or trade secrets, and to pay any judgments entered on such claims against the customer/licensee. Through December 31, 2009, the Company has received a number of claims from its customers and other third parties for indemnification under such agreements with respect to alleged infringement of third-party intellectual property rights by the Company’s products. The Company has not incurred any material costs in connection with these indemnification claims through December 31, 2009. In addition, certain of the Company’s customers and other third parties have been involved in patent infringement litigation and in April 2009 agreed to settle these claims. The Company has been asked by certain of these customers and other third parties and is likely to be asked by others to indemnify them for all or a portion of the losses they incur in connection with this litigation, including damages, legal expenses and settlement payments. At this time the Company is unable to determine if or when the Company would be required to make any payments under these indemnification obligations or the amount of such payments. However, the amounts of any such payments could be significant.
F-24
Table of Contents
ATHEROS COMMUNICATIONS, INC.
NOTES TO CONSOLIDATED FINANCIAL STATEMENTS—(Continued)
11. Stockholders’ Equity
1998 and 2004 Stock Incentive Plans
In October 1998, the Company’s 1998 Stock Incentive Plan (the “1998 Plan”) was adopted by the board of directors and was subsequently approved by stockholders. Upon completion of the Company’s initial public offering, the 1998 Plan was terminated and no shares are available for future issuance under the 1998 Plan. Shares that are subject to options that expire, terminate or are cancelled, that are forfeited or as to which options have not been granted under the 1998 Plan will become available for issuance under the 2004 Stock Incentive Plan (the “2004 Plan”). The 1998 Plan permitted the Company to grant stock options to employees, officers, directors, and consultants at prices not less than the fair market value at date of grant for incentive stock options and not less than 85% of fair market value for nonstatutory stock options as determined by the board of directors. These options generally expire ten years from the date of grant and are immediately exercisable. Options generally vest at a rate of 25% on the first anniversary of the grant date and 1/48 per month thereafter. At December 31, 2009, no unvested shares were subject to repurchase by the Company at the original issuance price.
In January 2004, the Company’s 2004 Plan was adopted by the board of directors and was subsequently approved by stockholders. The 2004 Plan became effective upon the completion of the Company’s initial public offering in February 2004. The 2004 Plan provides for the grant of options to purchase shares of common stock, restricted stock, stock appreciation rights and stock units. Incentive stock options may be granted only to employees. Nonstatutory stock options and other stock-based awards may be granted to employees, non-employee directors, advisors and consultants. A total of 2,250,000 shares of common stock were originally authorized for issuance under the 2004 Plan. In addition to shares that may from time to time be transferred from the 1998 Plan to the 2004 Plan reserve, an annual increase in the 2004 Plan share reserve is added on the first day of each year. Initial hire-on stock options granted under the 2004 Plan are exercisable upon vesting and generally vest 25% on the first anniversary of the grant date and then monthly thereafter over the remaining 36 months. Subsequent discretionary stock option grants generally vest equally each month over 48 months. Initial hire-on options expire ten years from the date of grant while discretionary options granted subsequent to September 2005 generally expire five to ten years from the date of grant.
In December 2009 the Company adopted the 2009 Inducement Grant Incentive Plan (the “Inducement Plan”). The Plan was adopted by the Board of Directors in December 2009. The purpose of the Inducement Plan is to grant awards which are intended to assist the Company in retaining selected individuals to serve as employees of the Company. These employees are expected to contribute to the Company’s success and to achieve long-term objectives that will benefit the stockholders of the Company through the additional incentives inherent in the awards granted under the Inducement Plan. The Inducement Plan provides for awards in the form of restricted shares, stock units, nonstatutory stock options or stock appreciation rights. A total of 356,000 RSUs were authorized for issuance under the Inducement Plan during the year ended December 31, 2009.
F-25
Table of Contents
ATHEROS COMMUNICATIONS, INC.
NOTES TO CONSOLIDATED FINANCIAL STATEMENTS—(Continued)
Option activity under the Plans is as follows (in thousands, except weighted average exercise price amounts):
| Number of Shares |
Weighted Average Exercise Price | |||||
| Outstanding, January 1, 2007 (4,211 vested at a weighted average exercise price of $5.66 per share) |
9,551 | $ | 9.53 | |||
| Granted |
2,021 | 27.32 | ||||
| Exercised |
(2,530 | ) | 6.83 | |||
| Canceled |
(366 | ) | 18.77 | |||
| Outstanding, December 31, 2007 (4,222 vested at a weighted average exercise price of $8.94 per share) |
8,676 | $ | 14.08 | |||
| Granted |
2,083 | 26.49 | ||||
| Exercised |
(1,158 | ) | 9.78 | |||
| Canceled |
(551 | ) | 18.14 | |||
| Outstanding, December 31, 2008 (5,169 vested at a weighted average exercise price of $12.17 per share) |
9,050 | $ | 17.24 | |||
| Granted |
1,437 | 18.79 | ||||
| Exercised |
(1,405 | ) | 10.33 | |||
| Canceled |
(241 | ) | 25.31 | |||
| Outstanding, December 31, 2009 (5,911 vested at a weighted average exercise price of $16.04 per share) |
8,841 | $ | 18.39 | |||
Additional information regarding options outstanding as of December 31, 2009 is as follows (in thousands, except weighted average exercise price amounts and contractual life):
| Options Outstanding | Options Exercisable | |||||||||||
| Range of Exercise Prices |
Number of Options |
Weighted Average Remaining Contractual Life (Years) |
Weighted Average Exercise Price |
Number of Options |
Weighted Average Exercise Price | |||||||
| $0.89-7.75 |
1,063 | 2.63 | $ | 3.21 | 1,063 | $ | 3.21 | |||||
| $7.76-9.63 |
1,192 | 3.65 | 9.23 | 1,018 | 9.36 | |||||||
| $9.64-13.87 |
925 | 6.09 | 11.10 | 717 | 10.39 | |||||||
| $13.88-15.02 |
948 | 4.22 | 14.55 | 570 | 14.44 | |||||||
| $15.03-23.04 |
953 | 7.05 | 19.17 | 623 | 19.31 | |||||||
| $23.05-25.05 |
937 | 5.91 | 24.30 | 549 | 24.31 | |||||||
| $25.06-27.37 |
1,044 | 6.38 | 26.89 | 484 | 26.87 | |||||||
| $27.38-30.64 |
895 | 8.15 | 28.84 | 394 | 28.83 | |||||||
| $30.65-40.04 |
884 | 8.36 | 32.98 | 493 | 33.32 | |||||||
| $0.89-40.04 |
8,841 | 5.70 | $ | 18.39 | 5,911 | $ | 16.04 | |||||
Employee Stock Purchase Plan
In January 2004, the 2004 Employee Stock Purchase Plan (the “2004 Purchase Plan”) was adopted by the board of directors and was subsequently approved by stockholders. A total of 750,000 shares of common stock were originally reserved for issuance under the 2004 Purchase Plan. The number of shares reserved for issuance under the 2004 Purchase Plan is increased on the first day of each year. The 2004 Purchase Plan permits eligible employees to acquire shares of the Company’s common stock through periodic payroll deductions of up to 15% of total compensation. No more than 1,875 shares may be purchased by each eligible employee during a single purchase period. In April 2006, the Company amended its 2004 Purchase Plan so that offering periods under the plan shall consist of consecutive six month periods instead of overlapping 24 month periods. The Company’s 2004 Purchase Plan is considered compensatory. Purchase periods for the 2004 Purchase Plan have a duration of six months. The purchase price under the 2004 Purchase Plan will be equal to 85% of the fair market value per share of common stock on either the first trading day of the offering period or on the last trading day of the purchase period, whichever is less. During the years ended December 31, 2009, 2008 and 2007, 565,000, 365,000 and 275,000 shares, respectively, were purchased under the 2004 Purchase Plan.
F-26
Table of Contents
ATHEROS COMMUNICATIONS, INC.
NOTES TO CONSOLIDATED FINANCIAL STATEMENTS—(Continued)
Restricted Stock Units
Restricted stock units are share awards that entitle the holder to receive freely tradable shares of the Company’s common stock upon vesting. The Company granted 2,280,000, 1,255,000 and 746,000 restricted stock units to employees in 2009, 2008 and 2007, respectively. Generally, restricted stock units vest over a period ranging from one to four years. The Company determined the fair value of the restricted stock awards granted to be $48,175,000, $35,899,000 and $21,564,000 in 2009, 2008 and 2007, respectively, by reference to the quoted market price of the stock at the date of grant. Compensation expense related to the issuance of restricted stock units was $25,501,000, $12,554,000 and $6,649,000 for the years ended December 31, 2009, 2008 and 2007, respectively. The weighted average fair value of the restricted stock units granted was $21.13, $28.60 and $28.94 in 2009, 2008 and 2007, respectively.
Determining Fair Value
Valuation method—The Company estimates the fair value of stock options granted using the Black-Scholes valuation model.
Expected Term—The expected term represents the period that the Company’s stock-based awards are expected to be outstanding. For 2007 and the first six months of 2008, the Company based its expected term on the expected terms used by similar entities since the Company did not have sufficient historical experience for determining the expected term of the stock option awards granted. For the final six months of 2008 and the first six months of 2009, the Company estimated the expected term based on the Company’s historical financial data and estimates of future option exercise activity, as well as the expected terms used by similar entities. For the final six months of 2009, the Company estimated expected term based on the Company’s historical financial data and estimates of future option exercise activity. For stock options assumed as a result of the Intellon acquisition in December 2009, expected term was calculated using the simplified method because the Company did not have sufficient historical exercise data related to the Intellon stock options to provide a reasonable basis upon which to estimate expected term.
Expected Volatility—For options granted in 2007 and the first six months of 2008, the Company estimated volatility based on considerations of the implied volatility of long-term options traded on the open market and the average historical volatilities of the Company’s stock and those of similar entities. For the final six months of 2008 and 2009, the Company estimated the volatility of its common stock at the date of grant based entirely on considerations of the implied volatility of long-term options traded on the open market and its average historical volatilities.
Risk-Free Interest Rate—The Company bases the risk-free interest rate used in the Black-Scholes valuation model on the implied yield currently available on the U.S. Treasury zero-coupon issues with an equivalent expected term.
Expected Dividend—The expected dividend assumption is based on the Company’s current expectations about its anticipated dividend policy.
F-27
Table of Contents
ATHEROS COMMUNICATIONS, INC.
NOTES TO CONSOLIDATED FINANCIAL STATEMENTS—(Continued)
The fair value of the Company’s stock-based awards to employees was estimated using the following weighted-average assumptions for the grants made in the years ended December 31, 2009, 2008 and 2007:
| Option Plan Shares |
Year Ended December 31, | |||||||||||
| 2009 | 2008 | 2007 | ||||||||||
| Estimated life (in years) |
5.1 | 4.9 | 4.8 | |||||||||
| Expected volatility |
53.0 | % | 51.0 | % | 49.0 | % | ||||||
| Risk-free interest rate |
1.9 | % | 2.9 | % | 4.6 | % | ||||||
| Expected dividends |
— | — | — | |||||||||
| Weighted average grant-date fair value |
$ | 12.50 | $ | 12.34 | $ | 12.79 | ||||||
| ESPP Plan Shares |
Year Ended December 31, | |||||||||||
| 2009 | 2008 | 2007 | ||||||||||
| Estimated life (in years) |
0.5 | 0.5 | 0.5 | |||||||||
| Expected volatility |
56.9-73.0 | % | 44.0-54.4 | % | 39.7-46.2 | % | ||||||
| Risk-free interest rate |
0.3-0.9 | % | 1.7-3.9 | % | 5.1-5.2 | % | ||||||
| Expected dividends |
— | — | — | |||||||||
| Weighted average grant-date fair value |
$ | 5.85 | $ | 8.77 | $ | 6.90 | ||||||
Stock-based Compensation Expense
The following table shows total stock-based compensation expense included in the Consolidated Statements of Operations for the years ended December 31, 2009, 2008 and 2007 (in thousands):
| Year Ended December 31, | |||||||||
| 2009 | 2008 | 2007 | |||||||
| Cost of goods sold |
$ | 791 | $ | 441 | $ | 521 | |||
| Research and development |
21,837 | 16,451 | 12,464 | ||||||
| Sales and marketing |
13,402 | 8,714 | 5,053 | ||||||
| General and administrative |
8,353 | 4,840 | 3,176 | ||||||
| Acquisition-related charges |
4,427 | — | — | ||||||
| $ | 48,810 | $ | 30,446 | $ | 21,214 | ||||
Management has estimated expected forfeitures and is recognizing compensation costs only for the stock-based awards expected to vest.
At December 31, 2009, the total compensation cost related to unvested stock-based awards granted to employees under the Company’s stock incentive plans but not yet recognized was approximately $93,763,000 net of estimated forfeitures. This cost will be amortized on a graded vesting basis for awards granted prior to January 1, 2006, and on a straight-line basis for awards granted after December 31, 2005, except for performance-based awards which are amortized on a graded vesting basis, over a weighted-average period of approximately 2.7 years and will be adjusted for subsequent changes in estimated forfeitures. Future option grants will increase the amount of compensation expense to be recorded in these periods.
F-28
Table of Contents
ATHEROS COMMUNICATIONS, INC.
NOTES TO CONSOLIDATED FINANCIAL STATEMENTS—(Continued)
Stock Options and Awards Activity
The following is a summary of option activity for the Company’s Stock Incentive Plans for the year ended December 31, 2009 (in thousands, except per share amounts and contractual life):
| Number of Shares |
Weighted Average Exercise Price |
Weighted Average Remaining Contractual Life (Years) |
Aggregate Intrinsic Value | ||||||||
| Outstanding at January 1, 2009 |
9,050 | $ | 17.24 | ||||||||
| Granted |
1,437 | 18.79 | |||||||||
| Exercised |
(1,405 | ) | 10.33 | ||||||||
| Forfeitures and cancellations |
(241 | ) | 25.31 | ||||||||
| Outstanding at December 31, 2009 |
8,841 | $ | 18.39 | 5.70 | $ | 140,575 | |||||
| Exercisable at December 31, 2009 |
5,911 | $ | 16.04 | 4.66 | $ | 107,954 | |||||
As of December 31, 2009, 8,446,000 shares are vested and expected to vest. These shares had a weighted average exercise price of $18.23, a weighted average remaining contractual life of 5.58 years and an aggregate intrinsic value of $135,605,000.
The aggregate intrinsic value is calculated as the difference between the exercise price of the underlying awards and the quoted price of the Company’s common stock for the 8,719,000 options that were in-the-money at December 31, 2009. During the years ended December 31, 2009, 2008 and 2007, the aggregate intrinsic value of options exercised under the Company’s stock incentive plans was $22,528,000, $20,945,000 and $56,240,000, respectively, determined as of the date of option exercise. As of December 31, 2009, the Company had 2,061,000 authorized shares available for future issuance under all of its stock incentive plans.
The following table summarizes the Company’s restricted stock unit activity for the years ended December 31, 2007, 2008 and 2009 (in thousands, except per share amounts):
| Restricted Stock Units | ||||||
| Number of Shares |
Weighted Average Grant Date Fair Value | |||||
| Nonvested stock at January 1, 2007 |
989 | $ | 19.35 | |||
| Granted |
746 | 28.94 | ||||
| Vested |
(339 | ) | 21.14 | |||
| Forfeited |
(45 | ) | 20.47 | |||
| Nonvested stock at December 31, 2007 |
1,351 | $ | 24.17 | |||
| Granted |
1,255 | 28.60 | ||||
| Vested |
(543 | ) | 25.63 | |||
| Forfeited |
(162 | ) | 25.95 | |||
| Nonvested stock at December 31, 2008 |
1,901 | $ | 26.53 | |||
| Granted |
2,280 | 21.13 | ||||
| Vested |
(858 | ) | 20.40 | |||
| Forfeited |
(151 | ) | 21.38 | |||
| Nonvested stock at December 31, 2009 |
3,172 | $ | 24.55 | |||
The intrinsic value of restricted stock units vested was $19,083,000, $12,534,000 and $9,994,000 in 2009, 2008 and 2007, respectively. The total intrinsic value of all outstanding restricted stock units was $108,615,000, $27,210,000 and $41,260,000 as of December 31, 2009, 2008 and 2007, respectively.
The Company is authorized to issue 10,000,000 shares of preferred stock, par value $0.0005 per share, of which no shares are issued or outstanding as of December 31, 2009.
F-29
Table of Contents
ATHEROS COMMUNICATIONS, INC.
NOTES TO CONSOLIDATED FINANCIAL STATEMENTS—(Continued)
12. Net Income Per Share
Net income per share is calculated as follows (in thousands, except per share data):
| Years ended December 31, | |||||||||||
| 2009 | 2008 | 2007 | |||||||||
| Numerator: |
|||||||||||
| Net income |
$ | 46,407 | $ | 18,872 | $ | 39,980 | |||||
| Denominator: |
|||||||||||
| Weighted average shares outstanding |
62,040 | 59,813 | 55,970 | ||||||||
| Weighted average shares subject to repurchase |
— | (9 | ) | (53 | ) | ||||||
| Shares used to calculate basic net income per share |
62,040 | 59,804 | 55,917 | ||||||||
| Effect of dilutive securities: |
|||||||||||
| Common stock options, RSUs and warrants |
1,893 | 2,257 | 3,360 | ||||||||
| Common shares subject to repurchase |
— | 9 | 53 | ||||||||
| Shares used to calculate diluted net income per share |
63,933 | 62,070 | 59,330 | ||||||||
| Basic net income per share |
$ | 0.75 | $ | 0.32 | $ | 0.71 | |||||
| Diluted net income per share |
$ | 0.73 | $ | 0.30 | $ | 0.67 | |||||
The Company excludes potentially dilutive securities from its diluted net income per share calculation when their effect would be antidilutive to net income per share amounts. The common stock equivalents related to options to purchase 4,318,000, 3,498,000 and 1,864,000 shares of the Company’s common stock were excluded from the net income per share calculation in the years ended December 31, 2009, 2008 and 2007, respectively, as their effect would have been antidilutive.
13. Income Taxes
The U.S. and foreign components of income (loss) before income taxes are as follows (in thousands):
| Years Ended December 31, | |||||||||||
| 2009 | 2008 | 2007 | |||||||||
| U.S. |
$ | (36,623 | ) | $ | (19,670 | ) | $ | 17,870 | |||
| Foreign |
62,787 | 38,964 | 26,316 | ||||||||
| $ | 26,164 | $ | 19,294 | $ | 44,186 | ||||||
The income tax provision consists of the following (in thousands):
| Years Ended December 31, | ||||||||||||
| 2009 | 2008 | 2007 | ||||||||||
| Federal: |
||||||||||||
| Current |
$ | 6,664 | $ | 5,875 | $ | 8,820 | ||||||
| Deferred |
(4,930 | ) | (3,303 | ) | (333 | ) | ||||||
| State: |
||||||||||||
| Current |
799 | 517 | 20 | |||||||||
| Deferred |
(2,123 | ) | (3,057 | ) | (4,355 | ) | ||||||
| Foreign: |
||||||||||||
| Current |
(20,420 | ) | 1,217 | 864 | ||||||||
| Deferred |
(233 | ) | (827 | ) | (810 | ) | ||||||
| Income tax (benefit) provision |
$ | (20,243 | ) | $ | 422 | $ | 4,206 | |||||
F-30
Table of Contents
ATHEROS COMMUNICATIONS, INC.
NOTES TO CONSOLIDATED FINANCIAL STATEMENTS—(Continued)
The effective tax rate differs from the applicable U.S. statutory federal income tax rate as follows:
| Years Ended December 31, | |||||||||
| 2009 | 2008 | 2007 | |||||||
| U.S. statutory federal tax rate |
35.0 | % | 35.0 | % | 35.0 | % | |||
| State taxes, net of federal benefit |
(5.2 | ) | (14.5 | ) | (2.9 | ) | |||
| Research and development credits |
(9.4 | ) | (14.9 | ) | (6.0 | ) | |||
| Stock-based compensation |
30.8 | 31.6 | 7.6 | ||||||
| Change in valuation allowance |
2.8 | 29.5 | (6.7 | ) | |||||
| Foreign tax rate differences |
(135.0 | ) | (66.2 | ) | (21.6 | ) | |||
| Acquired in-process technology |
— | — | 3.7 | ||||||
| Non-deductible acquisition-related costs |
3.3 | — | — | ||||||
| Other |
0.3 | 1.7 | 0.4 | ||||||
| Effective tax rate |
(77.4 | )% | 2.2 | % | 9.5 | % | |||
Significant components of the Company’s net deferred tax assets consist of (in thousands):
| December 31, | ||||||||
| 2009 | 2008 | |||||||
| Deferred tax assets: |
||||||||
| Credit carryforwards |
$ | 32,675 | $ | 22,352 | ||||
| Net operating loss carryforwards |
1,355 | — | ||||||
| Stock-based compensation |
10,351 | 5,471 | ||||||
| Other accruals and reserves recognized in different periods |
5,576 | 1,185 | ||||||
| Excess book over tax depreciation and amortization |
1,706 | 1,439 | ||||||
| Impairment of long-term investments |
7,267 | 6,548 | ||||||
| Other, net |
728 | 772 | ||||||
| Total deferred tax assets |
59,658 | 37,767 | ||||||
| Valuation allowance |
(16,770 | ) | (10,802 | ) | ||||
| Net deferred tax assets |
$ | 42,888 | $ | 26,965 | ||||
| Deferred tax liabilities: |
||||||||
| Purchased intangibles |
$ | (30,050 | ) | $ | (21,963 | ) | ||
| Unremitted earnings of foreign subsidiaries |
(7,000 | ) | — | |||||
| Other comprehensive income |
(1,182 | ) | (306 | ) | ||||
| Total deferred tax liabilities |
$ | (38,232 | ) | $ | (22,269 | ) | ||
| Net deferred tax assets |
$ | 4,656 | $ | 4,696 | ||||
The breakdown between current and noncurrent deferred tax assets and deferred tax liabilities was as follows (in thousands):
| December 31, | ||||||||
| 2009 | 2008 | |||||||
| Current deferred tax assets |
$ | 12,989 | $ | 8,139 | ||||
| Noncurrent deferred tax assets |
1,481 | 18,256 | ||||||
| Current deferred tax liabilities |
— | (3 | ) | |||||
| Noncurrent deferred tax liabilities |
(9,814 | ) | (21,696 | ) | ||||
| Net deferred tax assets |
$ | 4,656 | $ | 4,696 | ||||
F-31
Table of Contents
ATHEROS COMMUNICATIONS, INC.
NOTES TO CONSOLIDATED FINANCIAL STATEMENTS—(Continued)
The change in the Company’s deferred tax valuation allowance is as follows (in thousands):
| December 31, | ||||||
| 2009 | 2008 | |||||
| Beginning balance |
10,802 | 5,415 | ||||
| Additions |
6,631 | 5,685 | ||||
| Deductions |
(663 | ) | (298 | ) | ||
| Ending balance |
16,770 | 10,802 | ||||
The Company records a valuation allowance to reflect the estimated amount of deferred tax assets that may not be realized. This occurs primarily when net operating losses and tax credit carryforwards are expected to expire prior to their utilization. In the year ended December 31, 2009, the Company recorded an additional valuation allowance of $5,968,000 primarily against foreign research and development tax credit carryforwards. In 2009, the Company recognized an income tax benefit of $21,695,000 related to the favorable settlement of a foreign tax liability. In 2008, the Company recorded a valuation allowance of $5,387,000 primarily against unrealized losses on long-term investments, and the Company recognized an income tax benefit of $1,068,000 related to a change in a state tax filing position, which resulted in the recording of a net deferred tax benefit.
The deferred tax assets and liabilities for the year ended December 31, 2009 include amounts related to the acquisitions of ZyDAS and Intellon. A valuation allowance has been provided for the pre-acquisition research and development tax credit carryforwards of the acquired companies which are not likely to be realized.
At December 31, 2009, the Company has federal and state net operating loss carryforwards of approximately $17,493,000 and $7,847,000, respectively, available to offset future taxable income. The federal and state net operating loss carryforwards will begin to expire in 2023 and 2014, respectively, if not utilized before these dates. The federal and state loss carryforwards are primarily attributable to excess tax deductions from stock option exercises, and such portions of the carryforwards are not included in the deferred tax assets shown above. The benefit of these loss carryforwards will be credited to equity when realized.
At December 31, 2009, the Company has research and development credit carryforwards of approximately $17,608,000, $16,531,000 and $11,048,000 available to offset future federal, state and foreign income taxes, respectively. The federal tax credit carryforwards will begin to expire in 2018 and the foreign carryforwards will begin to expire in 2010, if not utilized before these dates. The state tax credit carryforwards have no expiration. Approximately $14,608,000 of the federal tax credit carryforwards and $4,284,000 of the state tax credit carryforwards are attributable to excess tax deductions from stock option exercises, and are not included in the deferred tax assets shown above. The benefit of these carryforwards will be credited to equity when realized.
At December 31, 2009, United States federal and state income taxes have not been provided on approximately $46,500,000 of undistributed earnings of foreign subsidiaries as such earnings are considered to be indefinitely reinvested. It is not practical to calculate the residual income tax that would result if these earnings were repatriated due to the complexities of the tax law and the hypothetical nature of the calculations.
The Company has adopted the FASB’s updated guidance related to income taxes, which prescribes a recognition threshold and measurement attribute for the financial statement recognition and measurement of a tax position taken or expected to be taken in a tax return. The updated guidance also provides guidance on derecognition of tax benefits, classification on the balance sheet, interest and penalties, accounting in interim periods, disclosure, and transition. The Company has classified interest and penalties as a component of tax expense. As a result of the implementation of the updated guidance, the Company recognized a $341,000 increase in the liability for unrecognized tax benefits, which was accounted for as an increase in the January 1, 2007 balance of accumulated deficit. The Company reclassified certain tax liabilities for unrecognized tax benefits, as well as related potential penalties and interest, from current liabilities to long-term liabilities. The Company’s unrecognized tax benefits at December 31, 2009 relate to U.S. federal, state, and various foreign jurisdictions.
F-32
Table of Contents
ATHEROS COMMUNICATIONS, INC.
NOTES TO CONSOLIDATED FINANCIAL STATEMENTS—(Continued)
The following table summarizes the activity related to the unrecognized tax benefits (in thousands):
| Year Ended December 31, | |||||||||||
| 2009 | 2008 | 2007 | |||||||||
| Beginning balance |
$ | 37,096 | $ | 31,115 | $ | 22,371 | |||||
| Increases: |
|||||||||||
| For current year’s tax positions |
7,191 | 6,620 | 8,720 | ||||||||
| For prior years’ tax positions |
21,928 | 146 | — | ||||||||
| Other |
— | — | 24 | ||||||||
| Decreases: |
|||||||||||
| For prior years’ tax positions |
— | (674 | ) | — | |||||||
| Settlements with taxing authorities |
(21,818 | ) | (111 | ) | — | ||||||
| Ending balance |
$ | 44,397 | $ | 37,096 | $ | 31,115 | |||||
Included in the unrecognized tax benefits of $44,397,000 at December 31, 2009 was $42,193,000 of tax benefits that, if recognized, would reduce the Company’s annual effective tax rate. The total amount of unrecognized tax benefits related to penalties and interest is $758,000 as of December 31, 2009. The Company does not expect its unrecognized tax benefits to change significantly over the next 12 months.
Included in the unrecognized tax benefits of $37,096,000 at December 31, 2008 was $35,158,000 of tax benefits that, if recognized, would reduce the Company’s annual effective tax rate. The total amount of unrecognized tax benefits related to penalties and interest is $468,000 as of December 31, 2008.
The Company files U.S. federal, state, and foreign income tax returns in jurisdictions with varying statutes of limitations. Substantially all of the Company’s tax years, dating to inception in 1998, remain open to federal tax examination. Most states and foreign jurisdictions have 3 to 11 open tax years at any point in time.
The Company’s Federal income tax return for the year ended December 31, 2006 is under examination by the Internal Revenue Service.
14. Comprehensive Income
The components of comprehensive income are as follows (in thousands):
| Year Ended December 31, | ||||||||||
| 2009 | 2008 | 2007 | ||||||||
| Net income |
$ | 46,407 | $ | 18,872 | $ | 39,980 | ||||
| Other comprehensive income: |
||||||||||
| Unrealized gain on investments |
1,510 | 337 | 266 | |||||||
| Other |
57 | (220 | ) | — | ||||||
| Total comprehensive income, net of tax |
$ | 47,974 | $ | 18,989 | $ | 40,246 | ||||
15. Employee Benefit Plan
The Company sponsors a 401(k) Savings Plan (the “Plan”) for all employees who meet certain eligibility requirements. Participants may contribute, on a pre-tax basis an amount not to exceed a maximum contribution amount pursuant to Section 401(k) of the Internal Revenue Code. In 2007 the Company adopted a limited matching contribution policy. Under this policy, the Company made $380,000, $397,000 and $328,000 in contributions to participants in this plan during the years ended December 31, 2009, 2008 and 2007, respectively.
F-33
Table of Contents
ATHEROS COMMUNICATIONS, INC.
NOTES TO CONSOLIDATED FINANCIAL STATEMENTS—(Continued)
16. Segment Information, Operations by Geographic Area And Significant Customers
The Company currently operates in one reportable segment, the design and marketing of semiconductors for the communications industry. The Company’s Chief Operating Decision Maker (“CODM”) is the Chief Executive Officer (“CEO”).
Information regarding net sales by target market is as follows (in thousands):
| Year Ended December 31, | |||||||||
| 2009 | 2008 | 2007 | |||||||
| Networking |
$ | 234,085 | $ | 254,379 | $ | 219,669 | |||
| PC OEM |
201,919 | 171,405 | 174,213 | ||||||
| Consumer |
106,464 | 46,612 | 23,078 | ||||||
| Net revenue |
$ | 542,468 | $ | 472,396 | $ | 416,960 | |||
Geographic Information
Long-lived assets outside of the United States are insignificant. Net revenue consists of sales to customers in the following countries:
| December 31, | |||||||||
| 2009 | 2008 | 2007 | |||||||
| Taiwan |
36 | % | 41 | % | 49 | % | |||
| China |
21 | 29 | 37 | ||||||
| Japan |
15 | 7 | 3 | ||||||
| Hong Kong |
14 | 10 | 3 | ||||||
| United States |
3 | 1 | 1 | ||||||
| Other |
11 | 12 | 7 | ||||||
Significant Customers
In 2009, 2008 and 2007, Hon Hai Precision Industry Co. Ltd. accounted for 17%, 19% and 25% of the Company’s net revenue, respectively. In 2009, Nintendo Co., Ltd. accounted for 13% of the Company’s net revenue.
As of December 31 2009 and 2008, Hon Hai Precision Industry Co. Ltd. accounted for 15% and 29%, respectively, of the Company’s accounts receivable balance.
F-34
Table of Contents
ATHEROS COMMUNICATIONS, INC.
NOTES TO CONSOLIDATED FINANCIAL STATEMENTS—(Continued)
Supplementary Data (Unaudited)
The following table presents the Company’s unaudited consolidated statements of operations data for each of the eight quarters in the period ended December 31, 2009. In management’s opinion, this information has been presented on the same basis as the audited consolidated financial statements included in a separate section of this report, and all necessary adjustments, consisting only of normal recurring adjustments, have been included in the amounts below to present fairly the unaudited quarterly results when read in conjunction with the audited consolidated financial statements and related notes. The operating results for any quarter should not be relied upon as necessarily indicative of results for any future period.
| Fiscal 2009 | ||||||||||||||
| First Quarter(1,2) |
Second Quarter(1,2) |
Third Quarter(1,2,3, 4) |
Fourth Quarter(1,2,4) | |||||||||||
| Net revenue |
$ | 87,925 | $ | 112,224 | $ | 156,641 | $ | 185,678 | ||||||
| Gross profit |
42,081 | 53,043 | 75,594 | 92,885 | ||||||||||
| Net income (loss) |
(7,552 | ) | (250 | ) | 38,576 | 15,633 | ||||||||
| Net income (loss) per share: |
||||||||||||||
| Basic |
$ | (0.12 | ) | $ | 0.00 | $ | 0.62 | $ | 0.25 | |||||
| Diluted |
$ | (0.12 | ) | $ | 0.00 | $ | 0.60 | $ | 0.24 | |||||
| Fiscal 2008 | |||||||||||||
| First Quarter(5,6) |
Second Quarter(5,6,7) |
Third Quarter(5,6) |
Fourth Quarter(5,6,8) |
||||||||||
| Net revenue |
$ | 114,518 | $ | 121,518 | $ | 138,064 | $ | 98,296 | |||||
| Gross profit |
58,056 | 61,461 | 68,125 | 48,323 | |||||||||
| Net income (loss) |
3,417 | 10,125 | 10,088 | (4,758 | ) | ||||||||
| Net income (loss) per share: |
|||||||||||||
| Basic |
$ | 0.06 | $ | 0.17 | $ | 0.17 | $ | (0.08 | ) | ||||
| Diluted |
$ | 0.06 | $ | 0.16 | $ | 0.16 | $ | (0.08 | ) | ||||
| (1) | During 2009, the Company recorded amortization of intangible assets acquired of $2,885,000, $2,885,000, $2,580,000 and $3,220,000 in the first, second, third and fourth quarters, respectively. Acquisition—related identified intangibles are amortized in a straight-line basis over their estimated economic lives. |
| (2) | During 2009, the Company recorded other-than-temporary impairment of its long-term investments of $1,107,000, $30,000, $874,000 and $7,000 in the first, second, third and fourth quarters, respectively. The impairment of the Company’s long-term investments was a result of a lack of liquidity in the market for these securities, resulting in an other-than-temporary reduction of the fair value. |
| (3) | During the three months ended September 30, 2009, the Company recorded a tax benefit of $21.7 million related to the favorable settlement of a foreign tax liability resulting from a prior acquisition. |
| (4) | The Company recorded transaction charges related to the acquisition of Intellon of $977,000 and $9,557,000 during the third and fourth quarters of 2009. |
| (5) | During 2008, the Company recorded amortization of intangible assets acquired of $3,409,000, $3,010,000, $2,927,000 and $2,885,000 in the first, second, third and fourth quarters, respectively. Acquisition-related identified intangibles are amortized in a straight-line basis over their estimated economic lives. |
| (6) | During 2008, the Company recorded other-than-temporary impairment of its long-term investments of $5,070,000, $1,387,000, $4,385,000 and $4,648,000 in the first, second, third and fourth quarters, respectively. The impairment of the Company’s long-term investments was a result of a lack of liquidity in the market for these securities, resulting in an other-than-temporary reduction of the fair value. |
| (7) | During the second quarter or 2008, the Company changed a state tax filing position, which resulted in the recording of a net tax benefit of approximately $1,068,000. |
| (8) | On October 3, 2008, the Emergency Economic Stabilization Act of 2008 was signed into law. This legislation extended the federal research credit through the end of 2009. During the fourth quarter of 2008, the Company recognized a tax benefit of $2,800,000 due to the extension of the federal research credit. |
F-35
Table of Contents
Exhibit Index
The following exhibits are filed herewith or are incorporated by reference to exhibits previously filed with the Securities and Exchange Commission. Atheros Communications, Inc. (the “Registrant”) shall furnish copies of exhibits for a reasonable fee (covering the expense of furnishing copies) upon request.
| Exhibit |
Description | |
| 2.1 | Agreement and Plan of Merger dated September 8, 2009, by and among the Registrant, Iceman Acquisition One Corporation, Iceman Acquisition Two LLC and Intellon Corporation (filed as Exhibit 2.1 to the Registrant’s Current Report on Form 8-K filed September 8, 2009, and incorporated herein by reference). | |
| The following exhibits and schedule to the Agreement and Plan of Merger have been omitted. The Registrant will furnish copies of the omitted exhibits and schedule to the SEC upon request. | ||
| Exhibit A |
Form of Support Agreement | |
| Exhibit B |
Form of Parent Tax Representation Letter | |
| Exhibit C |
Form of Company Tax Representation Letter | |
| Exhibit D |
Form of License Agreement | |
| Exhibit E |
Form of Pillsbury Winthrop Shaw Pittman LLP Tax Opinion | |
| Schedule A |
Certain Employee Arrangements | |
| 3.1 | Restated Certificate of Incorporation of the Registrant (filed as Exhibit 3.2 to the Registrant’s Registration Statement on Form S-1, file no. 333-110807, and incorporated herein by reference). | |
| 3.2 | Amended and Restated Bylaws of the Registrant (filed as Exhibit 3.4 to the Registrant’s Registration Statement on Form S-1, file no. 333-110807, and incorporated herein by reference). | |
| 10.1(1) | Form of Indemnification Agreement between the Registrant and its officers and directors (filed as Exhibit 10.1 to the Registrant’s Registration Statement on Form S-1, file no. 333-110807, and incorporated herein by reference). | |
| 10.2(1) | 1998 Stock Incentive Plan and form of agreements thereunder (filed as Exhibit 10.2 to the Registrant’s Registration Statement on Form S-1, file no. 333-110807, and incorporated herein by reference). | |
| 10.3(1) | 2004 Stock Incentive Plan (filed as Exhibit 10.1 to the Registrant’s Quarterly Report on Form 10-Q for the quarter ended March 31, 2008, and incorporated herein by reference). | |
| 10.4(1) | Amendment dated October 22, 2008, to 2004 Stock Incentive Plan (filed as Exhibit 10.1 to the Registrant’s Quarterly Report on Form 10-Q for the quarter ended September 30, 2008, and incorporated herein by reference). | |
| 10.5(1) | Form of stock option agreement under 2004 Stock Incentive Plan. | |
| 10.6(1) | Form of restricted stock award agreement under 2004 Stock Incentive Plan (filed as Exhibit 10.2 to the Registrant’s Quarterly Report on Form 10-Q for the quarter ended March 31, 2005, and incorporated herein by reference). | |
| 10.7(1) | Form of restricted stock unit agreement under 2004 Stock Incentive Plan. | |
| 10.8(1) | Intellon Corporation Third Amended and Restated 2000 Employee Incentive Plan (filed as Exhibit 99.1 to the Registrant’s Registration Statement on Form S-8, file no. 333-163735, and incorporated herein by reference). | |
| 10.9(1) | Intellon Corporation 2007 Equity Incentive Plan (filed as Exhibit 99.2 to the Registrant’s Registration Statement on Form S-8, file no. 333-163735, and incorporated herein by reference). | |
| 10.10(1) | Form of Stock Option Assumption Agreement (filed as Exhibit 99.3 to the Registrant’s Registration Statement on Form S-8, file no. 333-163735, and incorporated herein by reference). | |
Table of Contents
| Exhibit |
Description | |
| 10.11(1) | Form of Stock Unit Assumption Agreement (filed as Exhibit 99.4 to the Registrant’s Registration Statement on Form S-8, file no. 333-163735, and incorporated herein by reference). | |
| 10.12(1) | 2009 Inducement Grant Incentive Plan (filed as Exhibit 99.5 to the Registrant’s Registration Statement on Form S-8, file no. 333-163735, and incorporated herein by reference). | |
| 10.13(1) | Form of restricted stock unit agreement under 2009 Inducement Grant Incentive Plan. | |
| 10.14(1) | 2004 Employee Stock Purchase Plan (filed as Exhibit 10.1 to the Registrant’s Current Report on Form 8-K, filed on April 21, 2006, and incorporated herein by reference). | |
| 10.15 | Lease Agreement dated as of April 8, 2005, between Registrant and Prentiss Properties Acquisition Partners, L.P., (filed as Exhibit 10.1 to the Registrant’s Current Report on Form 8-K filed on April 18, 2005, and incorporated herein by reference). | |
| 10.16 | Warrant to Purchase Shares of Preferred Stock of Atheros Communications, Inc. dated September 6, 2001 by and between the Registrant and GATX Ventures, Inc. (filed as Exhibit 10.8 to the Registrant’s Registration Statement on Form S-1, file no. 333-110807, and incorporated herein by reference). | |
| 10.17(1) | Offer Letter, dated April 9, 2003, by and between the Registrant and Craig Barratt (filed as Exhibit 10.13 to the Registrant’s Registration Statement on Form S-1, file no. 333-110807, and incorporated herein by reference). | |
| 10.18(1) | Severance and Change in Control Agreement, dated February 13, 2009, by and between the Registrant and Craig Barratt (filed as Exhibit 10.12 to the Registrant’s Annual Report on Form 10-K for the year ended December 31, 2008, and incorporated herein by reference). | |
| 10.19(1) | Offer Letter, dated September 26, 2003, by and between the Registrant and Jack Lazar (filed as Exhibit 10.14 to the Registrant’s Registration Statement on Form S-1, file no. 333-110807, and incorporated herein by reference). | |
| 10.20(1) | Severance and Change in Control Agreement, dated February 13, 2009, by and between the Registrant and Jack Lazar (filed as Exhibit 10.14 to the Registrant’s Annual Report on Form 10-K for the year ended December 31, 2008, and incorporated herein by reference). | |
| 10.21(1) | Offer Letter, dated May 14, 2007, by and between the Registrant and Ben Naskar (filed as Exhibit 10.13 to the Registrant’s Annual Report on Form 10-K for the year ended December 31, 2007, and incorporated herein by reference). | |
| 10.22(1) | Severance and Change in Control Agreement, dated February 13, 2009, by and between the Registrant and Ben Naskar (filed as Exhibit 10.16 to the Registrant’s Annual Report on Form 10-K for the year ended December 31, 2008, and incorporated herein by reference). | |
| 10.23(1) | Offer Letter, dated December 29, 2005, by and between the Registrant and Gary Szilagyi (filed as Exhibit 10.12 to the Registrant’s Annual Report on Form 10-K for the year ended December 31, 2005, and incorporated herein by reference). | |
| 10.24(1) | Severance and Change in Control Agreement, dated February 12, 2009, by and between the Registrant and Gary Szilagyi (filed as Exhibit 10.18 to the Registrant’s Annual Report on Form 10-K for the year ended December 31, 2008, and incorporated herein by reference). | |
| 10.25(1) | Exempt Employee Letter Agreement, dated September 13, 2000, by and between the Registrant and Adam Tachner (filed as Exhibit 10.19 to the Registrant’s Annual Report on Form 10-K for the year ended December 31, 2008, and incorporated herein by reference). | |
| 10.26(1) | Severance and Change in Control Agreement, dated February 12, 2009, by and between the Registrant and Adam Tachner (filed as Exhibit 10.20 to the Registrant’s Annual Report on Form 10-K for the year ended December 31, 2008, and incorporated herein by reference). | |
| 10.27(1) | Amended and Restated Exempt Employee Letter Agreement, dated May 8, 2001 by and between the Registrant and Hing Chu (filed as Exhibit 10.21 to the Registrant’s Annual Report on Form 10-K for the year ended December 31, 2008, and incorporated herein by reference). | |
Table of Contents
| Exhibit |
Description | |
| 10.28(1) | Severance and Change in Control Agreement, dated February 12, 2009, by and between the Registrant and Hing Chu (filed as Exhibit 10.22 to the Registrant’s Annual Report on Form 10-K for the year ended December 31, 2008, and incorporated herein by reference). | |
| 10.29(1) | Exempt Employee Letter Agreement, dated January 3, 2000, by and between the Registrant and David Torre (filed as Exhibit 10.23 to the Registrant’s Annual Report on Form 10-K for the year ended December 31, 2008, and incorporated herein by reference). | |
| 10.30(1) | Severance and Change in Control Agreement, dated February 12, 2009, by and between the Registrant and David Torre (filed as Exhibit 10.24 to the Registrant’s Annual Report on Form 10-K for the year ended December 31, 2008, and incorporated herein by reference). | |
| 10.31(1) | Summary of 2009 Executive Bonus Plan, adopted by the Compensation Committee of the Board of Directors on February 6, 2009 (filed under Item 5.02 in the Registrant’s Current Report on Form 8-K, filed on February 6, 2009, and incorporated herein by reference). | |
| 10.32 | Form of Support Agreement, in connection with Agreement and Plan of Merger by and among Atheros Communications, Inc, Iceman Acquisition One Corporation, Iceman Acquisition Two LLC and Intellon Corporation (filed as Exhibit 10.1 to the Registrant’s Current Report on Form 8-K, filed on September 8, 2009, and incorporated herein by reference). | |
| 10.33 | Amendment dated December 13, 2008 to 2004 Stock Incentive Plan. | |
| 21.1 | List of Subsidiaries of the Registrant. | |
| 23.1 | Consent of Deloitte & Touche LLP, independent registered public accounting firm. | |
| 23.2 | Consent of PricewaterhouseCoopers LLP, independent registered public accounting firm. | |
| 24 | Power of Attorney (see page 62). | |
| 31.1 | Certificate of Chief Executive Officer pursuant to Section 302 of the Sarbanes-Oxley Act of 2002 (18 U.S.C. Section 1350). | |
| 31.2 | Certificate of Chief Financial Officer pursuant to Section 302 of the Sarbanes-Oxley Act of 2002 (18 U.S.C. Section 1350). | |
| 32.1(2) | Certificate of Chief Executive Officer pursuant to Section 906 of the Sarbanes-Oxley Act of 2002 (18 U.S.C. Section 1350). | |
| 32.2(2) | Certificate of Chief Financial Officer pursuant to Section 906 of the Sarbanes-Oxley Act of 2002 (18 U.S.C. Section 1350). | |
| (1) | Indicates management contract or compensatory plan or arrangement. |
| (2) | The material contained in Exhibit 32.1 and Exhibit 32.2 is not deemed “filed” with the SEC and is not to be incorporated by reference into any filing of the Company under the Securities Act of 1933 or the Securities Exchange Act of 1934, whether made before or after the date hereof and irrespective of any general incorporation language contained in such filing, except to the extent that the registrant specifically incorporates it by reference. |