Attached files
| file | filename |
|---|---|
| 8-K - FORM 8-K - BECKMAN COULTER INC | d8k.htm |
| EX-99.1 - PRESS RELEASE ISSUED BY BECKMAN COULTER, INC. - BECKMAN COULTER INC | dex991.htm |
 1 BEC Q4 2009 Conf Call & Webcast Presentation 2/11/10 - 1 Beckman Coulter Q4 2009 – Financial Presentation Scott Garrett Chairman, President & Chief Executive Officer Exhibit 99.2 |
 BEC
Q4 2009 Conf Call & Webcast Presentation 2/11/10 - 2 Key Observations Q4 2009 Excellent finish to a solid year: #1 Recurring Revenue (ex Olympus & cc) : Full
year 6.5% #2 Olympus: Revenue acceleration to $120M Accretive to adjusted EPS #3 Expanded Earnings and Cash Flow Adjusted EPS: $1.29 (ex Olympus intangibles amortization)
Free Cash Flow YTD: $238M #4 2010: Anticipate continued above-market growth |
 BEC
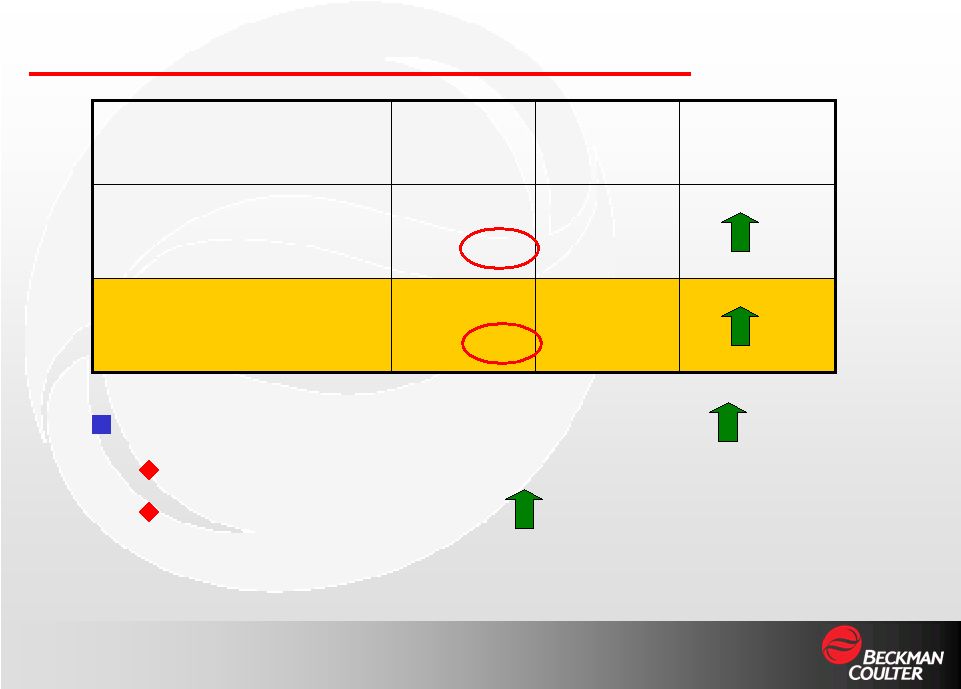
Q4 2009 Conf Call & Webcast Presentation 2/11/10 - 3 Growth in Diagnostics (ex Olympus) 6.4% (cc) Immunoassay and Hemostasis grew above market Access Immunoassay 9.5% (cc) Recurring Revenue: Q4 2009 ($ millions) $989.6 17.8% $120.2 $869.4 3.6% Total Revenue % Chg in constant currency $766.4 21.7% $102.6 $663.8 5.6% Total Recurring Revenue % Chg in constant currency Consolidated Olympus Diagnostics Beckman Coulter Product Area |
 BEC
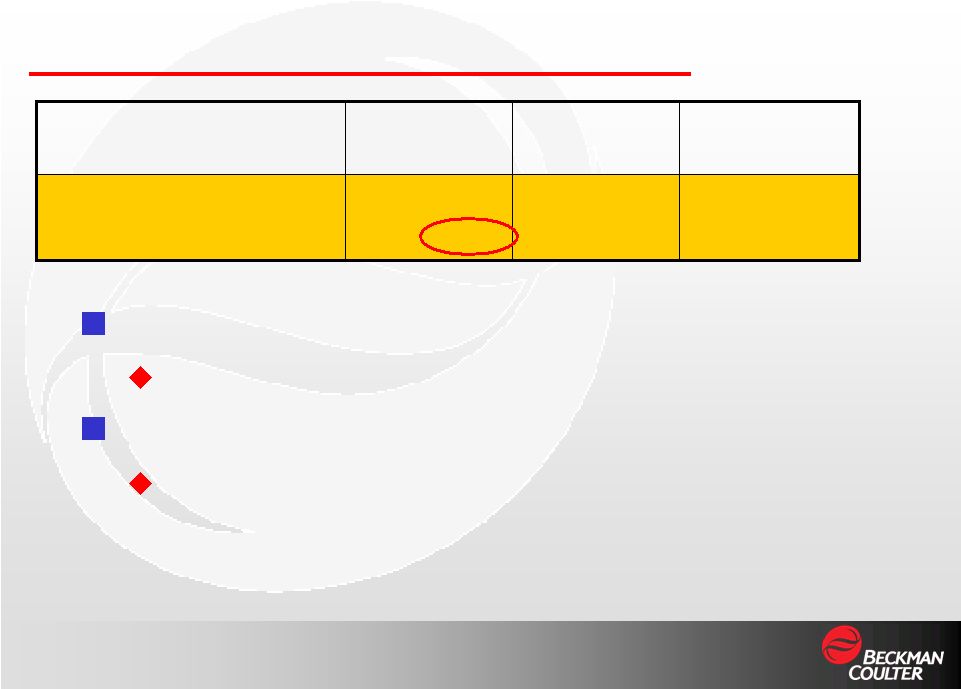
Q4 2009 Conf Call & Webcast Presentation 2/11/10 - 4 Diagnostics Customer preference for OTLs Life Science Rebound in Europe and Japan Cash Instrument Sales: Q4 2009 ($ millions) $223.2 6.0% $17.6 $205.6 (2.3%) Total Cash Instrument Sales % Chg in constant currency Consolidated Olympus Diagnostics Beckman Coulter Product Area |
 BEC
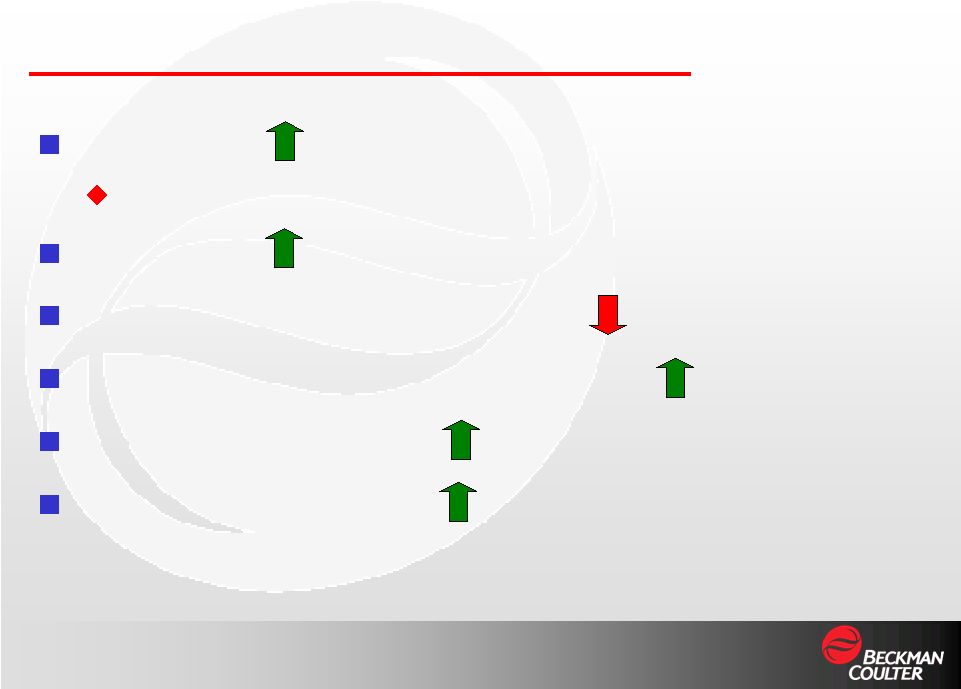
Q4 2009 Conf Call & Webcast Presentation 2/11/10 - 5 Revenue by Geography: Q4 2009 ($ millions) $445.4 9.0% $37.7 $407.7 (0.3%) United States % Chg $544.2 26.8% $82.5 $461.6 7.6% International % Chg in constant currency Consolidated Olympus Diagnostics Beckman Coulter United States: Recurring revenue up mid-single digits Diagnostics: Robust growth in Hemostasis; weakness in Clinical Automation and Flow Cytometry Life Science: Lower instrument sales International: Strong growth in China and Diagnostics recurring revenue |
 6 BEC Q4 2009 Conf Call & Webcast Presentation 2/11/10 - 6 Beckman Coulter Q4 2009 – Financial Presentation Charlie Slacik SVP & Chief Financial Officer |
 BEC
Q4 2009 Conf Call & Webcast Presentation 2/11/10 - 7 Adjusted P & L: Q4 2009 ($ millions) $132.8 $91.8 Pretax income After tax income $7.4 Amortization of intangible assets* $355.5 173.6 $529.1 Cost of Sales Cost of recurring revenue Cost of cash instrument sales TOTAL $1.29* 2.7% EPS diluted % Chg $766.4 21.7% 223.2 6.0% $989.6 17.8% $102.6 17.6 $120.2 $663.8 5.6% 205.6 (2.3%) $869.4 3.6% Revenue: Recurring revenue % Chg in constant currency Cash instrument sales % Chg in constant currency TOTAL % Chg in constant currency $155.8* 15.7% Operating Income Margin Consolidated Olympus Diagnostics Beckman Coulter *Excludes Olympus intangibles amortization of $6M.
|
 BEC
Q4 2009 Conf Call & Webcast Presentation 2/11/10 - 8 Adjusted P & L: 2009 Year ($ millions) $358.6 $263.0 Pretax income After tax income $30.0 Amortization of intangible assets* $1,223.3 512.5 $1,735.8 Cost of Sales Cost of recurring revenue Cost of cash instrument sales TOTAL $3.90* 11.1% EPS diluted % Chg $2,645.2 12.9% 615.4 (11.3%) $3,260.6 7.5% $158.5 26.8 $185.3 $2,486.7 6.5% 588.6 (15.0%) $3,075.3 1.6% Revenue: Recurring revenue % Chg in constant currency Cash instrument sales % Chg in constant currency TOTAL % Chg in constant currency $426.5* 13.1% Operating Income Margin Consolidated Olympus Diagnostics Beckman Coulter *Excludes Olympus intangibles amortization of $10M.
|
 BEC
Q4 2009 Conf Call & Webcast Presentation 2/11/10 - 9 2009 Outlook vs Actuals (Adjusted) 2009 Outlook 2009 Actuals Total revenue: Reported * Constant Currency * Flat 0% to 2% (0.8%) 1.6% Recurring rev. (cc) * 6% to
7% 6.5% Op income margin ** ~ 13% 13.1% Tax rate ~ 25% 26.7% EPS: Consolidated ** $3.77 to $3.87 $3.90 * Excludes Olympus ** Excludes Olympus intangibles amortization |
 BEC
Q4 2009 Conf Call & Webcast Presentation 2/11/10 - 10 Balance Sheet & Cash Flow Full Year 2009 CAPEX: $30M Increase in PP&E CAPEX offset by lower OTL CAPEX DSO:
3 day improvement Inventory turns (ex
Olympus): 3.4 to 3.2 (cc) Adjusted
EBITDA TTM: $739M 19% Operating cash flow: $560M Free cash
flow: $238M |
 BEC
Q4 2009 Conf Call & Webcast Presentation 2/11/10 - 11 Olympus Integration Progress to Date 2010 Anticipated synergies: $50 to $60 million Commercial integration complete Olympus Immunoassay closure Rationalized Chemistry systems development Processing business on Olympus systems / moving to Oracle Anticipated synergies offset by revenue impact: OTL transition – $30M Distribution agreements - $35M |
 BEC
Q4 2009 Conf Call & Webcast Presentation 2/11/10 - 12 2010 Outlook* Total revenue $3.8 B to $3.9 B Olympus $480 M - $500 M BEC recurring revenue 6% to 8% Op Margin ~ 13.5% Non-Op expense $88 M Tax rate 26% to 27% Share count 71.3 M Adjusted EPS ** $4.40 to $4.55 CAPEX $375 M Depreciation & Amortization $350M to $375 M * 2010 outlook is based on currency exchange rates of
$1.50 per Euro and 90 Yen per $1.00 and excludes anticipated restructuring charges associated with the Olympus acquisition and other site
consolidation costs of up to $55 million ** Excludes $0.24 of
Olympus intangibles amortization |
 BEC
Q4 2009 Conf Call & Webcast Presentation 2/11/10 - 13 Forward-Looking Statements and Non-GAAP Financial Information This presentation contains forward-looking statements within the meaning of Section
27A of the Securities Act of 1933, as amended, and Section 21E of the
Securities Exchange Act of 1934, as amended. The forward-looking
statements expectations, estimates, forecasts and projections about the company and are subject to risks and uncertainties, some of which may be beyond the
company’s control, that could cause actual results and events to differ
materially from those stated in the forward- looking statements. These
risks and uncertainties include our ability to compete effectively; legal and regulatory changes, oversight or activities, including pending health care reform;
market demand for the company’s new and existing products; intellectual
property infringement claims by others and the ability to protect the
company’s intellectual property; difficulty in obtaining materials and components for our products; consolidation of our customer base; formation of group purchasing organizations and changes in customer inventory levels and inventory management practices; reductions in government funding to our customers; foreign currency exchange fluctuations; global market, economic and
political conditions and natural disasters; costs associated with our supply
chain initiatives; tax risks and regulations; changes in the value of our investment in marketable securities; and our ability to successfully acquire and integrate acquired businesses and realize the anticipated benefits from such
acquisitions, including our acquisition of the lab-based diagnostics
business of Olympus Corporation. Additional factors that could cause
actual results to differ are discussed in Part I, Item 1A (Risk Factors) of the Company’s Form 10-K filed with the SEC on February 23, 2009 as well as in the Company’s
Form 10-Q filed since then and reports on Form 8-K.
Forward-looking statements contained in this presentation are made only
as of the date hereof, and we undertake no obligation to update these disclosures except as may be required by law. The financial information provided in this presentation uses non-GAAP financial
measures. Reconciliations of the non-GAAP financial measures to
the most directly comparable GAAP financial measures and management’s
view about the usefulness of the information to investors can be found in our fourth quarter earnings release filed with our Form 8-K dated February 11, 2010
and also is available on our website at www.beckmancoutler.com under Investor Relations “What’s Ahead.” |