Attached files
| file | filename |
|---|---|
| 8-K - 8-K - ALEXANDRIA REAL ESTATE EQUITIES, INC. | a10-3437_18k.htm |
| EX-99.1 - EX-99.1 - ALEXANDRIA REAL ESTATE EQUITIES, INC. | a10-3437_1ex99d1.htm |
Exhibit 99.2
|
|
SUPPLEMENTAL FINANCIAL,
OPERATING &
FOURTH QUARTER AND YEAR ENDED DECEMBER 31, 2009
Conference Call Information: Thursday, February 11, 2010 3:00PM Eastern Time/12:00PM Noon Pacific Time Number: (785) 830-7990 Confirmation Code: 2402872
385 EAST COLORADO BOULEVARD, SUITE 299 PASADENA, CALIFORNIA 91101 (626) 578-9693 www.labspace.com |

ALEXANDRIA REAL ESTATE EQUITIES, INC.
Table of Contents
December 31, 2009
(Unaudited)
|
|
Page |
|
Company Profile |
3 |
|
Investor Information |
4 |
|
Equity Research Coverage |
5 |
|
Fourth Quarter and Year Ended December 31, 2009 Financial and Operating Results |
6 |
|
Condensed Consolidated Income Statements |
10 |
|
Condensed Consolidated Balance Sheets |
11 |
|
Financial and Portfolio Highlights |
12 |
|
Earnings per Share |
14 |
|
Funds from Operations |
15 |
|
Adjusted Funds from Operations |
16 |
|
Debt Information |
17 |
|
Summary of Occupancy Percentage and Properties |
21 |
|
Same Property Comparisons |
22 |
|
Leasing Activity |
23 |
|
Summary of Leasing Activity/Lease Expirations |
24 |
|
20 Largest Client Tenants |
27 |
|
Client Tenant Mix |
28 |
|
Summary of Additions and Dispositions of Properties |
29 |
|
Real Estate and Value Add Activities |
30 |
|
Summary of Capital Expenditures |
38 |
|
Definitions and Other Information |
39 |
This Supplemental Financial & Property Information package includes “forward-looking statements” within the meaning of Section 27A of the Securities Act of 1933, as amended, and Section 21E of the Securities Exchange Act of 1934, as amended. You can identify the forward-looking statements by their use of forward-looking words, such as “believes,” “expects,” “may,” “will,” “should,” “seeks,” “approximately,” “intends,” “plans,” “estimates,” or “anticipates,” or the negative of those words or similar words. Our actual results may differ materially from those projected in such forward-looking statements. Factors that might cause such a difference include, without limitation, our failure to obtain capital (debt, construction financing and or equity) or refinance debt maturities, increased interest rates and operating costs, adverse economic or real estate developments in our markets, our failure to successfully complete and lease our existing space held for redevelopment and new properties acquired for that purpose and any properties undergoing development, our failure to successfully operate or lease acquired properties, decreased rental rates or increased vacancy rates or failure to renew or replace expiring leases, defaults on or non-renewal of leases by tenants, general and local economic conditions and other risks and uncertainties detailed in our filings with the Securities and Exchange Commission (“SEC”). All forward-looking statements are made as of February 11, 2010, the date this Supplemental Financial & Property Information package is first made available on our website, and we assume no obligation to update this information. For more discussion relating to risks and uncertainties that could cause actual results to differ materially from those anticipated in our forward-looking statements, and risks to our business in general, please refer to our SEC filings, including our most recent annual report on Form 10-K and any subsequent quarterly reports on Form 10-Q.
This Supplemental Financial & Property Information package is not an offer to sell or solicitation to buy securities of Alexandria Real Estate Equities, Inc. Any offers to sell or solicitations to buy securities of Alexandria Real Estate Equities, Inc. shall be made only by means of a prospectus approved for that purpose. Unless otherwise indicated, the “Company,” “we,” “us” and “our” refer to Alexandria Real Estate Equities, Inc. and its consolidated subsidiaries.
ALEXANDRIA REAL ESTATE EQUITIES, INC.
Company Profile
December 31, 2009
The Company
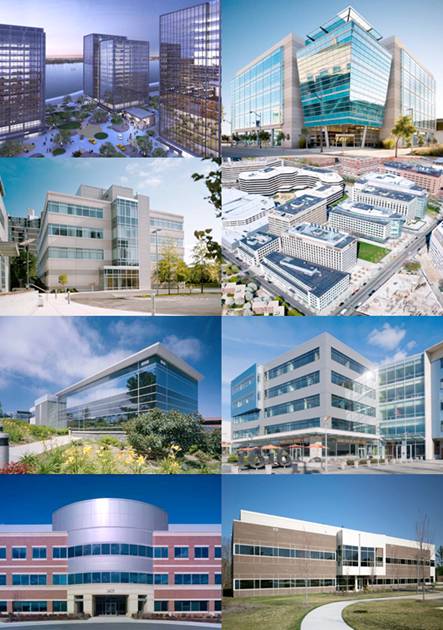
Alexandria Real Estate Equities, Inc. (the “Company” or “Alexandria”), a self-administered and self-managed real estate investment trust (“REIT”), is the largest owner and pre-eminent and first-in-class REIT focused principally on science-driven cluster formation. Our operating platform is based on the principle of “clustering” with asset and operations located in key life science markets. The Company has significant real estate assets adjacent to key life science entities which we believe results in higher occupancy levels, longer lease terms and higher rental income and returns. These locations are in the best submarkets in each of the top life science cluster destinations, including San Francisco and San Diego, California, Eastern Massachusetts, New Jersey and Suburban Philadelphia, Southeast, Suburban Washington, D.C., Seattle, Washington and international locations. Client tenants include institutional (universities and independent not-for-profit institutions), pharmaceutical, biotechnology, medical device, product, service and translational entities, as well as government agencies. The Company was founded in 1994 by Jerry M. Sudarsky and Joel S. Marcus and executed its initial public offering in 1997. Alexandria is well-known for its very well located high-quality environmentally sustainable real estate, technical infrastructure and unique expertise it provides to its broad and diverse life science industry client tenant base.
Management
Alexandria’s executive and senior management team is highly experienced in the REIT industry (with both real estate and life science experience and expertise) and is the most accomplished team focused on providing high-quality environmentally sustainable real estate, technical infrastructure and unique expertise to the broad and diverse life science industry. Our deep and talented team has decades of real estate and life science industry experience. We believe that our expertise, experience, reputation and key life science relationships provide Alexandria significant competitive advantages in attracting new business opportunities for the Company. Our management team also includes highly experienced regional market directors each averaging over 20 years of real estate experience and over 10 years with Alexandria. Our regional market directors have tremendous experience and valuable relationships that enable Alexandria to develop long-term relationships with pre-eminent life science entities.
Strategy
Alexandria’s primary business objective is to maximize shareholder value by providing its shareholders and employees with the greatest possible total return. The key elements to our strategy include our consistent focus on the top life science cluster destinations with our properties located adjacent to life science entities driving growth and technological advances within each cluster. These adjacency locations are characterized by high barriers to entry, limited supply of available space, and represent highly desirable locations for tenancy by life science entities. Alexandria’s strategy also includes leveraging on its deep and broad life science and real estate relationships in order to attract new and leading life science client tenants and value add real estate opportunities through acquisitions, redevelopment and development.
Summary
|
Corporate Headquarters |
|
Pasadena, California |
|
Markets |
|
San Diego, San Francisco Bay, Eastern Massachusetts, New Jersey/Suburban Philadelphia, New York City, Southeast, Suburban Washington, D.C., Seattle and International |
|
Fiscal Year-End |
|
December 31 |
|
Total Properties |
|
156 |
|
Total Rentable Square Feet |
|
11.8 million |
|
Total Rentable Square Feet (Including Properties Undergoing Ground-Up Development) |
|
12.7 million |
|
Common Shares Outstanding |
|
43.8 million |
|
Dividend – Quarter/Annualized |
|
$0.35/$1.40 |
|
Dividend Yield |
|
2.2% |
|
Total Market Capitalization |
|
$5.8 billion |
ALEXANDRIA REAL ESTATE EQUITIES, INC.
Investor Information
December 31, 2009
|
Executive/Senior Management |
||||||
|
|
|
|
|
|
|
|
|
Joel S. Marcus |
|
Chairman & Chief Executive Officer |
|
Peter M. Moglia |
|
Chief Investment Officer |
|
Dean A. Shigenaga |
|
Chief Financial Officer & Treasurer |
|
Thomas J. Andrews |
|
SVP-Regional Market Director-Massachusetts |
|
James H. Richardson |
|
Director and Senior Management Consultant |
|
Vincent R. Ciruzzi |
|
SVP-Construction and Development |
|
Peter J. Nelson |
|
Corporate Secretary/Senior Management Consultant |
|
John H. Cunningham |
|
SVP-Regional Market Director-NY/Strategic Operations |
|
Jennifer J. Pappas |
|
SVP-General Counsel/Assistant Secretary |
|
Stephen A. Richardson |
|
SVP-Regional Market Director-San Francisco Bay |
|
Company Information |
||||
|
|
|
|
|
|
|
Corporate Headquarters |
|
Trading Symbol |
|
Information Requests |
|
385 East Colorado Boulevard, Suite 299 |
|
ARE |
|
Phone: (626) 396-4828 |
|
Pasadena, California 91101 |
|
New York Stock Exchange |
|
E-mail: corporateinformation@labspace.com |
|
|
|
|
|
Web: www.labspace.com |
|
Common Stock Data (NYSE: ARE) |
|||||||||||||||
|
|
|
|
|
|
|
|
|
|
|
|
|||||
|
|
|
4Q 2009 |
|
3Q 2009 |
|
2Q 2009 |
|
1Q 2009 |
|
4Q 2008 |
|||||
|
High Trading Price |
|
$ |
68.24 |
|
$ |
62.49 |
|
$ |
43.76 |
|
$ |
66.69 |
|
$ |
112.72 |
|
Low Trading Price |
|
$ |
51.35 |
|
$ |
30.33 |
|
$ |
30.48 |
|
$ |
31.19 |
|
$ |
33.12 |
|
Average Closing Price |
|
$ |
57.67 |
|
$ |
46.57 |
|
$ |
36.31 |
|
$ |
48.64 |
|
$ |
61.80 |
|
Closing Price, at the end of the quarter |
|
$ |
64.29 |
|
$ |
54.35 |
|
$ |
35.79 |
|
$ |
36.40 |
|
$ |
60.34 |
|
Dividends per share – annualized |
|
$ |
1.40 |
|
$ |
1.40 |
|
$ |
1.40 |
|
$ |
3.20 |
|
$ |
3.20 |
|
Closing dividend yield – annualized |
|
2.2% |
|
2.6% |
|
3.9% |
|
8.8% |
|
5.3% |
|||||
|
Closing common shares outstanding |
|
43,846,050 |
|
43,715,900 |
|
39,040,518 |
|
38,974,166 |
|
31,899,037 |
|||||
|
Closing market value of outstanding shares (in thousands) |
|
$ |
2,818,863 |
|
$ |
2,375,959 |
|
$ |
1,397,260 |
|
$ |
1,418,660 |
|
$ |
1,924,788 |
|
Timing |
||||||
|
|
|
|
|
|
|
|
|
Quarterly results for 2010 are expected to be announced according to the following schedule: |
|
|
|
|
||
|
First Quarter |
|
Late April 2010 |
|
Third Quarter |
|
Early November 2010 |
|
Second Quarter |
|
Early August 2010 |
|
Fourth Quarter |
|
Early February 2011 |
ALEXANDRIA REAL ESTATE EQUITIES, INC.
Equity Research Coverage
December 31, 2009
|
Argus Research |
|
|
Green Street Advisors |
|
|
Morningstar |
|
|
William L. Eddleman, Jr. |
(212) 425-7500 |
|
John Stewart |
(949) 640-8780 |
|
David Rodziewicz |
(312) 244-7037 |
|
|
|
|
Michael Knott |
(949) 640-8780 |
|
|
|
|
|
|
|
|
|
|
|
|
|
Banc of America Securities-Merrill Lynch |
|
International Strategy& Investment Group Inc |
|
RW Baird |
|
||
|
James Feldman |
(212) 449-6339 |
|
Steve Sakwa |
(212) 446-9462 |
|
David AuBuchon |
(314) 863-4235 |
|
Jana Galan |
(212) 449-5151 |
|
George Auerbach |
(212) 446-9459 |
|
Justin Pelham-Webb |
(314) 863-6413 |
|
|
|
|
|
|
|
|
|
|
Barclays Capital |
|
|
JMP Securities |
|
|
Standard & Poor’s |
|
|
Ross L. Smotrich |
(212) 526-2306 |
|
William C. Marks |
(415) 835-8944 |
|
Robert McMillan |
(212) 438-9522 |
|
Jeffrey S. Langbaum |
(212) 526-0971 |
|
Susan Gutierrez |
(415) 835-3909 |
|
|
|
|
|
|
|
|
|
|
|
|
|
Citigroup Global Markets |
|
|
JP Morgan Securities |
|
|
UBS |
|
|
Michael Bilerman |
(212) 816-1383 |
|
Anthony Paolone |
(212) 622-6682 |
|
Ross Nussbaum |
(212) 713-2484 |
|
David Toti |
(212) 816-1909 |
|
Joseph Dazio |
(212) 622-6416 |
|
Robert Salisbury |
(212) 713-4760 |
|
|
|
|
|
|
|
|
|
|
|
|
|
Keefe, Bruyette & Woods |
|
|
|
|
|
|
|
|
Sheila McGrath |
(212) 887-7793 |
|
|
|
|
|
|
|
Bill Carrier |
(212) 887-3810 |
|
|
|
Alexandria Real Estate Equities, Inc. is currently covered by the equity research analysts listed above. This list may not be complete and is subject to change as firms initiate or discontinue coverage of our company. Please note that any opinions, estimates or forecasts regarding our historical or predicted performance made by these analysts are theirs alone and do not represent opinions, forecasts or predictions of Alexandria Real Estate Equities, Inc. or its management. Alexandria Real Estate Equities, Inc. does not by its reference above or distribution imply its endorsement of or concurrence with such information, conclusions or recommendations. Interested persons may obtain copies of analysts’ reports on their own as we do not distribute these reports. Several of these firms may from time-to-time own our stock and/or hold other long or short positions in our stock, and may provide compensated services to us.
ALEXANDRIA REAL ESTATE EQUITIES, INC.
Fourth Quarter and Year Ended December 31, 2009 Financial and Operating Results
|
Highlights |
||
|
|
|
|
|
Fourth Quarter 2009: |
||
|
|
|
|
|
· |
|
Fourth Quarter 2009 Funds from Operations Per Share (Diluted) Attributable to Alexandria Real Estate Equities, Inc.’s Common Stockholders of $1.09 |
|
· |
|
Fourth Quarter 2009 Earnings Per Share (Diluted) Attributable to Alexandria Real Estate Equities, Inc.’s Common Stockholders of $0.49 |
|
· |
|
Fourth Quarter 2009 GAAP Same Property Revenues Less Operating Expenses Up 1.1% |
|
· |
|
Executed 40 Leases for 489,000 Rentable Square Feet |
|
· |
|
Fourth Quarter 2009 GAAP Rental Rate Increase of 1.5% on Renewed/Released Space |
|
· |
|
Fourth Quarter 2009 Occupancy Remains Relatively Steady at 94% |
|
· |
|
Closed 10-Year Secured Loan for $120 Million |
|
· |
|
Sold One Property Aggregating 47,558 Rentable Square Feet Previously Classified as “Held For Sale” to a Life Science User |
|
· |
|
As of December 31, 2009, Three Properties Aggregating 221,638 Rentable Square Feet Under Contract, LOI or Under Negotiation and Classified as “Held for Sale” |
|
|
|
|
|
Year Ended December 31, 2009: |
||
|
|
|
|
|
· |
|
Total Return Performance of 456% from May 28, 1997 to December 31, 2009, Assuming Reinvestment of All Dividends |
|
· |
|
Positive GAAP Year-to-Year Lease Rolls for 11 Consecutive Years |
|
· |
|
Average December 31 Occupancy Percentage of 95% from December 31, 1998 to December 31, 2009 |
|
· |
|
Positive GAAP Same Property Growth Quarter-to-Quarter for 46 Consecutive Quarters |
|
· |
|
2009 Funds from Operations Per Share (Diluted) Attributable to Alexandria Real Estate Equities, Inc.’s Common Stockholders of $5.52 |
|
· |
|
2009 Earnings Per Share (Diluted) Attributable to Alexandria Real Estate Equities, Inc.’s Common Stockholders of $2.72 |
|
· |
|
Operating Margins Steady at 74% |
|
· |
|
GAAP Same Property Revenues Less Operating Expenses up 2.8% |
|
· |
|
Executed 142 Leases for 1,864,000 Rentable Square Feet |
|
· |
|
GAAP Rental Rate Increase of 3.5% on Renewed/Released Space |
|
· |
|
Entered into 15-Year Lease Aggregating 100,000 Rentable Square Feet with Eli Lilly and Company as Anchor Tenant at Alexandria CenterTM for Life Science – New York City |
|
· |
|
Leased 310,000 Rentable Square Feet of Redevelopment and Development Space |
|
· |
|
Completed Ground-Up Development of Property at Mission Bay, San Francisco Aggregating 102,000 Rentable Square Feet Pursuant to a 15-Year Lease with Pfizer Inc. |
|
· |
|
Completed Redevelopment of Multiple Spaces at 10 Properties Aggregating 227,000 Rentable Square Feet; 72% Leased |
|
· |
|
Reduced Principal Balances of Secured Notes Payable by $267 Million |
|
· |
|
Extended Maturities or Refinanced Secured Notes Payable Aggregating $159 Million |
|
· |
|
Closed 10-Year Secured Loan for $120 Million |
|
· |
|
Sold Four Properties Aggregating 111,776 Rentable Square Feet to Life Science Users |
|
· |
|
Closed Two Follow-on Common Stock Offerings with Aggregate Net Proceeds of $488 Million |
|
· |
|
Closed Private Offering of 8.00% Unsecured Convertible Notes with Net Proceeds of $233 Million |
|
· |
|
Repurchased, in Privately Negotiated Transactions, $75 Million (Par Value) of Our 3.70% Unsecured Convertible Notes |
|
|
|
|
|
Other: |
||
|
|
|
|
|
· |
|
Received LEED® Gold Certification for Building in San Diego Market in 2009 and LEED Silver Certifications for Two Buildings in San Francisco Bay Market in January 2010 |
|
· |
|
Completed Ground-Up Development of One Property in Seattle, Washington Aggregating 115,000 Rentable Square Feet Pursuant to a 10-Year Lease with Gilead Sciences Inc. in February 2010 |
ALEXANDRIA REAL ESTATE EQUITIES, INC.
Fourth Quarter and Year Ended December 31, 2009 Financial and Operating Results
Financial Results
For the fourth quarter of 2009, we reported funds from operations (“FFO”) attributable to Alexandria Real Estate Equities, Inc.’s common stockholders of $54,247,000, or $1.09 per share (diluted), compared to FFO attributable to Alexandria Real Estate Equities, Inc.’s common stockholders of $47,190,000, or $1.48 per share (diluted), for the fourth quarter of 2008. Comparing the fourth quarter of 2009 to the fourth quarter of 2008, FFO attributable to Alexandria Real Estate Equities, Inc.’s common stockholders increased 15% and FFO per share (diluted) attributable to Alexandria Real Estate Equities, Inc.’s common stockholders decreased 26%. The weighted average number of basic and diluted common stock outstanding for calculating FFO per share (diluted) attributable to Alexandria Real Estate Equities, Inc.’s common stockholders totaled 43,715,462 and 49,547,402, respectively, for the fourth quarter of 2009 and 31,757,072 and 31,810,348, respectively, for the fourth quarter of 2008. For the year ended December 31, 2009, we reported FFO attributable to Alexandria Real Estate Equities, Inc.’s common stockholders of $234,696,000, or $5.52 per share (diluted), compared to FFO attributable to Alexandria Real Estate Equities, Inc.’s common stockholders of $177,519,000, or $5.59 per share (diluted), for year ended December 31, 2008. Comparing the year ended December 31, 2009 to the year ended December 31, 2008, FFO attributable to Alexandria Real Estate Equities, Inc.’s common stockholders increased 32% and FFO per share (diluted) attributable to Alexandria Real Estate Equities, Inc.’s common stockholders decreased 1%.
FFO is a non-GAAP measure widely used by publicly traded real estate investment trusts. We compute FFO in accordance with standards established by the Board of Governors of the National Association of Real Estate Investment Trusts (“NAREIT”) in its April 2002 White Paper and related implementation guidance. A reconciliation of net income attributable to Alexandria Real Estate Equities, Inc.’s common stockholders in accordance with United States generally accepted accounting principles (“GAAP”) to FFO attributable to Alexandria Real Estate Equities, Inc.’s common stockholders is included in the financial information accompanying this press release. The primary reconciling item between GAAP net income attributable to Alexandria Real Estate Equities, Inc.’s common stockholders and FFO attributable to Alexandria Real Estate Equities, Inc.’s common stockholders is depreciation and amortization expense. Depreciation and amortization expense for the three months ended December 31, 2009 and 2008 was $29,004,000 and $28,483,000, respectively. Depreciation and amortization expense for the year ended December 31, 2009 and 2008 was $118,508,000 and $108,743,000, respectively. Net income attributable to Alexandria Real Estate Equities, Inc.’s common stockholders for the fourth quarter of 2009 was $21,650,000, or $0.49 per share (diluted), compared to net income attributable to Alexandria Real Estate Equities, Inc.’s common stockholders of $19,224,000, or $0.60 per share (diluted), for the fourth quarter of 2008. The weighted average number of basic and diluted common stock outstanding for calculating earnings per share attributable to Alexandria Real Estate Equities, Inc.’s common stockholders totaled 43,715,462 and 43,750,301, respectively, for the fourth quarter of 2009 and 31,757,072 and 31,810,348, respectively, for the fourth quarter of 2008. Net income attributable to Alexandria Real Estate Equities, Inc.’s common stockholders for the year ended December 31, 2009 was $104,974,000, or $2.72 per share (diluted), compared to net income attributable to Alexandria Real Estate Equities, Inc.’s common stockholders of $90,751,000, or $2.86 per share (diluted), for the year ended December 31, 2008.
Leasing Activity
For the year ended December 31, 2009, we executed a total of 142 leases for approximately 1,864,000 rentable square feet of space at 57 different properties (excluding month-to-month leases). Of this total, approximately 1,188,000 rentable square feet related to new or renewal leases of previously leased space and approximately 676,000 rentable square feet related to developed, redeveloped or previously vacant space. Of the 676,000 rentable square feet, approximately 310,000 rentable square feet were delivered from our development or redevelopment programs, with the remaining approximately 366,000 rentable square feet related to previously vacant space. Rental rates for these new or renewal leases were on average approximately 3.5% higher (on a GAAP basis) than rental rates for expiring leases.
For the fourth quarter of 2009, we executed a total of 40 leases for approximately 489,000 rentable square feet of space at 31 different properties (excluding month-to-month leases). Of this total, approximately 374,000 rentable square feet related to new or renewal leases of previously leased space and approximately 115,000 rentable square feet related to developed, redeveloped or previously vacant space. Of the 115,000 rentable square feet, approximately 58,000 rentable square feet were related to our development or redevelopment programs, with the remaining approximately 57,000 rentable square feet related to previously vacant space. Rental rates for these new or renewal leases were on average approximately 1.5% higher (on a GAAP basis) than rental rates for expiring leases.
ALEXANDRIA REAL ESTATE EQUITIES, INC.
Fourth Quarter and Year Ended December 31, 2009 Financial and Operating Results
Leasing Activity (continued)
As of December 31, 2009, approximately 88% of our leases (on a rentable square footage basis) were triple net leases, requiring tenants to pay substantially all real estate taxes and insurance, common area and other operating expenses, including increases thereto. In addition, approximately 8% of our leases (on a rentable square footage basis) required the tenants to pay a majority of operating expenses. Additionally, approximately 91% of our leases (on a rentable square footage basis) provided for the recapture of certain capital expenditures, and approximately 93% of our leases (on a rentable square footage basis) contained effective annual rent escalations that were either fixed or indexed based on the consumer price index or another index.
Dispositions and Properties “Held for Sale”
During the year ended December 31, 2009, we sold four properties aggregating 111,776 rentable square feet to life science users. Three of these properties were located in the San Diego market and were sold in the first quarter of 2009 for approximately $14.5 million at a gain of approximately $2.2 million. In the fourth quarter of 2009, we sold one property located in the Suburban Washington, D.C. market aggregating 47,558 rentable square feet to a life science user for approximately $6.4 million at a gain of approximately $393,000. As of December 31, 2009, three properties aggregating 221,638 rentable square feet were under contract, letter of intent or under negotiation and were classified as “held for sale.”
Other Recent Events
In October 2009, we closed a 10-year secured loan with an insurance company with a loan amount of $120 million. The loan is secured by several of our operating properties.
Earnings Outlook
Based on our current view of existing market conditions and certain current assumptions, our updated guidance for FFO per share (diluted) attributable to Alexandria Real Estate Equities, Inc.’s common stockholders and earnings per share (diluted) attributable to Alexandria Real Estate Equities, Inc.’s common stockholders is as follows:
|
|
|
2010 |
|
FFO per share (diluted) (1) |
|
$4.42 (1) |
|
Earnings per share (diluted) (1) |
|
$1.84 (1) |
|
(1) Our guidance for FFO per share (diluted) for the year ended December 31, 2010 assumes conversion of our 8% unsecured convertible notes as the impact of the conversion is expected to be dilutive under the “if-converted” method. Our guidance for earnings per share (diluted) for the year ended December 31, 2010, however, does not assume conversion of our 8% unsecured convertible notes as the impact of the conversion is expected to be anti-dilutive under the “if-converted” method. |
ALEXANDRIA REAL ESTATE EQUITIES, INC.
Fourth Quarter and Year Ended December 31, 2009 Financial and Operating Results
Client Tenant Base
Alexandria Real Estate Equities, Inc. (“Alexandria”) has a very broad and diversified quality client tenant base. As of December 31, 2009, on an annualized base rent basis by sector, Alexandria’s multinational pharmaceutical client tenants led by its top client tenants Novartis AG, Roche Holding Ltd, GlaxoSmithKline plc, Pfizer Inc., Johnson & Johnson and Merck & Co., Inc., represented approximately 28% of its client tenant base; revenue producing life science product and service companies led by Quest Diagnostics Incorporated, Qiagen N.V., Laboratory Corporation of America Holdings and Monsanto Company represented approximately 20% of its client tenant base; public biopharmaceutical companies represented approximately 17% of its client tenant base and included the three largest in the sector, Amgen Inc., Gilead Sciences, Inc., Celgene Corporation; government agencies and renowned medical and research institutions represented approximately 15% of its client tenant base and included The Scripps Research Institute, Massachusetts Institute of Technology, Fred Hutchinson Cancer Research Center, University of Washington, the Burnham Institute for Medical Research and the United States Government; private biopharmaceutical companies represented approximately 13% of its client tenant base and included high-quality, leading-edge companies with blue chip venture and institutional investors, including Achaogen, Inc., Ambrx, Inc., Intellikine, Inc., MacroGenics, Inc. and ToleRx, Inc.; the remaining approximately 7% of its client tenant base consisted of traditional office tenants. The two fastest growing client tenant sectors by revenue currently include leading institutional and multinational pharmaceutical. The unique and innovative business model which Alexandria pioneered is coupled with very strong and unique life sciences and underwriting skills with substantial experience and expertise, long-term life science industry relationships and sophisticated management with both real estate and life science operating experience and expertise, set Alexandria apart from all other publicly-traded REITs.
Earnings Call Information
We will host a conference call on Thursday, February 11, 2010 at 3:00 p.m. Eastern Time (“ET”)/12:00 p.m. noon Pacific Time (“PT”) that is open to the general public to discuss our financial and operating results for the fourth quarter and year ended December 31, 2009. To participate in this conference call, dial (785) 830-7990 and confirmation code 2402872, shortly before 3:00 p.m ET/12:00 p.m. noon PT. The audio web cast can be accessed at: www.labspace.com, in the Corporate Information section. A replay of the call will be available for a limited time from 6:00 p.m. ET/3:00 p.m. PT on Thursday, February 11, 2010. The replay number is (719) 457-0820 and the confirmation code is 2402872.
Additionally, a copy of Alexandria Real Estate Equities, Inc.’s Supplemental Financial, Operating & Property Information for the quarter ended December 31, 2009 and this press release are available in the Corporate Information section of our website at www.labspace.com.
About the Company
Alexandria Real Estate Equities, Inc., Landlord of Choice to the Life Science Industry®, is the largest owner and pre-eminent first-in-class REIT and leading provider of high-quality environmentally sustainable real estate, technical infrastructure, and services to the broad and diverse life science industry focused in the leading life science clusters. Client tenants include institutional (universities and independent not-for-profit institutions), pharmaceutical, biotechnology, medical device, product, service and translational entities, as well as government agencies. Alexandria’s operating platform is based on the principle of “clustering,” with assets and operations located in key life science markets. Our asset base approximates 12.7 million rentable square feet consisting of 156 properties approximating 11.8 million rentable square feet (including spaces undergoing active redevelopment) and properties undergoing ground-up development approximating an additional 980,000 rentable square feet. In addition, our asset base will enable us to grow to approximately 23.9 million rentable square feet through additional ground-up development approximating 11.1 million rentable square feet of office/laboratory space.
ALEXANDRIA REAL ESTATE EQUITIES, INC.
Condensed Consolidated Income Statements
(Dollars in thousands, except per share data)
(Unaudited)
|
|
|
Year Ended |
|
Three Months Ended |
|
|||||||||||||||||
|
|
|
12/31/09 |
|
12/31/08 (1) |
|
12/31/09 |
|
9/30/09 |
|
6/30/09 |
|
3/31/09 |
|
12/31/08 (1) |
|
|||||||
|
Revenues |
|
|
|
|
|
|
|
|
|
|
|
|
|
|
|
|||||||
|
Rental |
|
$ |
366,162 |
|
$ |
341,066 |
|
$ |
88,129 |
|
$ |
87,436 |
|
$ |
87,051 |
|
$ |
103,546 |
(2) |
$ |
96,173 |
(2) |
|
Tenant recoveries |
|
102,130 |
|
99,372 |
|
25,230 |
|
26,007 |
|
24,445 |
|
26,448 |
|
25,904 |
|
|||||||
|
Other income |
|
11,848 |
|
11,199 |
|
1,010 |
|
1,162 |
|
8,910 |
|
766 |
|
2,427 |
|
|||||||
|
Total revenues |
|
480,140 |
|
451,637 |
|
114,369 |
|
114,605 |
|
120,406 |
|
130,760 |
|
124,504 |
|
|||||||
|
|
|
|
|
|
|
|
|
|
|
|
|
|
|
|
|
|||||||
|
Expenses |
|
|
|
|
|
|
|
|
|
|
|
|
|
|
|
|||||||
|
Rental operations |
|
120,494 |
|
112,035 |
|
29,064 |
|
30,783 |
|
28,793 |
|
31,854 |
|
28,468 |
|
|||||||
|
General and administrative |
|
36,290 |
|
34,789 |
|
8,463 |
|
9,610 |
|
8,803 |
|
9,414 |
|
8,973 |
|
|||||||
|
Interest |
|
81,271 |
|
84,108 |
|
19,406 |
|
20,909 |
|
21,063 |
|
19,893 |
|
20,934 |
|
|||||||
|
Depreciation and amortization |
|
116,909 |
|
106,394 |
|
29,031 |
|
28,031 |
|
28,993 |
|
30,854 |
|
27,874 |
|
|||||||
|
Non-cash impairment on investments |
|
– |
|
13,251 |
|
– |
|
– |
|
– |
|
– |
|
11,266 |
|
|||||||
|
Total expenses |
|
354,964 |
|
350,577 |
|
85,964 |
|
89,333 |
|
87,652 |
|
92,015 |
|
97,515 |
|
|||||||
|
|
|
|
|
|
|
|
|
|
|
|
|
|
|
|
|
|||||||
|
Gain on early extinguishment of debt |
|
11,254 |
|
– |
|
– |
|
– |
|
11,254 |
|
– |
|
– |
|
|||||||
|
Income from continuing operations |
|
136,430 |
|
101,060 |
|
28,405 |
|
25,272 |
|
44,008 |
|
38,745 |
|
26,989 |
|
|||||||
|
Income from discontinued operations, net |
|
5,218 |
|
19,037 |
|
1,500 |
|
1,106 |
|
108 |
|
2,504 |
|
579 |
|
|||||||
|
Net income |
|
141,648 |
|
120,097 |
|
29,905 |
|
26,378 |
|
44,116 |
|
41,249 |
|
27,568 |
|
|||||||
|
|
|
|
|
|
|
|
|
|
|
|
|
|
|
|
|
|||||||
|
Net income attributable to noncontrolling interests |
|
7,047 |
|
3,799 |
|
924 |
|
886 |
|
4,362 |
|
875 |
|
971 |
|
|||||||
|
Dividends on preferred stock |
|
28,357 |
|
24,225 |
|
7,089 |
|
7,090 |
|
7,089 |
|
7,089 |
|
7,089 |
|
|||||||
|
Net income attributable to unvested restricted stock awards |
|
1,270 |
|
1,327 |
|
242 |
|
199 |
|
367 |
|
517 |
|
284 |
|
|||||||
|
Net income attributable to Alexandria Real Estate Equities, Inc.’s common stockholders |
|
$ |
104,974 |
|
$ |
90,746 |
|
$ |
21,650 |
|
$ |
18,203 |
|
$ |
32,298 |
|
$ |
32,768 |
|
$ |
19,224 |
|
|
|
|
|
|
|
|
|
|
|
|
|
|
|
|
|
|
|||||||
|
Earnings per share attributable to Alexandria Real Estate Equities, Inc.’s common stockholders – basic |
|
|
|
|
|
|
|
|
|
|
|
|
|
|
|
|||||||
|
Continuing operations |
|
$ |
2.59 |
|
$ |
2.28 |
|
$ |
0.47 |
|
$ |
0.44 |
|
$ |
0.83 |
|
$ |
0.93 |
|
$ |
0.59 |
|
|
Discontinued operations, net |
|
0.13 |
|
0.59 |
|
0.03 |
|
0.03 |
|
– |
|
0.08 |
|
0.02 |
|
|||||||
|
Earnings per share – basic |
|
$ |
2.72 |
|
$ |
2.87 |
|
$ |
0.50 |
|
$ |
0.47 |
|
$ |
0.83 |
|
$ |
1.01 |
|
$ |
0.61 |
|
|
|
|
|
|
|
|
|
|
|
|
|
|
|
|
|
|
|||||||
|
Earnings per share attributable to Alexandria Real Estate Equities, Inc.’s common stockholders – diluted |
|
|
|
|
|
|
|
|
|
|
|
|
|
|
|
|||||||
|
Continuing operations |
|
$ |
2.59 |
|
$ |
2.27 |
|
$ |
0.46 |
|
$ |
0.44 |
|
$ |
0.82 |
|
$ |
0.93 |
|
$ |
0.58 |
|
|
Discontinued operations, net |
|
0.13 |
|
0.59 |
|
0.03 |
|
0.03 |
|
– |
|
0.08 |
|
0.02 |
|
|||||||
|
Earnings per share – diluted |
|
$ |
2.72 |
|
$ |
2.86 |
|
$ |
0.49 |
|
$ |
0.47 |
|
$ |
0.82 |
|
$ |
1.01 |
|
$ |
0.60 |
|
|
(1) |
Historical results related to assets classified as “held for sale” as of December 31, 2009 have been reclassified from continuing operations to income from discontinued operations, net. Also includes the retrospective impact of new accounting provisions adopted on January 1, 2009 related to accounting for and disclosure of convertible debt, noncontrolling interests and participating securities. |
|
(2) |
In December 2008, the Company entered into a modification of a lease in South San Francisco resulting in the recognition of additional rental income approximating $11.3 million and $18.5 million in the fourth quarter of 2008 and the first quarter of 2009, respectively. |
ALEXANDRIA REAL ESTATE EQUITIES, INC.
Condensed Consolidated Balance Sheets
(In thousands)
(Unaudited)
|
|
|
December 31, |
|
September 30, |
|
June 30, |
|
March 31, |
|
December 31, |
|
|||||
|
|
|
2009 |
|
2009 |
|
2009 |
|
2009 |
|
2008 (1) |
|
|||||
|
Assets |
|
|
|
|
|
|
|
|
|
|
|
|||||
|
Rental properties, net |
|
$ |
3,383,308 |
|
$ |
3,366,960 |
|
$ |
3,243,268 |
|
$ |
3,230,710 |
|
$ |
3,215,723 |
|
|
Land held for future development |
|
255,025 |
|
254,549 |
|
240,411 |
|
109,561 |
|
109,478 |
|
|||||
|
Construction in progress |
|
1,400,795 |
|
1,349,656 |
|
1,406,451 |
|
1,452,434 |
|
1,398,895 |
|
|||||
|
Cash and cash equivalents |
|
70,628 |
|
68,280 |
|
70,313 |
|
125,281 |
|
71,161 |
|
|||||
|
Tenant security deposits and other restricted cash |
|
47,291 |
|
60,002 |
|
51,683 |
|
54,770 |
|
67,782 |
|
|||||
|
Tenant receivables |
|
3,902 |
|
3,789 |
|
4,665 |
|
5,992 |
|
6,453 |
|
|||||
|
Deferred rent |
|
96,700 |
|
92,022 |
|
87,697 |
|
85,970 |
|
85,733 |
|
|||||
|
Investments |
|
72,882 |
|
71,080 |
|
66,068 |
|
64,788 |
|
61,861 |
|
|||||
|
Other assets |
|
126,696 |
|
126,999 |
|
116,097 |
|
112,669 |
|
114,991 |
|
|||||
|
Total assets |
|
$ |
5,457,227 |
|
$ |
5,393,337 |
|
$ |
5,286,653 |
|
$ |
5,242,175 |
|
$ |
5,132,077 |
|
|
|
|
|
|
|
|
|
|
|
|
|
|
|||||
|
Liabilities and Equity |
|
|
|
|
|
|
|
|
|
|
|
|||||
|
Secured notes payable |
|
$ |
937,017 |
|
$ |
837,177 |
|
$ |
941,600 |
|
$ |
1,041,854 |
|
$ |
1,081,963 |
|
|
Unsecured line of credit and unsecured term loan |
|
1,226,000 |
|
1,248,000 |
|
1,307,000 |
|
1,355,000 |
|
1,425,000 |
|
|||||
|
Unsecured convertible notes |
|
583,929 |
|
580,919 |
|
577,984 |
|
433,408 |
|
431,145 |
|
|||||
|
Accounts payable, accrued expenses and tenant security deposits |
|
282,516 |
|
325,720 |
|
312,313 |
|
331,715 |
|
386,801 |
|
|||||
|
Dividends payable |
|
21,686 |
|
21,665 |
|
20,005 |
|
37,701 |
|
32,105 |
|
|||||
|
Total liabilities |
|
3,051,148 |
|
3,013,481 |
|
3,158,902 |
|
3,199,678 |
|
3,357,014 |
|
|||||
|
|
|
|
|
|
|
|
|
|
|
|
|
|||||
|
Redeemable noncontrolling interests |
|
41,441 |
|
41,232 |
|
41,012 |
|
32,887 |
|
33,963 |
|
|||||
|
|
|
|
|
|
|
|
|
|
|
|
|
|||||
|
Alexandria Real Estate Equities, Inc. stockholders’ equity: |
|
|
|
|
|
|
|
|
|
|
|
|||||
|
Series C preferred stock |
|
129,638 |
|
129,638 |
|
129,638 |
|
129,638 |
|
129,638 |
|
|||||
|
Series D cumulative convertible preferred stock |
|
250,000 |
|
250,000 |
|
250,000 |
|
250,000 |
|
250,000 |
|
|||||
|
Common stock |
|
438 |
|
437 |
|
390 |
|
390 |
|
319 |
|
|||||
|
Additional paid-in capital |
|
1,977,062 |
|
1,961,421 |
|
1,718,737 |
|
1,668,546 |
|
1,407,294 |
|
|||||
|
Accumulated other comprehensive loss |
|
(33,730 |
) |
(44,162 |
) |
(53,013 |
) |
(79,868 |
) |
(87,241 |
) |
|||||
|
Total Alexandria Real Estate Equities, Inc. stockholders’ equity |
|
2,323,408 |
|
2,297,334 |
|
2,045,752 |
|
1,968,706 |
|
1,700,010 |
|
|||||
|
Noncontrolling interests |
|
41,230 |
|
41,290 |
|
40,987 |
|
40,904 |
|
41,090 |
|
|||||
|
Total equity |
|
2,364,638 |
|
2,338,624 |
|
2,086,739 |
|
2,009,610 |
|
1,741,100 |
|
|||||
|
Total |
|
$ |
5,457,227 |
|
$ |
5,393,337 |
|
$ |
5,286,653 |
|
$ |
5,242,175 |
|
$ |
5,132,077 |
|
(1) Includes the retrospective impact of new accounting provisions adopted on January 1, 2009 related to accounting for and disclosure of convertible debt, noncontrolling interests and participating securities.
ALEXANDRIA REAL ESTATE EQUITIES, INC.
Financial and Portfolio Highlights
(In thousands, except share, per share, per square feet and property data)
(Unaudited)
|
|
|
For the Three Months Ended or As Of |
|
|||||||||||||
|
|
|
12/31/09 |
|
9/30/09 |
|
6/30/09 |
|
3/31/09 |
|
12/31/08 |
|
|||||
|
Balance Sheet Data |
|
|
|
|
|
|
|
|
|
|
|
|||||
|
Rental properties, net |
|
$ |
3,383,308 |
|
$ |
3,366,960 |
|
$ |
3,243,268 |
|
$ |
3,230,710 |
|
$ |
3,215,723 |
|
|
Land held for future development |
|
255,025 |
|
254,549 |
|
240,411 |
|
109,561 |
|
109,478 |
|
|||||
|
Construction in progress |
|
1,400,795 |
|
1,349,656 |
|
1,406,451 |
|
1,452,434 |
|
1,398,895 |
|
|||||
|
Gross book value of real estate |
|
5,559,775 |
|
5,471,930 |
|
5,367,100 |
|
5,245,244 |
|
5,152,786 |
|
|||||
|
Tangible non-real estate assets |
|
227,440 |
|
239,076 |
|
224,016 |
|
283,306 |
|
241,030 |
|
|||||
|
Total assets |
|
5,457,227 |
|
5,393,337 |
|
5,286,653 |
|
5,242,175 |
|
5,132,077 |
|
|||||
|
Total debt |
|
2,746,946 |
|
2,666,096 |
|
2,826,584 |
|
2,830,262 |
|
2,938,108 |
|
|||||
|
Total liabilities |
|
3,051,148 |
|
3,013,481 |
|
3,158,902 |
|
3,199,678 |
|
3,357,014 |
|
|||||
|
Total market capitalization |
|
5,812,641 |
|
5,276,336 |
|
4,441,806 |
|
4,394,465 |
|
5,050,910 |
|
|||||
|
|
|
|
|
|
|
|
|
|
|
|
|
|||||
|
Operating Data |
|
|
|
|
|
|
|
|
|
|
|
|||||
|
Total revenue |
|
$ |
114,369 |
|
$ |
114,605 |
|
$ |
120,406 |
|
$ |
130,760 |
|
$ |
124,504 |
|
|
Deferred rent |
|
7,064 |
|
3,106 |
|
2,700 |
|
1,509 |
|
2,547 |
|
|||||
|
Amortization of acquired above and below market leases |
|
1,457 |
|
1,510 |
|
1,736 |
|
4,745 |
|
4,066 |
|
|||||
|
Adoption of new accounting provisions related to convertible notes |
|
727 |
|
798 |
|
1,093 |
|
930 |
|
1,563 |
|
|||||
|
Net income attributable to Alexandria Real Estate Equities, Inc.’s common stockholders |
|
21,650 |
|
18,203 |
|
32,298 |
|
32,768 |
|
19,224 |
|
|||||
|
Earnings per share – diluted |
|
0.49 |
|
0.47 |
|
0.82 |
|
1.01 |
|
0.60 |
|
|||||
|
FFO attributable to Alexandria Real Estate, Inc.’s common stockholders – diluted |
|
54,247 |
|
50,609 |
|
68,401 |
|
61,329 |
|
47,190 |
|
|||||
|
FFO per share – diluted |
|
1.09 |
|
1.13 |
|
1.59 |
|
1.89 |
|
1.48 |
|
|||||
|
|
|
|
|
|
|
|
|
|
|
|
|
|||||
|
Common Shares Data |
|
|
|
|
|
|
|
|
|
|
|
|||||
|
Common shares outstanding |
|
43,846,050 |
|
43,715,900 |
|
39,040,518 |
|
38,974,166 |
|
31,899,037 |
|
|||||
|
Weighted average common shares outstanding – EPS – diluted |
|
43,750,301 |
|
39,105,950 |
|
43,071,925 |
|
32,498,107 |
|
31,810,348 |
|
|||||
|
Weighted average common shares outstanding – FFO – diluted |
|
49,547,402 |
|
44,903,051 |
|
43,071,925 |
|
32,498,107 |
|
31,810,348 |
|
|||||
|
|
|
|
|
|
|
|
|
|
|
|
|
|||||
|
Financial Ratios |
|
|
|
|
|
|
|
|
|
|
|
|||||
|
Unencumbered net operating income as a percentage of total net operating income |
|
55.4% |
|
60.2% |
|
60.8% |
|
63.5% |
|
61.9% |
|
|||||
|
Operating margin |
|
74% |
|
73% |
|
74% |
|
75% |
|
77% |
|
|||||
|
General and administrative expense as a percentage of total revenues |
|
7.4% |
|
8.4% |
|
7.3% |
|
7.2% |
|
7.2% |
|
|||||
|
EBITDA – trailing 12 months |
|
$ |
342,429 |
|
$ |
341,639 |
|
$ |
342,624 |
|
$ |
321,518 |
|
$ |
315,388 |
|
|
Adjusted EBITDA – trailing 12 months |
|
$ |
342,599 |
|
$ |
353,831 |
|
$ |
354,198 |
|
$ |
343,525 |
|
$ |
326,565 |
|
|
Capitalized interest |
|
$ |
18,976 |
|
$ |
17,933 |
|
$ |
18,240 |
|
$ |
16,919 |
|
$ |
19,764 |
|
|
Weighted average interest rate used for capitalization |
|
5.42% |
|
5.16% |
|
5.23% |
|
4.89% |
|
5.52% |
|
|||||
|
Dividends per share on common stock |
|
$ |
0.35 |
|
$ |
0.35 |
|
$ |
0.35 |
|
$ |
0.80 |
|
$ |
0.80 |
|
|
Dividend payout ratio (common stock) |
|
28.5% |
|
30.5% |
|
20.2% |
|
51.4% |
|
54.8% |
|
|||||
|
Debt to gross assets (excluding cash) |
|
45.1% |
|
44.3% |
|
48.1% |
|
48.2% |
|
51.8% |
|
|||||
|
Debt to Adjusted EBITDA – trailing 12 months |
|
7.7 |
|
7.3 |
|
7.7 |
|
7.8 |
|
8.6 |
|
|||||
|
|
|
|
|
|
|
|
|
|
|
|
|
|||||
|
Portfolio Statistics |
|
|
|
|
|
|
|
|
|
|
|
|||||
|
Number of properties |
|
156 |
|
157 |
|
156 |
|
156 |
|
159 |
|
|||||
|
Rentable square feet |
|
11,759,643 |
|
11,807,201 |
|
11,704,918 |
|
11,704,918 |
|
11,769,136 |
|
|||||
|
Occupancy (excluding redevelopment and properties “held for sale”) |
|
94.1% |
|
94.4% |
|
94.5% |
|
94.3% |
|
94.8% |
|
|||||
|
Occupancy (including redevelopment properties) |
|
89.4% |
|
89.1% |
|
89.4% |
|
89.6% |
|
90.0% |
|
|||||
|
Leasing activity – YTD rentable square feet |
|
1,864,347 |
|
1,349,098 |
|
935,580 |
|
464,603 |
|
2,161,144 |
|
|||||
|
Leasing activity – Qtr rentable square feet |
|
489,079 |
|
449,515 |
|
472,822 |
|
464,603 |
|
513,134 |
|
|||||
|
Leasing activity – YTD GAAP rental rate increase |
|
3.5% |
|
4.9% |
|
4.0% |
|
5.4% |
|
15.0% |
|
|||||
|
Leasing activity – Qtr GAAP rental rate increase |
|
1.5% |
|
5.6% |
|
3.3% |
|
5.4% |
|
13.9% |
|
|||||
|
Same property YTD revenue less operating expenses – GAAP basis |
|
2.8% |
|
3.7% |
|
4.0% |
|
3.6% |
|
3.3% |
|
|||||
|
Same property Qtr revenue less operating expenses – GAAP basis |
|
1.1% |
|
0.8% |
|
2.2% |
|
3.6% |
|
4.3% |
|
|||||
See “Definitions and Other Information” section of this report starting on page 39.
ALEXANDRIA REAL ESTATE EQUITIES, INC.
Financial and Portfolio Highlights (continued)
(Unaudited)
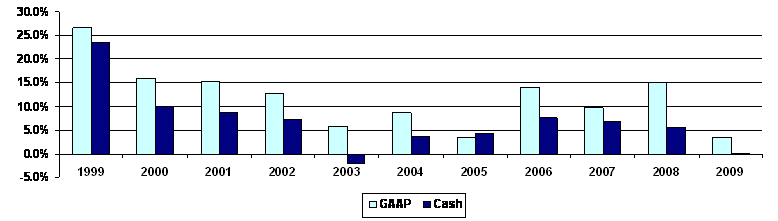
Summary of Occupancy Percentage
|
|
|
|
|
December 31, |
|
||||||||||||||||||||||
|
|
|
Average |
|
1998 |
|
1999 |
|
2000 |
|
2001 |
|
2002 |
|
2003 |
|
2004 |
|
2005 |
|
2006 |
|
2007 |
|
2008 |
|
2009 |
|
|
Occupancy (excluding redevelopment and properties “held for sale”) |
|
95.3% |
|
96.2% |
|
95.7% |
|
98.4% |
|
99.0% |
|
96.3% |
|
93.9% |
|
95.2% |
|
93.2% |
|
93.1% |
|
93.8% |
|
94.8% |
|
94.1% |
|
|
Occupancy (including redevelopment properties) |
|
89.3% |
|
92.9% |
|
91.5% |
|
90.8% |
|
88.6% |
|
89.2% |
|
88.4% |
|
87.0% |
|
87.7% |
|
88.0% |
|
87.8% |
|
90.0% |
|
89.4% |
|
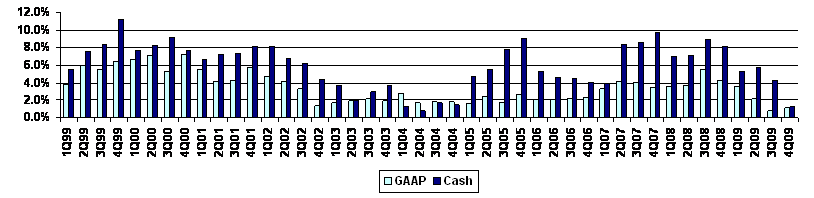
Quarterly Percentage Change in GAAP and Cash Same Property Revenues Less Operating Expenses
Summary of GAAP and Cash Rental Rate Increases on Renewed/Released Space
ALEXANDRIA REAL ESTATE EQUITIES, INC.
Earnings per Share
(Dollars in thousands, except per share data)
(Unaudited)
Earnings per Share
|
|
|
Year Ended |
|
Three Months Ended |
|
|||||||||||||||||
|
|
|
12/31/09 |
|
12/31/08 (1) |
|
12/31/09 |
|
9/30/09 |
|
6/30/09 |
|
3/31/09 |
|
12/31/2008 (1) |
|
|||||||
|
Net income attributable to Alexandria Real Estate Equities, Inc.’s common stockholders – numerator for basic earnings per share |
|
$ |
104,974 |
|
$ |
90,746 |
|
$ |
21,650 |
|
$ |
18,203 |
|
$ |
32,298 |
|
$ |
32,768 |
|
$ |
19,224 |
|
|
Assumed conversion of 8% unsecured convertible notes |
|
– |
|
– |
|
– |
|
– |
|
3,197 |
|
– |
|
– |
|
|||||||
|
Effect of dilutive securities and assumed conversion attributable to unvested restricted stock awards |
|
– |
|
5 |
|
– |
|
– |
|
3 |
|
1 |
|
– |
|
|||||||
|
Net income attributable to Alexandria Real Estate Equities, Inc.’s common stockholders assuming effect of dilutive securities and assumed conversion – numerator for diluted earnings per share |
|
$ |
104,974 |
|
$ |
90,751 |
|
$ |
21,650 |
|
$ |
18,203 |
|
$ |
35,498 |
|
$ |
32,769 |
|
$ |
19,224 |
|
|
|
|
|
|
|
|
|
|
|
|
|
|
|
|
|
|
|||||||
|
Weighted average shares of common stock outstanding for calculating earnings per share attributable to Alexandria Real Estate Equities, Inc.’s common stockholders – denominator for basic earnings per share |
|
38,586,909 |
|
31,653,829 |
|
43,715,462 |
|
39,094,018 |
|
38,929,971 |
|
32,478,671 |
|
31,757,072 |
|
|||||||
|
Effect of dilutive securities and assumed conversion: |
|
|
|
|
|
|
|
|
|
|
|
|
|
|
|
|||||||
|
Dilutive effect of stock options |
|
13,160 |
|
111,226 |
|
34,839 |
|
11,932 |
|
1,167 |
|
19,436 |
|
53,276 |
|
|||||||
|
Assumed conversion of 8% unsecured convertible notes |
|
– |
|
– |
|
– |
|
– |
|
4,140,787 |
|
– |
|
– |
|
|||||||
|
Weighted average shares of common stock outstanding for calculating earnings per share attributable to Alexandria Real Estate Equities, Inc.’s common stockholders assuming effect of dilutive securities and assumed conversion – denominator for diluted earnings per share |
|
38,600,069 |
|
31,765,055 |
|
43,750,301 |
|
39,105,950 |
|
43,071,925 |
|
32,498,107 |
|
31,810,348 |
|
|||||||
|
|
|
|
|
|
|
|
|
|
|
|
|
|
|
|
|
|||||||
|
Earnings per share attributable to Alexandria Real Estate Equities, Inc.’s common stockholders |
|
|
|
|
|
|
|
|
|
|
|
|
|
|
|
|||||||
|
Basic |
|
$ |
2.72 |
|
$ |
2.87 |
|
$ |
0.50 |
|
$ |
0.47 |
|
$ |
0.83 |
|
$ |
1.01 |
|
$ |
0.61 |
|
|
Diluted |
|
$ |
2.72 |
|
$ |
2.86 |
|
$ |
0.49 |
|
$ |
0.47 |
|
$ |
0.82 |
|
$ |
1.01 |
|
$ |
0.60 |
|
(1) Includes the retrospective impact of new accounting provisions adopted on January 1, 2009 related to accounting for and disclosure of convertible debt, noncontrolling interests and participating securities.
See “Definitions and Other Information” section of this report starting on page 39.
ALEXANDRIA REAL ESTATE EQUITIES, INC.
Funds from Operations
(Dollars in thousands, except per share data)
(Unaudited)
Funds from Operations (“FFO”)
The following table presents a reconciliation of net income attributable to Alexandria Real Estate Equities, Inc.’s common stockholders, the most directly comparable financial measure calculated and presented in accordance with United States generally accepted accounting principles (“GAAP”), to FFO attributable to Alexandria Real Estate Equities, Inc.’s common stockholders for year and three month periods noted below:
|
|
|
Year Ended |
|
Three Months Ended |
|
|||||||||||||||||
|
|
|
12/31/09 |
|
12/31/08 (1) |
|
12/31/09 |
|
9/30/09 |
|
6/30/09 |
|
3/31/09 |
|
12/31/08 (1) |
|
|||||||
|
Net income attributable to Alexandria Real Estate Equities, Inc.’s common stockholders |
|
$ |
104,974 |
|
$ |
90,746 |
|
$ |
21,650 |
|
$ |
18,203 |
|
$ |
32,298 |
|
$ |
32,768 |
|
$ |
19,224 |
|
|
Add: Depreciation and amortization (2) |
|
118,508 |
|
108,743 |
|
29,004 |
|
28,336 |
|
29,722 |
|
31,446 |
|
28,483 |
|
|||||||
|
Add: Net income attributable to noncontrolling interests |
|
7,047 |
|
3,799 |
|
924 |
|
886 |
|
4,362 |
|
875 |
|
971 |
|
|||||||
|
Add: Net income attributable to unvested restricted stock awards |
|
1,270 |
|
1,327 |
|
242 |
|
199 |
|
367 |
|
517 |
|
284 |
|
|||||||
|
Subtract: Gain on sales of property |
|
(2,627 |
) |
(20,401 |
) |
(393 |
) |
– |
|
– |
|
(2,234 |
) |
(6 |
) |
|||||||
|
Subtract: FFO attributable to noncontrolling interests |
|
(3,843 |
) |
(4,108 |
) |
(1,006 |
) |
(918 |
) |
(842 |
) |
(1,077 |
) |
(1,069 |
) |
|||||||
|
Subtract: FFO attributable to unvested restricted stock awards |
|
(2,694 |
) |
(2,596 |
) |
(558 |
) |
(505 |
) |
(740 |
) |
(966 |
) |
(698 |
) |
|||||||
|
FFO attributable to Alexandria Real Estate Equities, Inc.’s common stockholders – numerator for basic FFO per share |
|
222,635 |
|
177,510 |
|
49,863 |
|
46,201 |
|
65,167 |
|
61,329 |
|
47,189 |
|
|||||||
|
Add: Assumed conversion of 8% unsecured convertible notes |
|
11,943 |
|
– |
|
4,362 |
|
4,384 |
|
3,197 |
|
– |
|
– |
|
|||||||
|
Add: Effect of dilutive securities and assumed conversion attributable to unvested restricted stock awards |
|
118 |
|
9 |
|
22 |
|
24 |
|
37 |
|
– |
|
1 |
|
|||||||
|
FFO attributable to Alexandria Real Estate Equities, Inc.’s common stockholders assuming effect of dilutive securities and assumed conversion – numerator for diluted FFO per share |
|
$ |
234,696 |
|
$ |
177,519 |
|
$ |
54,247 |
|
$ |
50,609 |
|
$ |
68,401 |
|
$ |
61,329 |
|
$ |
47,190 |
|
|
|
|
|
|
|
|
|
|
|
|
|
|
|
|
|
|
|||||||
|
Weighted average shares of common stock outstanding for calculating FFO per share attributable to Alexandria Real Estate Equities, Inc.’s common stockholders – denominator for basic FFO per share |
|
38,586,909 |
|
31,653,829 |
|
43,715,462 |
|
39,094,018 |
|
38,929,971 |
|
32,478,671 |
|
31,757,072 |
|
|||||||
|
Effect of dilutive securities and assumed conversion: |
|
|
|
|
|
|
|
|
|
|
|
|
|
|
|
|||||||
|
Dilutive effect of stock options |
|
13,160 |
|
111,226 |
|
34,839 |
|
11,932 |
|
1,167 |
|
19,436 |
|
53,276 |
|
|||||||
|
Assumed conversion of 8% unsecured convertible notes |
|
3,954,735 |
|
– |
|
5,797,101 |
|
5,797,101 |
|
4,140,787 |
|
– |
|
– |
|
|||||||
|
Weighted average shares of common stock outstanding for calculating FFO per share attributable to Alexandria Real Estate Equities, Inc.’s common stockholders assuming effect of dilutive securities and assumed conversion – denominator for diluted FFO per share |
|
42,554,804 |
|
31,765,055 |
|
49,547,402 |
|
44,903,051 |
|
43,071,925 |
|
32,498,107 |
|
31,810,348 |
|
|||||||
|
|
|
|
|
|
|
|
|
|
|
|
|
|
|
|
|
|||||||
|
FFO per share attributable to Alexandria Real Estate Equities, Inc.’s common stockholders |
|
|
|
|
|
|
|
|
|
|
|
|
|
|
|
|||||||
|
Basic |
|
$ |
5.77 |
|
$ |
5.61 |
|
$ |
1.14 |
|
$ |
1.18 |
|
$ |
1.67 |
|
$ |
1.89 |
|
$ |
1.49 |
|
|
Diluted |
|
$ |
5.52 |
|
$ |
5.59 |
|
$ |
1.09 |
|
$ |
1.13 |
|
$ |
1.59 |
|
$ |
1.89 |
|
$ |
1.48 |
|
(1) Includes the retrospective impact of new accounting provisions adopted on January 1, 2009 related to accounting for and disclosure of convertible debt, noncontrolling interests and participating securities.
(2) Includes depreciation and amortization for assets “held for sale” reflected as discontinued operations (for the periods prior to when such assets were designated as “held for sale”).
See “Definitions and Other Information” section of this report starting on page 39.
ALEXANDRIA
REAL ESTATE EQUITIES, INC.
Adjusted
Funds from Operations
(Dollars in thousands)
(Unaudited)
Adjusted Funds from Operations
The following table presents a reconciliation of FFO attributable to Alexandria Real Estate Equities, Inc.’s common stockholders to adjusted funds from operations (“AFFO”) attributable to Alexandria Real Estate Equities, Inc.’s common stockholders:
|
|
|
Year Ended |
|
For the Three Months Ended |
|
|||||||||||||||||
|
|
|
12/31/2009 |
|
12/31/2008 |
|
12/31/2009 |
|
9/30/2009 |
|
6/30/2009 (1) |
|
3/31/2009 (2) |
|
12/31/2008 (2) |
|
|||||||
|
FFO attributable to Alexandria Real Estate Equities, Inc.’s common stockholders |
|
$ |
222,635 |
|
$ |
177,510 |
|
$ |
49,863 |
|
$ |
46,201 |
|
$ |
65,167 |
|
$ |
61,329 |
|
$ |
47,189 |
|
|
Add/(deduct): |
|
|
|
|
|
|
|
|
|
|
|
|
|
|
|
|||||||
|
Capital expenditures |
|
(1,934 |
) |
(1,360 |
) |
(607 |
) |
(565 |
) |
(270 |
) |
(492 |
) |
(202 |
) |
|||||||
|
Second generation tenant improvements and leasing costs |
|
(4,738 |
) |
(5,845 |
) |
(2,334 |
) |
(819 |
) |
(894 |
) |
(691 |
) |
(1,931 |
) |
|||||||
|
Amortization of loan fees |
|
7,958 |
|
6,774 |
|
2,081 |
|
2,061 |
|
2,023 |
|
1,793 |
|
1,710 |
|
|||||||
|
Amortization of debt premiums/discounts |
|
10,788 |
|
7,973 |
|
2,998 |
|
2,923 |
|
2,605 |
|
2,262 |
|
2,106 |
|
|||||||
|
Amortization of acquired above and below market leases |
|
(9,448 |
) |
(9,509 |
) |
(1,457 |
) |
(1,510 |
) |
(1,736 |
) |
(4,745 |
) |
(4,066 |
) |
|||||||
|
Deferred rent |
|
(14,379 |
) |
(12,273 |
) |
(7,064 |
) |
(3,106 |
) |
(2,700 |
) |
(1,509 |
) |
(2,547 |
) |
|||||||
|
Stock compensation |
|
14,051 |
|
13,677 |
|
3,194 |
|
4,141 |
|
3,694 |
|
3,022 |
|
3,563 |
|
|||||||
|
Capitalized income from development projects |
|
6,498 |
|
7,238 |
|
1,660 |
|
1,545 |
|
1,631 |
|
1,662 |
|
1,659 |
|
|||||||
|
Deferred rent on ground leases |
|
5,566 |
|
5,201 |
|
1,400 |
|
1,564 |
|
1,478 |
|
1,124 |
|
1,103 |
|
|||||||
|
Impairment charges |
|
– |
|
17,901 |
|
– |
|
– |
|
– |
|
– |
|
11,266 |
|
|||||||
|
Gain on early extinguishment of debt |
|
(11,254 |
) |
– |
|
– |
|
– |
|
(11,254 |
) |
– |
|
– |
|
|||||||
|
Allocation to unvested restricted stock awards |
|
(37 |
) |
(428 |
) |
1 |
|
(67 |
) |
61 |
|
(38 |
) |
(184 |
) |
|||||||
|
AFFO attributable to Alexandria Real Estate Equities, Inc.’s common stockholders |
|
$ |
225,706 |
|
$ |
206,859 |
|
$ |
49,735 |
|
$ |
52,368 |
|
$ |
59,805 |
|
$ |
63,717 |
|
$ |
59,666 |
|
|
|
|
|
|
|
|
|
|
|
|
|
|
|
|
|
|
|||||||
|
Weighted average shares of common stock outstanding for calculating earnings per share attributable to Alexandria Real Estate Equities, Inc.’s common stockholders assuming effect of dilutive securities and assumed conversion – denominator for diluted earnings per share |
|
38,600,069 |
|
31,765,055 |
|
43,750,301 |
|
39,105,950 |
|
43,071,925 |
|
32,498,107 |
|
31,810,348 |
|
|||||||
|
Less: Assumed conversion of 8% unsecured convertible notes |
|
– |
|
– |
|
– |
|
– |
|
4,140,787 |
|
– |
|
– |
|
|||||||
|
|
|
38,600,069 |
|
31,765,055 |
|
43,750,301 |
|
39,105,950 |
|
38,931,138 |
|
32,498,107 |
|
31,810,348 |
|
|||||||
(1) During the second quarter of 2009, we recognized additional income approximating $7.2 million for a cash payment received related to real estate acquired in November 2007.
(2) In December 2008, we entered into a modification of a lease in South San Francisco resulting in the recognition of additional rental income approximating $11.3 million and $18.5 million in the fourth quarter of 2008 and the first quarter of 2009, respectively.
See “Definitions and Other Information” section of this report starting on page 38.
ALEXANDRIA
REAL ESTATE EQUITIES, INC.
Summary of Debt
December 31, 2009
(Dollars in thousands)
(Unaudited)
Debt Maturities/Rates
|
|
|
Secured Debt |
|
Unsecured Debt |
|
||||||||||||
|
|
|
|
|
Noncontrolling |
|
|
|
|
|
|
|
||||||
|
|
|
|
|
Interests’ |
|
|
|
|
|
Unsecured |
|
||||||
|
|
Year |
|
Our Share |
|
Share |
|
Total |
|
Credit Facility |
|
Convertible Notes |
|
|||||
|
|
2010 |
|
$ |
35,713 |
|
$ |
269 |
|
$ |
35,982 |
|
$ |
– |
|
$ |
– |
|
|
|
2011 |
|
134,790 |
|
284 |
|
135,074 |
|
476,000 |
(1) |
– |
|
|||||
|
|
2012 |
|
40,817 |
|
300 |
|
41,117 |
|
750,000 |
(1) |
368,027 |
|
|||||
|
|
2013 |
|
73,527 |
|
17,617 |
|
91,144 |
|
– |
|
– |
|
|||||
|
|
2014 |
|
196,106 |
|
20,846 |
|
216,952 |
|
– |
|
215,902 |
|
|||||
|
|
Thereafter |
|
416,748 |
|
– |
|
416,748 |
|
– |
|
– |
|
|||||
|
|
Total |
|
$ |
897,701 |
|
$ |
39,316 |
|
$ |
937,017 |
(2) |
$ |
1,226,000 |
|
$ |
583,929 |
(3) |
Secured and Unsecured Debt Analysis
|
|
|
Balance |
|
Percentage |
|
Weighted |
|
Weighted |
|
|||
|
Secured Notes Payable |
|
$ |
937,017 |
(2) |
34.1 |
% |
|
5.83 |
% |
|
6.4 Years |
|
|
Unsecured Line of Credit |
|
476,000 |
|
17.3 |
|
|
1.71 |
|
|
1.8 Years |
(5) |
|
|
Unsecured Term Loan |
|
750,000 |
|
27.3 |
|
|
5.62 |
|
|
2.8 Years |
(5) |
|
|
Unsecured Convertible Notes |
|
368,027 |
(3) |
13.4 |
|
|
3.70 |
|
|
2.0 Years |
|
|
|
Unsecured Convertible Notes |
|
215,902 |
(3) |
7.9 |
|
|
8.00 |
|
|
4.3 Years |
|
|
|
Total Debt |
|
$ |
2,746,946 |
|
100.0 |
% |
|
4.95 |
% |
|
3.9 Years |
|
|
(1) |
Assumes we exercise our sole right to extend the maturity date of our unsecured line of credit from October 2010 to October 2011 and our unsecured term loan from October 2011 to October 2012. Our multi-year capital plan assumes that we will successfully amend and renegotiate our $1.9 billion unsecured credit facility to a significant availability level that will take into account our business needs, including a portion of the total commitment allocated to an unsecured line of credit and an unsecured term loan. The lead lenders under our $1.9 billion unsecured credit facility expect that we will be able to amend and renegotiate our total credit facility to include approximately 66%-75% of the current $1.9 billion capacity. See our Annual Report on Form 10-K for the year ended December 31, 2009 for additional disclosures on our unsecured line of credit and unsecured term loan. As of December 31, 2009, cash and cash equivalents were approximately $70.6 million and restricted cash to fund certain construction costs was approximately $24.1 million. |
|
(2) |
Includes unamortized discount of approximately $2.1 million as of December 31, 2009. |
|
(3) |
Includes unamortized discount of approximately $40.8 million as of December 31, 2009. |
|
(4) |
Represents the weighted average contractual interest rate plus the impact of debt premiums/discounts and our interest rate hedge agreements on our secured notes payable, unsecured line of credit and unsecured term loan and the contractual rates of 3.7% and 8% on our unsecured convertible notes as of December 31, 2009. The weighted average interest rate excludes bank fees and amortization of loan fees. See also the “Summary of Interest Rate Hedge Agreements” section of this report. |
|
(5) |
Assumes we exercise our sole right to extend the maturity date of our unsecured line of credit and unsecured term loan by twelve months to October 2011 and October 2012, respectively. The interest rate related to outstanding borrowings for our unhedged floating rate debt is based upon one-month LIBOR. The interest rate resets periodically and will vary in future periods. |
ALEXANDRIA REAL ESTATE EQUITIES, INC.
Summary of Secured Debt Principal Maturities By Maturity Date Through 2014
December 31, 2009
(Dollars in thousands)
(Unaudited)
|
Description |
|
Maturity Date |
|
Type |
|
Stated Rate |
|
Effective Rate (1) |
|
Amount |
|
|||
|
|
|
|
|
|
|
|
|
|
|
|
|
|
|
|
|
Eastern Massachusetts #1 |
|
3/11/2010 |
|
Bank |
|
2.38 |
% |
|
2.38 |
% |
|
$ |
7,175 |
(2)(3) |
|
Washington – Seattle #1 |
|
7/1/2010 |
|
CMBS |
|
7.40 |
|
|
5.21 |
|
|
3,501 |
|
|
|
California – San Diego #1 |
|
10/1/2010 |
|
CMBS |
|
8.23 |
|
|
5.71 |
|
|
13,678 |
|
|
|
Other scheduled principal repayments/amortization |
|
|
|
|
|
|
|
|
|
|
|
11,628 |
|
|
|
2010 Total |
|
|
|
|
|
|
|
|
|
|
|
$ |
35,982 |
|
|
|
|
|
|
|
|
|
|
|
|
|
|
|
|
|
|
California – San Francisco Bay #1 |
|
1/3/2011 |
|
Bank |
|
1.53 |
% |
|
1.53 |
% |
|
$ |
29,558 |
(2) |
|
Eastern Massachusetts #2 |
|
2/1/2011 |
|
Bank |
|
7.52 |
|
|
5.82 |
|
|
5,050 |
|
|
|
California – San Diego #2 |
|
8/2/2011 |
|
Not-for-Profit |
|
7.50 |
|
|
7.50 |
|
|
8,500 |
|
|
|
Eastern Massachusetts #3 |
|
10/1/2011 |
|
Bank |
|
8.10 |
|
|
5.69 |
|
|
2,237 |
|
|
|
Suburban Washington, D.C. #1 |
|
11/1/2011 |
|
CMBS |
|
7.25 |
|
|
5.82 |
|
|
2,978 |
|
|
|
Suburban Washington, D.C. #2 |
|
12/22/2011 |
|
Bank |
|
3.57 |
|
|
3.57 |
|
|
76,000 |
(3) |
|
|
Other scheduled principal repayments/amortization |
|
|
|
|
|
|
|
|
|
|
|
10,751 |
|
|
|
2011 Total |
|
|
|
|
|
|
|
|
|
|
|
$ |
135,074 |
|
|
|
|
|
|
|
|
|
|
|
|
|
|
|
|
|
|
Washington – Seattle #2 |
|
1/1/2012 |
|
Bank |
|
6.15 |
% (4) |
|
6.15 |
% |
|
$ |
28,500 |
(2)(5) |
|
Eastern Massachusetts #4 |
|
3/1/2012 |
|
Insurance Co. |
|
7.14 |
|
|
5.83 |
|
|
1,358 |
|
|
|
Other scheduled principal repayments/amortization |
|
|
|
|
|
|
|
|
|
|
|
11,259 |
|
|
|
2012 Total |
|
|
|
|
|
|
|
|
|
|
|
$ |
41,117 |
|
|
|
|
|
|
|
|
|
|
|
|
|
|
|
|
|
|
California – San Diego #3 |
|
3/1/2013 |
|
Insurance Co. |
|
6.21 |
% |
|
6.21 |
% |
|
$ |
7,940 |
|
|
Eastern Massachusetts #5 |
|
4/6/2013 |
|
Bank |
|
4.24 |
|
|
4.24 |
|
|
38,444 |
(2)(6) |
|
|
Suburban Washington, D.C. #3 |
|
9/1/2013 |
|
CMBS |
|
6.36 |
|
|
6.36 |
|
|
26,093 |
|
|
|
California – San Francisco Bay #2 |
|
11/16/2013 |
|
Other |
|
6.14 |
|
|
6.14 |
|
|
7,527 |
|
|
|
Other scheduled principal repayments/amortization |
|
|
|
|
|
|
|
|
|
|
|
11,140 |
|
|
|
2013 Total |
|
|
|
|
|
|
|
|
|
|
|
$ |
91,144 |
|
|
|
|
|
|
|
|
|
|
|
|
|
|
|
|
|
|
Eastern Massachusetts #6 |
|
4/1/2014 |
|
Insurance Co. |
|
5.26 |
% |
|
5.59 |
% |
|
$ |
208,457 |
|
|
Washington – Seattle #3 |
|
11/18/2014 |
|
Other |
|
6.37 |
|
|
6.37 |
|
|
240 |
|
|
|
Other scheduled principal repayments/amortization |
|
|
|
|
|
|
|
|
|
|
|
8,255 |
|
|
|
2014 Total |
|
|
|
|
|
|
|
|
|
|
|
$ |
216,952 |
|
|
(1) |
Represents the weighted average contractual interest rate plus the impact of debt premiums/discounts and interest rate hedge agreements as of December 31, 2009. The effective rate excludes bank fees and amortization of loan fees. |
|
(2) |
Variable rate loan based on one month LIBOR plus an applicable spread. The interest rate resets periodically and will vary in future periods. |
|
(3) |
We have ongoing discussions with lenders to extend or refinance the debt secured by this property. |
|
(4) |
Represents the stated rate of 1.39% as of December 31, 2009 and the impact of an interest rate hedge agreement. |
|
(5) |
Assumes we exercise our sole right to extend the maturity date of this secured debt from January 1, 2011 to January 1, 2012. |
|
(6) |
Assumes we exercise our sole right to extend the maturity date of this secured debt from January 2, 2012 to April 6, 2013. |
ALEXANDRIA
REAL ESTATE EQUITIES, INC.
Total Market Capitalization and
Fixed/Floating Rate Debt Analysis
(Dollars in thousands, except per share data)
(Unaudited)
Total Market Capitalization
|
|
|
As of |
|
|||||||||||||
|
|
|
12/31/2009 |
|
9/30/2009 |
|
6/30/2009 |
|
3/31/2009 |
|
12/31/2008 |
|
|||||
|
Number of shares of common stock outstanding |
|
43,846,050 |
|
43,715,900 |
|
39,040,518 |
|
38,974,166 |
|
31,899,037 |
|
|||||
|
Closing price of common stock |
|
$ |
64.29 |
|
$ |
54.35 |
|
$ |
35.79 |
|
$ |
36.40 |
|
$ |
60.34 |
|
|
|
|
|
|
|
|
|
|
|
|
|
|
|||||
|
Total debt |
|
$ |
2,746,946 |
|
$ |
2,666,096 |
|
$ |
2,826,584 |
|
$ |
2,830,262 |
|
$ |
2,938,108 |
|
|
Less: debt attributable to noncontrolling interests |
|
(39,316 |
) |
(39,381 |
) |
(39,445 |
) |
(45,484 |
) |
(44,984 |
) |
|||||
|
Less: cash, cash equivalents and escrowed cash related to construction projects |
|
(94,682 |
) |
(101,931 |
) |
(99,155 |
) |
(160,090 |
) |
(120,660 |
) |
|||||
|
Our share of total debt |
|
2,612,948 |
|
2,524,784 |
|
2,687,984 |
|
2,624,688 |
|
2,772,464 |
|
|||||
|
Preferred stock |
|
380,830 |
|
375,593 |
|
356,562 |
|
351,117 |
|
353,658 |
|
|||||
|
Common stock market capitalization |
|
2,818,863 |
|
2,375,959 |
|
1,397,260 |
|
1,418,660 |
|
1,924,788 |
|
|||||
|
Total market capitalization |
|
$ |
5,812,641 |
|
$ |
5,276,336 |
|
$ |
4,441,806 |
|
$ |
4,394,465 |
|
$ |
5,050,910 |
|
|
|
|
|
|
|
|
|
|
|
|
|
|
|||||
|
Debt to Adjusted EBITDA – trailing 12 months |
|
7.7 |
|
7.3 |
|
7.7 |
|
7.8 |
|
8.6 |
|
|||||
|
Debt to gross assets (excluding cash) |
|
45.1% |
|
44.3% |
|
48.1% |
|
48.2% |
|
51.8% |
|
|||||
|
Unencumbered net operating income as a percentage of total net operating income |
|
55.4% |
|
60.2% |
|
60.8% |
|
63.5% |
|
61.9% |
|
|||||
Fixed/Floating Rate Debt Analysis
|
|
|
|
December 31, 2009 |
|
Percentage |
|
Weighted |
|
Weighted |
|
|||
|
|
Fixed Rate Debt |
|
$ |
1,415,441 |
|
51.5 |
% |
|
5.76 |
% |
|
5.3 Years |
|
|
|
Floating Rate Debt - Hedged |
|
866,944 |
|
31.6 |
|
|
5.59 |
|
|
2.8 Years |
(b) |
|
|
|
Floating Rate Debt - Unhedged |
|
464,561 |
|
16.9 |
|
|
1.28 |
|
|
1.8 Years |
(b) |
|
|
|
Total Debt |
|
$ |
2,746,946 |
|
100.0 |
% |
|
4.95 |
% |
|
3.9 Years |
(b) |
|
(a) |
Represents the weighted average contractual interest rate plus the impact of debt premiums/discounts and our interest rate hedge agreements on our secured notes payable, unsecured line of credit and unsecured term loan and the contractual rates of 3.7% and 8% on our unsecured convertible notes. The weighted average interest rate excludes bank fees and amortization of loan fees. See also the “Summary of Interest Rate Hedge Agreements” section of this report. |
|
(b) |
Assumes we exercise our sole right to extend the maturity date of our unsecured line of credit and unsecured term loan by twelve months to October 2011 and October 2012, respectively. The interest rate related to outstanding borrowings for our unhedged floating rate debt is based upon one-month LIBOR. The interest rate resets periodically and will vary in future periods. |
See “Definitions and Other Information” section of this report starting on page 39.
ALEXANDRIA REAL ESTATE EQUITIES, INC.
Summary of Interest Rate Hedge Agreements
December 31, 2009
(Dollars in thousands)
(Unaudited)
|
Transaction |
|
Effective |
|
Termination |
|
Interest Pay |
|
Notional |
|
Effective at |
|
|||
|
|
|
|
|
|
|
|
|
|
|
|
|
|
|
|
|
December 2006 |
|
December 29, 2006 |
|
March 31, 2014 |
|
4.990 |
% |
|
$ |
50,000 |
|
$ |
50,000 |
|
|
December 2006 |
|
January 2, 2007 |
|
January 3, 2011 |
|
5.003 |
|
|
28,500 |
|
28,500 |
|
||
|
October 2007 |
|
October 31, 2007 |
|
September 30, 2012 |
|
4.546 |
|
|
50,000 |
|
50,000 |
|
||
|
October 2007 |
|
October 31, 2007 |
|
September 30, 2013 |
|
4.642 |
|
|
50,000 |
|
50,000 |
|
||
|
December 2005 |
|
January 2, 2008 |
|
December 31, 2010 |
|
4.768 |
|
|
50,000 |
|
50,000 |
|
||
|
June 2006 |
|
June 30, 2008 |
|
June 30, 2010 |
|
5.325 |
|
|
50,000 |
|
50,000 |
|
||
|
June 2006 |
|
June 30, 2008 |
|
June 30, 2010 |
|
5.325 |
|
|
50,000 |
|
50,000 |
|
||
|
October 2007 |
|
July 1, 2008 |
|
March 31, 2013 |
|
4.622 |
|
|
25,000 |
|
25,000 |
|
||
|
October 2007 |
|
July 1, 2008 |
|
March 31, 2013 |
|
4.625 |
|
|
25,000 |
|
25,000 |
|
||
|
October 2008 |
|
October 16, 2008 |
|
January 31, 2010 |
|
2.755 |
|
|
100,000 |
|
100,000 |
|
||
|
June 2006 |
|
October 31, 2008 |
|
December 31, 2010 |
|
5.340 |
|
|
50,000 |
|
50,000 |
|
||
|
June 2006 |
|
October 31, 2008 |
|
December 31, 2010 |
|
5.347 |
|
|
50,000 |
|
50,000 |
|
||
|
October 2008 |
|
September 30, 2009 |
|
January 31, 2011 |
|
3.119 |
|
|
100,000 |
|
100,000 |
|
||
|
December 2006 |
|
November 30, 2009 |
|
March 31, 2014 |
|
5.015 |
|
|
75,000 |
|
75,000 |
|
||
|
December 2006 |
|
November 30, 2009 |
|
March 31, 2014 |
|
5.023 |
|
|
75,000 |
|
75,000 |
|
||
|
December 2006 |
|
December 31, 2010 |
|
October 31, 2012 |
|
5.015 |
|
|
100,000 |
|
– |
|
||
|
Total |
|
|
|
|
|
|
|
|
|
|
$ |
828,500 |
|
|
Interest pay rates represent the interest rates we will pay for one month LIBOR under the applicable interest rate swap agreement. These rates do not include any spread in addition to one month LIBOR that is due monthly as interest expense.
In May 2009, we entered into an interest rate cap agreement with a notional amount approximating $38.4 million effective May 15, 2009 and terminating on January 3, 2012. The agreement sets a ceiling on one month LIBOR at 2.50% related to one secured note.
ALEXANDRIA REAL ESTATE EQUITIES, INC.
Summary of Occupancy Percentage and Properties
(Dollars in thousands)
(Unaudited)
Summary of Occupancy Percentage
|
|
|
|
|
December 31, |
|
||||||||||||||||||||||
|
|
|
Average |
|
1998 |
|
1999 |
|
2000 |
|
2001 |
|
2002 |
|
2003 |
|
2004 |
|
2005 |
|
2006 |
|
2007 |
|
2008 |
|
2009 |
|
|
Occupancy (excluding redevelopment and properties “held for sale”) |
|
95.3% |
|
96.2% |
|
95.7% |
|
98.4% |
|
99.0% |
|
96.3% |
|
93.9% |
|
95.2% |
|
93.2% |
|
93.1% |
|
93.8% |
|
94.8% |
|
94.1% |
|
|
Occupancy (including redevelopment properties) |
|
89.3% |
|
92.9% |
|
91.5% |
|
90.8% |
|
88.6% |
|
89.2% |
|
88.4% |
|
87.0% |
|
87.7% |
|
88.0% |
|
87.8% |
|
90.0% |
|
89.4% |
|
Summary of Properties
|
|
|
|
|
December 31, 2009 |
|
|
|
|
||||||||||||
|
|
|
Number of |
|
Rentable Square Feet |
|
Annualized |
|
Occupancy Percentage |
||||||||||||
|
Markets |
|
Properties |
|
Operating |
|
Redevelopment |
|
Total |
|
Base Rent (1) |
|
12/31/09(1)(2) |
|
9/30/09(3) |
|
12/31/08(4) |
||||
|
California – San Diego |
|
32 |
|
1,549,044 |
|
116,431 |
|
1,665,475 |
|
$ |
41,454 |
|
89.2 |
% |
|
90.2 |
% |
|
92.5 |
% |
|
California – San Francisco Bay |
|
18 |
|
1,580,943 |
|
– |
|
1,580,943 |
|
53,949 |
|
95.4 |
|
|
96.2 |
|
|
98.4 |
|
|
|
Eastern Massachusetts |
|
36 |
|
3,064,693 |
|
245,308 |
|
3,310,001 |
|
110,973 |
|
94.3 |
|
|
94.7 |
|
|
96.7 |
|
|
|
New Jersey/Suburban Philadelphia |
|
8 |
|
459,904 |
|
– |
|
459,904 |
|
9,601 |
|
88.0 |
|
|
88.0 |
|
|
87.5 |
|
|
|
Southeast |
|
13 |
|
735,373 |
|
21,191 |
|
756,564 |
|
16,364 |
|
93.7 |
|
|
92.6 |
|
|
94.7 |
|
|
|
Suburban Washington, D.C. |
|
30 |
|
2,255,381 |
|
192,222 |
|
2,447,603 |
|
47,120 |
|
94.3 |
|
|
94.6 |
|
|
90.5 |
|
|
|
Washington – Seattle |
|
12 |
|
975,121 |
|
– |
|
975,121 |
|
30,044 |
|
99.1 |
|
|
99.1 |
|
|
98.7 |
|
|
|
International – Canada |
|
4 |
|
342,394 |
|
– |
|
342,394 |
|
8,158 |
|
100.0 |
|
|
100.0 |
|
|
100.0 |
|
|
|
Total Properties (Continuing Operations) |
|
153 |
|
10,962,853 |
|
575,152 |
|
11,538,005 |
|
$ |
317,663 |
|
94.1 |
% |
|
94.4 |
% |
|
94.8 |
% |
|
(1) |
Excludes spaces at properties totaling approximately 575,152 rentable square feet undergoing a permanent change in use to office/laboratory space through redevelopment, including the conversion of single tenancy space to multi-tenancy spaces or multi-tenancy spaces to single tenancy space, and three properties with approximately 221,638 rentable square feet that are classified as “held for sale.” |
|
(2) |
Including spaces undergoing a permanent change in use to office/laboratory space through redevelopment, occupancy as of December 31, 2009 was 89.4%. See also the “Value Add Activities” section of this report for additional information on our redevelopment program. |
|
(3) |
Excludes spaces at properties totaling approximately 641,242 rentable square feet undergoing a permanent change in use to office/laboratory space through redevelopment, including the conversion of single tenancy space to multi-tenancy spaces or multi-tenancy spaces to single tenancy space, and four properties with approximately 269,196 rentable square feet that were classified as “held for sale.” Including spaces undergoing a permanent change in use to office/laboratory space through redevelopment, occupancy as of September 30, 2009 was 89.1%. See also the “Value Add Activities” section of this report for additional information on our redevelopment program. |
|
(4) |
Excludes spaces at properties totaling approximately 590,057 rentable square feet undergoing a permanent change in use to office/laboratory space through redevelopment, including the conversion of single tenancy space to multi-tenancy spaces or multi-tenancy spaces to single tenancy space, and three properties with approximately 64,218 rentable square feet that were classified as “held for sale.” Including spaces undergoing a permanent change in use to office/laboratory space through redevelopment, occupancy as of December 31, 2008 was 90.0%. See also the “Value Add Activities” section of this report for additional information on our redevelopment program. |
ALEXANDRIA REAL ESTATE EQUITIES, INC.
Summary of Same Property Comparisons
(Dollars in thousands)
(Unaudited)
|
|
|
GAAP Basis |
|
Cash Basis |
|
||||||||||||
|
|
|
Quarter Ended |
|
Quarter Ended |
|
||||||||||||
|
|
|
12/31/2009 |
|
12/31/2008 |
|
% Change |
|
12/31/2009 |
|
12/31/2008 |
|
% Change |
|
||||
|
Revenue |
|
$ |
92,687 |
|
$ |
92,076 |
|
0.7% |
|
$ |
90,939 |
|
$ |
90,225 |
|
0.8% |
|
|
Operating expenses |
|
23,338 |
|
23,504 |
|
(0.7) |
|
23,338 |
|
23,504 |
|
(0.7) |
|
||||
|
Revenue less operating expenses |
|
$ |
69,349 |
|
$ |
68,572 |
|
1.1% |
|
$ |
67,601 |
|
$ |
66,721 |
|
1.3% |
|
|
|
|
|
|
|
|
||||||||||||
|
|
|
GAAP Basis |
|
Cash Basis |
|
||||||||||||
|
|
|
Year Ended |
|
Year Ended |
|
||||||||||||
|
|
|
12/31/2009 |
|
12/31/2008 |
|
% Change |
|
12/31/2009 |
|
12/31/2008 |
|
% Change |
|
||||
|
Revenue |
|
$ |
366,268 |
|
$ |
356,938 |
|
2.6% |
|
$ |
361,115 |
|
$ |
347,056 |
|
4.1% |
|
|
Operating expenses |
|
93,774 |
|
91,743 |
|
2.2 |
|
93,774 |
|
91,743 |
|
2.2 |
|
||||
|
Revenue less operating expenses |
|
$ |
272,494 |
|
$ |
265,195 |
|
2.8% |
|
$ |
267,341 |
|
$ |
255,313 |
|
4.7% |
|
Quarterly Percentage Change in GAAP and Cash Same Property Revenues Less Operating Expenses
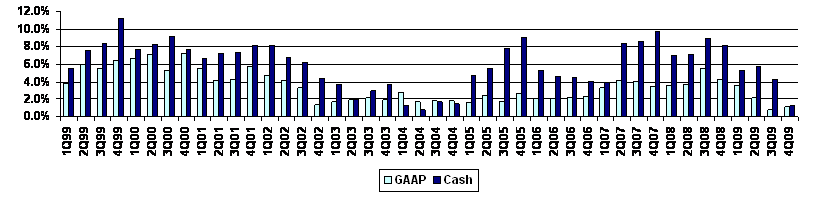
See “Definitions and Other Information” section of this report starting on page 39.
ALEXANDRIA REAL ESTATE EQUITIES, INC.
Summary of Leasing Activity
For the Year Ended December 31, 2009
(Unaudited)
|
|
|
|
|
|
|
|
|
|
|
|
|
TI’s/Lease |
|
|
|
|
|
|
|
|
Rentable |
|
|
|
|
|
Rental |
|
Commissions |
|
Average |
|
|
|
|
Number |
|
Square |
|
Expiring |
|
New |
|
Rate |
|
Per |
|
Lease |
|
|
|
|
of Leases |
|
Footage |
|
Rates |
|
Rates |
|
Changes |
|
Square Foot |
|
Terms |
|
|
Leasing Activity |
|
|
|
|
|
|
|
|
|
|
|
|
|
|
|
|
Lease Expirations |
|
|
|
|
|
|
|
|
|
|
|
|
|
|
|
|
Cash Basis |
|
131 |
|
1,842,597 |
|
$30.61 |
|
– |
|
– |
|
– |
|
– |
|
|
GAAP Basis |
|
131 |
|
1,842,597 |
|
$30.70 |
|
– |
|
– |
|
– |
|
– |
|
|
|
|
|
|
|
|
|
|
|
|
|
|
|
|
|
|
|
Renewed/Released Space Leased |
|
|
|
|
|
|
|
|
|
|
|
|
|
|
|
|
Cash Basis |
|
95 |
|
1,188,184 |
|
$28.07 |
|
$28.11 |
|
0.1% |
|
$3.99 |
|
3.3 years |
|
|
GAAP Basis |
|
95 |
|
1,188,184 |
|
$26.78 |
|
$27.72 |
|
3.5% |
|
$3.99 |
|
3.3 years |
|
|
|
|
|
|
|
|
|
|
|
|
|
|
|
|
|
|
|
Developed/Redeveloped/ Vacant Space Leased |
|
|
|
|
|
|
|
|
|
|
|
|
|
|
|
|
Cash Basis |
|
47 |
|
676,163 |
|
– |
|
$33.57 |
|
– |
|
$8.12 |
|
6.6 years |
|
|
GAAP Basis |
|
47 |
|
676,163 |
|
– |
|
$36.00 |
|
– |
|
$8.12 |
|
6.6 years |
|
|
|
|
|
|
|
|
|
|
|
|
|
|
|
|
|
|
|
Month-to-Month Leases in Effect |
|
|
|
|
|
|
|
|
|
|
|
|
|
|
|
|
Cash Basis |
|
3 |
|
1,850 |
|
$17.35 |
|
$17.35 |
|
– |
|
– |
|
– |
|
|
GAAP Basis |
|
3 |
|
1,850 |
|
$17.35 |
|
$17.35 |
|
– |
|
– |
|
– |
|
|
|
|
|
|
|
|
|
|
|
|
|
|
|
|
|
|
|
Leasing Activity Summary |
|
|
|
|
|
|
|
|
|
|
|
|
|
|
|
|
Excluding Month-to-Month Leases |
|
|
|
|
|
|
|
|
|
|
|
|
|
|
|
|
Cash Basis |
|
142 |
|
1,864,347 |
|
– |
|
$30.09 |
|
– |
|
$5.49 |
|
4.5 years |
|
|
GAAP Basis |
|
142 |
|
1,864,347 |
|
– |
|
$30.73 |
|
– |
|
$5.49 |
|
4.5 years |
|
|
|
|
|
|
|
|
|
|
|
|
|
|
|
|
|
|
|
Including Month-to-Month Leases |
|
|
|
|
|
|
|
|
|
|
|
|
|
|
|
|
Cash Basis |
|
145 |
|
1,866,197 |
|
– |
|
$30.08 |
|
– |
|
– |
|
– |
|
|
GAAP Basis |
|
145 |
|
1,866,197 |
|
– |
|
$30.71 |
|
– |
|
– |
|
– |
|
In December 2008, the Company entered into a modification of a lease in South San Francisco resulting in the recognition of additional rental income approximating $11.3 million and $18.5 million in the fourth quarter of 2008 and the first quarter of 2009, respectively. The Company completed the lease modification in December 2008 in order to lease the space to a high quality life science company. The leasing activity above excludes the impact of activity at this property due to the significance of the additional rental income recognized pursuant to the lease modification.
ALEXANDRIA REAL ESTATE EQUITIES, INC.
Summary of Leasing Activity
For the Quarter Ended December 31, 2009
(Unaudited)
|
|
|
|
|
|
|
|
|
|
|
|
|
TI’s/Lease |
|
|
|
|
|
|
|
|
Rentable |
|
|
|
|
|
Rental |
|
Commissions |
|
Average |
|
|
|
|
Number |
|
Square |
|
Expiring |
|
New |
|
Rate |
|
Per |
|
Lease |
|
|
|
|
of Leases |
|
Footage |
|
Rates |
|
Rates |
|
Changes |
|
Square Foot |
|
Terms |
|
|
Leasing Activity |
|
|
|
|
|
|
|
|
|
|
|
|
|
|
|
|
Lease Expirations |
|
|
|
|
|
|
|
|
|
|
|
|
|
|
|
|
Cash Basis |
|
35 |
|
471,210 |
|
$26.48 |
|
– |
|
– |
|
– |
|
– |
|
|
GAAP Basis |
|
35 |
|
471,210 |
|
$24.57 |
|
– |
|
– |
|
– |
|
– |
|
|
|
|
|
|
|
|
|
|
|
|
|
|
|
|
|
|
|
Renewed/Released Space Leased |
|
|
|
|
|
|
|
|
|
|
|
|
|
|
|
|
Cash Basis |
|
25 |
|
374,012 |
|
$25.89 |
|
$23.83 |
|
(8.0% |
) |
$6.24 |
|
4.1 years |
|
|
GAAP Basis |
|
25 |
|
374,012 |
|
$23.91 |
|
$24.27 |
|
1.5% |
|
$6.24 |
|
4.1 years |
|
|
|
|
|
|
|
|
|
|
|
|
|
|
|
|
|
|
|
Developed/Redeveloped/ Vacant Space Leased |
|
|
|
|
|
|
|
|
|
|
|
|
|
|
|
|
Cash Basis |
|
15 |
|
115,067 |
|
– |
|
$27.52 |
|
– |
|
$8.74 |
|
5.7 years |
|
|
GAAP Basis |
|
15 |
|
115,067 |
|
– |
|
$26.85 |
|
– |
|
$8.74 |
|
5.7 years |
|
|
|
|
|
|
|
|
|
|
|
|
|
|
|
|
|
|
|
Month-to-Month Leases in Effect |
|
|
|
|
|
|
|
|
|
|
|
|
|
|
|
|
Cash Basis |
|
3 |
|
1,850 |
|
$17.35 |
|
$17.35 |
|
– |
|
– |
|
– |
|
|
GAAP Basis |
|
3 |
|
1,850 |
|
$17.35 |
|
$17.35 |
|
– |
|
– |
|
– |
|
|
|
|
|
|
|
|
|
|
|
|
|
|
|
|
|
|
|
Leasing Activity Summary |
|
|
|
|
|
|
|
|
|
|
|
|
|
|
|
|
Excluding Month-to-Month Leases |
|
|
|
|
|
|
|
|
|
|
|
|
|
|
|
|
Cash Basis |
|
40 |
|
489,079 |
|
– |
|
$24.69 |
|
– |
|
$6.83 |
|
4.5 years |
|
|
GAAP Basis |
|
40 |
|
489,079 |
|
– |
|
$24.88 |
|
– |
|
$6.83 |
|
4.5 years |
|
|
|
|
|
|
|
|
|
|
|
|
|
|
|
|
|
|
|
Including Month-to-Month Leases |
|
|
|
|
|
|
|
|
|
|
|
|
|
|
|
|
Cash Basis |
|
43 |
|
490,929 |
|
– |
|
$24.67 |
|
– |
|
– |
|
– |
|
|
GAAP Basis |
|
43 |
|
490,929 |
|
– |
|
$24.85 |
|
– |
|
– |
|
– |
|
ALEXANDRIA REAL ESTATE EQUITIES, INC.
Summary of Leasing Activity
December 31, 2009
(Unaudited)
|
|
|
Years Ended |
|
||||||||||||||||||||||
|
|
|
|
|
|
|
|
|
|
|
|
|
|
|
|
|
||||||||||
|
|
|
2009 |
|
|
2008 |
|
|
2007 |
|
|
2006 |
|
|
2005 |
|
||||||||||
|
|
|
GAAP |
|
Cash |
|
|
GAAP |
|
Cash |
|
|
GAAP |
|
Cash |
|
|
GAAP |
|
Cash |
|
|
GAAP |
|
Cash |
|
|
|
|
|
|
|
|
|
|
|
|
|
|
|
|
|
|
|
|
|
|
|
|
|
|
|
|
|
Lease Expirations |
|
|
|
|
|
|
|
|
|
|
|
|
|
|
|
|
|
|
|
|
|
|
|
|
|
|
Rentable Square Footage |
|
1,842,597 |
|
1,842,597 |
|
|
1,664,944 |
|
1,664,944 |
|
|
1,626,033 |
|
1,626,033 |
|
|
1,224,143 |
|
1,224,143 |
|
|
1,258,034 |
|
1,258,034 |
|
|
Expiring Rates |
|
$30.70 |
|
$30.61 |
|
|
$25.52 |
|
$26.88 |
|
|
$26.97 |
|
$25.98 |
|
|
$22.42 |
|
$24.62 |
|
|
$24.40 |
|
$22.95 |
|
|
|
|
|
|
|
|
|
|
|
|
|
|
|
|
|
|
|
|
|
|
|
|
|
|
|
|
|
Renewed/Released Space |
|
|
|
|
|
|
|
|
|
|
|
|
|
|
|
|
|
|
|
|
|
|
|
|
|
|
Leased Rentable Square Footage |
|
1,188,184 |
|
1,188,184 |
|
|
1,254,285 |
|
1,254,285 |
|
|
895,894 |
|
895,894 |
|
|
704,826 |
|
704,826 |
|
|
796,945 |
|
796,945 |
|
|
New Rates |
|
$27.72 |
|
$28.11 |
|
|
$29.34 |
|
$28.60 |
|
|
$31.48 |
|
$31.41 |
|
|
$23.67 |
|
$23.64 |
|
|
$23.42 |
|
$23.63 |
|
|
Expiring Rates |
|
$26.78 |
|
$28.07 |
|
|
$25.51 |
|
$27.08 |
|
|
$28.66 |
|
$29.38 |
|
|
$20.74 |
|
$21.94 |
|
|
$22.66 |
|
$22.66 |
|
|
Rental Rate Changes |
|
3.5% |
|
0.1% |
|
|
15.0% |
|
5.6% |
|
|
9.8% |
|
6.9% |
|
|
14.1% |
|
7.7% |
|
|
3.4% |
|
4.3% |
|
|
|
|
|
|
|
|
|
|
|
|
|
|
|
|
|
|
|
|
|
|
|
|
|
|
|
|
|
Developed/Redeveloped/ Vacant Space Leased |
|
|
|
|
|
|
|
|
|
|
|
|
|
|
|
|
|
|
|
|
|
|
|
|
|
|
Rentable Square Footage |
|
676,163 |
|
676,163 |
|
|
906,859 |
|
906,859 |
|
|
686,856 |
|
686,856 |
|
|
883,503 |
|
883,503 |
|
|
721,961 |
|
721,961 |
|
|
New Rates |
|
$36.00 |
|
$33.57 |
|
|
$37.64 |
|
$35.04 |
|
|
$33.68 |
|
$31.59 |
|
|
$32.89 |
|
$31.02 |
|
|
$25.65 |
|
$24.42 |
|
|
|
|
|
|
|
|
|
|
|
|
|
|
|
|
|
|
|
|
|
|
|
|
|
|
|
|
|
Totals |
|
|
|
|
|
|
|
|
|
|
|
|
|
|
|
|
|
|
|
|
|
|
|
|
|
|
Rentable Square Footage |
|
1,864,347 |
|
1,864,347 |
|
|
2,161,144 |
|
2,161,144 |
|
|
1,582,750 |
|
1,582,750 |
|
|
1,588,329 |
|
1,588,329 |
|
|
1,518,906 |
|
1,518,906 |
|
|
New Rates |
|
$30.73 |
|
$30.09 |
|
|
$32.82 |
|
$31.30 |
|
|
$32.44 |
|
$31.49 |
|
|
$28.80 |
|
$27.74 |
|
|
$24.48 |
|
$24.01 |
|
|
TI’s/Lease Commissions per Square Foot |
|
$5.49 |
|
$5.49 |
|
|
$7.23 |
|
$7.23 |
|
|
$6.95 |
|
$6.95 |
|
|
$5.13 |
|
$5.13 |
|
|
$6.52 |
|
$6.52 |
|
|
Average Lease Terms |
|
4.5 years |
|
4.5 years |
|
|
5.5 years |
|
5.5 years |
|
|
5.1 years |
|
5.1 years |
|
|
6.3 years |
|
6.3 years |
|
|
6.2 years |
|
6.2 years |
|
ALEXANDRIA REAL ESTATE EQUITIES, INC.
Summary of Lease Expirations
December 31, 2009
(Unaudited)
|
Year of Lease |
|
Number of |
|
Rentable
Square |
|
Percentage of |
|
Annualized Base Rent |
|
|||||
|
|
|
|
|
|
|
|
|
|
|
|||||
|
2010 |
|
78 |
(1) |
|
|
1,003,316 |
(1) |
|
8.7 |
% |
|
$24.31 |
|
|
|
2011 |
|
79 |
|
|
|
1,747,901 |
|
|
15.1 |
|
|
28.02 |
|
|
|
2012 |
|
66 |
|
|
|
1,366,663 |
|
|
11.8 |
|
|
32.82 |
|
|
|
2013 |
|
49 |
|
|
|
953,388 |
|
|
8.3 |
|
|
29.92 |
|
|
|
2014 |
|
49 |
|
|
|
1,105,663 |
|
|
9.6 |
|
|
28.31 |
|
|
|
2015 |
|
32 |
|
|
|
664,559 |
|
|
5.8 |
|
|
26.55 |
|
|
|
2016 |
|
18 |
|
|
|
1,037,632 |
|
|
9.0 |
|
|
31.65 |
|
|
|
2017 |
|
13 |
|
|
|
684,973 |
|
|
5.9 |
|
|
34.63 |
|
|
|
2018 |
|
11 |
|
|
|
737,172 |
|
|
6.4 |
|
|
44.60 |
|
|
|
2019 |
|
6 |
|
|
|
254,703 |
|
|
2.2 |
|
|
34.64 |
|
|
|
|
|
|
|
|
|
|
|
|
|
|
||||
|
|
|
2010 |
|
2011 |
|
||||||
|
Markets |
|
Rentable Square |
|
Annualized Base Rent |
|
Rentable Square |
|
Annualized Base Rent |
|
||
|
|
|
|
|
|
|
|
|
|
|
||
|
California – San Diego |
|
293,847 |
|
$17.64 |
|
|
157,695 |
|
$30.73 |
|
|
|
California – San Francisco Bay |
|
258,909 |
|
29.79 |
|
|
277,776 |
|
34.83 |
|
|
|
Eastern Massachusetts |
|
138,210 |
|
32.70 |
|
|
766,020 |
|
30.00 |
|
|
|
New Jersey/Suburban Philadelphia |
|
48,588 |
|
14.50 |
|
|
34,021 |
|
16.05 |
|
|
|
Southeast |
|
105,136 |
|
24.83 |
|
|
44,862 |
|
18.08 |
|
|
|
Suburban Washington, D.C. |
|
30,144 |
|
16.06 |
|
|
199,808 |
|
22.14 |
|
|
|
Washington –Seattle |
|
128,482 |
|
24.75 |
|
|
267,719 |
|
21.26 |
|
|
|
International – Canada |
|
– |
|
– |
|
|
– |
|
– |
|
|
|
|
|
|
|
|
|
|
|
|
|
|
|
|
Total |
|
1,003,316 |
(1) |
$24.31 |
|
|
1,747,901 |
|
$28.02 |
|
|
(1) Excludes three month-to-month leases for approximately 2,000 rentable square feet.
ALEXANDRIA REAL ESTATE EQUITIES, INC.
20 Largest Client Tenants
December 31, 2009
(Unaudited)
|
|
|
|
|
|
|
|
|
|
|
|
|
|
|
|
|
|
|
|||||
|
|
|
Tenant |
|
Number |
|
Remaining |
|
Remaining |
|
Approximate |
|
Percentage of |
|
Annualized |
|
Percentage of |
|
|||||
|
1 |
|
Novartis AG |
|
5 |
|
6.1 |
|
|
6.5 |
|
|
424,641 |
|
3.7 |
% |
|
$ |
25,390 |
|
8.0 |
% |
|
|
2 |
|
Roche Holding Ltd |
|
5 |
|
7.8 |
|
|
8.0 |
|
|
387,813 |
|
3.4 |
|
|
14,850 |
|
4.7 |
|
|
|
|
3 |
|
GlaxoSmithKline plc |
|
6 |
|
5.4 |
|
|
6.4 |
|
|
350,278 |
|
3.0 |
|
|
14,038 |
|
4.4 |
|
|
|
|
4 |
|
ZymoGenetics, Inc. (4) |
|
2 |
|
9.4 |
|
|
9.4 |
|
|
203,369 |
|
1.8 |
|
|
8,747 |
|
2.8 |
|
|
|
|
5 |
|
United States Government |
|
6 |
|
3.6 |
|
|
3.6 |
|
|
308,205 |
|
2.7 |
|
|
8,495 |
|
2.7 |
|
|
|
|
6 |
|
Massachusetts Institute of Technology |
|
3 |
|
2.3 |
|
|
2.6 |
|
|
178,952 |
|
1.6 |
|
|
7,899 |
|
2.5 |
|
|
|
|
7 |
|
Theravance, Inc. (5) |
|
2 |
|
2.3 |
|
|
2.3 |
|
|
170,244 |
|
1.5 |
|
|
6,136 |
|
1.9 |
|
|
|
|
8 |
|
Pfizer Inc. |
|
2 |
|
10.0 |
|
|
9.9 |
|
|
120,140 |
|
1.0 |
|
|
5,647 |
|
1.8 |
|
|
|
|
9 |
|
Amylin Pharmaceuticals, Inc. |
|
3 |
|
6.4 |
|
|
6.6 |
|
|
158,983 |
|
1.4 |
|
|
5,467 |
|
1.7 |
|
|
|
|
10 |
|
The Scripps Research Institute |
|
2 |
|
6.9 |
|
|
6.9 |
|
|
96,500 |
|
0.8 |
|
|
5,193 |
|
1.6 |
|
|
|
|
11 |
|
Forrester Research, Inc. |
|
1 |
|
1.8 |
|
|
1.8 |
|
|
145,551 |
|
1.3 |
|
|
4,987 |
|
1.6 |
|
|
|
|
12 |
|
Alnylam Pharmaceuticals, Inc. |
|
1 |
|
6.8 |
|
|
6.8 |
|
|
95,410 |
|
0.8 |
|
|
4,466 |
|
1.4 |
|
|
|
|
11 |
|
Dyax Corp. |
|
1 |
|
2.2 |
|
|
2.2 |
|
|
67,373 |
|
0.6 |
|
|
4,361 |
|
1.4 |
|
|
|
|
14 |
|
Quest Diagnostics Incorporated |
|
1 |
|
7.0 |
|
|
7.0 |
|
|
248,186 |
|
2.2 |
|
|
4,341 |
|
1.4 |
|
|
|
|
15 |
|
Infinity Pharmaceuticals, Inc. |
|
2 |
|
3.0 |
|
|
3.0 |
|
|
67,167 |
|
0.6 |
|
|
4,302 |
|
1.4 |
|
|
|
|
16 |
|
Johnson & Johnson |
|
2 |
|
3.7 |
|
|
3.2 |
|
|
170,451 |
|
1.5 |
|
|
3,917 |
|
1.2 |
|
|
|
|
17 |
|
Monsanto Company |
|
3 |
|
9.1 |
|
|
11.0 |
|
|
120,050 |
|
1.0 |
|
|
3,904 |
|
1.2 |
|
|
|
|
18 |
|
Fred Hutchinson Cancer Research Center |
|
2 |
|
4.5 |
|
|
4.6 |
|
|
123,322 |
|
1.1 |
|
|
3,853 |
|
1.2 |
|
|
|
|
18 |
|
Merck & Co., Inc. |
|
2 |
|
3.4 |
|
|
4.1 |
|
|
102,196 |
|
0.9 |
|
|
3,847 |
|
1.2 |
|
|
|
|
20 |
|
Qiagen N.V. |
|
2 |
|
6.2 |
|
|
6.2 |
|
|
158,879 |
|
1.4 |
|
|
3,845 |
|
1.2 |
|
|
|
|
|
|
Total/Weighted Average: |
|
53 |
|
5.6 |
|
|
5.9 |
|
|
3,697,710 |
|
32.3 |
% |
|
$ |
143,685 |
|
45.3 |
% |
|
|
|
|
|
|
|
|
|
|
|
|
|
|
|
|
|
|
|
|
|||||
(1) Represents remaining lease term in years based on percentage of leased square feet.
(2) Represents remaining lease term in years based on percentage of annualized base rent.
(3) Annualized base rent means the annualized fixed base rental amount in effect as of December 31, 2009 (using rental revenue computed on a straight- line basis in accordance with GAAP).
(4) As of September 30, 2009, Novo A/S owned approximately 32% of ZymoGenetics, Inc.
(5) As of October 30, 2009, GlaxoSmithKline plc owned approximately 15% of the outstanding stock of Theravance, Inc.
ALEXANDRIA REAL ESTATE EQUITIES, INC.
Client Tenant Mix
December 31, 2009
(Unaudited)
|
Client tenant mix by annualized base rent |
Multinational Pharmaceutical |
|
Institutional:
Independent Not-for-Profit/ |
|
· Abbot Laboratories · Astellas Pharma US, Inc. · AstraZeneca plc · Baxter International, Inc. · Bristol-Myers Squibb Company · Eisai Co., Ltd. · Eli Lilly and Company · GlaxoSmithKline plc · Johnson & Johnson · Merck & Co., Inc. · Novartis AG · Pfizer Inc. · Roche Holding Ltd · Sanofi-Aventis |
|
· Bill & Melinda Gates Foundation · The Burham Institute for Medical Research · Duke University · Environmental Protection Agency · Fred Hutchinson Cancer Research Center · Massachusetts Institute of Technology · The National Institutes of Health · The Scripps Research Institute · University of California, San Francisco · University of Massachusetts · UMass Memorial Medical Center · University of Washington |
|
|
|
|
|
|
|
|
|
|
|
|
Biotechnology: Public & Private |
|
Medical Device, Life Science Product, Service and Biofuels |
|
|
· Achaogen, Inc. · Alnylam Pharmaceuticals, Inc. · Ambrx, Inc. · Amgen, Inc. · Amylin Pharmaceuticals, Inc. · Anaphore, Inc. · Avila Therapeutics, Inc. · Biogen Idec Inc. · BrainCells Inc. · Celegene Corporation · Fate Therapeutics · Gilead Sciences, Inc. · Ikaria Holdings, Inc. · Intellikine, Inc. · Intercell AG · MacroGenics, Inc. · Presidio Pharmaceuticals, Inc. · Proteostasis Therapeutics, Inc. · Theravance, Inc. · ToleRx, Inc. · ZymoGenetics, Inc. |
|
· Bio-Rad Laboratories, Inc. · Becton, Dickson and Company · Canon U.S. Life Sciences, Inc. · Laboratory Corporation Of America Holdings · Life Technologies Corporation · Monsanto Company · Pharmaceutical Product Development, Inc. · Qiagen N.V. · Quest Diagnostics Incorporated · Syngenta AG |
ALEXANDRIA REAL ESTATE EQUITIES, INC.
Summary of Additions and Dispositions of Properties
For the Quarter Ended December 31, 2009
(Dollars in thousands)
(Unaudited)
|
|
|
Acquisition |
|
Month of |
|
Rentable |
|
|
Markets |
|
Amount |
|
Acquisition |
|
Square Feet |
|
|
|
|
|
|
|
|
|
|
|
Additions to Operating Properties: |
|
N/A |
|
N/A |
|
N/A |
|
|
|
|
Acquisition |
|
Month of |
|
Developable |
|
|
Markets |
|
Amount |
|
Acquisition |
|
Square Feet |
|
|
|
|
|
|
|
|
|
|
|
Additions to Land: |
|
N/A |
|
N/A |
|
N/A |
|
|
|
|
Disposition |
|
Month of |
|
Rentable |
|
|
|
Markets |
|
Amount |
|
Disposition |
|
Square Feet |
|
|
|
|
|
|
|
|
|
|
|
|
|
Dispositions: |
|
|
|
|
|
|
|
|
|
|
|
|
|
|
|
|
|
|
|
Suburban Washington, D.C. |
|
$ |
6,400 |
|
October |
|
47,558 |
|
ALEXANDRIA
REAL ESTATE EQUITIES, INC.
Real Estate
December 31, 2009
(Dollars in thousands)
(Unaudited)
|
|
|
Book Value |
|
Square Footage |
|
|
|
|
|
|
|
|
|
|
|
Land |
|
$ |
474,859 |
|
|
|
|
Buildings and building improvements |
|
3,249,866 |
|
|
|
|
|
Other improvements |
|
179,230 |
|
|
|
|
|
Gross book value of real estate – operating properties |
|
3,903,955 |
|
11,184,491 |
|
|
|
Less: Accumulated depreciation |
|
(520,647 |
) |
|
|
|
|
Rental properties, net |
|
3,383,308 |
|
|
|
|
|
Land held for future development (1) |
|
255,025 |
|
4,825,000 |
|
|
|
Construction in progress: |
|
|
|
|
|
|
|
Redevelopment |
|
135,521 |
|
575,152 |
|
|
|
Development |
|
407,084 |
|
980,000 |
|
|
|
Preconstruction |
|
617,964 |
|
5,229,000 |
|
|
|
New markets and other projects |
|
240,226 |
(2) |
1,057,000 |
(2) |
|
|
Construction in progress |
|
1,400,795 |
|
7,841,152 |
|
|
|
Real estate, net |
|
5,039,128 |
|
23,850,643 |
|
|
|
Add: Accumulated depreciation |
|
520,647 |
|
|
|
|
|
Gross book value of real estate |
|
$ |
5,559,775 |
|
23,850,643 |
|
(1) Excludes a parcel with approximately 442,000 rentable square feet in New York City that we have an option to ground lease for future development and a 924,000 developable square feet parcel in Edinburgh, Scotland that we have a long-term right to purchase.
(2) Includes approximately 410,000 rentable square feet related to our project in New York City and approximately 547,000 rentable square feet related to two ground-up development projects in China.
ALEXANDRIA
REAL ESTATE EQUITIES, INC.
Value Add Activities
December 31, 2009
(Unaudited)
Construction in progress includes the following value add activities (dollars in thousands, except for per square footage data):
|
Value Add Activities |
|
Amount |
|
Square Feet |
|
Cost per Square Foot |
|
||
|
|
|
|
|
|
|
|
|
||
|
Redevelopment projects |
|
$ |
135,521 |
|
575,152 |
|
$ |
236 |
|
|
|
|
|
|
|
|
|
|
||
|
Development projects |
|
407,084 |
|
980,000 |
|
415 |
|
||
|
|
|
|
|
|
|
|
|
||
|
Preconstruction projects |
|
617,964 |
|
5,229,000 |
|
118 |
|
||
|
|
|
|
|
|
|
|
|
||
|
New markets and other projects |
|
240,226 |
|
1,057,000 |
|
227 |
|
||
|
|
|
|
|
|
|
|
|
||
|
Total |
|
$ |
1,400,795 |
|
7,841,152 |
|
$ |
179 |
|
A key component of our business model is our value add redevelopment and development programs. These programs are focused on providing high quality generic office/laboratory space to meet the real estate requirements and are reusable by various life science industry tenants. Upon completion, each value add project is expected to generate significant revenues and cash flows. Our redevelopment and development projects are generally in locations highly desirable by life science entities which we believe results in higher occupancy levels, longer lease terms and higher rental income and returns. Redevelopment projects consist of the permanent change in use of office, warehouse and shell space into generic office/laboratory space, including the conversion of single tenancy space to multi-tenancy spaces or multi-tenancy spaces to single tenancy space. Our investment in redevelopment projects generally range from $75-150 per square foot depending on the nature of the existing building improvement and office/laboratory design. Development projects consist of the ground-up development of generic office/laboratory facilities. We also have certain significant value add projects undergoing important and substantial preconstruction activities to bring these assets to their intended use. These critical activities add significant value for future ground-up development (which are projected to yield substantial revenues) and are required for the ultimate vertical construction of buildings.
ALEXANDRIA
REAL ESTATE EQUITIES, INC.
Value Add Activities
December 31, 2009
(continued)
(Unaudited)
The following table summarizes total rentable square footage undergoing redevelopment:
|
Markets/Submarkets |
|
Placed |
|
Estimated |
|
Rentable |
|
Redevelopment/Leasing Status |
|
|
|
|
|
|
|
|
|
|
|
|
|
California – San Diego/Torrey Pines |
|
2007 |
|
2010 |
|
84,504 / 84,504 |
|
Construction/Marketing; Negotiating |
|
|
|
|
|
|
|
|
|
|
|
|
|
California – San Diego/Torrey Pines |
|
2007 |
|
2010 |
|
31,927 / 76,084 |
|
Construction/73% Leased; Marketing Remainder |
|
|
|
|
|
|
|
|
|
|
|
|
|
Eastern Massachusetts/Cambridge |
|
2007 |
|
2010 |
|
85,149 / 366,412 |
|
Construction/Leased; Committed |
|
|
|
|
|
|
|
|
|
|
|
|
|
Eastern Massachusetts/Cambridge |
|
2009 |
|
2011 |
|
17,114 / 194,776 |
|
Design/Marketing |
|
|
|
|
|
|
|
|
|
|
|
|
|
Eastern Massachusetts/Suburban |
|
2007 |
|
2010 |
|
113,045 / 113,045 |
|
Construction/Marketing |
|
|
|
|
|
|
|
|
|
|
|
|
|
Eastern Massachusetts/Suburban |
|
2008 |
|
2010 |
|
30,000 / 30,000 |
|
Design; Construction/Marketing |
|
|
|
|
|
|
|
|
|
|
|
|
|
Southeast/Florida |
|
2006 |
|
2010 |
|
21,191 / 44,855 |
|
Construction/Marketing; Negotiating |
|
|
|
|
|
|
|
|
|
|
|
|
|
Suburban Washington, D.C./Shady Grove |
|
2009 |
|
2010 |
|
58,632 / 58,632 |
|
Design; Construction/Leased |
|
|
|
|
|
|
|
|
|
|
|
|
|
Suburban Washington, D.C./Shady Grove |
|
2007 |
|
2010 |
|
50,633 / 123,501 |
|
Construction/Negotiating for All Space |
|
|
|
|
|
|
|
|
|
|
|
|
|
Suburban Washington, D.C./Shady Grove |
|
2009 |
|
2011 |
|
82,957 / 157,974 |
|
Design/Negotiating for Full Bldg User |
|
|
|
|
|
|
|
|
|
|
|
|
|
|
|
|
|
|
|
575,152 / 1,249,783 |
|
|
|
As of December 31, 2009, our estimated cost to complete was approximately $93 per rentable square foot for the 575,152 rentable square feet undergoing a permanent change in use to office/laboratory space through redevelopment. Our final costs for these projects will ultimately depend on many factors, including construction and infrastructure requirements for each tenant, final lease negotiations and the amount of costs funded by each tenant.
ALEXANDRIA
REAL ESTATE EQUITIES, INC.
Value Add Activities
December 31, 2009
(continued)
(Unaudited)
The following table summarizes our properties undergoing ground-up development (dollars in thousands):
|
Markets/Submarkets |
|
Building |
|
Estimated |
|
Leased/ |
|
Rentable |
|
Leasing Status |
|
|
|
|
|
|
|
|
|
|
|
|
|
|
|
California
- San Francisco Bay/ |
|
Multi-tenant
Bldg. |
|
2010 |
|
98% |
|
158,000 |
|
158,000 Rentable Square Feet Leased or Committed to UCSF and a Large Cap Life Science Company |
|
|
|
|
|
|
|
|
|
|
|
|
|
|
|
California
- San Francisco Bay/ |
|
Single
or Multi-tenant |
|
2011 |
|
65% |
|
105,000 |
|
Negotiating Lease for Significant Amount of Space with a Large Cap Life Science Company |
|
|
|
|
|
|
|
|
|
|
|
|
|
|
|
California
- San Francisco Bay/ |
|
Two
Bldgs., |
|
2010 |
|
0% |
|
162,000 |
|
Redesign for Multi-Tenancy at Both Buildings/ Marketing |
|
|
|
|
|
|
|
|
|
|
|
|
|
|
|
California
- San Francisco Bay/ |
|
Single Tenant Bldg. |
|
2010 |
|
55% |
|
130,000 |
|
72,000 Rentable Square Feet Leased to Exelixis Inc.; Marketing |
|
|
|
|
|
|
|
|
|
|
|
|
|
|
|
New
York - New York City – |
|
Multi-tenant
Bldg. |
|
2010/2011 |
|
100% |
|
310,000 |
|
100,000 Rentable Square Feet Leased to Eli Lilly and Company; Leasing 57,000 Rentable Square Feet for Food, Conference and Core Services; Current Office/Laboratory Negotiations for All Remaining Space |
|
|
|
|
|
|
|
|
|
|
|
|
|
|
|
Washington - Seattle |
|
Single
Tenant |
|
2010 (1) |
|
100% |
|
115,000 |
|
109,000 Rentable Square Feet Leased to Gilead Sciences, Inc. |
|
|
|
|
|
|
|
|
|
|
|
|
|
|
|
Total Properties Undergoing Ground-Up Development |
|
74% |
|
980,000 |
|
|
|
||||
(1) We delivered this space to Gilead Sciences, Inc. in the first week of February 2010.
As of December 31, 2009, our estimated cost to complete the approximately 980,000 rentable square feet undergoing ground-up development was approximately $140 per rentable square foot. This estimate includes costs related to tenant infrastructure costs, including requirements for executed leases with Eli Lilly and Company, Exelixis Inc., Gilead Sciences, Inc. and UCSF. This estimate also includes certain costs related to incremental investment by the Company with incremental returns which are beyond the original estimated investment anticipated at the beginning of each project. Our final costs for these projects will ultimately depend on many factors, including construction and infrastructure requirements for each tenant, final lease negotiations and the amount of costs funded by each tenant.
ALEXANDRIA
REAL ESTATE EQUITIES, INC.
Value Add Activities
December 31, 2009
(continued)
(Unaudited)
The following table summarizes our current and embedded future development and redevelopment square footage including preconstruction projects. Preconstruction projects include significant value add projects undergoing important and substantial activities to bring these assets to their intended use. These critical activities add significant value for future ground-up development (which are projected to yield substantial revenues and cash flows) and are required for the ultimate vertical construction of buildings.
|
|
|
Square Footage |
|
||||||||||||
|
|
|
|
|
|
|
|
|
|
|
||||||
|
|
|
Construction in Progress |
|
|
|
|
|
|
|
||||||
|
Markets |
|
Redevelopment |
|
Development |
|
Preconstruction |
|
New Markets and |
|
Land |
|
Future |
|
Total
Value Add |
|
|
|
|
|
|
|
|
|
|
|
|
|
|
|
|
|
|
|
California – San Diego |
|
116,431 |
|
– |
|
298,000 |
|
– |
|
145,000 |
|
178,000 |
|
737,431 |
|
|
|
|
|
|
|
|
|
|
|
|
|
|
|
|
|
|
|
California – San Francisco Bay/Mission Bay |
|
– |
|
263,000 |
|
2,320,000 |
|
– |
|
– |
|
– |
|
2,583,000 |
|
|
|
|
|
|
|
|
|
|
|
|
|
|
|
|
|
|
|
California – San Francisco Bay/So. San Francisco |
|
– |
|
292,000 |
|
144,000 |
|
– |
|
1,051,000 |
|
25,000 |
|
1,512,000 |
|
|
|
|
|
|
|
|
|
|
|
|
|
|
|
|
|
|
|
Eastern Massachusetts |
|
245,308 |
|
– |
|
2,019,000 |
|
– |
|
225,000 |
|
520,000 |
|
3,009,308 |
|
|
|
|
|
|
|
|
|
|
|
|
|
|
|
|
|
|
|
Suburban Washington, D.C. |
|
192,222 |
|
– |
|
– |
|
– |
|
787,000 |
|
415,000 |
|
1,394,222 |
|
|
|
|
|
|
|
|
|
|
|
|
|
|
|
|
|
|
|
Washington – Seattle |
|
– |
|
115,000 |
|
248,000 |
|
– |
|
1,049,000 |
|
165,000 |
|
1,577,000 |
|
|
|
|
|
|
|
|
|
|
|
|
|
|
|
|
|
|
|
International – Canada |
|
– |
|
– |
|
– |
|
– |
|
827,000 |
|
– |
|
827,000 |
|
|
|
|
|
|
|
|
|
|
|
|
|
|
|
|
|
|
|
Other |
|
21,191 |
|
310,000 |
|
200,000 |
|
1,057,000 |
|
741,000 |
|
222,000 |
|
2,551,191 |
|
|
|
|
|
|
|
|
|
|
|
|
|
|
|
|
|
|
|
Total |
|
575,152 |
|
980,000 |
|
5,229,000 |
|
1,057,000 |
(2) |
4,825,000 |
(3) |
1,525,000 |
(4) |
14,191,152 |
|
|
(1) |
|
See further discussion on page 37. |
|
(2) |
|
Includes approximately 410,000 rentable square feet related to our project in New York City and approximately 547,000 rentable square feet related to two ground-up development projects in China. |
|
(3) |
|
Excludes a parcel with approximately 442,000 rentable square feet in New York City that we have an option to ground lease for future development and a 924,000 developable square feet parcel in Edinburgh, Scotland that we have a long-term right to purchase. |
|
(4) |
|
Square footage related to future redevelopment is included in our operating asset base and represents non-laboratory uses (office, industrial or warehouse) for future conversion to office/laboratory space. |
ALEXANDRIA
REAL ESTATE EQUITIES, INC.
Value Add Activities
December 31, 2009
(continued)
(Unaudited)
Our significant value add projects include preconstruction activities at certain land parcels including: a) approximately 2.5 million developable square feet in San Francisco, including approximately 2.3 million developable square feet at Mission Bay, b) approximately 2.0 million developable square feet in Eastern Massachusetts, including approximately 1.7 million developable square feet located along Binney Street in Kendall Square and c) approximately 1.3 million developable square feet located in other key life science cluster markets.
San Francisco Bay – Mission Bay and South San Francisco Value Add Preconstruction Activities
The value add preconstruction activities in Mission Bay and South San Francisco will create high quality space in state-of-the-art environmentally sustainable facilities for our clients generating net operating income for the Company. The entitlement process includes a multitude of activities necessary for the vertical construction of these high quality facilities including, among other items, regulatory approval, mapping, conceptual design, schematic design, design development, permitting, construction drawings and estimating. Our value add projects in Mission Bay and South San Francisco, that have been completed or are now under construction, have attracted Merck & Co., Inc., Celgene Corporation, Pfizer Inc., Roche Holdings Ltd and University of California, San Francisco.
The ability to provide significant additional space in high quality state-of-the-art environmentally sustainable facilities at Mission Bay is a unique opportunity to enhance our current high quality client tenant roster. In addition to the opportunities located at Mission Bay, our asset base contains a broad pipeline of opportunities located in South San Francisco. This includes, among others, a high quality facility with entitlements completed or in process totaling over 275,000 square feet and a four building campus totaling an additional 405,000 square feet located nearby existing well established and emerging life science companies in South San Francisco.
The Alexandria Center for Science and Technology at Mission Bay (“The Alexandria Center”) when completed will consist of 13 high quality facilities totaling approximately 2.7 million rentable square feet. The Alexandria Center is organized into four discrete but highly interactive and collaborative campuses: the north campus which includes the 455 Mission Bay Boulevard project leased to Pfizer Inc.; the east campus, featuring the ability to accommodate a corporate headquarters facility of more than one million square feet; the south campus which is directly across the street from the UCSF hospital complex and likely to become an important location for physicians, clinicians and translational researchers; and the west campus which features a wide range of unique life science client tenant spaces.
ALEXANDRIA
REAL ESTATE EQUITIES, INC.
Value Add Activities
December 31, 2009
(continued)
(Unaudited)
San Francisco Bay – Mission Bay and South San Francisco Value Add Preconstruction Activities (continued)
At the heart of Mission Bay is UCSF, one of the nation’s top generators of life science commercial enterprises and the number two recipient of grants from the National Institutes of Health. At least 75 California life science companies, including two of the largest, Genentech, Inc. (now a subsidiary of Roche) and Chiron Corporation (now a subsidiary of Novartis AG), have been successfully launched by UCSF faculty or alumni. UCSF’s expansion of major research functions to its Mission Bay campus serves as a hub for basic scientific inquiry and a meeting place for academics from around the world. The wide range of UCSF’s sophisticated laboratories include the Center for Advanced Technology, as well as significant efforts in structural and chemical biology, molecular, cell and developmental biology, advanced microscopy, neurology and cardiology. Finally, the UCSF Mission Bay hospital campus is in the design phase, and will initially offer 280 beds in an integrated facility to serve women, children and cancer patients. The overriding emphasis of this array of diverse life science entities is to translate research discoveries into viable commercial products to solve critical unmet medical needs.
Eastern Massachusetts Value Add Preconstruction Activities
The largest ongoing value add project in Eastern Massachusetts is located on multiple sites along Binney Street in Kendall Square. Located in the eastern part of Cambridge close to downtown Boston, the Kendall Square neighborhood abuts the Massachusetts Institute of Technology (“MIT”) campus and is a short subway or bike ride from Harvard University (“Harvard”). MIT and Harvard are two of the leading universities for life science and technology research, each with a long and successful history of translational collaborations between academic scientists and industry. Working with local venture capitalists and experienced entrepreneurs, the universities have created leading biotech companies such as Genzyme Corporation and Biogen Idec and well over a hundred smaller life science firms in Cambridge alone. This fertile science and technology ecosystem has subsequently attracted investment by leading international pharmaceutical companies such as Novartis and GlaxoSmithKline, and has led to the creation of important new independent research organizations in Cambridge, such as the Broad Institute and the Whitehead Institute for Biomedical Research.
In February 2009, the Cambridge City Council approved our petition to significantly increase the zoning density on our Binney Street holdings, enabling the future development of up to 1.7 million rentable square feet of office/laboratory space on multiple adjacent sites. These sites currently hold income-producing low-rise buildings and surface parking lots, which, we believe, will eventually be replaced by high quality life science facilities in this desirable, land-constrained location. We will continue to advance our entitlement efforts for this assemblage, including the procurement of a Planned Unit Development Special Permit under the City’s Zoning Ordinance.
Immediately adjacent to the Binney Street sites, we will transition from design into construction for the conversion into office/laboratory space of an approximately 85,000 rentable square foot portion of an existing office building known as Athenaeum Center. The balance of the approximately 366,000 rentable square foot office building is substantially leased. Delivery of the office/laboratory conversion space is scheduled to occur over the next one to two years.
ALEXANDRIA
REAL ESTATE EQUITIES, INC.
Value Add Activities
December 31, 2009
(continued)
(Unaudited)
Eastern Massachusetts Value Add Preconstruction Activities (continued)
Elsewhere in the Eastern Massachusetts region, design activities are ongoing at Longwood Center, our approximately 350,000 rentable square foot life science development located on a 1.0 acre parcel in the heart of Boston’s Longwood Medical Area (“LMA”). This project, partnered with a local development/investment group, has been entitled under the City of Boston’s site plan review process. The LMA is a compact and vibrant district which is home to world-renowned medical and academic institutions such as Harvard Medical School, Brigham & Womens’ Hospital, Dana Farber Cancer Institute, Childrens’ Hospital Boston, Beth Israel Deaconess Medical Center, and Joslin Diabetes Center, among several others. Fully entitled land sites are extremely scarce in the LMA and we believe that Longwood Center is well-positioned to accommodate expected growth within the district.
Among the completed value add projects in this region is the conversion of an approximately 175,000 square foot office building at Technology Square in Cambridge to office/laboratory use. This space has been substantially leased to Sirtris Pharmaceuticals, a GlaxoSmithKline company, the Novartis Institutes of Biomedical Research and a unit of Pfizer Inc. Another suburban building conversion resulted in a 59,000 square foot lease to a research division of Johnson & Johnson.
New Markets and Other Projects
A component of our business model also includes ground-up development projects in new markets and other unique projects. We have two development parcels in China. One development parcel is located in South China where a two-building project aggregating approximately 275,000 rentable square feet is under construction. This project is nearing shell completion. The second development parcel is located in North China where a two-building project aggregating approximately 272,000 rentable square feet is under construction.
Additionally, other projects include construction related to site work, plaza, park and underground parking at the Alexandria CenterTM for Life Science – New York City, a unique one-of-a-kind highly advanced state-of-the-art urban science park in the city and in the adjoining future building approximating 410,000 rentable square feet.
ALEXANDRIA
REAL ESTATE EQUITIES, INC.
Summary
of Capital Expenditures
Five Year History
(Unaudited)
|
|
|
Five-Year |
|
Year Ended December 31, |
|
||||||||||||||
|
|
|
|
|
|
|
|
|
|
|
|
|
|
|
||||||
|
|
|
Average |
|
2009 |
|
2008 |
|
2007 |
|
2006 |
|
2005 |
|
||||||
|
|
|
|
|
|
|
|
|
|
|
|
|
|
|
||||||
|
Capital expenditures (1): |
|
|
|
|
|
|
|
|
|
|
|
|
|
||||||
|
|
|
|
|
|
|
|
|
|
|
|
|
|
|
||||||
|
Major capital expenditures |
|
$ |
772,000 |
|
$ |
529,000 |
|
$ |
405,000 |
|
$ |
1,379,000 |
|
$ |
575,000 |
|
$ |
972,000 |
|
|
|
|
|
|
|
|
|
|
|
|
|
|
|
|
||||||
|
Recurring capital expenditures |
|
$ |
985,000 |
|
$ |
1,405,000 |
|
$ |
955,000 |
|
$ |
648,000 |
|
$ |
639,000 |
|
$ |
1,278,000 |
|
|
|
|
|
|
|
|
|
|
|
|
|
|
|
|
||||||
|
Square feet in portfolio |
|
10,581,399 |
|
11,740,993 |
|
11,770,769 |
|
11,476,217 |
|
9,790,326 |
|
8,128,690 |
|
||||||
|
|
|
|
|
|
|
|
|
|
|
|
|
|
|
||||||
|
Per square foot: |
|
|
|
|
|
|
|
|
|
|
|
|
|
||||||
|
|
|
|
|
|
|
|
|
|
|
|
|
|
|
||||||
|
Major capital expenditures |
|
$ |
0.07 |
|
$ |
0.05 |
|
$ |
0.03 |
|
$ |
0.12 |
|
$ |
0.06 |
|
$ |
0.12 |
|
|
|
|
|
|
|
|
|
|
|
|
|
|
|
|
||||||
|
Recurring capital expenditures |
|
$ |
0.09 |
|
$ |
0.12 |
|
$ |
0.08 |
|
$ |
0.06 |
|
$ |
0.07 |
|
$ |
0.16 |
|
|
|
|
|
|
|
|
|
|
|
|
|
|
|
|
||||||
|
Tenant improvements and leasing costs: |
|
|
|
|
|
|
|
|
|
|
|
|
|
||||||
|
|
|
|
|
|
|
|
|
|
|
|
|
|
|
||||||
|
Re-tenanted space (2) |
|
|
|
|
|
|
|
|
|
|
|
|
|
||||||
|
|
|
|
|
|
|
|
|
|
|
|
|
|
|
||||||
|
Tenant improvements and leasing costs |
|
$ |
1,619,000 |
|
$ |
1,475,000 |
|
$ |
3,481,000 |
|
$ |
1,446,000 |
|
$ |
1,370,000 |
|
$ |
324,000 |
|
|
|
|
|
|
|
|
|
|
|
|
|
|
|
|
||||||
|
Re-tenanted square feet |
|
264,382 |
|
211,638 |
|
505,773 |
|
224,767 |
|
248,846 |
|
130,887 |
|
||||||
|
|
|
|
|
|
|
|
|
|
|
|
|
|
|
||||||
|
Per square foot |
|
$ |
6.12 |
|
$ |
6.97 |
|
$ |
6.88 |
|
$ |
6.43 |
|
$ |
5.51 |
|
$ |
2.48 |
|
|
|
|
|
|
|
|
|
|
|
|
|
|
|
|
||||||
|
Renewal space |
|
|
|
|
|
|
|
|
|
|
|
|
|
||||||
|
|
|
|
|
|
|
|
|
|
|
|
|
|
|
||||||
|
Tenant improvements and leasing costs |
|
$ |
1,861,000 |
|
$ |
3,263,000 |
|
$ |
2,364,000 |
|
$ |
1,942,000 |
|
$ |
957,000 |
|
$ |
778,000 |
|
|
|
|
|
|
|
|
|
|
|
|
|
|
|
|
||||||
|
Renewal square feet |
|
703,645 |
|
976,546 |
|
748,512 |
|
671,127 |
|
455,980 |
|
666,058 |
|
||||||
|
|
|
|
|
|
|
|
|
|
|
|
|
|
|
||||||
|
Per square foot |
|
$ |
2.64 |
|
$ |
3.34 |
|
$ |
3.16 |
|
$ |
2.89 |
|
$ |
2.10 |
|
$ |
1.17 |
|
The table above shows the five-year average per square foot property-related capital expenditures, tenant improvements and leasing costs (excluding capital expenditures and tenant improvements that are recoverable from tenants, revenue-enhancing or related to properties that have undergone redevelopment).
|
(1) |
|
Property-related capital expenditures include all major capital and recurring capital expenditures except capital expenditures that are recoverable from tenants, revenue-enhancing capital expenditures, or costs related to the redevelopment of a property. Major capital expenditures consist of roof replacements and HVAC systems that are typically identified and considered at the time a property is acquired. |
|
(2) |
|
Excludes space that has undergone redevelopment before re-tenanting. |
ALEXANDRIA
REAL ESTATE EQUITIES, INC.
Definitions
and Other Information
December 31, 2009
(Unaudited)
This section contains additional information for sections throughout this supplemental information package as well as explanations of certain non-GAAP financial measures in sections of this document and the reasons why management believes these measures provide useful information to investors about our financial condition, results of operations or liquidity. Additional detail can be found in our most recent annual report on Form 10-K and subsequent quarterly reports on Form 10-Q, as well as other documents filed with or furnished to the SEC from time to time.
Adjusted Funds from Operations
Adjusted Funds from Operations (“AFFO”) is a non-GAAP financial measure we believe is a useful supplemental measure of our performance. We compute AFFO attributable to Alexandria Real Estate Equities, Inc.’s common stockholders by adding to or deducting from FFO attributable to Alexandria Real Estate Equities, Inc.’s common stockholders (i) recurring and non-recurring capital expenditures required to maintain and re-tenant our properties, (ii) second generation tenant improvements and leasing costs on re-tenanted and renewal space (excludes redevelopment expenditures), (iii) capitalized income from development projects, (iv) gain on early extinguishment of debt, (v) amortization of loan fees, debt premiums/discounts and acquired above and below market leases, (vi) effects of deferred rent and deferred rent on ground leases, (vii) non-cash compensation expense related to restricted stock awards and (viii) other non-cash income or charges, including impairment charges. AFFO is not intended to represent cash flow for the period, and is only intended to provide an additional measure of performance by adjusting the effect of certain items noted above included in FFO, as well as recurring capital expenditures and leasing costs. We believe that net income attributable to Alexandria Real Estate Equities, Inc.’s common stockholders is the most directly comparable GAAP financial measure to AFFO attributable to Alexandria Real Estate Equities, Inc.’s common stockholders. We also believe that AFFO attributable to Alexandria Real Estate Equities, Inc.’s common stockholders provides useful performance information to the investment community about our financial position as compared to other REITs since AFFO is a widely reported measure used by other REITs. However, other REITs may use different methodologies for calculating AFFO and, accordingly, our AFFO may not be comparable to other REITs.
Capitalized interest
A key component of our business model is our value add redevelopment and development programs. These programs are focused on providing high quality generic office/laboratory space to meet the real estate requirements and are reusable by various life science industry tenants. Upon completion, each value add project is expected to generate significant revenues and cash flows. Our redevelopment and development projects are generally in locations highly desirable by life science entities which we believe results in higher occupancy levels, longer lease terms and higher rental income and returns. Redevelopment projects consist of the permanent change in use of office, warehouse and shell space into generic office/laboratory space, including the conversion of single tenancy space to multi-tenancy spaces or multi-tenancy spaces to single tenancy space. Development projects consist of the ground-up development of generic office/laboratory facilities. We also have certain significant value add projects undergoing important and substantial preconstruction activities to bring these assets to their intended use. These critical activities add significant value for future ground-up development and are required for the ultimate vertical construction of buildings. Ultimately, these land parcels will provide valuable opportunities for new ground-up construction projects. The projects will provide high quality facilities for the life science industry and will generate significant revenue and cash flows for the Company. We are required to capitalize construction and preconstruction costs directly related and essential to the construction of a project while activities are ongoing to prepare an asset for its intended use. Capitalized interest assuming conversion of our 8% unsecured convertible notes for the three months ended December 31, 2009 was approximately $19.0 million. The interest rate required for the purpose of calculating capitalization of interest was approximately 5.42% for the three months ended December 31, 2009 assuming conversion of our 8% unsecured convertible notes.
ALEXANDRIA
REAL ESTATE EQUITIES, INC.
Definitions
and Other Information (continued)
December 31, 2009
(Unaudited)
Debt to Adjusted EBITDA
Debt to Adjusted EBITDA is the ratio of net debt (secured notes payable, unsecured line of credit, unsecured term loan and unsecured convertible notes less cash, cash equivalents and escrowed cash related to construction projects) to Adjusted EBITDA. Debt to Adjusted EBITDA is a common used measure of leverage. However, since this ratio is derived from Adjusted EIBTDA, its usefulness is limited by the same factors that limit the usefulness of Adjusted EBITDA. Further, our computation of Debt to Adjusted EBITDA may not be comparable to similar ratios reported by other companies.
Debt to Gross Assets
Debt to gross assets is the ratio of net debt (secured notes payable, unsecured line of credit, unsecured term loan and unsecured convertible notes less cash, cash equivalents and escrowed cash related to construction projects) to gross assets. Gross assets is equal to total assets plus accumulated depreciation less cash, cash equivalents and escrowed cash related to construction projects.
Dividend Payout Ratio
Dividend payout ratio (common stock) is the ratio of the absolute dollar amount of dividends on our common stock (shares of common stock outstanding on the respective record date multiplied by the related dividend per share) to FFO attributable to Alexandria Real Estate Equities, Inc.’s common stockholders on a diluted basis. Historical amounts include the retrospective impact of new accounting provisions adopted on January 1, 2009 related to accounting for and disclosure of convertible debt, noncontrolling interests and participating securities.
Earnings per Share
We account for unvested restricted stock awards which contain nonforfeitable rights to dividends as participating securities and include these securities in the computation of earnings per share using the two-class method. Under the two-class method, we allocate net income after preferred stock dividends and amounts attributable to noncontrolling interests to common stockholders and unvested restricted stock awards based on their respective participation rights to dividends declared (or accumulated) and undistributed earnings. Diluted earnings per share is computed using the weighted average shares of common stock outstanding determined for the basic earnings per share computation plus the effect of any dilutive securities, including the dilutive effect of stock options using the treasury stock method.
We applied the “if-converted” method for our 8% unsecured senior convertible notes (“8% Unsecured Convertible Notes”). In applying the “if-converted” method, conversion is assumed for purposes of calculating diluted earnings per share if the effect would be dilutive to earnings per share. A separate calculation is performed for FFO per share. If the assumed conversion pursuant to the “if-converted” method is dilutive, diluted earnings per share would be calculated by adding back interest charges applicable to our 8% Unsecured Convertible Notes to the numerator and our 8% Unsecured Convertible Notes would be assumed to have been converted at the beginning of the period presented (if outstanding for the entire period) and the resulting incremental shares associated with the assumed conversion would be included in the denominator. For purposes of calculating diluted earnings per share, the “if-converted method was dilutive to diluted earnings per share only for the three months ended June 30, 2009.
ALEXANDRIA REAL ESTATE EQUITIES, INC.
Definitions
and Other Information (continued)
December 31, 2009
(Unaudited)
EBITDA and Adjusted EBITDA
EBITDA represents earnings before interest, taxes, depreciation and amortization (“EBITDA”), a non-GAAP financial measure, and is used as a supplemental measure of operating performance. Adjusted EBITDA is calculated as EBITDA excluding impairments, gains or losses from sales of real estate, gains or losses on early extinguishment of debt and net stock compensation expenses. We use EBITDA and Adjusted EBITDA as a supplemental measure of our operating performance. We consider Adjusted EBITDA to provide investors relevant and useful information because it permits investors to view income from our operations on an unleveraged basis before the effects of taxes, non-cash depreciation and amortization, impairments, gains or losses from sales of real estate, gains or losses on early extinguishment of debt and net stock compensation expenses. By excluding interest expense, EBITDA and Adjusted EBITDA allow investors to measure our operating performance independent of our capital structure and indebtedness and, therefore, allow for a more meaningful comparison of our operating performance to that of other companies, both in the real estate industry and in other industries. We believe investors should consider EBITDA and Adjusted EBITDA, in conjunction with net income (the primary measure of our performance) and the other required United States generally accepted accounting principles (“GAAP”) measures of our performance, to improve their understanding of our operating results, and to make more meaningful comparisons of our performance between periods and as against other companies. EBITDA and Adjusted EBITDA have limitations as analytical tools and should be used in conjunction with our required GAAP presentations. EBITDA and Adjusted EBITDA do not reflect our historical cash expenditures or future cash requirements for capital expenditures or contractual commitments. While EBITDA and Adjusted EBITDA are relevant and widely used measures of operating performance, it does not represent net income or cash flow from operations as defined by GAAP and it should not be considered as an alternative to those indicators in evaluating operating performance or liquidity. Further, our computation of EBITDA and Adjusted EBITDA may not be comparable to similar measures reported by other companies.
The following table reconciles net income to EBITDA and Adjusted EBITDA (in thousands):
|
|
|
Year Ended |
|
Three Months Ended |
|
|||||||||||||||||
|
|
|
12/31/09 |
|
12/31/08 (1) |
|
12/31/09 |
|
9/30/09 |
|
6/30/09 |
|
3/31/09 |
|
12/31/08 (1) |
|
|||||||
|
Net income |
|
$ |
141,648 |
|
$ |
120,097 |
|
$ |
29,905 |
|
$ |
26,378 |
|
$ |
44,116 |
|
$ |
41,249 |
|
$ |
27,568 |
|
|
Add: Interest expense (2) |
|
82,273 |
|
86,548 |
|
19,453 |
|
21,225 |
|
21,373 |
|
20,222 |
|
21,521 |
|
|||||||
|
Add: Depreciation and amortization (2) |
|
118,508 |
|
108,743 |
|
29,004 |
|
28,336 |
|
29,722 |
|
31,446 |
|
28,483 |
|
|||||||
|
EBITDA |
|
342,429 |
|
315,388 |
|
78,362 |
|
75,939 |
|
95,211 |
|
92,917 |
|
77,572 |
|
|||||||
|
Add: Net stock compensation expenses |
|
14,051 |
|
13,677 |
|
3,194 |
|
4,141 |
|
3,694 |
|
3,022 |
|
3,563 |
|
|||||||
|
Add: Impairment on real estate |
|
– |
|
4,650 |
|
– |
|
– |
|
– |
|
– |
|
– |
|
|||||||
|
Add: Impairment on investments |
|
– |
|
13,251 |
|
– |
|
– |
|
– |
|
– |
|
11,266 |
|
|||||||
|
Subtract: Gain on sales of property |
|
(2,627 |
) |
(20,401 |
) |
(393 |
) |
– |
|
– |
|
(2,234 |
) |
(6 |
) |
|||||||
|
Subtract: Gain on early extinguishment of debt |
|
(11,254 |
) |
– |
|
– |
|
– |
|
(11,254 |
) |
– |
|
– |
|
|||||||
|
Adjusted EBITDA |
|
$ |
342,599 |
|
$ |
326,565 |
|
$ |
81,163 |
|
$ |
80,080 |
|
$ |
87,651 |
|
$ |
93,705 |
|
$ |
92,395 |
|
(1) Includes the retrospective impact of new accounting provisions adopted on January 1, 2009 related to accounting for and disclosure of convertible debt, noncontrolling interests and participating securities.
(2) Includes interest expense, depreciation and amortization for assets “held for sale” reflected as discontinued operations (for the periods prior to when such assets were designated as “held for sale”).
ALEXANDRIA REAL ESTATE EQUITIES, INC.
Definitions
and Other Information (continued)
December 31, 2009
(Unaudited)
Funds from Operations
GAAP basis accounting for real estate assets utilizes historical cost accounting and assumes real estate values diminish over time. In an effort to overcome the difference between real estate values and historical cost accounting for real estate assets, the Board of Governors of NAREIT established the measurement tool of Funds from Operations (“FFO”). Since its introduction, FFO has become a widely used non-GAAP financial measure among real estate investment trusts (“REITs”). We believe that FFO is helpful to investors as an additional measure of the performance of an equity REIT. We compute FFO in accordance with standards established by the Board of Governors of NAREIT in its April 2002 White Paper (the “White Paper”) and related implementation guidance, which may differ from the methodology for calculating FFO utilized by other equity REITs, and, accordingly, may not be comparable to such other REITs. The White Paper defines FFO as net income (loss) (computed in accordance with GAAP), excluding gains (or losses) from sales, plus real estate related depreciation and amortization, and after adjustments for unconsolidated partnerships and joint ventures.
FFO should not be considered as an alternative to net income (determined in accordance with GAAP) as an indication of financial performance, or to cash flows from operating activities (determined in accordance with GAAP) as a measure of our liquidity, nor is it indicative of funds available to fund our cash needs, including our ability to make distributions.
Same Property Comparisons
The summary of same property comparisons represents operating data for all properties that were fully operating for the entire periods presented for the quarter periods (the “Fourth Quarter Same Properties”) and for the full year periods (the “2009 Same Properties”). Same property occupancy for the quarters ended December 31, 2009 and 2008 was 94.1% and 95.7%, respectively. Same Property Occupancy for the years ended December 31, 2009 and 2008 was 95.1% and 95.6%, respectively. Properties undergoing redevelopment are excluded from same property results.
Revenue less operating expenses computed in accordance with GAAP is total revenue associated with the Fourth Quarter Same Properties and 2009 Same Properties, as applicable (excluding lease termination fees, if any), less property operating expenses. Under GAAP, rental revenue is recognized on a straight-line basis over the respective lease terms. Revenue less operating expenses on a cash basis is total revenue associated with the Fourth Quarter Same Properties and 2009 Same Properties (excluding lease termination fees, if any), less property operating expenses, adjusted to exclude the effect of straight-line rent adjustments required by GAAP. Straight-line rent adjustments for the quarters ended December 31, 2009 and 2008 for the Fourth Quarter Same Properties were $1,748,000 and $1,851,000, respectively. Straight-line rent adjustments for the years ended December 31, 2009 and 2008 for the 2009 Same Properties were $5,153,000 and $9,882,000, respectively. We believe that revenue less operating expenses on a cash basis is helpful to investors as an additional measure of operating performance because it eliminates straight-line rent adjustments to rental revenue.
Fees received from tenants in connection with termination of their leases, if any, are excluded from revenue in the Summary of Same Property Comparisons. As of December 31, 2009, approximately 88% of our leases (on a rentable square footage basis) were triple net leases, requiring tenants to pay substantially all real estate taxes and insurance, common area and other operating expenses, including increases thereto. In addition, approximately 8% of our leases (on a rentable square footage basis) required the tenants to pay a majority of operating expenses.
ALEXANDRIA REAL ESTATE EQUITIES, INC.
Definitions
and Other Information (continued)
December 31, 2009
(Unaudited)
Tangible Non-Real Estate Assets
Tangible non-real estate assets include the following as of each period presented (in thousands):
|
|
|
12/31/09 |
|
9/30/09 |
|
6/30/09 |
|
3/31/09 |
|
12/31/08 |
|
|||||
|
Cash and cash equivalents |
|
$ |
70,628 |
|
$ |
68,280 |
|
$ |
70,313 |
|
$ |
125,281 |
|
$ |
71,161 |
|
|
Tenant security deposits and other restricted cash |
|
47,291 |
|
60,002 |
|
51,683 |
|
54,770 |
|
67,782 |
|
|||||
|
Tenant receivables |
|
3,902 |
|
3,789 |
|
4,665 |
|
5,992 |
|
6,453 |
|
|||||
|
Investments |
|
72,882 |
|
71,080 |
|
66,068 |
|
64,788 |
|
61,861 |
|
|||||
|
Other tangible non-real estate assets |
|
32,737 |
|
35,925 |
|
31,287 |
|
32,475 |
|
33,773 |
|
|||||
|
Total tangible non-real estate assets |
|
$ |
227,440 |
|
$ |
239,076 |
|
$ |
224,016 |
|
$ |
283,306 |
|
$ |
241,030 |
|
Total Market Capitalization
Total market capitalization is equal to the sum of outstanding shares of series C preferred stock and common stock multiplied by the related closing price at the end of each period presented, the liquidation value of the series D cumulative convertible preferred stock and our share of total debt (secured notes payable, unsecured line of credit, unsecured term loan and unsecured convertible notes less cash, cash equivalents and escrowed cash related to construction projects). Historical amounts include the retrospective impact of new accounting provisions adopted on January 1, 2009 related to accounting for and disclosure of convertible debt, noncontrolling interests and participating securities.