Attached files
| file | filename |
|---|---|
| 8-K - FORM 8-K - TIDEWATER INC | d8k.htm |
| EX-99.2 - TRANSCRIPT OF PRESENTATION - TIDEWATER INC | dex992.htm |
 TIDEWATER TIDEWATER CREDIT SUISSE 2010 CREDIT SUISSE 2010 ENERGY SUMMIT ENERGY SUMMIT February 4, 2010 Quinn Fanning Quinn Fanning Executive Vice President, CFO Executive Vice President, CFO Joseph M. Bennett Joseph M. Bennett Executive Vice President and Executive Vice President and Chief Investor Relations Chief Investor Relations Officer Officer Exhibit 99.1 |
 2 TIDEWATER TIDEWATER 601 Poydras Street, Suite 1900 New Orleans, LA 70130 FORWARD-LOOKING STATEMENTS In accordance with the safe harbor provisions of the Private Securities Litigation Reform Act of
1995, the Company notes that certain statements set forth in this presentation provide
other than historical information and are forward looking. The actual achievement of
any forecasted results, or the unfolding of future economic or business developments in
a way anticipated or projected by the Company, involve numerous risks and uncertainties
that may cause the Company’s actual performance to be materially different from
that stated or implied in the forward-looking statement. Among those risks and
uncertainties, many of which are beyond the control of the Company, include, without
limitation, fluctuations in worldwide energy demand and oil and gas prices; fleet
additions by competitors and industry overcapacity; changes in capital spending by customers in the energy industry for offshore exploration, development and production; changing
customer demands for vessel specifications, which may make some of our older vessels
technologically obsolete for certain customer projects or in certain markets;
instability of global financial markets and difficulty accessing credit or capital;
acts of terrorism and piracy; significant weather conditions; unsettled political
conditions, war, civil unrest and governmental actions, such as expropriation,
especially in higher risk countries of operations; foreign currency fluctuations; labor
influences proposed by international conventions; and enforcement of laws related to the environment, labor and foreign corrupt practices. Participants should consider all of these risk factors as well as other information contained in the Company’s form 10-K’s and
10-Q’s. Phone: 504.568.1010 | Fax: 504.566.4580 | Web: www.tdw.com |
Email: connect@tdw.com |
 3 OUR NEW LOGO, AT OUR NEW LOGO, AT LEAST UNTIL SUNDAY !!! LEAST UNTIL SUNDAY !!! + = |
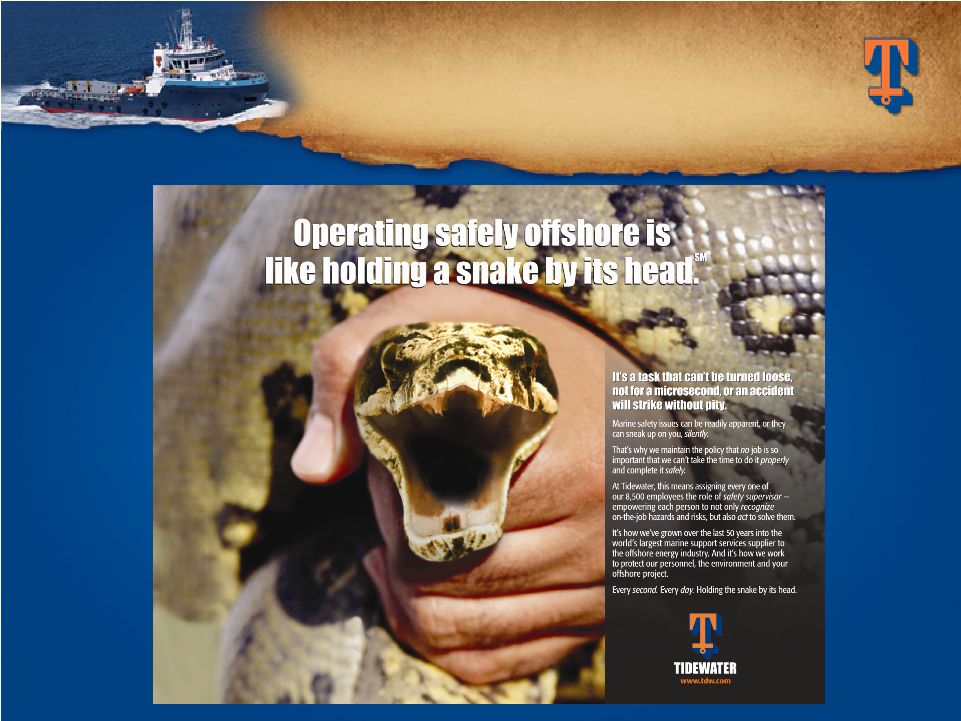 SAFETY
– SAFETY – A TOP PRIORITY A TOP PRIORITY |
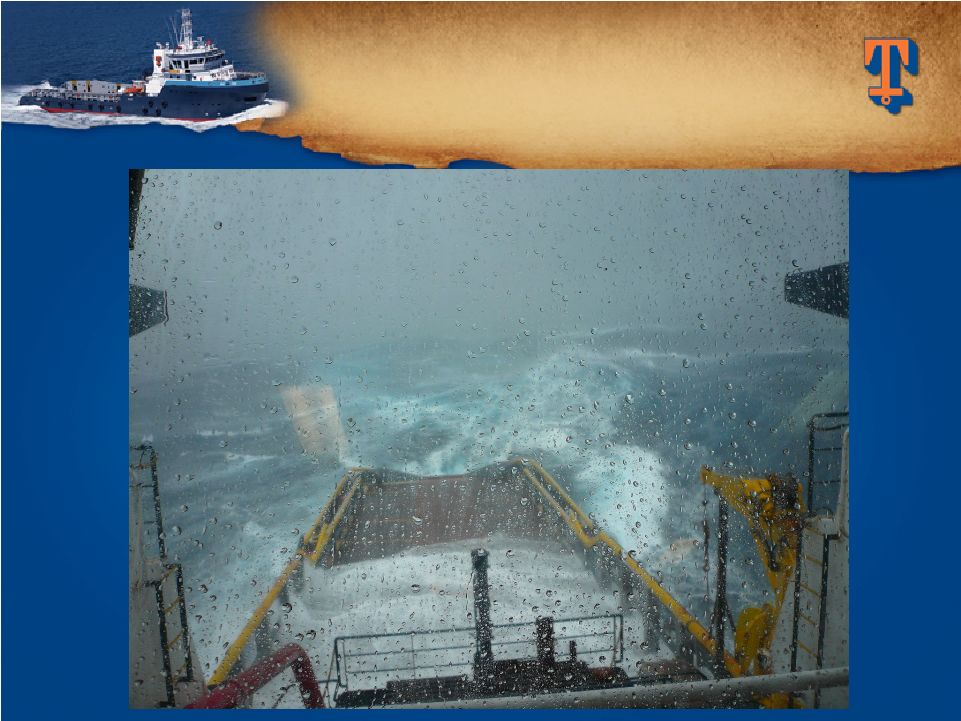 A
REMINDER OF A REMINDER OF OUR WORKPLACE OUR WORKPLACE |
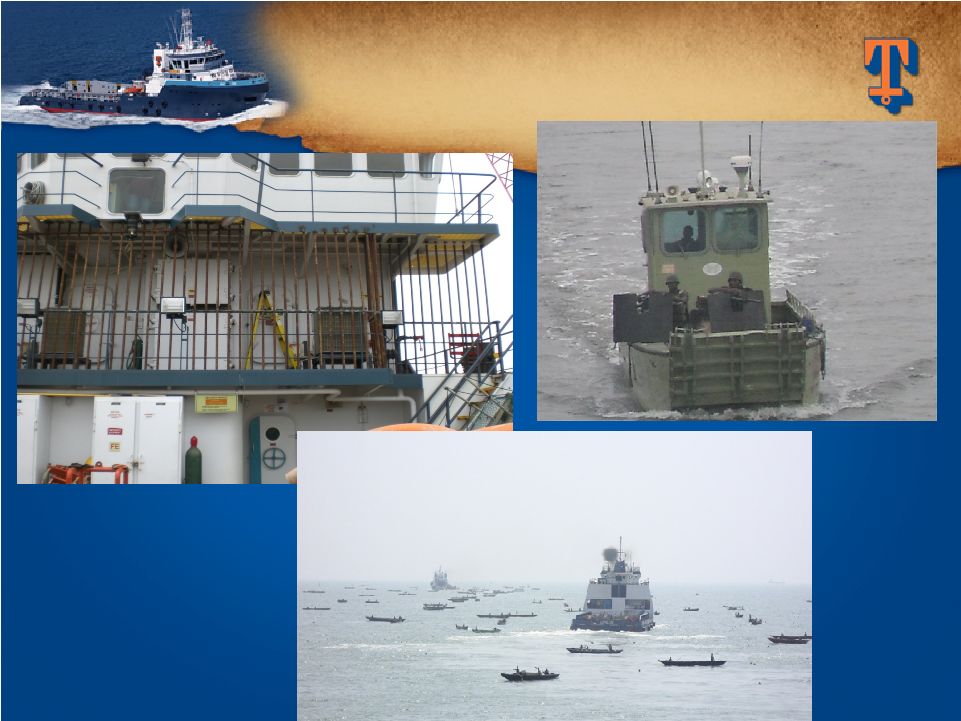 SECURING
OUR PEOPLE SECURING OUR PEOPLE AND ASSETS AND ASSETS |
 0.00 0.25 0.50 0.75 1.00 7 SAFETY RECORD RIVALS SAFETY RECORD RIVALS LEADING COMPANIES LEADING COMPANIES Total Recordable Incident Rates 2002 2003 2004 2005 2006 2007 Calendar Years 2008 TIDEWATER DOW CHEMICAL DUPONT EXXON/MOBIL BP |
 8 TIDEWATER TODAY TIDEWATER TODAY Solid safety record – One LTA and .18 TRIR in FY’09; good record YTD Unmatched (and growing) global footprint – 50+ years internationally and working in over 60 countries Fleet positioned to earn solid returns on a through-cycle basis – Third consecutive year of record earnings (19.3% Return on Average Equity over the last three fiscal years) Strong balance sheet – no net debt at December 31, 2009 Continuing to invest in new vessels with expanded capabilities, while disposing of older, more traditional vessels – 38 deliveries in last 21 months and 36 under construction or committed to purchase at 12/31/09 Track record of prudent capital management and of returning capital to shareholders – consistent paying of dividends and selective share repurchases historically (or in New Orleans (or in New Orleans slang “Who Dat”) slang “Who Dat”) |
 9 Culture is a competitive advantage • Safety-oriented • Deep knowledge of customer needs • Aggressive management of operating and capital costs Maintain maximum financial flexibility to deal with uncertainties Selectively deploy cash to renew fleet with expanded capabilities Opportunistically utilize balance sheet strength • Right acquisitions, right price, right time • Consistently focus on creating shareholder value OUR STRATEGY OUR STRATEGY (Not much has changed!) (Not much has changed!) |
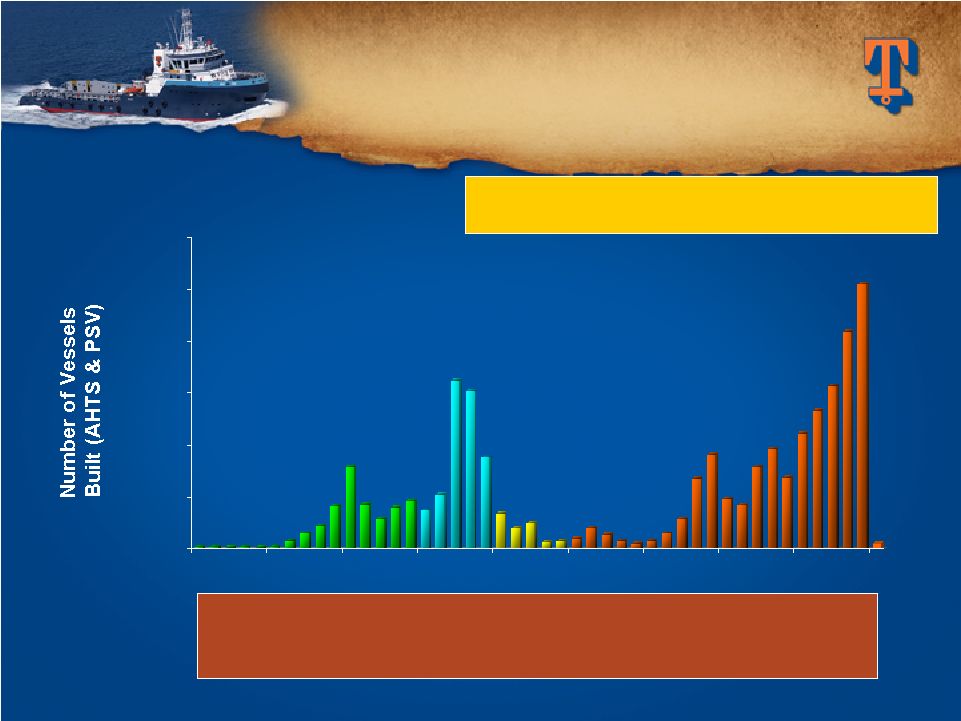 0 50 100 150 200 250 300 1965 1970 1975 1980 1985 1990 1995 2000 2005 2010 10 EXPECTED RETIREMENTS EXPECTED RETIREMENTS EXCEED NEW DELIVERIES EXCEED NEW DELIVERIES (Includes AHTS and PSV’s only) (Includes AHTS and PSV’s only) Estimated as of December 2009 Estimated as of December 2009 As of 12/31/09, there are approximately 523 additional AHTS and PSV’s under construction. Of the total 2,390 vessels, 333 vessels are 30+ yrs old, Of the total 2,390 vessels, 333 vessels are 30+ yrs old,
another 491 are 25-29 yrs old, another 491 are 25-29 yrs old, and 94 are 20-24 yrs old and 94 are 20-24 yrs old Source: ODS-Petrodata and Tidewater |
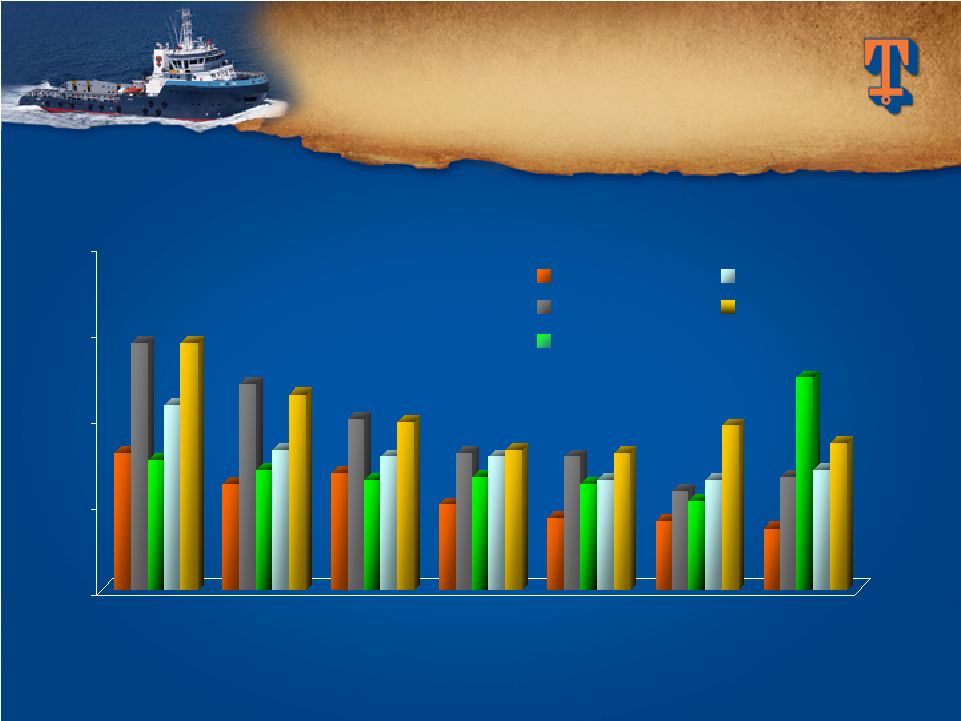
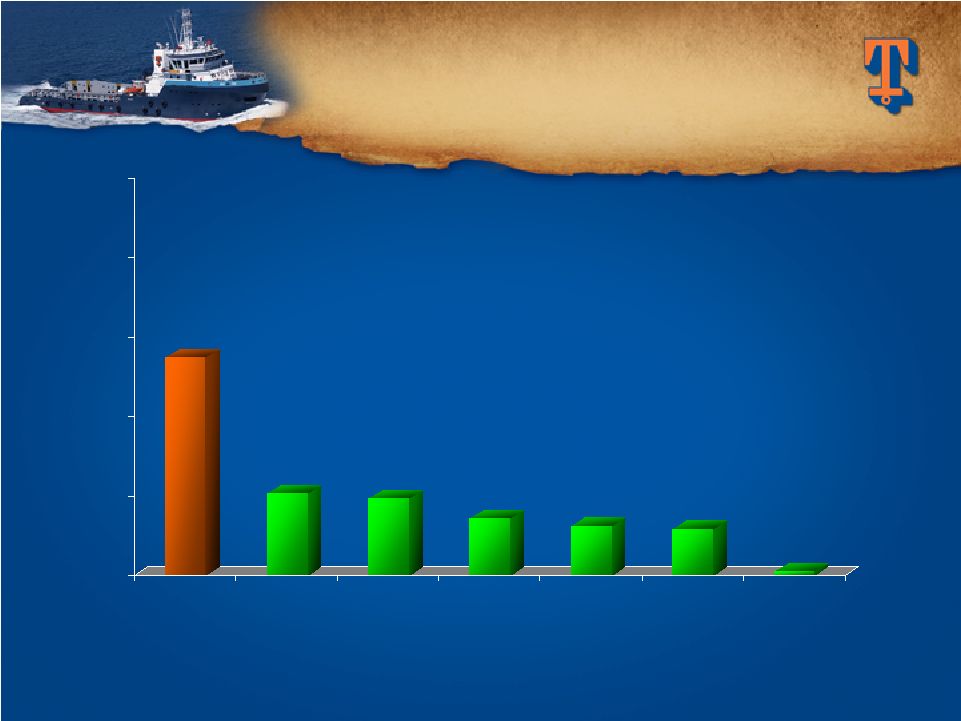 (Includes AHTS and PSV’s only) (Includes AHTS and PSV’s only) 11 VESSEL POPULATION VESSEL POPULATION BY OWNER BY OWNER Estimated as of December 2009 Estimated as of December 2009 Source: ODS-Petrodata and Tidewater Tidewater Competitor #2 Competitor #3 Competitor #4 Competitor # 5 Competitor #1 Avg. All Others (1,721 total vessels for 300+ owners) 275 104 97 72 62 59 5 |
 12 Current Vessel Demand Dynamics: 2,390 Global Vessel Count (AHTS & PSV only) 553 Global Working Rigs 4.3 Vessel to Rig Ratio Possible Incremental Vessel Demand: 145 New rigs under construction (???Cancellations???) VESSEL / RIG RATIO VESSEL / RIG RATIO Source: ODS-Petrodata and Tidewater Estimated as of December 2009
|
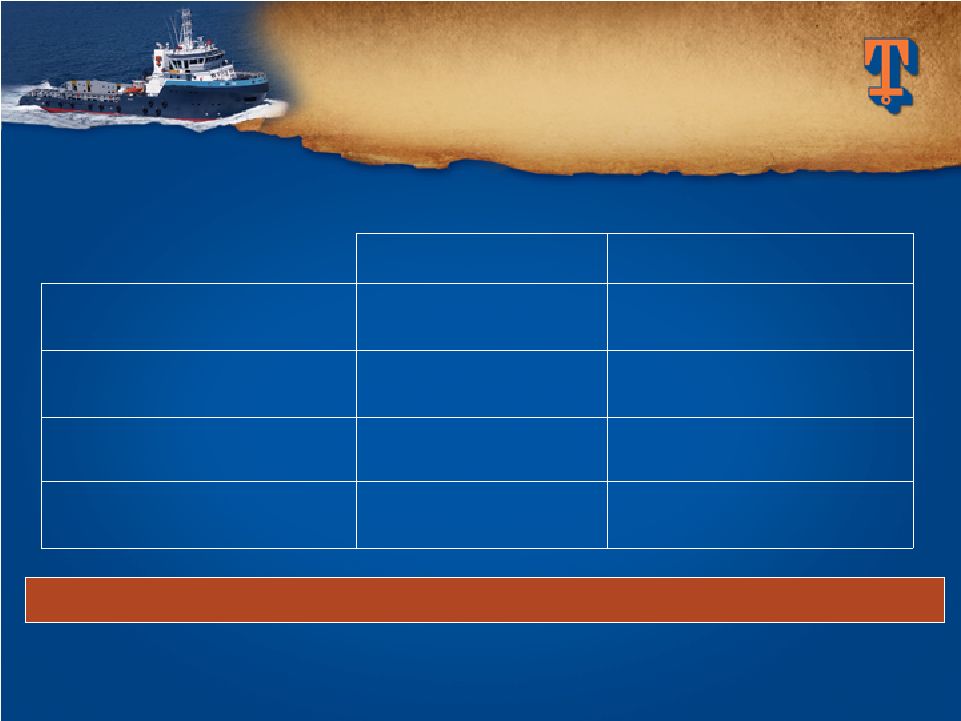
 Jackups Semi Drillships June 2008 379 145 30 December 2009 317 146 44 Variance (62) 1 14 13 GOM accounts for 34 of the 62 working jackup count variance GOM accounts for 34 of the 62 working jackup count variance Source: ODS-Petrodata and Tidewater WORKING RIG COUNTS WORKING RIG COUNTS |
 RIGS
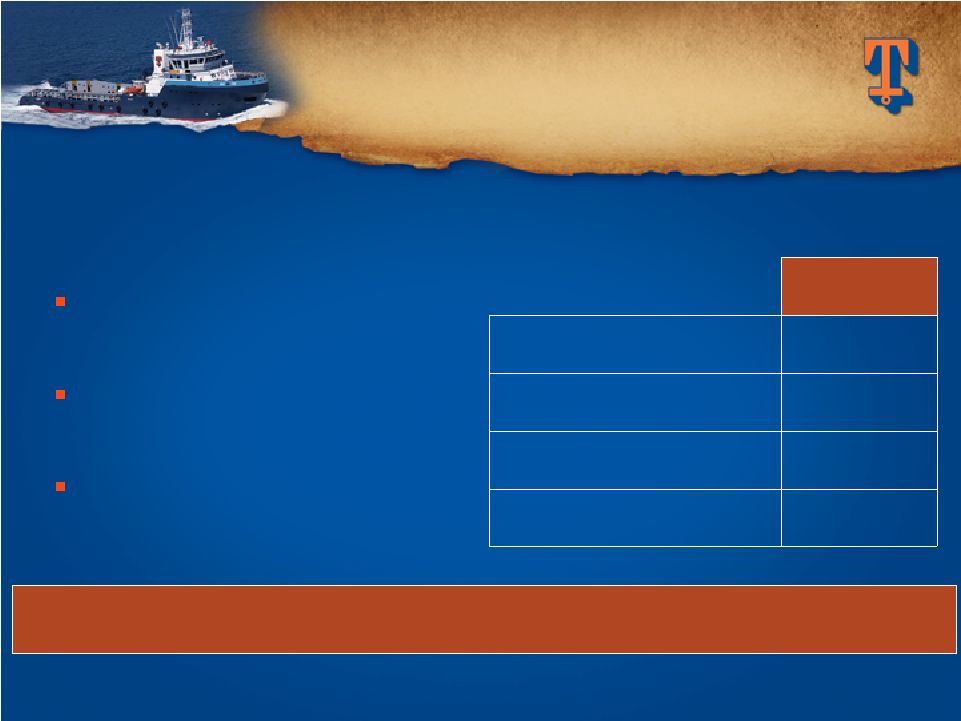
CONTRACTED BY RIGS CONTRACTED BY OUR TOP 10 CUSTOMERS OUR TOP 10 CUSTOMERS (Estimated as of December 2009) (Estimated as of December 2009) * PEMEX alone has 27 of the 74 jackups * PEMEX alone has 27 of the 74 jackups Source: ODS-Petrodata and Tidewater 14 Jackups Semi Drillships December 2009 working rigs 317 146 44 Working for top 10 customers 74 74 19 23% 51% 43% |
 15 Unique global footprint; 50+ years of Int’l experience Unmatched scale and scope of operations 31 of 33 current newbuilds in Int’l yards Longer contracts, better utilization, higher dayrates for new & traditional vessels operating in Int’l markets Solid customer base of NOC’s and IOC’s INTERNATIONAL INTERNATIONAL STRENGTH STRENGTH |
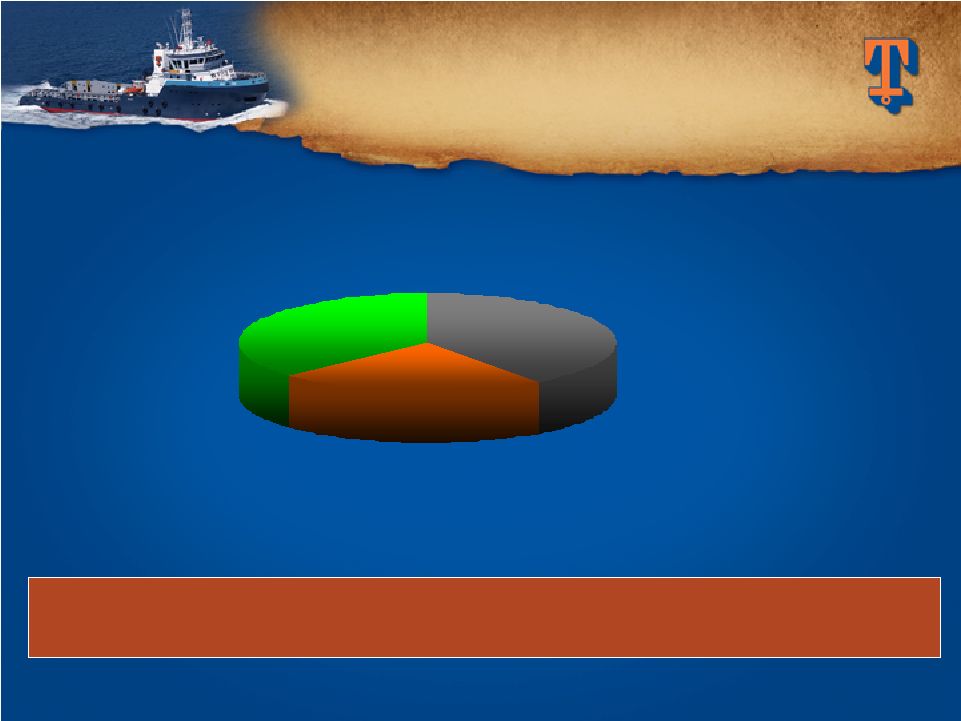 NOC's 23% Others 37% Super Majors 40% Our top 10 customers in Fiscal 2009 (5 Super Majors, 4 NOC’s Our top 10 customers in Fiscal 2009 (5 Super Majors, 4 NOC’s and one large independent) accounted for 60% of our revenue and one large independent) accounted for 60% of our revenue CURRENT REVENUE MIX CURRENT REVENUE MIX Quality of Customer Base Quality of Customer Base 16 |
 Active
Vessel Count By Region (excludes stacked vessels) Europe/M.E. 33 (11%) Europe/M.E. Europe/M.E. 33 (11%) 33 (11%) (11%) Far East 50 (16%) Far East Far East 50 (16%) 50 (16%) (16%) West Africa 130 (43%) West Africa West Africa 130 (43%) 130 (43%) (43%) Central/South America 73 (24%) Central/South Central/South America America 73 (24%) 73 (24%) (24%) 94% International 6% Domestic 94% International 6% Domestic (vs. 65% International and 35% Domestic ~ ten years ago) (vs. 65% International and 35% Domestic ~ ten years ago) TIDEWATER TODAY TIDEWATER TODAY INTERNATIONAL STRENGTH INTERNATIONAL STRENGTH (as of 12/31/09) (as of 12/31/09) North America 18 (6%) North America 18 (6%) |
 18 Strive for a Balance Between Strive for a Balance Between Performance, Growth and Financial Strength Performance, Growth and Financial Strength Ability to support continued fleet renewal and growth Current environment will present opportunities to utilize our financial strength Funding with internal cash flow and available credit Always weigh build vs. buy criteria GROWING INDUSTRY’S GROWING INDUSTRY’S LARGEST FLEET LARGEST FLEET |
 19 LARGEST NEW FLEET LARGEST NEW FLEET IN THE INDUSTRY… IN THE INDUSTRY… Vessel Commitments Jan. ’00 – Vessel Commitments Jan. ’00 – Dec. ‘09 Dec. ‘09 (1) Includes vessels added to the fleet financed by leases. (2) $2,578m funded through 12/31/09. *Excludes ENSCO fleet acquisition effected April 1, 2003. At 12/31/09, 163 new vessels in fleet with 4.7 year average age At 12/31/09, 163 new vessels in fleet with 4.7 year average age $1,454m 74 PSV’s $3,106m (2) 214 TOTALS: (1) $284m 66 Crewboats & Tugs $1,368m 74 AHTS Estimated Cost Vessel Count |
 … … AND COUNTING AND COUNTING 20 Estimated delivery schedule – 9 remaining in FY’ 10, 12 in FY’ 11, 13 in FY’ 12 and 2 thereafter. CAPX of $183m remaining in FY’ 10, $191m in FY’ 11, $141m in FY’ 12 and $12m in FY’ 13 Our approach to managing construction Our approach to managing construction Building vessels worldwide Due diligence focused on yards Tidewater staff supervise on site Vessels Under Construction* Vessels Under Construction* As of December 31, 2009 As of December 31, 2009 36 Total 18 PSV 2 Crew and Tug 16 AHTS Count * Includes three new vessels committed to purchase as of 12/31/09
|
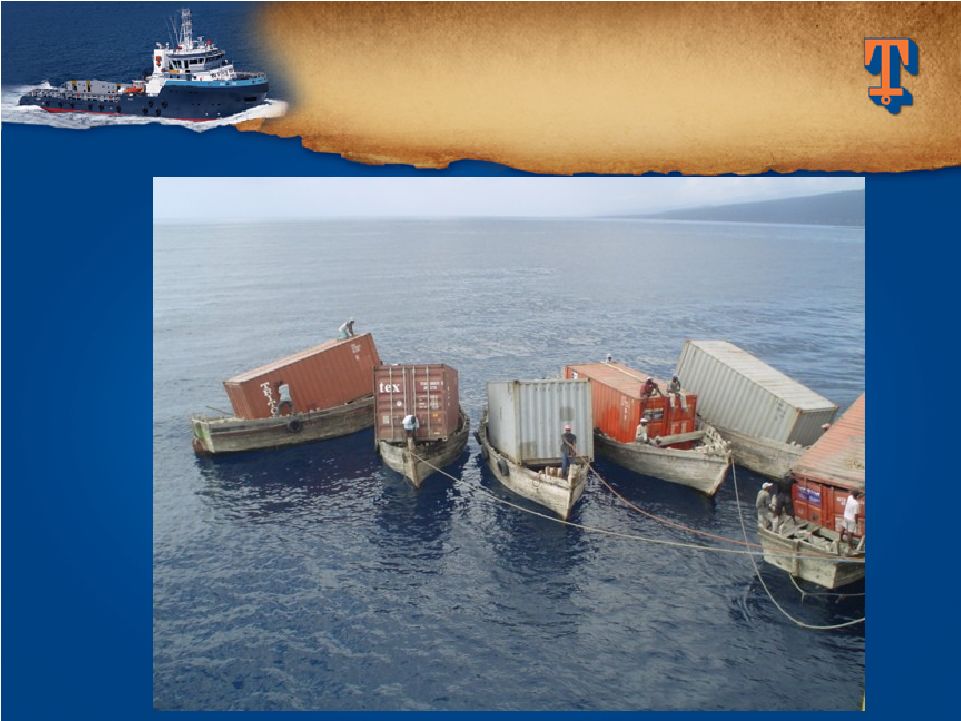 SOME
ACQUISITION SOME ACQUISITION OPPORTUNITIES ARE OPPORTUNITIES ARE BETTER THAN OTHERS !!! BETTER THAN OTHERS !!! |
 Out
With the Traditional – Out With the Traditional – In With the New In With the New 0 100 200 300 400 500 Active Fleet Dispositions 22 LARGEST NEW FLEET LARGEST NEW FLEET IN THE INDUSTRY IN THE INDUSTRY (as of 12/31/09) (as of 12/31/09) (A) Net new vessels added to the fleet since January 2000, including 36 vessels under
construction at 12/31/09. 340 (B) 495 (C) 199 New Vessels (A) 404 Sold 404 Sold 91 Scrapped 91 Scrapped (C) 495 vessel dispositions generated $635 million of proceeds and $265 million of
gains. (B) Total fleet count excludes 73 stacked vessels as of 12/31/09.
|
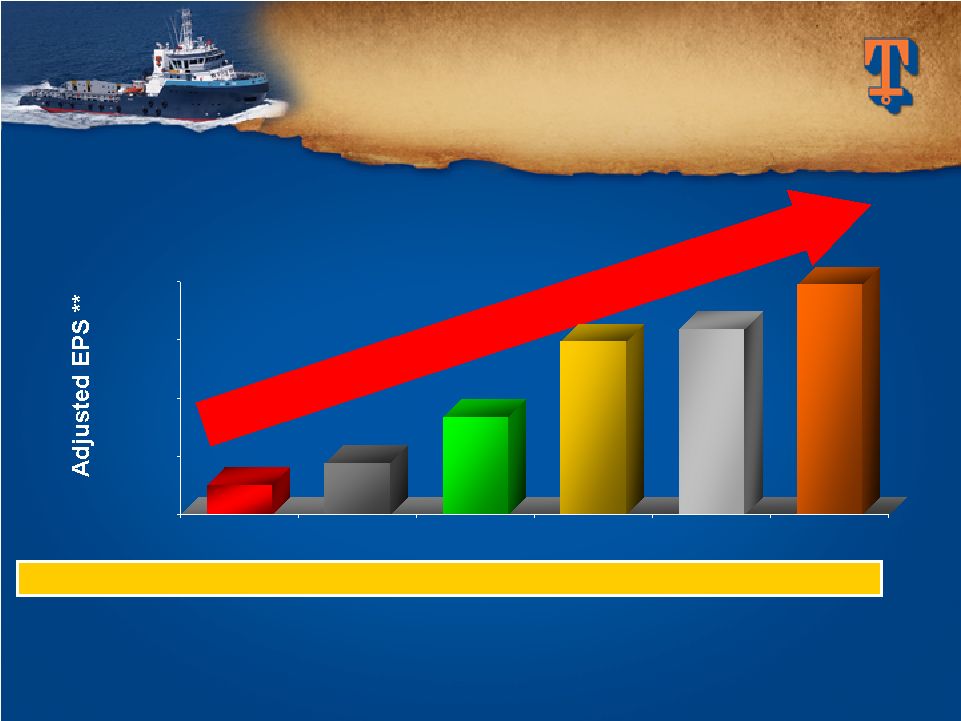 $0.00 $2.00 $4.00 $6.00 $8.00 Fiscal 2004 Fiscal 2005 Fiscal 2006 Fiscal 2007 Fiscal 2008 Fiscal 2009 SIGNIFICANT SIGNIFICANT EARNINGS GROWTH EARNINGS GROWTH 23 50% Five-Year Compounded 50% Five-Year Compounded Annual Earnings Growth Rate Annual Earnings Growth Rate FY End Stock Price $28.13 $38.86
$55.23 $58.58 $55.11 $37.13 ** EPS in Fiscal 2004 is exclusive of the $.30 per share after tax impairment charge. EPS
in Fiscal 2006 is exclusive of the $.74 per share after tax gain from the
sale of six KMAR vessels. EPS in Fiscal 2007 is exclusive of $.37 per share
of after tax gains from the sale of 14 offshore tugs. $1.03 $1.78 $3.33 $5.94 $6.39 $7.89 |
 STRONG
BALANCE SHEET STRONG BALANCE SHEET ~ $790 million of Available Liquidity at 12/31/09 (Cash plus $450m Revolver) ~ $790 million of Available Liquidity at 12/31/09 (Cash plus $450m Revolver) $300 $275 Long-term Debt $2,245 $2,419 Stockholders’ Equity 2.1% 0% Net Debt to Total Cap $251 $337 Cash March 2009 December 2009 ($ in Millions) ($ in Millions) 24 |
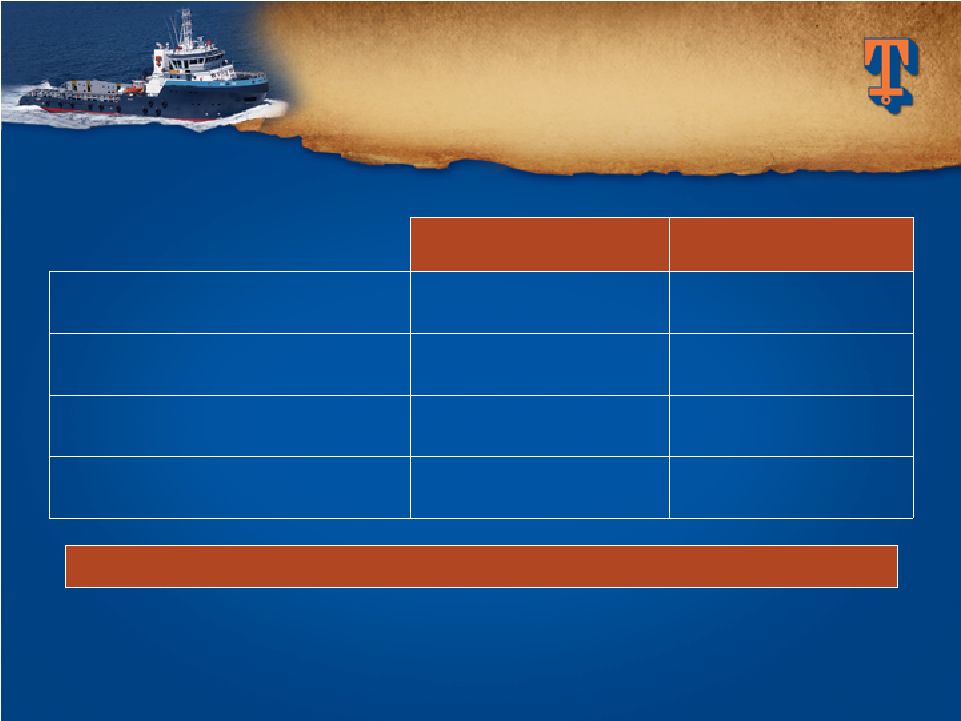
 SELECTED FINANCIAL SELECTED FINANCIAL HIGHLIGHTS HIGHLIGHTS * Adjusted Net Earnings and Adjusted EPS for the nine months ended 12/31/09 excludes
$48.1 million, or $0.94 per share, related to provision for Venezuelan
operations and $34.3 million, or $0.66 per share, tax benefit related to
favorable resolution of tax litigation. ($ in Thousands, Except Per Share Data) Nine Months Ended $5.76 $4.21 Adjusted EPS* $297,172 $216,363 Adjusted Net Earnings* $366,305 $299,350 Net Cash from Operations $368,706 $304,013 Capital Expenditures $1,049,218 $908,638 Revenues 12/31/08 12/31/09 25 |
 USING
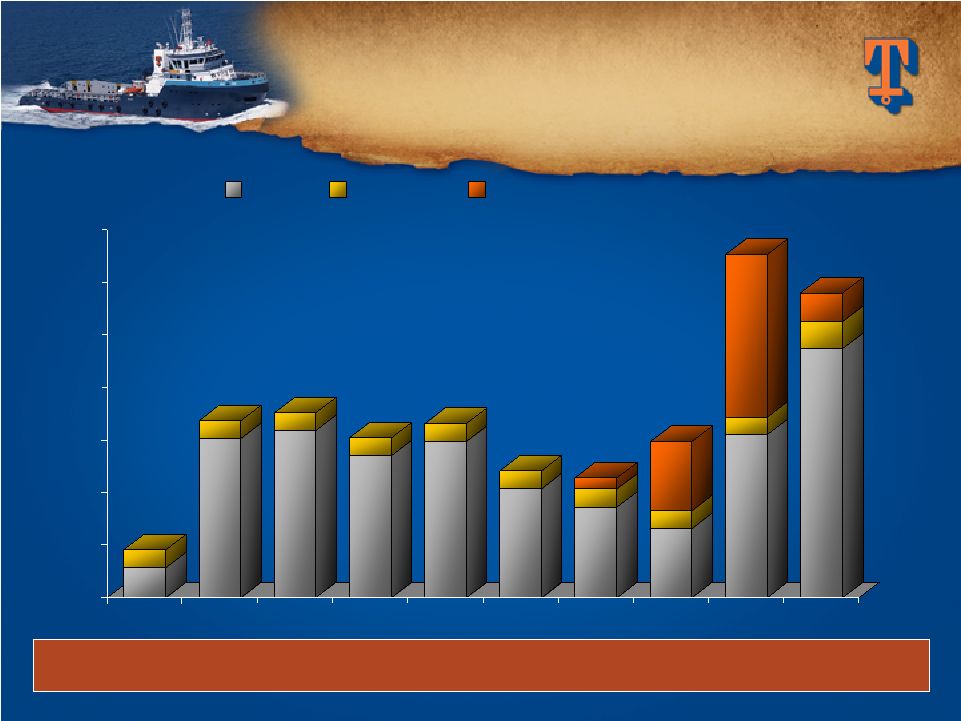
CASH TO GROW OUR USING CASH TO GROW OUR BUSINESS & RETURN TO BUSINESS & RETURN TO SHAREHOLDERS SHAREHOLDERS $0 $100 $200 $300 $400 $500 $600 $700 2000 2001 2002 2003 2004 2005 2006 2007 2008 2009 CAPX Dividend Share Repurchase (in millions) 26 Over this ten year period, TDW invested $2.7 billion in CAPX ($2.3 billion in our new
fleet), and paid out $355 million in dividends and $516 million through
share repurchases. |
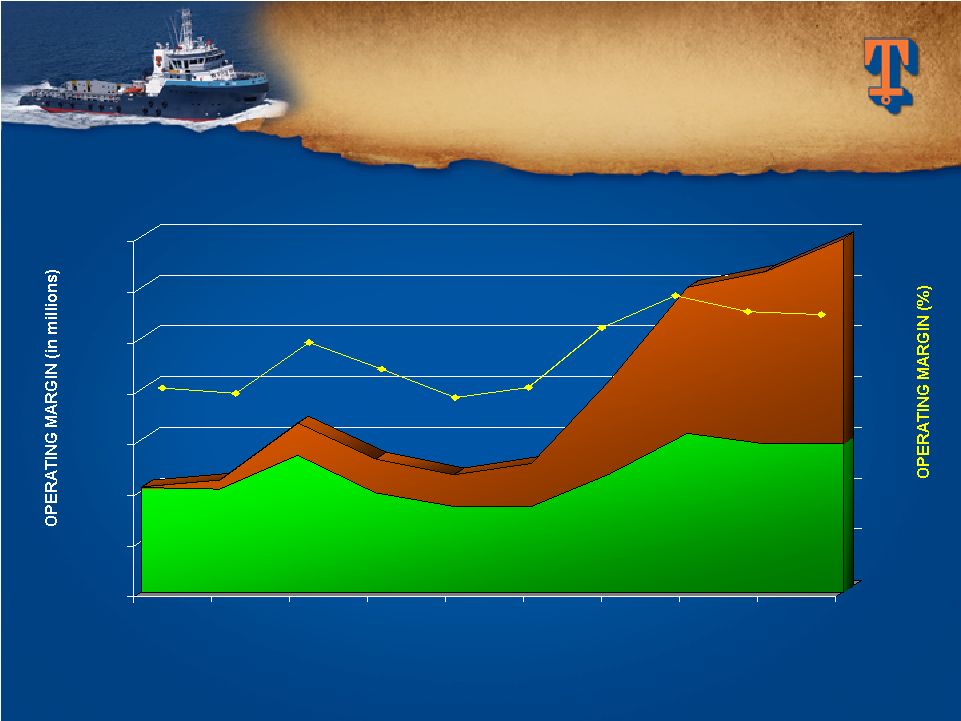 $0 $100 $200 $300 $400 $500 $600 $700 2000 2001 2002 2003 2004 2005 2006 2007 2008 2009 Fiscal Years FLEET CASH FLEET CASH OPERATING MARGINS OPERATING MARGINS 27 Note: Cash operating margins are defined as vessel revenue less vessel operating expenses. 50% 40% 30% 20% 10% 60% Total Fleet Operating Margin % New Vessels Traditional Vessels 38.6% 37.6% 46.5% 41.9% 36.9% 38.7% 49.1% 54.6% 51.9% 51.3% |
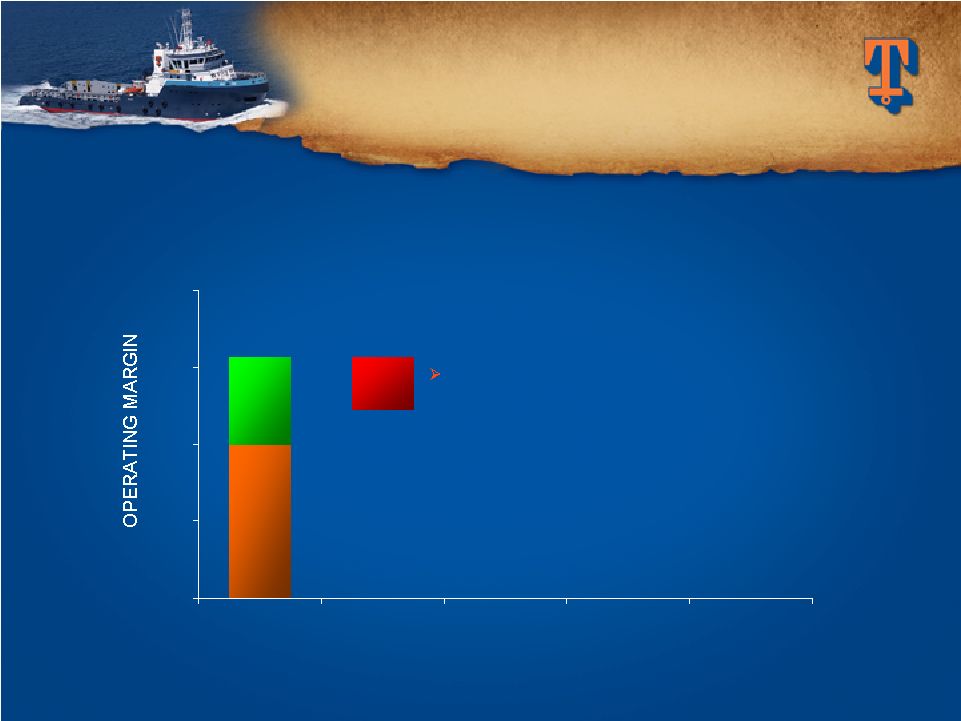
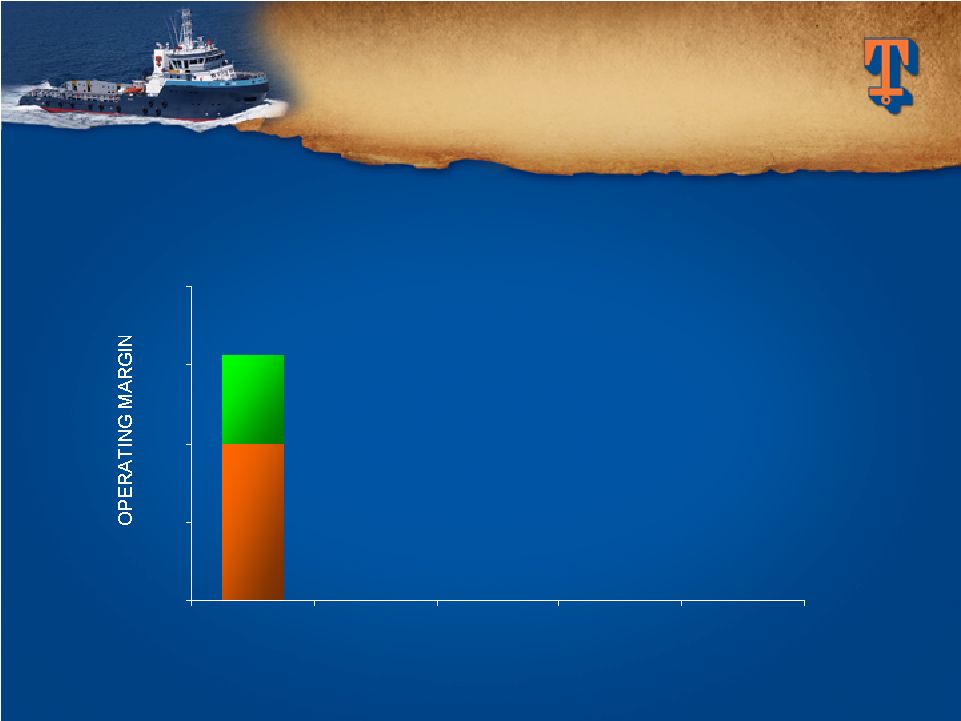 0 50 100 150 200 Q1FY10 Operating Margin $156.8 FLEET RENEWAL FLEET RENEWAL PROVIDES SCOPE FOR PROVIDES SCOPE FOR MARGIN GROWTH MARGIN GROWTH Traditional Vessels (37%) New Vessels (63%) ($ in millions) 28 |
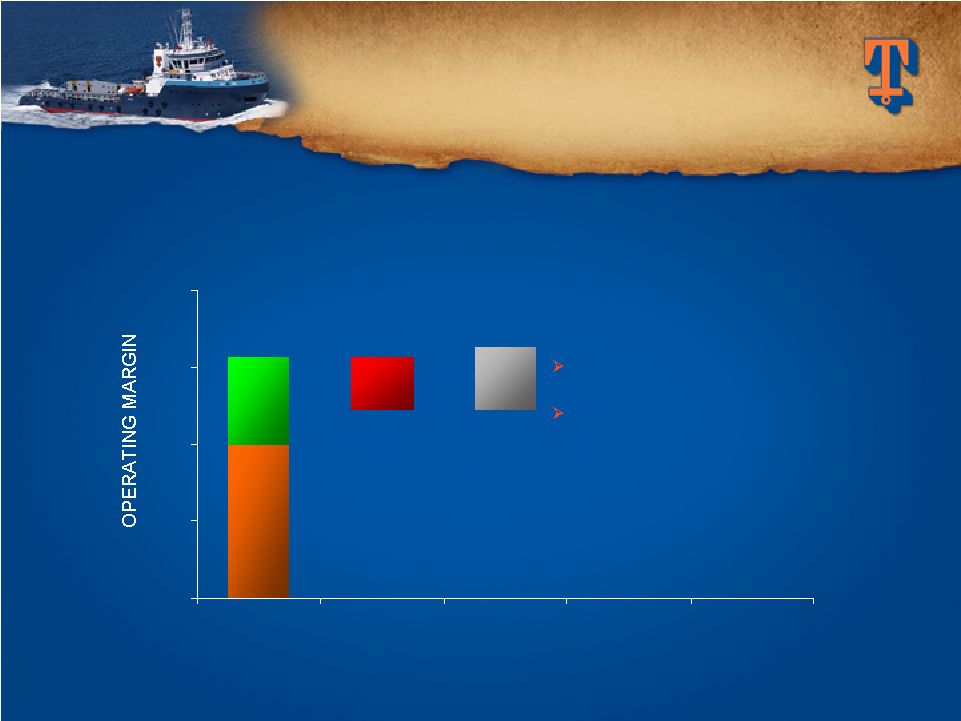
 0 50 100 150 200 Q1FY10 Operating Margin Vessel Disposals $156.8 FLEET RENEWAL FLEET RENEWAL PROVIDES SCOPE FOR PROVIDES SCOPE FOR MARGIN GROWTH MARGIN GROWTH Assume ~ 2/3 of traditional vessels are disposed of over the next few years ($ in millions) ($34.9) 29 |
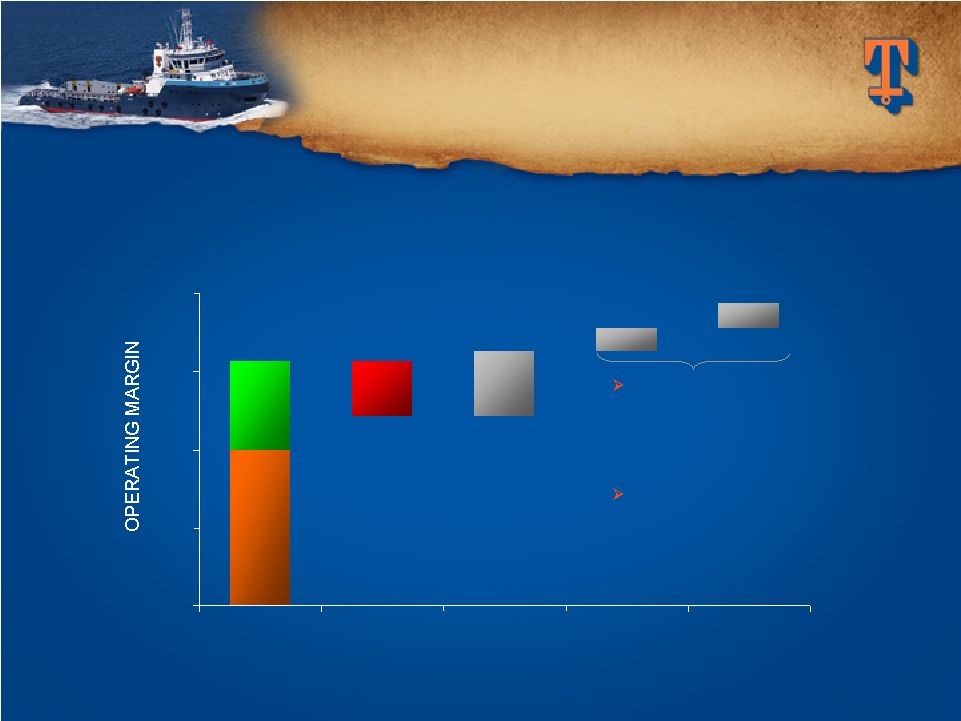
 0 50 100 150 200 Q1FY10 Operating Margin Vessel Disposals CIP $156.8 FLEET RENEWAL FLEET RENEWAL PROVIDES SCOPE FOR PROVIDES SCOPE FOR MARGIN GROWTH MARGIN GROWTH 46 vessels currently under construction at 6/30/09 Analysis assumes: • Average dayrate of $20,000/day • Utilization of 90% • Cash operating margin of 55% ($ in millions) ($34.9) +$41.5 30 |
 0 50 100 150 200 Q1FY10 Operating Margin Vessel Disposals CIP +5% Utilization +$1,000 Dayrate $156.8 FLEET RENEWAL FLEET RENEWAL PROVIDES SCOPE FOR PROVIDES SCOPE FOR MARGIN GROWTH MARGIN GROWTH Near-term vessel retirements followed by market upturn should positively impact utilization and dayrates Analysis assumes +5% on utilization and +$1,000 on average dayrates for existing vessels ($ in millions) ($34.9) +$41.5 +$14.8 +$16.7 31 |
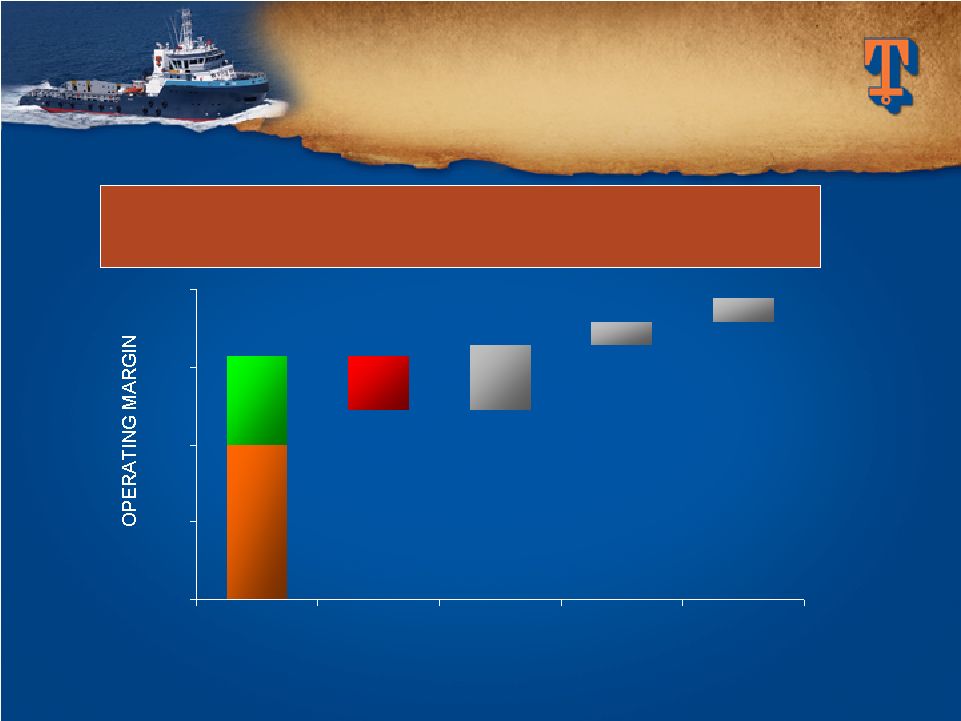 0 50 100 150 200 Q1FY10 Operating Margin Vessel Disposals CIP +5% Utilization +$1,000 Dayrate $156.8 FLEET RENEWAL FLEET RENEWAL PROVIDES SCOPE FOR PROVIDES SCOPE FOR MARGIN GROWTH MARGIN GROWTH This information is not meant to be a prediction of future quarterly performance, but
simply an indication of quarterly operating margin impacts resulting from
future fleet additions and reductions, and fluctuations in vessel
utilization and day rates. ($34.9) +$41.5 +$14.8 +$16.7 32 |
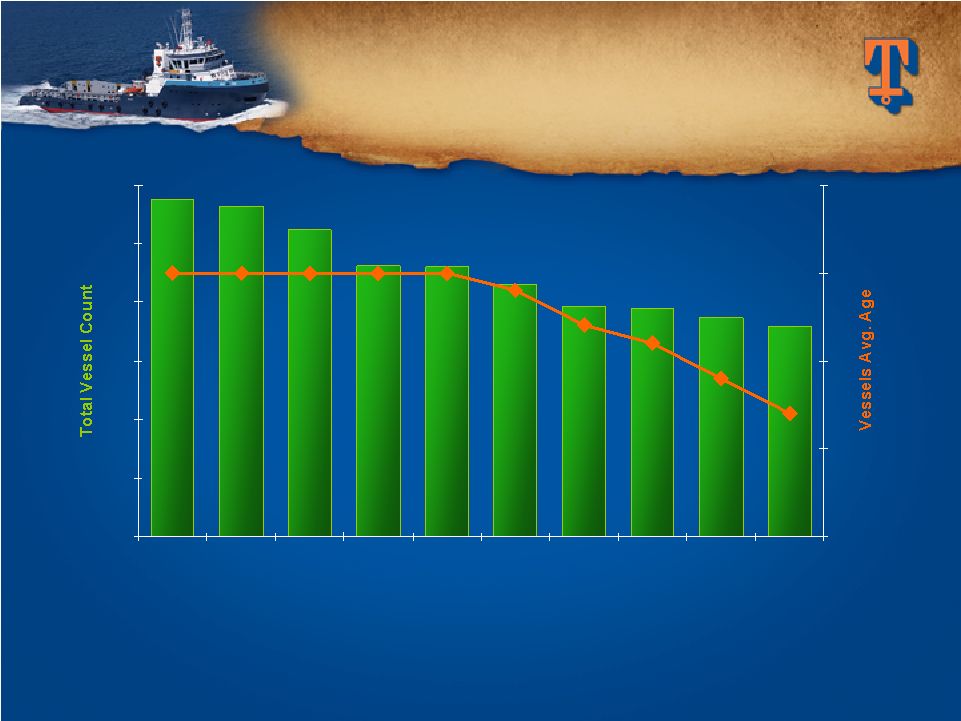 33 IMPROVING AVERAGE AGE IMPROVING AVERAGE AGE OF TIDEWATER FLEET OF TIDEWATER FLEET Assumptions: 1) Average 45 vessel disposals per year in future (averaged 47 per year
last three years). 2) Include 36 vessels under construction ( including three
purchase commitments) in year delivered plus additional
newbuilds/acquisitions from approximately $500 million per year of future commitments. Tidewater is not committed to spending $500 million annually, but this level
is used as an assumption in estimating average fleet age in the future.
0 100 200 300 400 500 600 3/31/04 Actual 3/31/05 Actual 3/31/06 Actual 3/31/07 Actual 3/31/08 Actual 12/31/08 Actual 12/31/09 Actual 12/31/10 Estimate 12/31/11 Estimate 12/31/12 Estimate 5 10 15 20 25 |
 34 FINANCIAL STRATEGY FINANCIAL STRATEGY Deploy Deploy Capital Capital Deliver Deliver Results Results Maintain Financial Maintain Financial Strength Strength Focused on Long Term Shareholder Value Focused on Long Term Shareholder Value |
 TIDEWATER TIDEWATER CREDIT SUISSE 2010 CREDIT SUISSE 2010 ENERGY SUMMIT ENERGY SUMMIT February 4, 2010 Quinn Fanning Quinn Fanning Executive Vice President, CFO Executive Vice President, CFO Joseph M. Bennett Joseph M. Bennett Executive Vice President and Executive Vice President and Chief Investor Relations Chief Investor Relations Officer Officer |
 TIDEWATER TIDEWATER APPENDIX APPENDIX |
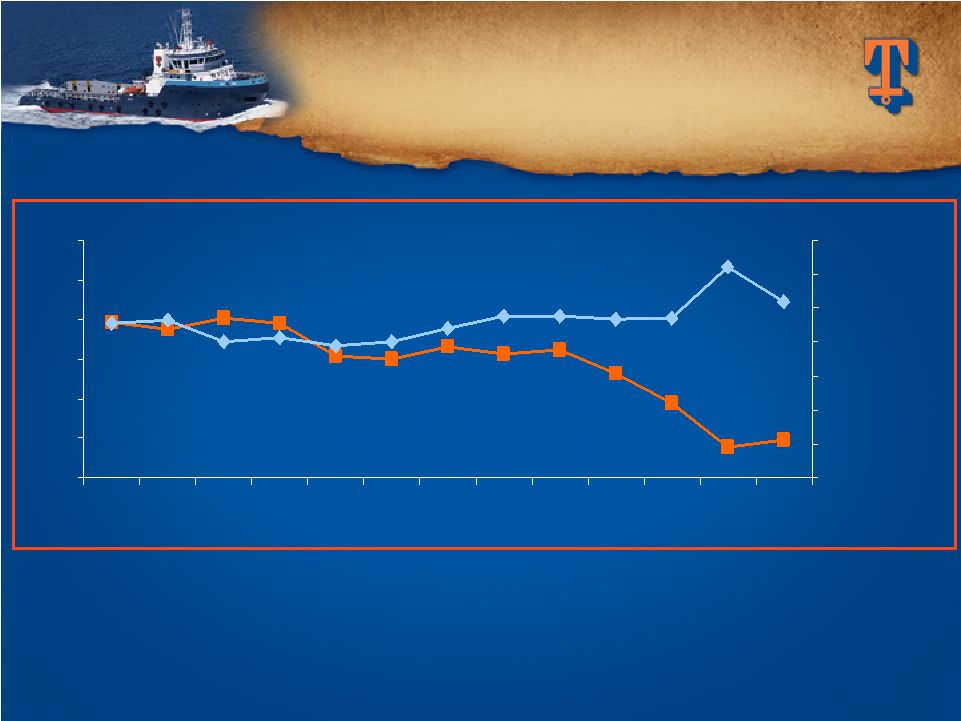
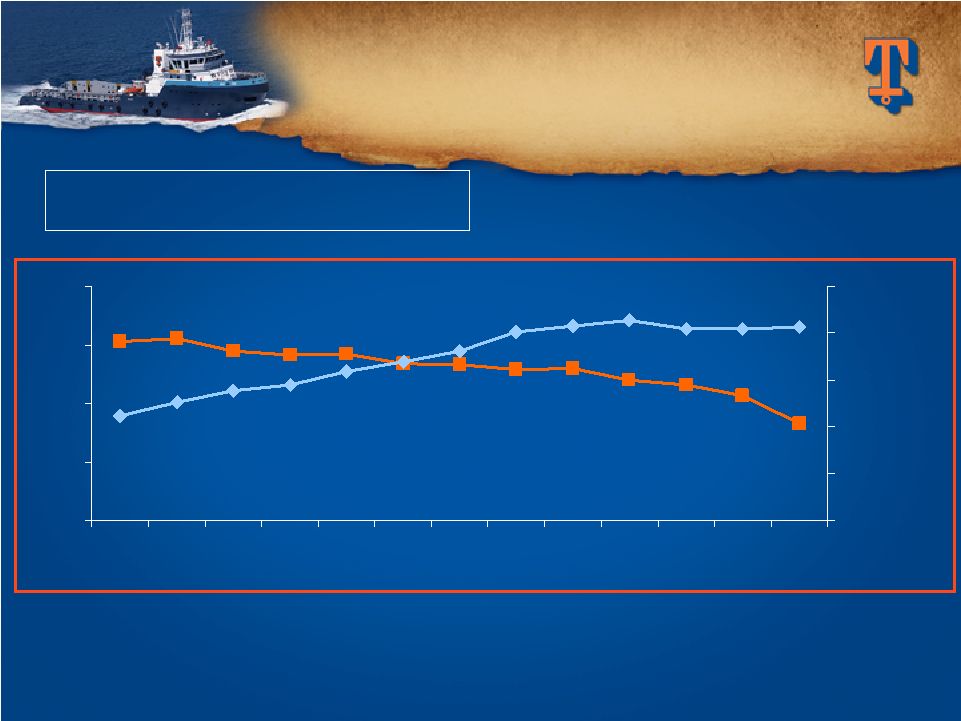 50% 60% 70% 80% 90% 12/06 6/07 12/07 6/08 12/08 6/09 12/09 $4,000 $6,000 $8,000 $10,000 $12,000 $14,000 37 INTERNATIONAL VESSELS INTERNATIONAL VESSELS Dayrates and Utilization Dayrates and Utilization $100 change in dayrate = $8.3M in revenue 1% change in utilization = $15.2M in revenue * Dayrate and utilization information is for all classes of vessels operating
international. Utilization Dayrate |
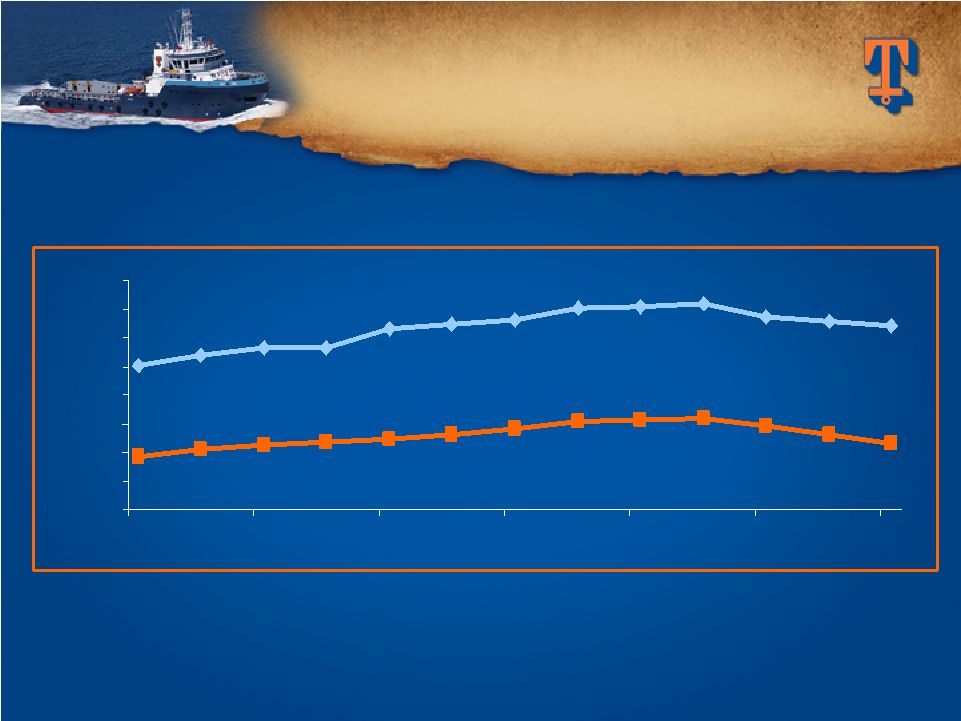 $3,000 $5,000 $7,000 $9,000 $11,000 $13,000 $15,000 $17,000 $19,000 12/06 06/07 12/07 06/08 12/08 06/09 12/09 New Vessels Traditional Vessels INTERNATIONAL INTERNATIONAL VESSEL VESSEL DAYRATES DAYRATES * Dayrate information is for all classes of vessels operating internationally.
38 |
 30% 40% 50% 60% 70% 80% 90% 12/06 6/07 12/07 6/08 12/08 6/09 12/09 $4,000 $6,000 $8,000 $10,000 $12,000 $14,000 $16,000 $18,000 39 DOMESTIC VESSELS DOMESTIC VESSELS Dayrates and Utilization Dayrates and Utilization * Dayrate and utilization information is for all classes of vessels operating in the
U.S. Utilization Dayrate |
 $3,000 $5,000 $7,000 $9,000 $11,000 $13,000 $15,000 $17,000 $19,000 $21,000 $23,000 12/06 06/07 12/07 06/08 12/08 06/09 12/09 New Vessels Traditional Vessels DOMESTIC VESSEL DOMESTIC VESSEL DAYRATES DAYRATES * Dayrate information is for all classes of vessels operating in the U.S. 40 |