Attached files
Exhibit 13
(Unaudited)
Common Stock Data (per share):
| 2009 Price Range | 2008 Price Range | Dividends | ||||||||||||||||
| High | Low | High | Low | 2009 | 2008 | |||||||||||||
| First Quarter |
$ | 43.45 | $ | 31.45 | $ | 60.04 | $ | 47.13 | $ | 0.145 | $ | 0.13 | ||||||
| Second Quarter |
51.41 | 36.91 | 63.04 | 53.75 | 0.145 | 0.13 | ||||||||||||
| Third Quarter |
55.65 | 45.80 | 62.74 | 50.02 | 0.145 | 0.13 | ||||||||||||
| Fourth Quarter |
56.29 | 50.31 | 54.13 | 34.33 | 0.145 | 0.13 | ||||||||||||
The Company’s common stock is traded in the National Association of Securities Dealers Automated Quotation System (“NASDAQ”) Global Select Market. The trading symbol is SIAL.
On January 31, 2010, there were 721 shareholders of record of the Company’s common stock.
Annual Financial Data ($ In Millions, except per share data):
| 2009 | 2008 | 2007 | 2006 | 2005 | |||||||||||
| Net sales |
$ | 2,147.6 | $ | 2,200.7 | $ | 2,038.7 | $ | 1,797.5 | $ | 1,666.5 | |||||
| Net income |
346.7 | 341.5 | 311.1 | 276.8 | 258.3 | ||||||||||
| Per share: |
|||||||||||||||
| Net income — Basic |
2.84 | 2.70 | 2.38 | 2.08 | 1.90 | ||||||||||
| Net income — Diluted |
2.80 | 2.65 | 2.34 | 2.05 | 1.88 | ||||||||||
| Dividends |
0.58 | 0.52 | 0.46 | 0.42 | 0.38 | ||||||||||
| Cash dividends |
70.7 | 65.4 | 60.0 | 55.7 | 51.3 | ||||||||||
| Total assets |
2,713.8 | 2,556.5 | 2,629.1 | 2,334.3 | 2,131.3 | ||||||||||
| Long-term debt |
100.0 | 200.1 | 207.0 | 337.9 | 283.2 | ||||||||||
| Pension obligations — Long term |
50.8 | 53.1 | 20.0 | 29.4 | 7.7 | ||||||||||
| Post-retirement medical benefit plans |
43.0 | 39.5 | 36.9 | 38.5 | 54.3 | ||||||||||
| Quarterly Financial Data ($ In Millions, except per share data): | |||||||||||||||
| 2009 Quarter Ended | |||||||||||||||
| March 31 | June 30 | Sept. 30 | Dec. 31 | ||||||||||||
| Net sales |
$ | 519.3 | $ | 522.0 | $ | 533.8 | $ | 572.5 | |||||||
| Gross profit |
268.6 | 269.3 | 265.2 | 286.8 | |||||||||||
| Net income |
84.4 | 83.6 | 86.1 | 92.6 | |||||||||||
| Net income per share — Basic |
0.69 | 0.69 | 0.71 | 0.76 | |||||||||||
| Net income per share — Diluted |
0.68 | 0.68 | 0.70 | 0.75 | |||||||||||
| 2008 Quarter Ended | |||||||||||||||
| March 31 | June 30 | Sept. 30 | Dec. 31 | ||||||||||||
| Net sales |
$ | 569.6 | $ | 580.7 | $ | 540.6 | $ | 509.8 | |||||||
| Gross profit |
292.2 | 294.9 | 277.9 | 264.9 | |||||||||||
| Net income |
84.5 | 90.8 | 81.9 | 84.3 | |||||||||||
| Net income per share — Basic |
0.65 | 0.71 | 0.65 | 0.68 | |||||||||||
| Net income per share — Diluted |
0.64 | 0.70 | 0.64 | 0.68 | |||||||||||
All per share and common stock information presented above prior to 2007 has been retroactively adjusted to reflect the December 2006 common stock split.
2009 ANNUAL REPORT SIGMA-ALDRICH 21
Sigma-Aldrich
2009 Financial Report
Table of Contents
| Management’s Discussion And Analysis | 23 | |
| Consolidated Statements of Income | 30 | |
| Consolidated Balance Sheets | 31 | |
| Consolidated Statements of Stockholders’ Equity | 32 | |
| Consolidated Statements of Cash Flows | 33 | |
| Notes To Consolidated Financial Statements | 34 | |
| Management’s Report On Internal Control Over Financial Reporting | 48 | |
| Report Of Independent Registered Public Accounting Firm | 48 | |
22 SIGMA-ALDRICH 2009 ANNUAL REPORT
Management’s Discussion And Analysis
($ In Millions, Except Per Share Data)
The following should be read in conjunction with the consolidated financial statements and related notes.
OVERVIEW
Sigma-Aldrich Corporation (“the Company”) is a leading Life Science and High Technology company. The Company develops, manufactures, purchases and distributes the broadest range of high quality chemicals, biochemicals and equipment available throughout the world. These chemical products and kits are used in scientific research, including genomic and proteomic research, biotechnology, pharmaceutical development and as key components in pharmaceutical, diagnostic and other high technology manufacturing. The Company operates in 38 countries, manufacturing 48,000 of the 130,000 chemical products it offers. The Company also offers 40,000 equipment products. The Company sells into over 160 countries, servicing over 92,000 accounts representing over one million individual customers.
The Company has four business units featuring the Research units of Essentials, Specialties and Biotech and the Fine Chemicals unit, SAFC. The units are closely interrelated in their activities and share services such as order entry, billing, technical services, Internet, purchasing and inventory control and share production and distribution facilities. Additionally, these units are supported by centralized functional areas such as finance, human resources, quality, safety and compliance and information technology.
Research Essentials, representing 19% of sales, provides customized, innovative solutions for our economic buyers. Research Specialties, representing 37% of sales, facilitates accelerated research by lab scientists through information and innovation in services and new products. Research Biotech, representing 16% of sales, provides innovative first-to-market products and technologies for the Life Science researcher.
SAFC, representing 28% of sales, supports the manufacturing needs of commercial project managers’ through rapid delivery of custom projects.
The Company has a broad customer base of commercial laboratories, pharmaceutical companies, industrial companies, universities, diagnostics companies, biotechnology companies, electronics companies, hospitals, governmental institutions and non-profit organizations located in the United States and internationally, and would not be significantly impacted by the loss of any one customer. However, economic conditions and government research funding in the United States and internationally do impact demand from our customers.
Highlights of our consolidated results for the year ended ended December 31, 2009, are as follows:
| • | Sales were $2,147.6, a decrease of 2.4% compared to the same period last year. Excluding the impact of foreign currency exchange rates, which decreased sales by 4.1%, sales increased by 1.7% year over year. |
| • | Gross margin was 50.7%, a decrease of 60 basis points when compared to 2008. Pretax income margin was 22.8%, up from 22.2% in 2008. |
| • | Diluted income per share was $2.80, compared to $2.65, a 5.7% increase when compared to last year. |
| • | Net cash provided by operating activities for the year ended December 31, 2009 was $515.7, an increase of $111.7 from last year. |
| • | Net debt, which includes total debt less cash, declined $273.1 since December 31, 2008. |
COMPANY OUTLOOK
The current uncertainty in the global markets reduces future visibility. Demand from several of the Company’s key markets is expected to increase in 2010 from 2009 levels. New program launches, global sales initiatives and market share gains should enable the Company to achieve mid single-digit organic sales growth in 2010. Significant factors that could affect our results and cash flows in fiscal year 2010 include:
| • | Our performance may be affected by the economic conditions in the U.S. and in other nations where we do business; |
| • | We face significant competition, including changes in pricing; |
| • | Our sales and results of operations are dependent on the research and development spending patterns at pharmaceutical, biotechnology and diagnostic companies, and universities; |
| • | Foreign currency exchange rate fluctuations may adversely affect our business; |
| • | Due to heavy reliance on manufacturing and related operations to produce, package and distribute the products we sell, our business could be adversely affected by disruptions of these operations; |
| • | Changes in worldwide tax rates or tax benefits may impact our tax expense and our profits; |
| • | Our failure to protect our intellectual property may significantly harm our results of operations; |
| • | Our failure to achieve planned cost reductions in global supply chain initiatives; and |
| • | The impact of any restructuring. |
NON-GAAP FINANCIAL MEASURES
The Company supplements its disclosures made in accordance with accounting principles generally accepted in the United States (“U.S. GAAP”) with certain non-GAAP financial measures. The Company does not, and does not suggest investors should, consider such non-GAAP financial measures in isolation from, or as a substitute for, GAAP financial information. These non-GAAP measures may not be consistent with the presentation by similar companies in the Company’s industry. Whenever the Company uses such non-GAAP measures, it provides a reconciliation of such measures to the most closely applicable GAAP measure.
With over 60% of sales denominated in currencies other than the U.S. dollar, management uses currency adjusted growth, and believes it is useful to investors, to judge the Company’s local currency performance. Organic sales growth data presented herein excludes currency, and where indicated, acquisition impacts. While we are able to report currency impacts after the fact, we are unable to estimate changes that may occur in 2010 to applicable exchange rates. Any significant changes in currency exchange rates would likely have a significant impact on our reported growth rates due to the volume of our sales denominated in foreign currencies.
Management also uses free cash flow, a non-GAAP measure, to judge its performance and ability to pursue opportunities that enhance shareholder value. Management believes this non-GAAP information is useful to investors as well.
2009 ANNUAL REPORT SIGMA-ALDRICH 23
Management’s Discussion And Analysis (continued)
($ In Millions, Except Per Share Data)
The following should be read in conjunction with the consolidated financial statements and related notes.
CRITICAL ACCOUNTING ESTIMATES
The preparation of consolidated financial statements in conformity with U.S. GAAP requires management to use judgment in making estimates and assumptions that affect the reported amounts of assets and liabilities, disclosures of contingent assets and liabilities at the date of the consolidated financial statements and the reported amounts of revenues and expenses during the years presented. Actual results could differ from those estimates under different assumptions or conditions.
The following accounting policies are based on, among other things, judgments and assumptions made by management that include inherent risks and uncertainties. Management’s estimates are based on the relevant information available at the end of each period.
Inventories Inventories are valued at the lower of cost or market. The Company regularly reviews inventories on hand and records a provision for slow-moving and obsolete inventory, inventory not meeting quality standards and inventory subject to expiration. The provision for slow-moving and obsolete inventory is based on current estimates of future product demand, market conditions and related management judgment. Any significant unanticipated changes in future product demand or market conditions that vary from current expectations could have an impact on the value of inventories.
Long-Lived Assets Long-lived assets, including intangibles with definite lives, are amortized over their expected useful lives. Goodwill and other intangibles with indefinite lives are not amortized against earnings. Goodwill is assessed annually for impairment. All long-lived assets are assessed whenever events and changes in business conditions indicate that the carrying amount of an asset may not be fully recoverable. If impairment is indicated, the asset value is written down to its fair market value. Any significant unanticipated changes in business or market conditions that vary from current expectations could have an impact on the fair value of these assets and any potential associated impairment.
Pension and Other Post-Retirement Benefits The determination of the obligation and expense for pension and other post-retirement benefits is dependent on the Company’s selection of certain assumptions used by actuaries to calculate such amounts. Those assumptions are described in Note 14 to the consolidated financial statements and include, among others, the discount rates, expected return on plan assets and rates of increase in compensation and health care costs.
In accordance with U.S. GAAP, actual results that differ from the assumptions are accumulated and amortized over future periods and therefore, generally affect the recognized expense in such future periods. While the Company believes that the assumptions are appropriate, significant differences in actual experience or significant changes in the assumptions may materially affect the Company’s pension and other post-retirement benefit obligations and the Company’s future expense. A 1% increase in the discount rate assumption would have reduced the net periodic benefit cost by $1.1 for the U.S. plans and $4.4 for the International plans. A 1% reduction in the discount rate assumption would have increased the net periodic benefit cost by $0.8 for the U.S. plans and $5.0 for the International plans. A 1% increase in the expected return on plan assets would have reduced the pension expense by $0.9 for the U.S. plan and $1.4 for the International plans. A 1% reduction in the expected return on plan assets would have increased the pension expense by $0.9 for the U.S. plan and $1.4 for the International plans.
Taxes The Company operates within multiple taxing jurisdictions and is subject to audit in these jurisdictions. These audits can involve complex issues, which may require an extended period of time to resolve. The Company regularly reviews its potential tax liabilities for tax years subject to audit. Changes in the Company’s tax provision and liability occured in 2009, 2008 and 2007 and may occur in the future as its assessments change based on the progress of tax examinations in various jurisdictions and/or changes in worldwide tax regulations. In management’s opinion, adequate provisions for income taxes have been made for all years presented.
Deferred tax assets and liabilities are recognized for the future tax benefits or liabilities attributable to differences between the consolidated financial statement carrying amounts of existing assets and liabilities and their respective tax bases. Deferred tax assets and liabilities are measured using enacted tax rates expected to apply to taxable income in the years in which those temporary differences are expected to be recovered or settled. The effect on deferred tax assets and liabilities of a change in tax rates would be recognized in income in the period that includes the enactment date. The Company regularly reviews its deferred tax assets for recoverability and establishes a valuation allowance when it believes that such assets may not be recovered, taking into consideration historical operating results, expectations of future earnings, changes in its operations and the expected timing of the reversals of existing temporary differences.
24 SIGMA-ALDRICH 2009 ANNUAL REPORT
Management’s Discussion And Analysis (continued)
($ In Millions, Except Per Share Data)
The following should be read in conjunction with the consolidated financial statements and related notes.
OPERATING RESULTS

Sales Sales decreased by 2.4% in 2009 and increased by 7.9% and 13.4% in 2008 and 2007, respectively. The decline in 2009 was primarily driven by changes in foreign currency exchange rates, which lowered sales by 4.1%, and lower unit volumes driven primarily from the worldwide recession. These declines were partially offset by price increases which increased sales by 4.0%.
The sales growth in 2008 was attributable to unit volume growth, currency benefits and price increases. The currency benefit in 2008 increased sales by 2.7%. The 2008 price increase by the Company improved sales by 2.0%.
Reported sales growth (declines), currency impacts, sales increases from acquisitions and the organic sales changes are as follows:
| Year Ended December 31, 2009 | ||||||||||||
| Reported | Currency Impact |
Acquisition | Organic | |||||||||
| Research Essentials |
(0.8 | )% | (4.7 | )% | — | % | 3.9 | % | ||||
| Research Specialties |
(3.7 | ) | (4.3 | ) | — | 0.6 | ||||||
| Research Biotech |
— | (3.6 | ) | — | 3.6 | |||||||
| Research Chemicals |
(2.2 | ) | (4.3 | ) | — | 2.1 | ||||||
| SAFC |
(3.1 | ) | (3.7 | ) | — | 0.6 | ||||||
| Total |
(2.4 | )% | (4.1 | )% | — | % | 1.7 | % | ||||
| Year Ended December 31, 2008 | ||||||||||||
| Reported | Currency Benefit |
Acquisition | Organic | |||||||||
| Research Essentials |
7.7 | % | 2.8 | % | — | % | 4.9 | % | ||||
| Research Specialties |
9.4 | 3.0 | — | 6.4 | ||||||||
| Research Biotech |
10.0 | 3.0 | — | 7.0 | ||||||||
| Research Chemicals |
9.1 | 2.9 | — | 6.2 | ||||||||
| SAFC |
5.2 | 2.0 | 0.7 | 2.5 | ||||||||
| Total |
7.9 | % | 2.7 | % | 0.2 | % | 5.0 | % | ||||
| Year Ended December 31, 2007 | ||||||||||||
| Reported | Currency Benefit |
Acquisition | Organic | |||||||||
| Research Essentials |
10.0 | % | 5.0 | % | — | % | 5.0 | % | ||||
| Research Specialties |
12.5 | 5.0 | — | 7.5 | ||||||||
| Research Biotech |
9.1 | 4.5 | — | 4.6 | ||||||||
| Research Chemicals |
11.1 | 4.9 | — | 6.2 | ||||||||
| SAFC |
19.5 | 4.4 | 7.6 | 7.5 | ||||||||
| Total |
13.4 | % | 4.8 | % | 2.1 | % | 6.5 | % | ||||
2009 Organic sales growth in Research Essentials, Research Specialties, Research Biotech and SAFC for 2009 was 3.9%, 0.6%, 3.6% and 0.6%, respectively.
Research Essentials sales growth was due to increased demand in all world areas with the strongest growth in CAPLA (Canada, Asia Pacific and Latin America). Customer segments primarily driving the unit’s growth were pharmaceutical and academic accounts. A significant contributing factor to the organic growth in this business unit was due to a worldwide shortage of a certain solvent which drove higher prices and volumes during the first half of the year.
Modest growth compared to 2008 in Research Specialties sales was due to decreased demand from the chemistry, commercial labs and diagnostic customer groups, specifically in the U.S. Product groups showing decreased demand compared to 2008 were Chemistry and Lab Equipment. Analytical products growth over the prior year was in the mid single digits.
Research Biotech had sales growth in the mid single digits in Europe and CAPLA, with lower growth rates reflected in the U.S. Product groups contributing the most to this growth were cell signaling and protein assays.
SAFC growth in 2009 was focused in Europe due primarily to increased demand for H1N1 vaccine adjuvants. The U.S. reflected a weakness in the chemical industry segment. Product groups with the best growth compared to 2008 were bioscience and pharmaceutical products, with hitech reflecting the most pressure on demand.
Our initiative to increase e-commerce sales continued to show progress. Web-based sales increased to 45% of total Research sales in 2009 from 42% in 2008.
2008 Organic sales growth in Research Essentials, Research Specialties, Research Biotech and SAFC for 2008 was 4.9%, 6.4%, 7.0% and 2.5%, respectively.
Research Essentials sales growth was due to increased demand in all world areas with the strongest growth in CAPLA. Customer segments primarily driving the unit’s growth were commercial labs and industrial companies.
Research Specialties sales growth was due to gains in biotechnology, hospital and academic accounts. Product initiatives driving this growth were Analytical and Lab equipment. Europe was the strongest driver of growth from a geography perspective.
Research Biotech had its strongest growth in CAPLA followed by the U.S. customer segments. Contributing to this growth were commercial, industrial and diagnostics companies. Molecular biology was the initiative with the best growth over the prior year.
SAFC growth in 2008 was driven by strong demand in biotechnology, diagnostics, commercial labs and academic customer segments. Demand for SAFC products in CAPLA showed the strongest growth over the prior year compared to Europe and the U.S. Hitech was the initiative with the highest growth during 2008.
Our goal to accelerate growth in our non-European International markets was achieved, increasing sales in these markets to approximately 21% of total sales for 2009, an increase of 1% from 2008. In the Company’s focus markets of China, India and Brazil, sales collectively grew organically by 18% for the fourth quarter and full year of 2009 over the prior year levels.
2010 Outlook Modest improvement in market conditions, the ongoing implementation of programs already in place and the addition of new initiatives to enhance our growth over underlying market rates are expected to provide organic sales growth in the mid single-digit range for 2010, excluding any benefit from acquisitions. Sales initiatives include new opportunities in analytical and biology products and exploiting the Company’s broad knowledge of chemistry with more offerings to the high tech market place. Investments are also planned to strengthen the e-commerce channel, expand presence in emerging markets and for selective technology partnerships. This outlook does not include a significant amount of sales from stimulus and other funding by the U.S. and other world governments as the timing and level of funding remains unclear.
2009 ANNUAL REPORT SIGMA-ALDRICH 25
Management’s Discussion And Analysis (continued)
($ In Millions, Except Per Share Data)
The following should be read in conjunction with the consolidated financial statements and related notes.
OPERATING RESULTS (continued)
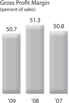
Gross Profit Margin Gross profit margin was 50.7%, 51.3%, and 50.8% of sales in 2009, 2008 and 2007, respectively. The following table reflects the significant contributing factors to the net change in gross profit margin for the years ended December 31, 2009, 2008 and 2007, respectively, as a percentage of sales compared to the same period in the prior year:
| Year Ended December 31, | |||||||||
| Contributing Factors |
2009 | 2008 | 2007 | ||||||
| Favorable pricing |
2.2 | % | 0.9 | % | 0.6 | % | |||
| Lower/(higher) manufacturing and distribution costs |
1.2 | (0.9 | ) | (1.8 | ) | ||||
| Unfavorable product mix and other |
(1.8 | ) | (1.7 | ) | (0.9 | ) | |||
| (Lower)/higher unit sales volume |
(0.3 | ) | 0.4 | 0.6 | |||||
| Favorable/(unfavorable) currency impact |
(1.9 | ) | 1.8 | 1.1 | |||||
| Net (decline)/improvement in gross profit margin as a percentage of sales |
(0.6 | )% | 0.5 | % | (0.4 | )% | |||
The decrease in gross profit margin as a percentage of sales of 0.6% in 2009 was primarily due to the impact of changes in foreign currency rates, unfavorable product mix and lower unit volumes. These were partially offset by favorable pricing and lower manufacturing and distribution costs.
The increase in gross profit margin as a percentage of sales of 0.5% in 2008 was primarily due to the impact of changes in foreign currency rates, favorable pricing and higher unit volumes. These were offset by unfavorable product mix and higher manufacturing and distribution costs.
We have various cost containment initiatives underway, including a supply chain initiative, which we expect to continue to provide benefits in 2010. The Company’s supply chain project is a five-year project, which commenced in 2007, expected to improve service and expand margins by up to 150 basis points when complete in 2012. The project is focused on improving how the Company procures goods and services, manages inventory and optimizes its various other supply chain activities. We also expect currency to add a small benefit to the gross profit margin in 2010.
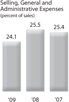
Selling, General and Administrative Expenses Selling, general and administrative expenses were 24.1%, 25.5%, and 25.4% of sales in 2009, 2008 and 2007, respectively. Changes in foreign currency exchange rates increased selling, general and administrative expenses by 30 basis points in 2009 compared to 2008. Decreases in selling, general and administrative expenses in 2009 were driven largely by the Company’s effort to carefully control discretionary spending, including travel and entertainment, catalog and advertising expenses which contributed 0.7% to the overall decrease. The remaining improvement over 2008 levels relates mainly to non-recurring 2008 investment losses and legal settlement costs.
In 2008, investment losses and a legal settlement were the primary drivers of the increase in selling general and administrative expenses representing a 0.5% increase as a percentage of sales from 2007 levels. These amounts were primarily offset by decreases in salaries and wages and legal and professional consulting expenses, aggregating 0.4% of sales.
Restructuring Costs During the year ended December 31, 2009, the Company committed to a plan that includes exit activities at five manufacturing sites in the U.S. and Europe, which are anticipated to occur over the next 12–18 months. These exit activities impact approximately 200 employees and are intended to reduce the Company’s fixed cost structure and better align its global manufacturing and distribution footprint. Additionally, in 2009 the Company initiated a voluntary retirement program that was accepted by approximately 90 eligible U.S. employees as part of its cost reduction and long-term profit enhancement initiatives. In 2009, restructuring costs were $9.2. The Company expects to further reduce its workforce by approximately 100 people, some of which have already occurred in 2010. The remaining reductions will take place over the next twelve months.
The Company expects that the execution of these activities will result in additional pre-tax restructuring costs of approximately $21.8 in the next 12–18 months. Once fully implemented, the Company expects annual savings associated with these activities in a range from $15.0 to $20.0. The Company will continue to pursue actions as needed to reduce its fixed cost structure.
Research and Development Expenses Research and development expenses were 2.9% of sales in 2009, 2008 and 2007. Research and development expenses relate primarily to efforts to add new manufactured products and enhance manufacturing processes. All manufactured products currently account for approximately 65% of total sales.
Interest Expense, Net Net interest expense was $10.0, $14.3, and $22.0 in 2009, 2008 and 2007, respectively. Lower interest rates and debt levels in 2009 reduced net interest expense compared to 2008. Lower interest rates in 2008 reduced net interest expense compared to 2007, partially offset by higher debt levels in 2008.
Income Taxes Income taxes, which include federal, state and international taxes were 29.2%, 30.2%, and 28.9% of pretax income in 2009, 2008 and 2007, respectively. The lower effective tax rate for the full year of 2009 compared to the same period in 2008 is primarily due to the reduction of certain tax contingencies resulting from statute of limitation expirations and audit activity in 2009. The higher effective tax rate for the full year of 2008 compared to the same period in 2007 is primarily due to a decrease in the U.S. manufacturing deduction in 2008.
Our effective tax rate for 2010 is expected to be in the range of 30–31%.
Accounting Changes The Financial Accounting Standards Board (“FASB”) issued Statement No. 168, The FASB Accounting Standards Codification and the Hierarchy of Generally Accepted Accounting Principles, a replacement of FASB Statement No. 162 (the “ASC”), in June 2009. Effective for interim and annual periods ended after September 15, 2009, the ASC became the source of authoritative U.S. GAAP recognized by the FASB to be applied by nongovernmental entities. Rules and interpretive releases of the Securities and Exchange Commission (SEC) under authority of federal securities laws are also sources of authoritative GAAP for SEC registrants. This statement is not intended to change existing GAAP and as such did not have an impact on the consolidated financial statements of the Company. The Company has updated its references to reflect the ASC.
26 SIGMA-ALDRICH 2009 ANNUAL REPORT
Management’s Discussion And Analysis (continued)
($ In Millions, Except Per Share Data)
The following should be read in conjunction with the consolidated financial statements and related notes.
LIQUIDITY AND CAPITAL RESOURCES
The Company’s cash flows from operating, investing and financing activities, as reflected in the Consolidated Statements of Cash Flows, are summarized in the following table:
| Years Ended December 31, | ||||||||||||
| 2009 | 2008 | 2007 | ||||||||||
| Net cash provided by (used in): |
||||||||||||
| Operating activities |
$ | 515.7 | $ | 404.0 | $ | 417.0 | ||||||
| Investing activities |
(159.5 | ) | (86.7 | ) | (149.0 | ) | ||||||
| Financing activities |
(250.3 | ) | (273.9 | ) | (212.0 | ) | ||||||
Operating Activities Net cash provided by operating activities increased $111.7 or 27.6% in 2009 compared to 2008. This increase relates primarily to reductions in inventory of $108.7 resulting from enhanced inventory management programs that adjusted lead times and safety stock to reduce inventory levels without impacting service.
Net cash provided by operating activities decreased $13.0 or 3.1% in 2008 compared to 2007. This decrease results primarily from higher pension plan contributions and investments in working capital to support current year growth which were partially offset by increased net income and lower tax payments.
Investing Activities Cash used in investing activities increased $72.8 in 2009 from 2008 primarily due to increased investment and technology purchases of $41.9 and increased capital expenditures of $30.0 The primary driver of the technology investment was an increased interest in Sangamo BioSciences, Inc. (See Liquidity and Risk Management Section.). Capital expenditures increased due to the Company’s expansion of its biotech fermentation facility in Israel and its additional manufacturing capacity for viral products and active pharmaceutical ingredients in the U.S.
Cash used in investing activities decreased $62.3 in 2008 as compared to 2007 primarily due to lower levels of acquisition activity. Capital expenditures increased $12.3 from 2007 to $89.9 in 2008 to expand our business information systems and website capabilities, as well as increasing production and warehousing capacity at certain locations. At December 31, 2009, the Company had $107.9 of construction in progress within its consolidated balance sheets, of which the Company expects over 80% to be placed into service during 2010.
For 2010, capital spending is expected to be approximately $130.0.
Financing Activities Cash used in financing activities decreased by $23.6 in 2009 compared to 2008. This decrease was driven by a $354.0 decline in treasury stock purchases. This decrease was partially offset by the increase of $405.2 in net repayments of short-term debt.
In 2008, cash used in financing activities increased $61.9 from 2007. This increase is due primarily to payments for treasury stock purchases of $421.2 compared to $184.3 in 2007, as well as repayment of $90.0 in long-term debt. These cash outflows were partially offset by an increase in short-term debt of $270.5 in 2008 compared to $61.8 in 2007.
Share Repurchases On October 20, 2008, the Board of Directors authorized the repurchase of up to an additional 10.0 million shares under the existing repurchase program, to be available for purchase within three years, bringing the total authorization to 100.0 million shares. At December 31, 2009 and December 31, 2008, the Company had repurchased a total of 93.7 million shares and 92.3 million shares, respectively. There were 121.7 million shares outstanding as of December 31, 2009. The Company expects to continue to offset the dilutive impact of issuing incentive compensation by future repurchases. Further, the Company may repurchase additional shares, but the timing and amount will depend on market conditions and other factors.
Liquidity and Risk Management Liquidity risk refers to the risk that the Company might be unable to meet potential cash outflows promptly and cost effectively. Factors that could cause such risk to arise might be disruption to the securities and credit markets, downgrades in the Company’s credit rating or the unavailability of funds. In addition to the Company’s cash flows from operations, the Company utilizes commercial paper, its credit facilities and long-term debt as funding sources. The Company maintains committed bank lines of credit to support its commercial paper borrowings, term loans and local bank lines of credit to support international operations. Downgrades in the Company’s credit rating or other limitations on the ability to access short-term financing, including the ability to refinance short-term debt as it becomes due, would increase interest costs and adversely affect profitability.
The Company continues to assess the potential impact of recent trends in the global economic environment on its liquidity and overall financial condition, particularly with respect to the Company’s availability of and access to short-term credit, including the market for commercial paper.
Management does not believe that a significant risk exists of commercial paper or other credit becoming unavailable within the next 12 months. Management believes that the Company’s financial condition is such that internal and external resources are sufficient and available to satisfy the Company’s requirements for debt service, capital expenditures, acquisitions, dividends, share repurchases, funding of pension and other post-retirement benefit plan obligations, and working capital presently and for the next 12 months.
The Company has a $450.0 five-year revolving credit facility with a syndicate of banks in the U.S. that supports the Company’s commercial paper program. In October 2009, the Company received a one-year extension for a $30.0 portion of the facility, which extends the maturity of the entire $450.0 to December 11, 2012. At December 31, 2009 and December 31, 2008, the Company did not have any borrowings outstanding under this facility.
In March 2007, the Company entered into a $200.0 seven-year multi-currency European revolving credit facility with a syndicate of banks having a maturity date of March 13, 2014. There were no borrowings outstanding at December 31, 2009 and $135.9 was outstanding at December 31, 2008.
Sigma-Aldrich Korea Limited has a short-term credit facility denominated in Korean Won. Although the reported borrowings of the facility were due and repaid on June 11, 2009, the facility is still available to the Company with a total commitment of 20 billion Korean Won ($17.2) at December 31, 2009. There were no outstanding borrowings under this facility at December 31, 2009.
The Company has other short-term credit facilities denominated in foreign currencies, excluding those mentioned above. Although there were no borrowings under the facilities supporting this debt at December 31, 2009, the facilities are available to the Company with total commitments converted into U.S. Dollars of $25.1 at December 31, 2009.
Long-term debt at December 31, 2009 was $100.0 compared to $200.1 in 2008. This decline was a result of the Company reclassifying $100.0 to short-term debt as it comes due on September 12, 2010. Total debt as a percentage of total capitalization was 25.5% and 34.6% at December 31, 2009 and 2008, respectively. The primary reason for the reduction in the debt to capitalization ratio is due to a $152.4 reduction in total debt during 2009. Total debt at December 31, 2009 was $576.5 compared to $728.9 at December 31, 2008.
For a description of the Company’s material debt covenants, see Notes 5 and 6 to the consolidated financial statements.
On October 5, 2009, the Company announced a major expansion of its existing license agreement with Sangamo BioSciences, Inc. (“Sangamo”) to include the exclusive rights to develop and distribute zinc finger DNA binding protein (“ZFP”)-modified cell lines for commercial production of protein pharmaceuticals and ZFP-engineered transgenic animals for livestock, companion animals and therapeutic protein production. Under this agreement, the Company made initial payments of $20.0 to Sangamo, consisting of an upfront license payment of $15.0 and $5.0 for the purchase of shares of Sangamo common stock. Sangamo is eligible to earn additional contingent commercial license fees of up to $5.0 based on certain conditions and additional contingent milestone payments of up to $25.0 based on cumulative sales.
2009 ANNUAL REPORT SIGMA-ALDRICH 27
Management’s Discussion And Analysis (continued)
($ In Millions, Except Per Share Data)
The following should be read in conjunction with the consolidated financial statements and related notes.
OTHER MATTERS
The Company is involved in legal proceedings generally incidental to its business, as described below:
Insurance and Other Contingent Liabilities and Commitments The Company is a defendant in several lawsuits and claims related to the normal conduct of its business, including lawsuits and claims related to product liability and personal injury matters. The Company accrues for such liabilities when it is probable that future costs (including legal fees and expenses) will be incurred and such costs can be reasonably estimated. The Company has self-insured retention limits and has obtained insurance to provide coverage above the self-insured limits for product liability and personal injury claims, subject to certain limitations and exclusions. Reserves have been provided to cover expected payments for these self-insured amounts at December 31, 2009.
In one group of lawsuits and claims, the Company, as well as others engaged in manufacturing and distributing similar products, was a defendant in multiple claims alleging injuries from exposure to various chemicals by a limited number of employees of one electronics manufacturer. These claims were filed in three states. A global settlement has been reached for all cases, which has been approved by the court. The settlement is not significant to the Company’s consolidated financial statements.
In another group of lawsuits and claims, the Company provided a product for use in research activities in developing various vaccines at pharmaceutical companies. The Company, together with other manufacturers and distributors offering the same product and several pharmaceutical companies, has been named as a defendant and served in 294 lawsuits, of which 126 lawsuits have been dismissed to date. Several of the outstanding suits have been stayed by various state and federal courts pending a decision on coverage available under a U.S. federal government relief program. No definite date has been set for this decision. In all cases, the Company believes its products in question were restricted to research use and that proper information for safe use of the products was provided to the customer.
In another group of lawsuits and claims, the Company, as well as others engaged in manufacturing and distributing flavoring products, is a defendant in multiple claims alleging personal injuries from exposure to the products. The Company has been named as a defendant and served in 19 lawsuits, 15 of which have been dismissed or settled. These claims have been filed in six states. The Company is vigorously defending its rights to the claims. The Company believes it is covered by insurance for the above matters, subject to its self-insurance retention limits.
A class action complaint was filed against a subsidiary of the Company in the Montgomery County, Ohio Court of Common Pleas related to a 2003 explosion in a column at the Company’s Isotec facility in Miamisburg, Ohio. The case was separated into the following four phases: phase one — existence of liability, phase two — quantification of any compensatory damages, phase three — existence of any punitive damages and phase four — quantification of any punitive damages. Class certification was granted to phases one, three and four, but denied to phase two. Compensatory damages for all plaintiffs must be established before the case can proceed to the punitive damages phases. The Company has accepted responsibility for phase one, existence of liability. The case is currently in the compensatory damages phase, where, because no class status exists, each plaintiff must individually establish actual damages. The initial phase two, compensatory damages trial for 31 plaintiffs was completed on April 27, 2007 with a jury verdict establishing actual damages of approximately two hundred dollars per plaintiff. The plaintiffs filed an appeal staying further action on the case until the appeal has been resolved. The Ohio Court of Appeals reversed the jury’s verdict on compensatory damages. The Ohio Supreme Court has heard oral argument in December 2009, with a decision expected in early 2010. The Company continues to believe it has substantial legal defenses to the allegations, which it will vigorously assert.
The Company believes its reserves and insurance for these and other matters are sufficient to provide for claims outstanding at December 31, 2009. While the outcome of the current claims cannot be predicted with certainty, the possible outcome of the claims is reviewed at least quarterly and reserves adjusted as deemed appropriate based on these reviews. Based on current information available, the Company believes that the ultimate resolution of these matters will not have a material adverse effect on its consolidated financial condition, results of operations or liquidity. Future claims related to the use of these categories of products may not be covered in full by the Company’s insurance program.
At December 31, 2009, there were no other known contingent liabilities that management believes could have a material adverse effect on the Company’s consolidated financial condition, results of operations or liquidity and there were no material commitments outside of the normal course of business. Material commitments in the normal course of business include notes payable, long-term debt, lease commitments and pension and other post-retirement benefit obligations which are disclosed in Note 5, Note 6, Note 8 and Note 14, respectively, to the consolidated financial statements contained in the Company’s Annual Report on Form 10-K for the year ended December 31, 2009.
INFLATION
Management recognizes that inflationary pressures may have an adverse effect on the Company through higher asset replacement costs and higher material and other operating costs. The Company tries to minimize these effects through cost reductions and productivity improvements as well as price increases to maintain reasonable profit margins. It is management’s view, however, that inflation has not had a significant impact on operations in the three years ended December 31, 2009.
MARKET RISK SENSITIVE INSTRUMENTS AND POSITIONS
The market risk inherent in the Company’s financial instruments and positions represents the potential loss arising from adverse changes in interest rates and foreign currency exchange rates.
Interest Rates At December 31, 2009, the Company’s outstanding debt represents 25.5% of total capitalization. Approximately 35% of the Company’s outstanding debt at December 31, 2009 is at a fixed rate. Cash flows from operations and available credit facilities are sufficient to meet the working capital requirements of the Company. It is management’s view that market risk or variable interest rate risk will not significantly impact the Company’s results of operations.
Foreign Currency Exchange Rates The functional currency of the Company’s international subsidiaries is generally the currency in the respective country of residence of the subsidiary. The translation from the functional currencies to the U.S. dollar for revenues and expenses is based on the average exchange rate during the period. Changes in foreign currency exchange rates have affected and may continue to affect the Company’s revenues, expenses, net income and stockholders’ equity.
The Company transacts business in many parts of the world and is subject to risks associated with changing foreign currency exchange rates. The Company’s objective is to minimize the impact of foreign currency exchange rate changes during the period of time between the original transaction date and its cash settlement.
Accordingly, the Company uses forward exchange contracts to hedge the value of certain receivables and payables denominated in foreign currencies. Gains and losses on these contracts, based on the difference in the contract rate and the spot rate at the end of each month for all contracts still in force, are typically offset either partially or completely by transaction gains and losses, with any net gains and losses included in selling, general and administrative expenses. The market risk of these forward exchange contracts represents the potential loss in fair value of net currency positions at year-end due to an adverse change in foreign currency exchange rates. The Company does not enter into foreign currency contracts for speculative trading purposes. The Company’s policy is to manage the risks associated with existing receivables, payables and commitments.
28 SIGMA-ALDRICH 2009 ANNUAL REPORT
Management’s Discussion And Analysis (continued)
($ In Millions, Except Per Share Data)
The following should be read in conjunction with the consolidated financial statements and related notes.
MARKET RISK SENSITIVE INSTRUMENTS AND POSITIONS (continued)
The Company continues to assess the potential impact of recent trends in the global economic environment on the availability of and its access to these forward currency exchange contracts in the open market, as well as the ability of the counterparties to meet their obligations. Given that a majority of the forward exchange contracts are in currencies such as the U.S. dollar, Euro and British pound, management does not believe that a significant risk exists of these forward contracts becoming unavailable in the global marketplace within the next 12 months.
The market risk of the Company’s forward exchange contracts at December 31, 2009, assuming a hypothetical 10% change in foreign currency exchange rates, would be less than $1.1 on income before income taxes.
AGGREGATE CONTRACTUAL OBLIGATIONS
The following table presents contractual obligations of the Company at December 31, 2009:
| Payments due by period | |||||||||||||||
| Contractual Obligations |
Total | Less than 1 year |
1–3 years |
3–5 years |
More than 5 years | ||||||||||
| Long-term debt |
$ | 200.0 | $ | 100.0 | $ | 100.0 | $ | — | $ | — | |||||
| Interest payments related to long-term debt |
12.8 | 9.0 | 3.8 | — | — | ||||||||||
| Operating lease obligations |
127.8 | 37.0 | 50.8 | 24.0 | 16.0 | ||||||||||
| Purchase obligations(1) |
125.0 | 59.7 | 42.7 | 22.3 | 0.3 | ||||||||||
| Total |
$ | 465.6 | $ | 205.7 | $ | 197.3 | $ | 46.3 | $ | 16.3 | |||||
| (1) | Purchase obligations include open purchase orders, long-term service and supply agreements and other contractual obligations. |
See Notes 6 and 8 to the consolidated financial statements for additional disclosures related to long-term debt and lease commitments, respectively. See Note 14 to the consolidated financial statements for the Company’s obligations with respect to its pension and post-retirement medical benefit plans. The above table excludes $24.7 of liabilities related to uncertainty in income taxes. See Note 10 to the consolidated financial statements for detail on this obligation.
FORWARD-LOOKING STATEMENTS
Management’s Discussion and Analysis and other sections of this Annual Report to shareholders should be read in conjunction with the consolidated financial statements and notes thereto.
Except for historical information, the statements in this discussion may be deemed to include or incorporate forward-looking statements within the meaning of Section 27A of the Securities Act of 1933 and Section 21E of the Securities Exchange Act of 1934 that involve risk and uncertainty, including financial, business environment and projections. These include “outlook” as well as statements that are preceded by, followed by, or that include the words “believes,” “expects,” “plans,” “anticipates,” “should” or similar expressions, and other statements contained herein regarding matters that are not historical facts. Additionally, this Annual Report to shareholders contains forward-looking statements relating to future performance, goals, strategic actions and initiatives and similar intentions and beliefs, including, without limitation, statements regarding the Company’s expectations, goals, beliefs, intentions and the like regarding future sales, earnings, return on equity, cost savings, process improvements, free cash flow, share repurchases, capital expenditures, acquisitions and other matters. These statements are based on assumptions regarding the Company operations, investments, acquisitions and conditions in the markets the Company serves.
The Company believes these assumptions are reasonable and well founded. The statements in this Annual Report to shareholders are subject to risks and uncertainties, including, among others, certain economic, political and technological factors. Actual results could differ materially from those stated or implied in this Annual Report to shareholders, due to, but not limited to, such factors as:
| (1) | global economic conditions, |
| (2) | changes in pricing and the competitive environment and the global demand for its products, |
| (3) | fluctuations in foreign currency exchange rates, |
| (4) | changes in research funding and the success of research and development activities, |
| (5) | dependence on uninterrupted manufacturing operations, |
| (6) | changes in the regulatory environment in which the Company operates, |
| (7) | changes in worldwide tax rates or tax benefits from domestic and international operations, including the matters described in Note 10 – Income Taxes – to the consolidated financial statements, |
| (8) | exposure to litigation including product liability claims, |
| (9) | the ability to maintain adequate quality standards, |
| (10) | reliance on third-party package delivery services, |
| (11) | failure to achieve planned cost reductions in global supply chain initiatives and restructuring actions, |
| (12) | an unanticipated increase in interest rates, |
| (13) | failure of planned sales initiatives in our Research and SAFC businesses, |
| (14) | other changes in the business environment in which the Company operates, and |
| (15) | the outcome of the outstanding matters described in Note 11 – Contingent Liabilities and Commitments – to the consolidated financial statements. |
A further discussion of the Company’s risk factors can be found in Item 1A of Part I of the Company’s December 31, 2009 Form 10-K. The Company does not undertake any obligation to update these forward-looking statements.
2009 ANNUAL REPORT SIGMA-ALDRICH 29
Consolidated Statements of Income
($ In Millions, Except Per Share Data)
| Years ended December 31, | |||||||||
| 2009 | 2008 | 2007 | |||||||
| Net sales |
$ | 2,147.6 | $ | 2,200.7 | $ | 2,038.7 | |||
| Cost of products sold |
1,057.7 | 1,070.8 | 1,002.7 | ||||||
| Gross profit |
1,089.9 | 1,129.9 | 1,036.0 | ||||||
| Selling, general and administrative expenses |
518.1 | 561.6 | 517.1 | ||||||
| Research and development expenses |
63.0 | 64.5 | 59.3 | ||||||
| Restructuring costs |
9.2 | — | — | ||||||
| Operating income |
499.6 | 503.8 | 459.6 | ||||||
| Interest, net |
10.0 | 14.3 | 22.0 | ||||||
| Income before income taxes |
489.6 | 489.5 | 437.6 | ||||||
| Provision for income taxes |
142.9 | 148.0 | 126.5 | ||||||
| Net income |
$ | 346.7 | $ | 341.5 | $ | 311.1 | |||
| Weighted average number of shares outstanding — Basic (in millions) |
121.9 | 126.3 | 130.6 | ||||||
| Weighted average number of shares outstanding — Diluted (in millions) |
123.7 | 128.8 | 133.1 | ||||||
| Net income per share — Basic |
$ | 2.84 | $ | 2.70 | $ | 2.38 | |||
| Net income per share — Diluted |
$ | 2.80 | $ | 2.65 | $ | 2.34 | |||
The accompanying notes are an integral part of these statements.
30 SIGMA-ALDRICH 2009 ANNUAL REPORT
($ In Millions, Except Per Share Data)
| December 31, | ||||||||
| 2009 | 2008 | |||||||
| ASSETS |
||||||||
| Current assets: |
||||||||
| Cash and cash equivalents |
$ | 372.5 | $ | 251.8 | ||||
| Accounts receivable |
285.2 | 269.8 | ||||||
| Inventories |
609.0 | 661.8 | ||||||
| Deferred taxes |
53.3 | 45.9 | ||||||
| Other current assets |
63.5 | 79.9 | ||||||
| Total current assets |
1,383.5 | 1,309.2 | ||||||
| Property, plant and equipment: |
||||||||
| Land |
49.0 | 49.0 | ||||||
| Buildings and improvements |
694.7 | 674.6 | ||||||
| Machinery and equipment |
800.2 | 757.5 | ||||||
| Construction in progress |
107.9 | 41.4 | ||||||
| Less — accumulated depreciation |
(942.9 | ) | (862.1 | ) | ||||
| Property, plant and equipment, net |
708.9 | 660.4 | ||||||
| Goodwill, net |
400.7 | 388.3 | ||||||
| Intangibles, net |
129.3 | 120.6 | ||||||
| Other assets |
91.4 | 78.0 | ||||||
| Total assets |
$ | 2,713.8 | $ | 2,556.5 | ||||
| LIABILITIES AND STOCKHOLDERS’ EQUITY |
||||||||
| Current liabilities: |
||||||||
| Notes payable and current maturities of long-term debt |
$ | 476.5 | $ | 528.8 | ||||
| Accounts payable |
112.4 | 114.6 | ||||||
| Payroll |
51.0 | 58.6 | ||||||
| Income taxes |
42.2 | 41.1 | ||||||
| Other |
59.8 | 50.8 | ||||||
| Total current liabilities |
741.9 | 793.9 | ||||||
| Long-term debt |
100.0 | 200.1 | ||||||
| Pension and post-retirement benefits |
93.9 | 92.6 | ||||||
| Deferred taxes |
22.5 | 18.6 | ||||||
| Other liabilities |
69.5 | 72.1 | ||||||
| Total liabilities |
1,027.8 | 1,177.3 | ||||||
| Stockholders’ equity: |
||||||||
| Common stock, $1.00 par value; 300.0 million shares authorized; 201.8 million shares issued at December 31, 2009 and 2008; 121.7 million and 122.1 million shares outstanding at December 31, 2009 and 2008, respectively |
201.8 | 201.8 | ||||||
| Capital in excess of par value |
152.8 | 133.0 | ||||||
| Common stock in treasury, at cost, 80.0 million and 79.7 million shares at December 31, 2009 and 2008, respectively |
(1,983.0 | ) | (1,935.3 | ) | ||||
| Retained earnings |
3,230.4 | 2,954.4 | ||||||
| Accumulated other comprehensive income |
84.0 | 25.3 | ||||||
| Total stockholders’ equity |
1,686.0 | 1,379.2 | ||||||
| Total liabilities and stockholders’ equity |
$ | 2,713.8 | $ | 2,556.5 | ||||
The accompanying notes are an integral part of these statements.
2009 ANNUAL REPORT SIGMA-ALDRICH 31
Consolidated Statements of Stockholders’ Equity
($ In Millions, Except Per Share Data)
| Common Stock |
Capital in Excess of Par Value |
Common Stock in Treasury |
Retained Earnings |
Accumulated Other Comprehensive Income/(Loss) |
Total Stockholders’ Equity |
Comprehensive Income |
|||||||||||||||||||||
| Balance, December 31, 2006 |
$ | 201.8 | $ | 79.1 | $ | (1,375.4 | ) | $ | 2,424.7 | $ | 80.7 | $ | 1,410.9 | ||||||||||||||
| Net income |
— | — | — | 311.1 | — | 311.1 | $ | 311.1 | |||||||||||||||||||
| Other comprehensive income — |
— | — | — | — | 71.5 | 71.5 | 71.5 | ||||||||||||||||||||
| Foreign currency translation |
|||||||||||||||||||||||||||
| Pension and Post Retirement |
— | — | — | — | 8.4 | 8.4 | 8.4 | ||||||||||||||||||||
| Unrealized gain (loss) on securities, net |
— | — | — | — | (0.7 | ) | (0.7 | ) | (0.7 | ) | |||||||||||||||||
| Comprehensive income |
— | — | — | — | — | — | $ | 390.3 | |||||||||||||||||||
| Dividends ($.46 per share) |
— | — | — | (60.0 | ) | — | (60.0 | ) | |||||||||||||||||||
| Shares exchanged for stock options |
— | (0.9 | ) | — | — | — | (0.9 | ) | |||||||||||||||||||
| Exercise of stock options |
— | 17.3 | 24.0 | — | — | 41.3 | |||||||||||||||||||||
| Restricted stock grant |
— | 0.7 | 1.6 | — | — | 2.3 | |||||||||||||||||||||
| Stock-based compensation expense |
— | 13.5 | — | — | — | 13.5 | |||||||||||||||||||||
| Stock repurchases |
— | — | (184.3 | ) | — | — | (184.3 | ) | |||||||||||||||||||
| Adjustment to initially apply FIN 48 |
— | — | — | 3.5 | — | 3.5 | |||||||||||||||||||||
| Balance, December 31, 2007 |
201.8 | 109.7 | (1,534.1 | ) | 2,679.3 | 159.9 | 1,616.6 | ||||||||||||||||||||
| Net income |
— | — | — | 341.5 | — | 341.5 | $ | 341.5 | |||||||||||||||||||
| Other comprehensive income — |
— | — | — | — | (86.4 | ) | (86.4 | ) | (86.4 | ) | |||||||||||||||||
| Foreign currency translation |
|||||||||||||||||||||||||||
| Pension and Post Retirement |
— | — | — | — | (42.2 | ) | (42.2 | ) | (42.2 | ) | |||||||||||||||||
| Unrealized gain (loss) on securities, net |
— | — | — | — | (6.0 | ) | (6.0 | ) | (6.0 | ) | |||||||||||||||||
| Comprehensive income |
— | — | — | — | — | — | $ | 206.9 | |||||||||||||||||||
| Adjustment to initially apply the measurement date features of Statement of Financial Accounting Standards No. 158, net of tax |
— | — | — | (1.0 | ) | — | (1.0 | ) | |||||||||||||||||||
| Dividends ($.52 per share) |
— | — | — | (65.4 | ) | — | (65.4 | ) | |||||||||||||||||||
| Shares exchanged for stock options |
— | (0.6 | ) | — | — | — | (0.6 | ) | |||||||||||||||||||
| Exercise of stock options |
— | 15.0 | 18.1 | — | — | 33.1 | |||||||||||||||||||||
| Restricted stock grant |
— | 1.6 | 1.9 | — | — | 3.5 | |||||||||||||||||||||
| Stock-based compensation expense |
— | 7.3 | — | — | — | 7.3 | |||||||||||||||||||||
| Stock repurchases |
— | — | (421.2 | ) | — | — | (421.2 | ) | |||||||||||||||||||
| Balance, December 31, 2008 |
201.8 | 133.0 | (1,935.3 | ) | 2,954.4 | 25.3 | 1,379.2 | ||||||||||||||||||||
| Net income |
— | — | — | 346.7 | — | 346.7 | $ | 346.7 | |||||||||||||||||||
| Other comprehensive income — |
— | — | — | — | 55.4 | 55.4 | 55.4 | ||||||||||||||||||||
| Foreign currency translation |
|||||||||||||||||||||||||||
| Pension and Post Retirement |
— | — | — | — | 2.8 | 2.8 | 2.8 | ||||||||||||||||||||
| Unrealized gain (loss) on securities, net |
— | — | — | — | 0.5 | 0.5 | 0.5 | ||||||||||||||||||||
| Comprehensive income |
— | — | — | — | — | — | $ | 405.4 | |||||||||||||||||||
| Dividends ($.58 per share) |
— | — | — | (70.7 | ) | — | (70.7 | ) | |||||||||||||||||||
| Shares exchanged for stock options |
— | (0.9 | ) | — | — | — | (0.9 | ) | |||||||||||||||||||
| Exercise of stock options |
— | 14.5 | 16.5 | — | — | 31.0 | |||||||||||||||||||||
| Restricted stock grant |
— | 2.1 | 3.0 | — | — | 5.1 | |||||||||||||||||||||
| Stock-based compensation expense |
— | 6.4 | — | — | — | 6.4 | |||||||||||||||||||||
| Stock repurchases |
— | — | (67.2 | ) | — | — | (67.2 | ) | |||||||||||||||||||
| Minority interest purchase |
— | (2.3 | ) | — | — | — | (2.3 | ) | |||||||||||||||||||
| Balance, December 31, 2009 |
$ | 201.8 | $ | 152.8 | $ | (1,983.0 | ) | $ | 3,230.4 | $ | 84.0 | $ | 1,686.0 | ||||||||||||||
| Common stock shares issued and common stock shares in treasury are summarized below (in millions): | Common Stock Issued |
Common Stock in Treasury |
|||||||||||||||||||||||||
| Balance, December 31, 2006 |
201.8 | 69.8 | |||||||||||||||||||||||||
| Exercise of stock options |
— | (1.4 | ) | ||||||||||||||||||||||||
| Stock repurchases |
— | 4.0 | |||||||||||||||||||||||||
| Balance, December 31, 2007 |
201.8 | 72.4 | |||||||||||||||||||||||||
| Exercise of stock options |
— | (1.0 | ) | ||||||||||||||||||||||||
| Stock repurchases |
— | 8.3 | |||||||||||||||||||||||||
| Balance, December 31, 2008 |
201.8 | 79.7 | |||||||||||||||||||||||||
| Exercise of stock options |
— | (1.1 | ) | ||||||||||||||||||||||||
| Stock repurchases |
— | 1.4 | |||||||||||||||||||||||||
| Balance, December 31, 2009 |
201.8 | 80.0 | |||||||||||||||||||||||||
The accompanying notes are an integral part of these statements.
32 SIGMA-ALDRICH 2009 ANNUAL REPORT
Consolidated Statements of Cash Flows
($ In Millions)
| Years Ended December 31, | ||||||||||||
| 2009 | 2008 | 2007 | ||||||||||
| Cash flows from operating activities: |
||||||||||||
| Net income |
$ | 346.7 | $ | 341.5 | $ | 311.1 | ||||||
| Adjustments to reconcile net income to net cash provided by operating activities: |
||||||||||||
| Depreciation and amortization |
92.4 | 98.6 | 97.8 | |||||||||
| Deferred taxes |
(6.8 | ) | 18.1 | (21.7 | ) | |||||||
| Stock-based compensation expense |
17.0 | 12.2 | 19.0 | |||||||||
| Restructuring costs |
9.1 | — | — | |||||||||
| Loss on investments, net |
— | 5.3 | 0.2 | |||||||||
| Other |
3.1 | 1.7 | (2.6 | ) | ||||||||
| Changes in operating assets and liabilities: |
||||||||||||
| Accounts receivable |
(8.7 | ) | (4.0 | ) | (7.3 | ) | ||||||
| Inventories |
71.2 | (37.5 | ) | (25.2 | ) | |||||||
| Accounts payable |
(5.2 | ) | (12.2 | ) | 26.8 | |||||||
| Income taxes |
(5.3 | ) | (0.1 | ) | 25.0 | |||||||
| Pension obligation |
(0.3 | ) | (20.6 | ) | 2.6 | |||||||
| Other |
2.5 | 1.0 | (8.7 | ) | ||||||||
| Net cash provided by operating activities |
515.7 | 404.0 | 417.0 | |||||||||
| Cash flows from investing activities: |
||||||||||||
| Property, plant and equipment additions |
(119.9 | ) | (89.9 | ) | (77.6 | ) | ||||||
| Purchases of investments |
(25.1 | ) | (1.1 | ) | (8.6 | ) | ||||||
| Proceeds from sale of investments |
8.1 | 11.6 | 8.8 | |||||||||
| Acquisitions of businesses, net of cash acquired |
(6.0 | ) | (6.1 | ) | (67.6 | ) | ||||||
| Purchases of technology |
(19.2 | ) | (1.3 | ) | (5.4 | ) | ||||||
| Other, net |
2.6 | 0.1 | 1.4 | |||||||||
| Net cash used in investing activities |
(159.5 | ) | (86.7 | ) | (149.0 | ) | ||||||
| Cash flows from financing activities: |
||||||||||||
| Net issuance/(repayment) of short-term debt |
(134.7 | ) | 270.5 | 61.8 | ||||||||
| Repayment of long-term debt |
(6.9 | ) | (90.0 | ) | (69.7 | ) | ||||||
| Payment of dividends |
(70.7 | ) | (65.4 | ) | (60.0 | ) | ||||||
| Treasury stock purchases |
(67.2 | ) | (421.2 | ) | (184.3 | ) | ||||||
| Exercise of stock options |
23.3 | 23.8 | 32.4 | |||||||||
| Excess tax benefits from stock-based compensation |
5.9 | 8.4 | 7.8 | |||||||||
| Net cash used in financing activities |
(250.3 | ) | (273.9 | ) | (212.0 | ) | ||||||
| Effect of exchange rate changes on cash |
14.8 | (29.2 | ) | 7.8 | ||||||||
| Net change in cash and cash equivalents |
120.7 | 14.2 | 63.8 | |||||||||
| Cash and cash equivalents at beginning of year |
251.8 | 237.6 | 173.8 | |||||||||
| Cash and cash equivalents at end of year |
$ | 372.5 | $ | 251.8 | $ | 237.6 | ||||||
| Supplemental disclosures of cash flow information: |
||||||||||||
| Income taxes paid |
$ | 145.4 | $ | 120.2 | $ | 113.9 | ||||||
| Interest paid, net of capitalized interest |
13.3 | 23.1 | 29.6 | |||||||||
The accompanying notes are an integral part of these statements.
2009 ANNUAL REPORT SIGMA-ALDRICH 33
Notes To Consolidated Financial Statements
($ In Millions, Except Per Share Data)
NOTE 1: SUMMARY OF SIGNIFICANT ACCOUNTING POLICIES
Nature of Operations Sigma-Aldrich Corporation (“the Company”) develops, manufactures, purchases and distributes a broad range of high quality biochemicals and organic chemicals throughout the world. These chemical products and kits are used in scientific research, including genomic and proteomic research, biotechnology, pharmaceutical development and as key components in pharmaceutical, diagnostic and other high technology manufacturing.
Principles of Consolidation The consolidated financial statements include the accounts of the Company and all majority-owned subsidiaries. All significant intercompany accounts and transactions have been eliminated.
Financial Instruments The Company has no financial instruments that have a materially different fair value than the respective instrument’s carrying value, except as described in Note 6.
Revenue Revenue, which includes shipping and handling fees billed to customers, is recognized upon transfer of title of the product to the customer, which generally occurs upon shipment to the customer, and is not dependent upon any post-shipment obligations.
Research and Development Expenditures relating to the development of new products and processes, including significant improvements to existing products or processes, are expensed as incurred as research and development.
Cash and Cash Equivalents Cash and cash equivalents include cash on hand and investments with original maturities of less than three months.
Property, Plant and Equipment The cost of property, plant and equipment is depreciated over the estimated useful lives of the assets using the straight-line method with lives ranging from three to twelve years for machinery and equipment and fifteen to forty years for buildings and improvements. Depreciation expense was $81.1, $87.1, and $86.1 for the years ended December 31, 2009, 2008 and 2007, respectively. The Company capitalizes interest as part of the cost of constructing major facilities and equipment.
Goodwill Accounting Standards Codification (ASC) Subtopic 350-20 Goodwill requires the Company to assess goodwill for impairment rather than to systematically amortize goodwill against earnings. The goodwill impairment test compares the fair value of a reporting unit to its carrying amount, including goodwill. The Company operates as one reporting unit and its fair value exceeds its carrying value, including goodwill. Therefore, the Company has determined that no impairment of goodwill existed at December 31, 2009 or 2008.
Long-Lived Assets Long-lived assets are reviewed for impairment whenever conditions indicate that the carrying value of assets may not be fully recoverable. Such impairment tests are based on a comparison of the undiscounted cash flows prior to income taxes to the recorded value of the asset. If impairment is indicated, the asset value is written down to its fair market value if readily determinable or its estimated fair value based on discounted cash flows. Any significant unanticipated changes in business or market conditions that vary from current expectations could have an impact on the fair value of these assets and any potential associated impairment.
Foreign Currency Translation Assets and liabilities denominated in foreign currencies are translated at current exchange rates and profit and loss accounts are translated at weighted average exchange rates. Resulting translation gains and losses are included as a separate component of stockholders’ equity in accumulated other comprehensive income or loss.
Use of Estimates The preparation of consolidated financial statements in conformity with U.S. GAAP requires management to make estimates and assumptions that affect the reported amounts of assets and liabilities and disclosures of contingent assets and liabilities at the date of the consolidated financial statements and the reported amounts of revenues and expenses during the years presented. Actual results could differ from those estimates under different assumptions or conditions.
Reclassifications The accompanying consolidated financial statements for prior years contain certain reclassifications to conform with the presentation used in 2009.
Effect of New Accounting Standards The Financial Accounting Standards Board (FASB) issued Statement No. 168, The FASB Accounting Standards Codification and the Hierarchy of Generally Accepted Accounting Principles, a replacement of FASB Statement No. 162, in June 2009. Effective for interim and annual periods ended after September 15, 2009, the ASC became the source of authoritative U.S. GAAP recognized by the FASB to be applied by nongovernmental entities. Rules and interpretive releases of the Securities and Exchange Commission (SEC) under authority of federal securities laws are also sources of authoritative GAAP for SEC registrants. This statement is not intended to change existing GAAP and as such did not have an impact on the consolidated financial statements of the Company. The Company has updated its references to reflect the ASC.
34 SIGMA-ALDRICH 2009 ANNUAL REPORT
Notes To Consolidated Financial Statements (continued)
($ In Millions, Except Per Share Data)
NOTE 2: ALLOWANCE FOR DOUBTFUL ACCOUNTS
Changes in the allowance for doubtful accounts for the years ended December 31, 2009 and 2008 are as follows:
| 2009 | 2008 | |||||
| Balance, beginning of year |
$ | 4.1 | $ | 4.4 | ||
| Additions to reserves |
3.4 | 1.4 | ||||
| Deductions from reserves |
1.0 | 1.7 | ||||
| Balance, end of year |
$ | 6.5 | $ | 4.1 | ||
NOTE 3: INVENTORIES
The principal categories of inventories at December 31, 2009 and 2008 are as follows:
| 2009 | 2008 | |||||
| Finished goods |
$ | 519.6 | $ | 566.9 | ||
| Work in process |
25.8 | 27.2 | ||||
| Raw materials |
63.6 | 67.7 | ||||
| Total |
$ | 609.0 | $ | 661.8 | ||
Inventories are valued at the lower of cost or market. Costs for 74% of inventories are determined using a weighted average actual cost method. Costs for 26% of inventories are determined using the last-in, first-out method. If the value of all last-in, first-out inventories had been determined using the weighted average actual cost method, inventories would have been $2.1, $1.3, and $0.7 higher than reported at December 31, 2009, 2008 and 2007, respectively.
The Company regularly reviews inventories on hand and records a provision for slow-moving and obsolete inventory, inventory not meeting quality standards and inventory subject to expiration. The provision for slow-moving and obsolete inventory is based on current estimates of future product demand, market conditions and related management judgment. Any significant unanticipated changes in future product demand or market conditions that vary from current expectations could have an impact on the value of inventories.
NOTE 4: INTANGIBLE ASSETS
The Company’s amortizable and unamortizable intangible assets at December 31, 2009 and 2008 are as follows:
| Cost | Accumulated Amortization | |||||||||||
| 2009 | 2008 | 2009 | 2008 | |||||||||
| Amortizable intangible assets: |
||||||||||||
| Patents |
$ | 13.1 | $ | 16.7 | $ | 6.3 | $ | 6.6 | ||||
| Licenses |
38.1 | 20.1 | 6.4 | 5.8 | ||||||||
| Customer relationships |
97.3 | 95.1 | 29.9 | 23.1 | ||||||||
| Technical knowledge |
22.0 | 21.1 | 7.5 | 5.6 | ||||||||
| Other |
12.9 | 12.5 | 11.8 | 11.4 | ||||||||
| Total amortizable intangible assets |
$ | 183.4 | $ | 165.5 | $ | 61.9 | $ | 52.5 | ||||
| Unamortizable intangible assets: |
||||||||||||
| Goodwill |
$ | 427.0 | $ | 414.2 | $ | 26.3 | $ | 25.9 | ||||
| Trademarks and trade names |
15.6 | 15.4 | 7.8 | 7.8 | ||||||||
| Total unamortizable intangible assets |
$ | 442.6 | $ | 429.6 | $ | 34.1 | $ | 33.7 | ||||
The Company added $20.5 of acquired amortizable intangible assets during 2009, including adjustments for the finalization of the purchase accounting allocation of various insignificant acquisitions.
The Company recorded amortization expense of $11.4, $11.5, and $11.7, for the years ended December 31, 2009, 2008 and 2007, respectively, related to amortizable intangible assets with estimated useful lives ranging from one to twenty years using a straight-line method. The Company expects to record annual amortization expense for all existing intangible assets in a range from approximately $10.0 to $12.5 from 2010 through 2014.
Changes in net goodwill for the years ended December 31, 2009 and 2008 are as follows:
| 2009 | 2008 | |||||||
| Balance, beginning of year |
$ | 388.3 | $ | 420.3 | ||||
| Adjustments associated with acquisitions |
(0.3 | ) | (0.7 | ) | ||||
| Impact of foreign exchange rates |
12.7 | (31.3 | ) | |||||
| Balance, end of year |
$ | 400.7 | $ | 388.3 | ||||
2009 ANNUAL REPORT SIGMA-ALDRICH 35
Notes To Consolidated Financial Statements (continued)
($ In Millions, Except Per Share Data)
NOTE 5: NOTES PAYABLE
Notes payable consists of the following at December 31, 2009 and 2008:
| December 31, 2009 | December 31, 2008 | |||||||||||
| Out- standing |
Weighted Average Rate |
Out- standing |
Weighted Average Rate |
|||||||||
| Commercial paper(1) |
$ | 376.5 | 0.2 | % | $ | 378.7 | 0.5 | % | ||||
| $200.0 European revolving credit facility, due March 13, 2014(2) |
— | — | 135.9 | 0.6 | % | |||||||
| Sigma-Aldrich Korea limited credit facility, due June 11, 2009(3) |
— | — | 5.1 | 6.2 | % | |||||||
| Other short-term credit facilities(4) |
— | — | 2.2 | 1.5 | % | |||||||
| Total notes payable |
376.5 | 0.2 | % | 521.9 | 0.6 | % | ||||||
| Plus — current maturities of long-term debt |
100.0 | 7.7 | % | 6.9 | 5.3 | % | ||||||
| Total notes payable and current maturities of long-term debt |
$ | 476.5 | 1.8 | % | $ | 528.8 | 0.6 | % | ||||
| (1) | The Company has a $450.0 five-year revolving credit facility with a syndicate of banks in the U.S. that supports the Company’s commercial paper program. In October 2009, the Company received a one-year extension for a $30.0 portion of the facility which extends the maturity of the entire $450.0 to December 11, 2012. At December 31, 2009 and December 31, 2008, the Company did not have any borrowings outstanding under this facility. The syndicated facility contains financial covenants that require the maintenance of consolidated net worth of at least $750.0 and a ratio of consolidated debt to total capitalization of no more than 55%. The Company’s consolidated net worth and total consolidated debt as a percentage of total capitalization, as defined in the credit facility, were $1,538.2 and 27.3%, respectively, at December 31, 2009. |
| (2) | Facility contains financial covenants that require the maintenance of consolidated net worth of at least $750.0 and a ratio of consolidated debt to total capitalization of no more than 55.0%. The Company’s consolidated net worth and consolidated debt as a percentage of total capitalization, as defined in the respective agreement, were $1,538.2 and 27.3%, respectively, at December 31, 2009. |
| (3) | Although the reported borrowings of the facility were due and repaid on June 11, 2009, a total commitment of 20 billion Korean Won ($17.2) remains at December 31, 2009. There were no outstanding borrowings under this facility at December 31, 2009. |
| (4) | Although there were no borrowings under the facilities supporting this debt at December 31, 2009, the facilities are available to the Company with total commitments converted into U.S. Dollars of $25.1 at December 31, 2009. |
The Company has provided guarantees to financial institutions that are lending to certain subsidiaries for any outstanding borrowings from the European revolving credit facility and the short-term credit facility of the wholly-owned Korean subsidiary. There are no existing events of default that would require the Company to honor these guarantees.
NOTE 6: LONG-TERM DEBT
Long-term debt consists of the following at December 31, 2009 and 2008:
| December 31, 2009 | December 31, 2008 | |||||||||||||
| Out- standing |
Weighted Average Rate |
Out- standing |
Weighted Average Rate |
|||||||||||
| Senior notes, due September 12, 2010 (1) |
$ | 100.0 | 7.7 | % | $ | 100.0 | 7.7 | % | ||||||
| Senior notes, due December 5, 2011(2) |
100.0 | 5.1 | % | 100.0 | 5.1 | % | ||||||||
| Other |
— | — | 7.0 | 5.3 | % | |||||||||
| Total |
200.0 | 6.4 | % | 207.0 | 6.4 | % | ||||||||
| Less — current maturities |
(100.0 | ) | 7.7 | % | (6.9 | ) | 5.3 | % | ||||||
| Total long-term debt |
$ | 100.0 | 5.1 | % | $ | 200.1 | 6.4 | % | ||||||
| (1) | The Company, at its option, may redeem all or any portion of the $100.0 of 7.687% Senior Notes by notice to the holder and by paying a make whole amount to the holder as compensation for loss of future interest income. The note agreement contains financial covenants that require the maintenance of consolidated net worth of at least $750.0, a ratio of consolidated debt to total capitalization of no more than 55.0% and an aggregate amount of all consolidated priority debt of no more than 30.0% of consolidated net worth. Consolidated priority debt includes all unsecured debt of any subsidiary in which the Company owns a majority of the voting shares. The Company’s consolidated net worth, consolidated debt as a percentage of total capitalization and consolidated priority debt as a percentage of total consolidated net worth, as defined in the respective agreement, were $1,538.2, 27.3% and 0.0%, respectively, at December 31, 2009. |
| (2) | The Company, at its option, may redeem all or any portion of the $100.0 of 5.11% Senior Notes by notice to the holder and by paying a make whole amount to the holder as compensation for loss of future interest income. The note agreement contains financial covenants that require a ratio of consolidated debt to total capitalization of no more than 60.0% and an aggregate amount of all consolidated priority debt of no more than 30.0% of consolidated net worth. The Company’s consolidated debt as a percentage of total capitalization and consolidated priority debt as a percentage of total consolidated net worth, as defined in the respective agreement, were 25.5% and 0.0%, respectively, at December 31, 2009. |
Total interest expense incurred on short-term and long-term debt, net of amounts capitalized, was $12.3, $21.0, and $28.9 in 2009, 2008, and 2007, respectively.
The fair value of long-term debt, as calculated using the aggregate cash flows from principal and interest payments over the life of the debt, was approximately $205.8 and $221.4 at December 31, 2009 and 2008, respectively, based upon a discounted cash flow analysis using current market interest rates.
36 SIGMA-ALDRICH 2009 ANNUAL REPORT
Notes To Consolidated Financial Statements (continued)
($ In Millions, Except Per Share Data)
NOTE 7: FINANCIAL DERIVATIVES AND RISK MANAGEMENT
The Company transacts business in many parts of the world and is subject to risks associated with changing foreign currency exchange rates. The Company’s objective is to minimize the impact of foreign currency exchange rate changes during the period of time between the original transaction date and its cash settlement. Accordingly, the Company enters into forward currency exchange contracts in order to stabilize the value of certain receivables and payables denominated in foreign currencies. None of the contracts have been designated as hedges for accounting purposes. The Company does not enter into foreign currency transactions for speculative trading purposes.
The principal forward currency exchange contracts are for the Euro, Swiss franc, Israeli shekel, British pound, and Chinese yuan. These contracts are recorded at fair value and are included in other current assets and liabilities. Resulting gains and losses are recorded in selling, general and administrative expenses and are partially or completely offset by changes in the value of related exposures. The duration of the contracts typically does not exceed six months.
The Company continues to assess the potential impact of recent trends in the global economic environment on the availability of and its access to these forward currency exchange contracts in the open market, as well as the ability of the counterparties to meet their obligations. Given that a majority of the forward exchange contracts are in currencies such as the U.S. dollar, Euro and British pound, management does not believe that a significant risk exists of these forward contracts becoming unavailable in the global marketplace within the next 12 months.
The notional amount of open forward exchange contracts at December 31, 2009 and 2008 was $128.1 and $210.1, respectively. The fair value of these contracts was immaterial at December 31, 2009 and 2008.
NOTE 8: LEASE COMMITMENTS
The Company and its subsidiaries lease manufacturing, office and warehouse facilities and computer equipment under non-cancelable operating leases expiring at various dates. Rent expense was $39.3, $41.4, and $36.6 in 2009, 2008 and 2007, respectively. Minimum rental commitments for non-cancelable leases in effect at December 31, 2009, are as follows:
| 2010 |
$ | 37.0 | |
| 2011 |
29.0 | ||
| 2012 |
21.8 | ||
| 2013 |
13.6 | ||
| 2014 |
10.4 | ||
| 2015 and thereafter |
16.0 |
NOTE 9: RESTRUCTURING ACTIVITIES
In 2009 the Company committed to a restructuring plan that includes exit activities at five manufacturing sites in the U.S. and Europe. The Company expects to complete these activities over the next 12–18 months. These exit activities impact approximately 200 employees and are intended to reduce the Company’s fixed cost structure and better align its global manufacturing and distribution footprint. Additionally, in 2009 the Company initiated a voluntary retirement program that was accepted by approximately 90 eligible U.S. employees as part of its cost reduction and long-term profit enhancement initiatives. The Company expects to further reduce its workforce by approximately 100 people, some of these actions have already occurred in 2010. The remaining reductions will take place over the next twelve months. Once fully implemented, the Company expects annual savings associated with these activities in a range from $15.0 to $20.0. The Company will continue to pursue actions as needed to reduce its fixed cost structure.
The Company expects that the execution of these activities will result in additional pre-tax restructure costs of approximately $21.8 to be recorded in the next 12-18 months. The following provides a summary of total costs incurred during 2009 and total expected costs associated with these activities by major type of cost:
| Incurred during the year ended December 31, 2009 |
Total estimated amount expected to be incurred | |||||
| Employee termination benefits |
$ | 5.5 | $ | 21.0 | ||
| Other restructuring costs |
3.7 | 10.0 | ||||
| Total restructuring costs |
$ | 9.2 | $ | 31.0 | ||
Employee termination benefits primarily include pension and post-retirement benefit plan charges related to the voluntary retirement program, as well as payments to employees impacted by facility exit and other cost reduction activities. Other restructuring costs relate mainly to changes in the expected useful life of the assets impacted by these restructuring activities.
The following is a rollforward of the liabilities associated with the restructuring activities, since the inception of the plan. The liabilities are reported as a component of either other accrued payroll and payroll taxes or other liabilities in the accompanying consolidated balance sheets.
| Employee Termination Benefits |
Other Restructuring Costs |
Total | ||||||||||
| Charges |
$ | 5.5 | $ | 3.7 | $ | 9.2 | ||||||
| Transferred to pension and other post-retirement benefit plans |
(3.7 | ) | — | (3.7 | ) | |||||||
| Payments and other adjustments |
(0.1 | ) | (2.9 | ) | (3.0 | ) | ||||||
| Balance as of December 31, 2009 |
$ | 1.7 | $ | 0.8 | $ | 2.5 | ||||||
For a further description of the impacts to the pension and other post-retirement benefit plans, see Note 14 – Pension and Other Post-Retirement Benefit Plans - to the consolidated financial statements
2009 ANNUAL REPORT SIGMA-ALDRICH 37
Notes To Consolidated Financial Statements (continued)
($ In Millions, Except Per Share Data)
NOTE 10: INCOME TAXES
The components of income before income taxes consisted of the following for the years ended December 31:
| 2009 | 2008 | 2007 | |||||||
| United States operations |
$ | 319.8 | $ | 321.4 | $ | 286.6 | |||
| International operations |
169.8 | 168.1 | 151.0 | ||||||
| Total income before taxes |
$ | 489.6 | $ | 489.5 | $ | 437.6 | |||
The provision for income taxes consists of the following for years ended December 31:
| 2009 | 2008 | 2007 | |||||||||
| Current: |
|||||||||||
| Federal |
$ | 95.5 | $ | 91.6 | $ | 86.4 | |||||
| State and local |
7.9 | 7.2 | 7.4 | ||||||||
| International |
41.5 | 28.4 | 65.0 | ||||||||
| Total current |
144.9 | 127.2 | 158.8 | ||||||||
| Deferred: |
|||||||||||
| Federal |
(6.1 | ) | 9.4 | (18.1 | ) | ||||||
| State and local |
(0.6 | ) | 0.7 | (0.5 | ) | ||||||
| International |
4.7 | 10.7 | (13.7 | ) | |||||||
| Total deferred |
(2.0 | ) | 20.8 | (32.3 | ) | ||||||
| Provision for income taxes |
$ | 142.9 | $ | 148.0 | $ | 126.5 | |||||
The items accounting for the difference between income taxes computed at the U.S. federal statutory rate and the Company’s effective tax rate are as follows for years ended December 31:
| 2009 | 2008 | 2007 | |||||||
| Statutory tax rate |
35.0 | % | 35.0 | % | 35.0 | % | |||
| U.S. manufacturing deduction |
(1.5 | ) | (1.3 | ) | (2.1 | ) | |||
| State and local income taxes, net of federal benefit |
1.0 | 1.0 | 1.0 | ||||||
| Research and development credits |
(0.7 | ) | (0.7 | ) | (0.8 | ) | |||
| International taxes |
(4.3 | ) | (4.8 | ) | (4.9 | ) | |||
| Tax audits and unrecognized tax positions |
(0.7 | ) | 0.2 | — | |||||
| Other, net |
0.4 | 0.8 | 0.7 | ||||||
| Total effective tax rate |
29.2 | % | 30.2 | % | 28.9 | % | |||
The international taxes benefit is primarily the result of lower statutory tax rates for our international operations and international restructurings. The tax audits and unrecognized tax positions provided a net benefit from statute of limitation expirations and audit activity in 2009.
Undistributed earnings of the Company’s international subsidiaries amounted to approximately $552.0 at December 31, 2009. Upon distribution of those earnings in the form of dividends or otherwise, the Company would be subject to both U.S. income taxes (subject to an adjustment for foreign tax credits) and withholding taxes payable to various foreign countries. The Company may periodically make distributions from its international subsidiaries to its U.S. parent. These distributions will only be made at such time that they are deemed to be tax efficient. As such, the Company does not anticipate that distribution will result in any significant increase to its U.S. tax liability above that which has been previously recorded.
Deferred income tax provisions reflect the effect of temporary differences between consolidated financial statement and tax reporting of income and expense items. The net deferred tax assets/liabilities at December 31, 2009 and 2008, respectively, result from the following temporary differences:
| 2009 | 2008 | |||||||
| Deferred tax assets: |
||||||||
| Inventories |
$ | 41.2 | $ | 32.8 | ||||
| Net operating loss carryforwards |
23.3 | 27.7 | ||||||
| Post-retirement benefits and other employee benefits |
44.3 | 39.3 | ||||||
| Amortization |
22.7 | 27.8 | ||||||
| Pension benefits |
15.1 | 11.4 | ||||||
| Other |
8.2 | 5.2 | ||||||
| Total deferred tax assets |
154.8 | 144.2 | ||||||
| Deferred tax liabilities: |
||||||||
| Property, plant and equipment |
(80.0 | ) | (74.8 | ) | ||||
| Total deferred tax liabilities |
(80.0 | ) | (74.8 | ) | ||||
| Net deferred tax assets (liabilities) |
$ | 74.8 | $ | 69.4 | ||||
The net operating loss carryforwards relate to international operations. At December 31, 2009, $15.6 of these deferred tax assets expire between 2011 and 2015 and the remainder of these assets have no expiration. The Company believes it will have sufficient taxable income to fully utilize the carryforwards prior to expiration.
Deferred tax assets and liabilities in the preceding table, netted by taxing jurisdiction, are included in the following captions in the Consolidated Balance Sheets at December 31:
| 2009 | 2008 | |||||||
| Deferred tax assets |
$ | 53.3 | $ | 45.9 | ||||
| Other assets |
44.0 | 43.6 | ||||||
| Other accrued expenses |
— | (1.5 | ) | |||||
| Deferred tax liabilities |
(22.5 | ) | (18.6 | ) | ||||
| Net deferred tax assets (liabilities) |
$ | 74.8 | $ | 69.4 | ||||
38 SIGMA-ALDRICH 2009 ANNUAL REPORT
Notes To Consolidated Financial Statements (continued)
($ In Millions, Except Per Share Data)
NOTE 10: INCOME TAXES (continued)
Uncertainty in Income Taxes The Company and its subsidiaries file income tax returns for U.S. federal, and for various state, local and international taxes, as applicable. The Company is no longer subject to, with limited exceptions, U.S. federal, state and local, or non-U.S. income tax examinations by tax authorities for years prior to 2005.
The following table sets forth changes in our total gross unrecognized tax benefits, excluding interest and penalties, for the years ended December 31:
| 2009 | 2008 | 2007 | ||||||||||
| Balance, beginning of year |
$ | 32.2 | $ | 32.1 | $ | 33.5 | ||||||
| Tax positions related to current year: |
||||||||||||
| Additions |
3.8 | 4.1 | 4.4 | |||||||||
| Reductions |
— | (0.2 | ) | — | ||||||||
| Tax positions related to prior year: |
||||||||||||
| Additions |
0.6 | 4.2 | 0.6 | |||||||||
| Reductions |
(3.6 | ) | (6.2 | ) | (4.4 | ) | ||||||
| Settlements |
(2.2 | ) | (1.8 | ) | — | |||||||
| Statutes of limitation expirations |
(6.1 | ) | — | (2.0 | ) | |||||||
| Balance, end of year |
$ | 24.7 | $ | 32.2 | $ | 32.1 | ||||||
At December 31, 2009, 2008, and 2007, respectively, there are $16.3, $19.5 and $20.5 of net unrecognized tax benefits that if recognized would affect the annual effective tax rate.
The Company believes it is reasonably possible that the unrecognized tax benefits at December 31, 2009 may decrease by approximately $4.0 to $5.0 due to audit activity and statute of limitation expirations in several jurisdictions within 12 months of December 31, 2009.
The Company accrues interest related to unrecognized tax benefits, net of tax, and penalties as components of its income tax provision. The Company recognized approximately $0.9 of benefit in 2009, and $0.8 and $0.7 of expense in 2008 and 2007, respectively, related to interest and penalties. The Company had accrued approximately $5.0 and $6.3 for payment of interest, net of tax, and penalties as of December 31, 2009 and 2008, respectively.
NOTE 11: CONTINGENT LIABILITIES AND COMMITMENTS
The Company is involved in legal proceedings generally incidental to its business, as described below:
Insurance and Other Contingent Liabilities and Commitments The Company is a defendant in several lawsuits and claims related to the normal conduct of its business, including lawsuits and claims related to product liability and personal injury matters. The Company accrues for such liabilities when it is probable that future costs (including legal fees and expenses) will be incurred and such costs can be reasonably estimated. The Company has self-insured retention limits and has obtained insurance to provide coverage above the self-insured limits for product liability and personal injury claims, subject to certain limitations and exclusions. Reserves have been provided to cover expected payments for these self-insured amounts at December 31, 2009.
In one group of lawsuits and claims, the Company, as well as others engaged in manufacturing and distributing similar products, was a defendant in multiple claims alleging injuries from exposure to various chemicals by a limited number of employees of one electronics manufacturer. These claims were filed in three states. A global settlement has been reached for all cases, which has been approved by the court. The settlement is not significant to the Company’s consolidated financial statements.
In another group of lawsuits and claims, the Company provided a product for use in research activities in developing various vaccines at pharmaceutical companies. The Company, together with other manufacturers and distributors offering the same product and several pharmaceutical companies, has been named as a defendant and served in 294 lawsuits, of which 126 lawsuits have been dismissed to date. Several of the outstanding suits have been stayed by various state and federal courts pending a decision on coverage available under a U.S. federal government relief program. No definite date has been set for this decision. In all cases, the Company believes its products in question were restricted to research use and that proper information for safe use of the products was provided to the customer.
In another group of lawsuits and claims, the Company, as well as others engaged in manufacturing and distributing flavoring products, is a defendant in multiple claims alleging personal injuries from exposure to the products. The Company has been named as a defendant and served in 19 lawsuits, 15 of which have been dismissed or settled. These claims have been filed in six states. The Company is vigorously defending its rights to the claims. The Company believes it is covered by insurance for the above matters, subject to its self-insurance retention limits.
A class action complaint was filed against a subsidiary of the Company in the Montgomery County, Ohio Court of Common Pleas related to a 2003 explosion in a column at the Company’s Isotec facility in Miamisburg, Ohio. The case was separated into the following four phases: phase one — existence of liability, phase two — quantification of any compensatory damages, phase three – existence of any punitive damages and phase four — quantification of any punitive damages. Class certification was granted to phases one, three and four, but denied to phase two. Compensatory damages for all plaintiffs must be established before the case can proceed to the punitive damages phases. The Company has accepted responsibility for phase one, existence of liability. The case is currently in the compensatory damages phase, where, because no class status exists, each plaintiff must individually establish actual damages. The initial phase two, compensatory damages trial for 31 plaintiffs was completed on April 27, 2007 with a jury verdict establishing actual damages of approximately two hundred dollars per plaintiff. The plaintiffs filed an appeal staying further action on the case until the appeal has been resolved. The Ohio Court of Appeals reversed the jury’s verdict on compensatory damages. The Ohio Supreme Court has heard oral argument in December 2009, with a decision expected in early 2010. The Company continues to believe it has substantial legal defenses to the allegations, which it will vigorously assert.
The Company believes its reserves and insurance for these and other matters are sufficient to provide for claims outstanding at December 31, 2009. While the outcome of the current claims cannot be predicted with certainty, the possible outcome of the claims is reviewed at least quarterly and reserves adjusted as deemed appropriate based on these reviews. Based on current information available, the Company believes that the ultimate resolution of these matters will not have a material adverse effect on its consolidated financial condition, results of operations or liquidity. Future claims related to the use of these categories of products may not be covered in full by the Company’s insurance program.
At December 31, 2009, there were no other known contingent liabilities that management believes could have a material adverse effect on the Company’s consolidated financial condition, results of operations or liquidity and there were no material commitments outside of the normal course of business. Material commitments in the normal course of business include notes payable, long-term debt, lease commitments and pension and other post-retirement benefit obligations which are disclosed in Note 5, Note 6, Note 8 and Note 14, respectively, to the consolidated financial statements contained in the Company’s Annual Report on Form 10-K for the year ended December 31, 2009.
2009 ANNUAL REPORT SIGMA-ALDRICH 39
Notes To Consolidated Financial Statements (continued)
($ In Millions, Except Per Share Data)
NOTE 12: COMMON STOCK
The Company’s 2003 Long-Term Incentive Plan (2003 LTIP), permits the granting of incentive or nonqualified stock options as well as stock appreciation rights, performance shares, restricted stock and other stock-based awards. The 2003 LTIP permits the distribution of up to 11,000,000 shares of the Company’s common stock, subject to increase for any shares forfeited under the other plans after the effective date of the 2003 LTIP. Shares issued under the 2003 LTIP may be authorized and unissued shares or treasury shares. This plan permits the award of non-qualified stock options to those members of the Board of Directors who are not employees of the Company. Under this plan, a non-employee Director will receive an initial option to purchase 20,000 shares of common stock on the date of his or her initial election as a Director. Additional awards of options to purchase 10,000 shares are made to each eligible Director on the day after each annual shareholders’ meeting if the non-employee Director has served on the Board of Directors for at least six months. Under this plan, incentive stock options may only be granted to employees of the Company or its subsidiaries, and a participant may not hold incentive stock options with a fair market value, determined as of the grant date, in excess of $0.1 in the year in which they are first exercisable if this limitation is necessary to qualify the option as an incentive stock option. Incentive and nonqualified stock options may not have an option price of less than the fair market value of the shares at the date of the grant. Options generally become exercisable from three months to three years following the grant date and expire ten years after the grant date. Including shares forfeited or swapped, 3,552,945 shares of the Company’s common stock remain to be awarded at December 31, 2009 under this plan.
As of December 31, 2009, the Company expects $19.9 of unrecognized expense related to nonvested stock-based compensation arrangements granted to be incurred in future periods. This expense is expected to be recognized over a weighted average period of 1.4 years.
Stock-based compensation expense charged against income is included in selling, general and administrative expenses. The stock-based compensation expense for the years ended December 31, 2009, 2008 and 2007 was $17.0, $12.2 and $19.0, respectively. The tax benefit related to this expense was $5.2, $3.1 and $4.1 for the years ended December 31, 2009, 2008 and 2007, respectively.
Stock Options The Company measures the total fair value of options on the grant date using the Black-Scholes option-pricing model. The Company then recognizes each grant’s total cost over the period that the options vest based on its calculated fair value. During the year ended December 31, 2009, the Company granted a total of 457,470 stock options under the 2003 LTIP.
The weighted-average assumptions under the Black-Scholes option-pricing model for stock option grants are as follows:
| 2009 | 2008 | 2007 | |||||||
| Expected term (years) |
4.6 | 4.7 | 5.9 | ||||||
| Expected volatility |
28.89 | % | 19.19 | % | 25.12 | % | |||
| Risk-free interest rate |
1.82 | % | 2.72 | % | 4.68 | % | |||
| Dividend yield |
1.04 | % | 1.03 | % | 1.18 | % |
Expected term — The expected term of the options represents the period of time between the grant date of the options and the time the options are either exercised or forfeited, including an estimate of future forfeitures for outstanding options. In accordance with Securities and Exchange Commission Staff Accounting Bulletin No. 107, the Company has used the “simplified” method for “plain vanilla” options to estimate the expected term of options granted prior to 2008.
Expected volatility — The expected volatility is calculated based on an average of the historical volatility of the Company’s stock price for a period approximating the expected term.
Risk-free interest rate — The risk-free interest rates are based on the U.S. Treasury yield curve in effect at the time of grant and a maturity that approximates the expected term.
Dividend yield — The dividend yield is based on the Company’s authorized quarterly dividend, approved by the Board of Directors during the respective periods noted above, and the Company’s expectation for dividend yields over the expected term.
The following table presents activity for the Company’s stock option plans, including the 2003 LTIP, the Stock Option Plan of 2000, the 1998 Directors’ Non-Qualified Share Option Plan and the Share Option Plan of 1995. A summary of the combined stock option activity and other data for the Company’s stock option plans for the year ended December 31, 2009 is as follows:
| Number of Stock Options |
Wtd. Avg. Exercise Price Per Share |
Wtd. Avg. Remaining Contractual Life |
Aggregate Intrinsic Value | ||||||||
| Stock Options outstanding, January 1, 2009 |
6,576,781 | $ | 31.38 | ||||||||
| Granted |
457,470 | 40.02 | |||||||||
| Exercised |
(967,756 | ) | 25.28 | ||||||||
| Forfeited |
(55,959 | ) | 40.53 | ||||||||
| Stock Options outstanding, December 31, 2009 |
6,010,536 | 32.93 | 64.08 months | $ | 107.5 | ||||||
| Stock Options exercisable at December 31, 2009 |
5,136,751 | 31.15 | 58.11 months | $ | 100.7 | ||||||
The aggregate intrinsic value of options exercised during the years ended December 31, 2009, 2008 and 2007 was $24.5, $35.6, and $31.9, respectively.
The weighted average grant date fair value of options granted during the years ended December 31, 2009, 2008 and 2007 was $9.78, $9.96, and $12.58 per share, respectively.
40 SIGMA-ALDRICH 2009 ANNUAL REPORT
Notes To Consolidated Financial Statements (continued)
($ In Millions, Except Per Share Data)
NOTE 12: COMMON STOCK (continued)
Performance Units Performance Unit awards in 2009, 2008 and 2007 were 396,214; 319,845 and 193,580 units, respectively. The Performance Units awarded in 2009, 2008, and 2007 contain a three-year service period and vest beginning on the grant date and ending on December 31, 2011, 2010 and 2009, respectively. The actual Performance Units awarded are determined at the end of the performance period with possible payouts ranging from 0% to 150% of the target amount based upon the achievement of specified performance criteria. One-half of the awards issued are based upon the Company’s three-year average return on equity ratio calculation and one-half of the awards are based upon the Company’s three-year average sales growth (adjusted for currency, but including acquisitions). Each Performance Unit paid will include one-half share of the Company’s common stock and the cash equivalent of one-half share of the Company’s common stock, except that the Company will direct that any fractional shares of stock be paid in cash. The value of the equity portion of a Performance Unit is equivalent to the closing market price of the Company’s stock on the grant date. The Company expenses the expected cost of the equity portion over the vesting period beginning on the grant date and ending on December 31 of the third subsequent fiscal year. The value of the Performance Unit to be paid in cash is determined based on the closing market price of the Company’s stock at each quarter-end and ratably expensed during the remaining performance period. Therefore, the related stock-based compensation expense will fluctuate with the value of the Company’s stock. The expense for the entire number of Performance Units awarded is dependant upon the probability of achieving the specific financial targets and is recorded ratably over the vesting period.
A summary of the Company’s nonvested Performance Units as of December 31, 2009, and changes during the year then ended, is reflected in the table below. The Weighted Average Grant Date Fair Value includes both the fair value at grant date for the equity portion of the Performance Unit and the fair value of the cash portion of the Performance Unit.
| Number of Performance Units |
Wtd. Avg. Grant Date Fair Value | |||||
| Nonvested Performance Units outstanding, January 1, 2009 |
434,027 | $ | 47.43 | |||
| Granted |
396,214 | 38.68 | ||||
| Vested (1) |
(122,553 | ) | 45.50 | |||
| Forfeited (2) |
(95,252 | ) | 52.70 | |||
| Nonvested Performance Units outstanding, December 31, 2009 |
612,436 | 47.94 | ||||
| (1) | Represents the entire amount of performance units which vested during the year ended December 31, 2009, all of which were outstanding as of December 31, 2009. |
| (2) | Includes the reduction to the number of units for the expected payout based on the specified performance criteria at the end of the performance period, December 31, 2009, for the 2007 and 2008 awards at less than 100%. |
The weighted average grant date fair value of performance units granted during the year ended December 31, 2009, 2008, and 2007 was $39.00, $57.24 and $40.45, respectively.
Stock Awards On January 7, 2010 and January 2, 2009 and 2008, each non-employee Director received an additional 1,200 shares of Company stock. The 2010 stock award will be expensed in the first quarter of 2010 based on the fair market value of the Company’s common stock at December 31, 2009. The 2009 stock award was expensed in the first quarter of 2009 based on the fair market value of the Company’s common stock at December 31, 2008. The 2008 stock award was expensed in the first quarter of 2008 based on the fair market value of the Company’s common stock at December 31, 2007.
Restricted Stock Awards On November 17, 2008, the Company issued to certain executives 18,632 shares of restricted stock with a weighted average grant date fair value of $39.58, based on the fair market value of the Company’s common stock at November 17, 2008. These shares will be expensed over a three-year vesting period beginning on the date of grant.
Common Stock Purchase Rights The Company has outstanding one common share purchase right (a “Right”) for each outstanding share of common stock of the Company. Generally, if any person or group acquires 15% or more of the Company’s outstanding voting stock without prior written consent of the Company’s Board of Directors, these Rights become exercisable (except for rights held by the acquiring person). The Rights are currently scheduled to expire in August 2010.
2009 ANNUAL REPORT SIGMA-ALDRICH 41
Notes To Consolidated Financial Statements (continued)
($ In Millions, Except Per Share Data)
NOTE 13: COMPANY OPERATIONS BY BUSINESS UNIT
The Company is organized into four business units featuring the Research units of Essentials, Specialties and Biotech and the Fine Chemicals unit, SAFC, to align the Company with the customers it serves. The business unit structure is the Company’s approach to serving customers and reporting sales rather than any internal division used to allocate resources. Net sales for the Company’s business units are as follows:
| 2009 | 2008 | 2007 | |||||||
| Research Essentials |
$ | 417.5 | $ | 420.9 | $ | 390.7 | |||
| Research Specialties |
793.4 | 824.1 | 753.5 | ||||||
| Research Biotech |
332.3 | 332.2 | 302.0 | ||||||
| Research Chemicals |
1,543.2 | 1,577.2 | 1,446.2 | ||||||
| SAFC |
604.4 | 623.5 | 592.5 | ||||||
| Total |
$ | 2,147.6 | $ | 2,200.7 | $ | 2,038.7 | |||
The Company’s Chief Operating Decision Maker and Board of Directors review profit and loss information on a consolidated basis to assess performance, make overall operating decisions and make resource allocations. The Company’s business units are closely interrelated in their activities and share services such as order entry, billing, technical services, Internet, purchasing and inventory control and share production and distribution facilities. Additionally, these units are supported by centralized functional areas such as finance, human resources, quality, safety and compliance and information technology. Further, the Company’s Chief Operating Decision Maker, Chief Financial Officer and Business Unit Presidents participate in compensation programs which reward performance based upon consolidated Company results for sales growth, operating income growth, return on equity and return on assets. Certain Business Unit Presidents also have a modest component of their compensation program based on their respective business unit sales growth in addition to consolidated sales growth. Based on these factors, the Company concludes that it operates in one segment.
Sales are attributed to countries based upon the location of product shipped. The United States sales to unaffiliated customers presented in the summary below include sales to international markets as follows:
| Year |
Amount | Year | Amount | Year | Amount | ||||||||
| 2009 | $ | 34.8 | 2008 | $ | 31.5 | 2007 | $ | 30.5 | |||||
Geographic financial information is as follows:
| 2009 | 2008 | 2007 | |||||||
| Net sales to unaffiliated customers: |
|||||||||
| United States |
$ | 784.8 | $ | 794.6 | $ | 756.3 | |||
| United Kingdom |
148.2 | 176.6 | 212.7 | ||||||
| Germany |
236.3 | 232.9 | 195.5 | ||||||
| Other International |
978.3 | 996.6 | 874.2 | ||||||
| Total |
$ | 2,147.6 | $ | 2,200.7 | $ | 2,038.7 | |||
| Long-lived assets at December 31: |
|||||||||
| United States |
$ | 472.0 | $ | 440.2 | $ | 466.3 | |||
| International |
284.2 | 254.6 | 268.7 | ||||||
| Total |
$ | 756.2 | $ | 694.8 | $ | 735.0 | |||
NOTE 14: PENSION AND OTHER POST-RETIREMENT BENEFIT PLANS
The Company maintains several retirement plans covering substantially all U.S. employees and employees of certain international subsidiaries. Pension benefits are generally based on years of service and compensation. The Company also maintains post-retirement medical benefit plans covering some of its U.S. employees. Benefits are subject to deductibles, co-payment provisions and coordination with benefits available under Medicare. The Company has made a determination regarding the effects of the Medicare Prescription Drug, Improvement and Modernization Act of 2003 (the Act) that the prescription drug benefits it provides are actuarially equivalent to the benefits provided under the Act.
42 SIGMA-ALDRICH 2009 ANNUAL REPORT
Notes To Consolidated Financial Statements (continued)
($ In Millions, Except Per Share Data)
NOTE 14: PENSION AND OTHER POST-RETIREMENT BENEFIT PLANS (continued)
The following chart summarizes the Consolidated Balance Sheet impact, as well as the benefit obligations, assets and funded status of the pension and post-retirement medical benefit plans:
| Pension Plans | Post-Retirement Medical Benefit Plans |
|||||||||||||||||||||||
| United States | International | |||||||||||||||||||||||
| 2009 | 2008 | 2009 | 2008 | 2009 | 2008 | |||||||||||||||||||
| Reconciliation of funded status of the plans and the amounts included in the Company’s Consolidated Balance Sheets at December 31: |
||||||||||||||||||||||||
| Change in benefit obligations |
||||||||||||||||||||||||
| Beginning obligations |
$ | 108.6 | $ | 99.2 | $ | 180.8 | $ | 186.7 | $ | 41.8 | $ | 38.9 | ||||||||||||
| Adjustments due to adoption of FAS 158 |
— | 0.3 | — | 1.2 | — | 0.2 | ||||||||||||||||||
| Service cost |
6.2 | 5.8 | 6.6 | 8.0 | 1.0 | 1.0 | ||||||||||||||||||
| Interest cost |
6.5 | 6.0 | 7.6 | 7.9 | 2.6 | 2.4 | ||||||||||||||||||
| Plan participant contributions |
— | — | 2.4 | 2.6 | 0.9 | 0.7 | ||||||||||||||||||
| Special termination benefits |
3.0 | — | — | — | 0.7 | — | ||||||||||||||||||
| Benefits and expenses paid |
(5.8 | ) | (4.6 | ) | (5.9 | ) | (3.1 | ) | (2.5 | ) | (2.7 | ) | ||||||||||||
| Actuarial loss (gain) |
30.0 | (1) | 1.9 | 4.3 | (11.5 | ) | 1.5 | 1.3 | ||||||||||||||||
| Exchange rate changes |
— | — | 9.5 | (11.0 | ) | — | — | |||||||||||||||||
| Ending obligations |
$ | 148.5 | $ | 108.6 | $ | 205.3 | $ | 180.8 | $ | 46.0 | $ | 41.8 | ||||||||||||
| Changes in plans assets |
||||||||||||||||||||||||
| Beginning fair value |
$ | 92.3 | $ | 98.9 | $ | 143.6 | $ | 168.3 | $ | — | $ | — | ||||||||||||
| Adjustments due to adoption of FAS 158 |
— | (0.7 | ) | — | 0.1 | — | (0.1 | ) | ||||||||||||||||
| Actual return on plan assets |
23.0 | (31.0 | ) | 19.5 | (22.2 | ) | — | — | ||||||||||||||||
| Employer contributions |
15.8 | 29.7 | 9.1 | 9.2 | 1.6 | 2.1 | ||||||||||||||||||
| Plan participant contributions |
— | — | 2.4 | 2.6 | 0.9 | 0.7 | ||||||||||||||||||
| Benefits and expenses paid |
(5.8 | ) | (4.6 | ) | (5.9 | ) | (3.1 | ) | (2.5 | ) | (2.7 | ) | ||||||||||||
| Exchange rate changes |
— | — | 9.0 | (11.3 | ) | — | — | |||||||||||||||||
| Ending fair value |
$ | 125.3 | $ | 92.3 | $ | 177.7 | $ | 143.6 | $ | — | $ | — | ||||||||||||
| Reconciliation of funded status |
||||||||||||||||||||||||
| Funded status |
$ | (23.2 | ) | $ | (16.3 | ) | $ | (27.6 | ) | $ | (37.2 | ) | $ | (46.0 | ) | $ | (41.8 | ) | ||||||
| Net Consolidated Balance Sheet asset/(liability) |
$ | (23.2 | ) | $ | (16.3 | ) | $ | (27.6 | ) | $ | (37.2 | ) | $ | (46.0 | ) | $ | (41.8 | ) | ||||||
| Amounts recognized in the Consolidated Balance Sheets: |
||||||||||||||||||||||||
| For years after adoption of the funded status provisions of SFAS 158 |
||||||||||||||||||||||||
| Noncurrent assets |
$ | — | $ | — | $ | 0.5 | $ | — | $ | — | $ | — | ||||||||||||
| Current liabilities |
— | — | (0.4 | ) | (0.4 | ) | (3.0 | ) | (2.3 | ) | ||||||||||||||
| Pension and post-retirement benefits |
(23.2 | ) | (16.3 | ) | (27.7 | ) | (36.8 | ) | (43.0 | ) | (39.5 | ) | ||||||||||||
| Net amount recognized |
$ | (23.2 | ) | $ | (16.3 | ) | $ | (27.6 | ) | $ | (37.2 | ) | $ | (46.0 | ) | $ | (41.8 | ) | ||||||
| Reconciliation of amounts recognized in the Consolidated Balance Sheets |
||||||||||||||||||||||||
| Initial net (obligation) |
$ | — | $ | — | $ | (0.2 | ) | $ | (0.3 | ) | $ | — | $ | — | ||||||||||
| Prior service (cost) credit |
(1.1 | ) | (1.4 | ) | (0.9 | ) | (1.1 | ) | 7.4 | 8.5 | ||||||||||||||
| Net (loss) gain |
(72.3 | ) | (62.7 | ) | (28.9 | ) | (38.4 | ) | 2.5 | 4.0 | ||||||||||||||
| Accumulated other comprehensive (loss) income |
$ | (73.4 | ) | $ | (64.1 | ) | $ | (30.0 | ) | $ | (39.8 | ) | $ | 9.9 | $ | 12.5 | ||||||||
| Accumulated contributions in excess (less than) of net periodic benefit cost |
50.2 | 47.8 | 2.4 | 2.6 | (55.9 | ) | (54.3 | ) | ||||||||||||||||
| Net amount liability recognized in statement of financial position |
$ | (23.2 | ) | $ | (16.3 | ) | $ | (27.6 | ) | $ | (37.2 | ) | $ | (46.0 | ) | $ | (41.8 | ) | ||||||
| (1) | Approximately $21.0 of the 2009 actuarial loss relates to increases in the present value, due to a reduction in interest rates, of certain pension benefits provided to a specific group of participants. |
2009 ANNUAL REPORT SIGMA-ALDRICH 43
Notes To Consolidated Financial Statements (continued)
($ In Millions, Except Per Share Data)
NOTE 14: PENSION AND OTHER POST-RETIREMENT BENEFIT PLANS (continued)
| Pension Plans | Post-Retirement Medical Benefit Plans |
|||||||||||||||||||||||||||||||||
| United States | International | |||||||||||||||||||||||||||||||||
| 2009 | 2008 | 2007 | 2009 | 2008 | 2007 | 2009 | 2008 | 2007 | ||||||||||||||||||||||||||
| Changes in plan assets and benefit obligations recognized in other comprehensive income |
||||||||||||||||||||||||||||||||||
| Net loss (gain) arising during the year |
$ | 14.1 | $ | 41.5 | $ | (1.4 | ) | $ | (8.4 | ) | $ | 21.1 | $ | (7.8 | ) | $ | 1.5 | $ | 1.3 | $ | (2.3 | ) | ||||||||||||
| Effect of exchange rates on amounts included in AOCI |
— | — | — | 1.8 | (4.1 | ) | 1.2 | — | — | — | ||||||||||||||||||||||||
| Amounts recognized as a component of net periodic benefit cost |
||||||||||||||||||||||||||||||||||
| Amortization or curtailment recognition of prior service credit (cost) |
(0.4 | ) | (0.5 | ) | (0.4 | ) | (0.3 | ) | (0.3 | ) | (0.2 | ) | 1.0 | 1.1 | 1.0 | |||||||||||||||||||
| Amortization or settlement recognition of net gain (loss) |
(4.5 | ) | (1.1 | ) | (1.0 | ) | (2.8 | ) | (0.3 | ) | (1.3 | ) | — | 0.1 | — | |||||||||||||||||||
| Total recognized in other comprehensive loss (income) |
$ | 9.2 | $ | 39.9 | $ | (2.8 | ) | $ | (9.7 | ) | $ | 16.4 | $ | (8.1 | ) | $ | 2.5 | $ | 2.5 | $ | (1.3 | ) | ||||||||||||
| Total recognized in net periodic benefit cost and other comprehensive loss (income) |
$ | 22.7 | $ | 45.2 | $ | 1.7 | $ | 0.9 | $ | 23.4 | $ | 0.9 | $ | 5.8 | $ | 4.8 | $ | 1.0 | ||||||||||||||||
| Estimated amounts that will be amortized from accumulated other comprehensive income over the next fiscal year |
||||||||||||||||||||||||||||||||||
| Initial net (obligation) |
$ | — | $ | — | $ | — | $ | (0.1 | ) | $ | — | $ | — | $ | — | $ | — | $ | — | |||||||||||||||
| Prior service (cost) credit |
(0.4 | ) | (0.4 | ) | (0.4 | ) | (0.2 | ) | (0.2 | ) | (0.3 | ) | 1.0 | 1.0 | 1.0 | |||||||||||||||||||
| Net (loss) gain |
(5.0 | ) | (4.5 | ) | (1.1 | ) | (0.8 | ) | (2.4 | ) | (0.3 | ) | — | — | 0.1 | |||||||||||||||||||
| Total estimated amortization |
$ | (5.4 | ) | $ | (4.9 | ) | $ | (1.5 | ) | $ | (1.1 | ) | $ | (2.6 | ) | $ | (0.6 | ) | $ | 1.0 | $ | 1.0 | $ | 1.1 | ||||||||||
The components of the net periodic benefit costs are as follows:
| Pension Plans | Post-Retirement Medical Benefit Plans |
|||||||||||||||||||||||||||||||||||
| United States | International | |||||||||||||||||||||||||||||||||||
| 2009 | 2008 | 2007 | 2009 | 2008 | 2007 | 2009 | 2008 | 2007 | ||||||||||||||||||||||||||||
| Service cost |
$ | 6.2 | $ | 5.8 | $ | 5.4 | $ | 6.6 | $ | 8.0 | $ | 8.8 | $ | 1.0 | $ | 1.0 | $ | 1.1 | ||||||||||||||||||
| Interest cost |
6.5 | 6.0 | 5.1 | 7.6 | 7.9 | 6.3 | 2.6 | 2.4 | 2.2 | |||||||||||||||||||||||||||
| Expected return on plan assets |
(7.1 | ) | (7.9 | ) | (7.4 | ) | (6.7 | ) | (9.5 | ) | (7.6 | ) | — | — | — | |||||||||||||||||||||
| Amortization |
4.9 | 1.4 | 1.4 | 3.2 | 0.6 | 1.5 | (1.1 | ) | (1.1 | ) | (1.0 | ) | ||||||||||||||||||||||||
| Special termination benefit recognized |
3.0 | — | — | — | — | — | 0.7 | — | — | |||||||||||||||||||||||||||
| Settlement (gain)/loss |
— | — | — | (0.2 | ) | — | — | — | — | — | ||||||||||||||||||||||||||
| Net periodic benefit cost |
$ | 13.5 | $ | 5.3 | $ | 4.5 | $ | 10.5 | $ | 7.0 | $ | 9.0 | $ | 3.2 | $ | 2.3 | $ | 2.3 | ||||||||||||||||||
44 SIGMA-ALDRICH 2009 ANNUAL REPORT
Notes To Consolidated Financial Statements (continued)
($ In Millions, Except Per Share Data)
NOTE 14: PENSION AND OTHER POST-RETIREMENT BENEFIT PLANS (continued)
The rate assumptions associated with the pension and post-retirement medical benefit plans to determine benefit obligations and additional year-end information are as follows:
| Pension Plans | Post-Retirement Medical Benefit Plans |
|||||||||||||||||||||||
| United States | International | |||||||||||||||||||||||
| 2009 | 2008 | 2009 | 2008 | 2009 | 2008 | |||||||||||||||||||
| Assumptions to determine benefit obligations |
||||||||||||||||||||||||
| Discount rate |
5.65 | % | 6.35 | % | 4.40 | % | 4.16 | % | 5.85 | % | 6.25 | % | ||||||||||||
| Compensation rate increase |
3.60 | % | 3.60 | % | 3.13 | % | 2.98 | % | n/a | n/a | ||||||||||||||
| Measurement date |
Dec-31 | Dec-31 | Dec-31 | Dec-31 | Dec-31 | Dec-31 | ||||||||||||||||||
| Additional year-end information |
||||||||||||||||||||||||
| Accumulated benefit obligation |
$ | 139.3 | $ | 96.8 | $ | 186.6 | $ | 163.1 | n/a | n/a | ||||||||||||||
| Plans with accumulated benefit obligations in excess of plan assets: |
||||||||||||||||||||||||
| Projected benefit obligation |
$ | 148.5 | $ | 108.6 | $ | 15.3 | $ | 131.9 | n/a | n/a | ||||||||||||||
| Accumulated benefit obligation |
139.3 | 96.8 | 12.5 | 118.1 | n/a | n/a | ||||||||||||||||||
| Fair value of plan assets |
125.3 | 92.3 | — | 96.8 | n/a | n/a | ||||||||||||||||||
| Plans with projected benefit obligations in excess of plan assets: |
||||||||||||||||||||||||
| Projected benefit obligation |
$ | 148.5 | $ | 108.6 | $ | 202.9 | $ | 180.8 | $ | 46.0 | $ | 41.8 | ||||||||||||
| Fair value of plan assets |
125.3 | 92.3 | 174.7 | 143.6 | — | — | ||||||||||||||||||
The rate assumptions associated with the pension and post-retirement medical benefit plans to determine periodic pension costs are as follows:
| Pension Plans | Post-Retirement Medical Benefit Plans |
||||||||||||||||||||||||||
| United States | International | ||||||||||||||||||||||||||
| 2009 | 2008 | 2007 | 2009 | 2008 | 2007 | 2009 | 2008 | 2007 | |||||||||||||||||||
| Discount rate |
6.35 | % | 6.30 | % | 5.55 | % | 4.16 | % | 4.35 | % | 3.60 | % | 6.25 | % | 6.45 | % | 5.55 | % | |||||||||
| Expected rate of return on plan assets |
8.25 | % | 8.25 | % | 8.25 | % | 4.84 | % | 5.66 | % | 5.08 | % | n/a | n/a | n/a | ||||||||||||
| Compensation rate increase |
3.60 | % | 3.60 | % | 3.25 | % | 2.98 | % | 3.50 | % | 3.31 | % | n/a | n/a | n/a | ||||||||||||
The expected employer contributions and benefit payments are shown in the following table for the pension and post-retirement medical benefit plans:
| Pension Plans | Post-Retirement Medical Benefit Plans(1) |
Expected Medicare Subsidy Receipts | |||||||||||
| Cash Flows |
Year Ending |
United States |
International | ||||||||||
| Expected employer contributions |
2010 | $ | — | $ | 5.2 | $ | 2.9 | n/a | |||||
| Expected benefit payments for fiscal year ending |
2010 | 22.7 | 3.8 | 2.9 | 0.2 | ||||||||
| 2011 | 8.3 | 4.0 | 3.0 | 0.3 | |||||||||
| 2012 | 9.4 | 4.1 | 3.1 | 0.3 | |||||||||
| 2013 | 10.2 | 4.4 | 3.2 | 0.4 | |||||||||
| 2014 | 10.6 | 4.7 | 3.3 | 0.4 | |||||||||
| Next 5 years | 68.2 | 28.1 | 18.2 | 3.0 | |||||||||
| (1) | Expected payments for Post-Retirement Medical Benefit Plans are shown net of the expected Medicare subsidy receipts. |
2009 ANNUAL REPORT SIGMA-ALDRICH 45
Notes To Consolidated Financial Statements (continued)
($ In Millions, Except Per Share Data)
NOTE 14: PENSION AND OTHER POST-RETIREMENT BENEFIT PLANS (continued)
Pension Plans For purposes of selecting a discount rate, the present value of the cash flows as of the measurement date is determined using the spot rates from the Mercer Yield Curve, and based on the present values, a single equivalent discount rate is developed. This rate is the single uniform discount rate that, when applied to the same cash flows, results in the same present value of the cash flows as of the measurement date. The plans are assumed to continue in force for as long as the assets are expected to be invested. In estimating the expected long-term rate of return on assets, appropriate consideration is given to historical performance for the major asset classes held or anticipated to be held by the Plan and to current forecasts of future rates of return for those asset classes. Cash flow and expenses are taken into consideration to the extent that the expected return would be affected by them. Because assets are held in qualified trusts, expected returns are not reduced for taxes.
The assets of the pension plans are invested in institutionally acceptable investments to produce a diversified portfolio. The Company believes the investments are sufficiently diversified to maintain a reasonable level of risk without unduly sacrificing return. Target asset allocations and weighted average asset allocations at December 31, 2009 are as follows:
| Target Allocations | Weighted Average Asset Allocations |
|||||||||||
| U.S. Plans |
International Plans |
U.S. Plans |
International Plans |
|||||||||
| Equity Securities |
75–85 | % | 38–50 | % | 69 | % | 45 | % | ||||
| Real Estate |
— | 6–12 | % | — | 9 | % | ||||||
| Debt Securities |
15–30 | % | 36–57 | % | 17 | % | 39 | % | ||||
| Other |
0–10 | % | 0–10 | % | 14 | % | 7 | % | ||||
| Fair Value Measurements at December 31, 2009 | |||||||||
| Assets |
Quoted Prices in Active Markets for Identical Assets (Level 1(1)) |
Significant Other Observable Inputs (Level 2(2)) |
Total | ||||||
| Mutual funds |
$ | — | $ | — | $ | — | |||
| Corporate stocks – common |
35.9 | — | 35.9 | ||||||
| Government debt |
52.5 | — | 52.5 | ||||||
| Corporate and non-government debt |
— | — | — | ||||||
| Real estate |
7.4 | 8.4 | 15.9 | ||||||
| Common/collective trust funds – equity |
— | 130.8 | 130.8 | ||||||
| Common/collective trust funds – Government debt |
— | 10.6 | 10.6 | ||||||
| Common/collective trust funds – Corporate and other non-government debt |
— | 28.1 | 28.1 | ||||||
| Insurance group annuity contracts |
— | — | — | ||||||
| Common/collective trust funds – real estate |
— | 0.4 | 0.4 | ||||||
| Derivatives |
— | — | — | ||||||
| Cash and cash equivalents |
2.4 | 23.0 | 25.4 | ||||||
| Other |
0.4 | 3.0 | 3.4 | ||||||
| Total |
$ | 98.7 | $ | 204.3 | $ | 303.0 | |||
| (1) | Level 1 instruments use observable market prices for the identical item in active markets and have the most reliable valuations. |
| (2) | Level 2 instruments are valued through broker/dealer quotation or through market-observable inputs for similar items in active markets. |
Investment Strategy The U.S. Plan’s overall investment strategy is to hold a mix of approximately 80% of investments in U.S. and International equities and 20% in bonds. Equities are managed in passive and managed funds across various asset classes. Bond funds contain government and investment-grade bonds.
The trustee has engaged an investment manager for the U.S. Plan that has the responsibility of selecting investment fund managers with demonstrated experience and expertise and funds with demonstrated historical performance meeting the Plan’s investment guidelines.
The UK Plan’s overall investment strategy is to hold a mix of approximately 70% of investments in equities, 42% UK and 28% non-UK equities, and 30% in bonds. Equities are managed in passive and managed funds. Bond funds contain government and investment grade bonds. A small portion of investments are held in insured annuities.
The Swiss fund’s overall target investment strategy is to achieve a mix of 27.5% equities, 54.5% bonds, 15% real estate and 3% other. Equities are invested in large Swiss companies and institutional funds. Bond funds contain government and investment-grade bonds. Real estate holdings are in an institutional real estate fund. The Ireland Plan invests with insurance companies. The investments are in insured arrangements in which a portion have guaranteed annuity rates.
The trustees of the International Plans have engaged institutions that are believed to be reputable to invest the Plans’ assets in funds with demonstrated historical performance and manage the Plans’ assets in accordance with investment guidelines developed by the trustees.
Post-Retirement Medical Benefit Plans For purposes of selecting a discount rate, the present value of the cash flows as of the measurement date is determined using the spot rates from the Mercer Yield Curve, and based on the present values, a single equivalent discount rate is developed. This rate is the single uniform discount rate that, when applied to the same cash flows, results in the same present value of the cash flows as of the measurement date. Assumed health care cost trend rates have a significant effect on the amounts reported for the post-retirement medical benefit plans. Medical costs were assumed to increase at an annual rate of 9% in 2009, decreasing ratably to a growth rate of 4.5% in 2030 and remaining at 4.5% per year thereafter. The effects of a one-percentage point decrease in the assumed health care cost trend rates on the aggregate service and interest cost components and on the post-retirement benefit obligations are decreases of $0.1 and $1.0, respectively. The effects of a one-percentage point increase on the aggregate service and interest cost components and on the post-retirement benefit obligations are increases of $0.1 and $1.3, respectively. Benefits are funded as claims are paid.
401(k) Retirement Savings Plan The Company’s 401(k) retirement savings plan provides retirement benefits to eligible U.S. employees in addition to those provided by the pension plan. The plan permits participants to voluntarily defer a portion of their compensation, subject to Internal Revenue Code limitations. The Company also contributes a fixed amount per year to the account of each eligible employee plus a percentage of the employee’s salary deferral. The Company’s policy is to fully fund this plan. The cost for this plan was $9.4, $9.2, and $8.3 for the years ended December 31, 2009, 2008 and 2007, respectively.
46 SIGMA-ALDRICH 2009 ANNUAL REPORT
Notes To Consolidated Financial Statements (continued)
($ In Millions, Except Per Share Data)
NOTE 15: EARNINGS PER SHARE
A reconciliation of basic and diluted earnings per share, together with the related shares outstanding for the years ended December 31 are as follows:
| 2009 | 2008 | 2007 | |||||||
| Net income available to common shareholders |
$ | 346.7 | $ | 341.5 | $ | 311.1 | |||
| Weighted average shares ($ In Millions) |
|||||||||
| Basic shares |
121.9 | 126.3 | 130.6 | ||||||
| Effect of dilutive securities — options outstanding |
1.8 | 2.5 | 2.5 | ||||||
| Diluted shares |
123.7 | 128.8 | 133.1 | ||||||
| Net income per share — Basic |
$ | 2.84 | $ | 2.70 | $ | 2.38 | |||
| Net income per share — Diluted |
$ | 2.80 | $ | 2.65 | $ | 2.34 | |||
Potential common shares of 0.6 and 0.3 million stock options were excluded from the calculation of weighted average shares for the year ended December 31, 2009 and December 31, 2008, respectively, because their effect was considered to be antidilutive.
NOTE 16: SHARE REPURCHASES
At December 31, 2009 and December 31, 2008, the Company had repurchased a total of 93.7 million shares and 92.3 million shares, respectively. On October 20, 2008, the Board of Directors authorized the repurchase of up to an additional 10.0 million shares under the existing repurchase program, to be available for purchase within three years, bringing the total authorization to 100.0 million shares. There were 121.7 million shares outstanding as of December 31, 2009. The Company expects to continue to offset the dilutive impact of issuing incentive compensation by future repurchases. Further, the Company may repurchase additional shares, but the timing and amount will depend on market conditions and other factors.
NOTE 17: ACCUMULATED OTHER COMPREHENSIVE INCOME
Components of accumulated other comprehensive income, net of tax are as follows:
| Foreign Currency Translation Adjustment |
Unrealized Gain (Loss) on Securities |
Pension and Post-Retirement Benefit Plans |
Accumulated Other Comprehensive Income |
|||||||||||||
| Balance, December 31, 2006 |
$ | 107.3 | $ | 4.1 | $ | (30.7 | ) | $ | 80.7 | |||||||
| Current period change |
71.5 | (0.7 | ) | 8.4 | 79.2 | |||||||||||
| Balance, December 31, 2007 |
178.8 | 3.4 | (22.3 | ) | 159.9 | |||||||||||
| Current period change |
(86.4 | ) | (6.0 | ) | (42.2 | ) | (134.6 | ) | ||||||||
| Balance, December 31, 2008 |
92.4 | (2.6 | ) | (64.5 | ) | 25.3 | ||||||||||
| Current period change |
55.4 | 0.5 | 2.8 | 58.7 | ||||||||||||
| Balance, December 31, 2009 |
$ | 147.8 | $ | (2.1 | ) | $ | (61.7 | ) | $ | 84.0 | ||||||
The 2009 activity for unrealized loss on securities is net of tax of $0.3. The 2009 pension and post-retirement benefit plans activity is net of tax of $3.1. Deferred taxes are not provided on foreign currency translation adjustment.
NOTE 18: SUBSEQUENT EVENTS
The Company has evaluated events and transactions subsequent to December 31, 2009 through February 10, 2010, the date the financial statements were filed with the SEC as part of this Form 10-K. No events required recognition in the consolidated financial statements or disclosures by the Company.
2009 ANNUAL REPORT SIGMA-ALDRICH 47
MANAGEMENT’S REPORT ON INTERNAL CONTROL OVER FINANCIAL REPORTING
Our management is responsible for establishing and maintaining adequate internal control over financial reporting (as defined in the Securities Exchange Act Rule 13a–15 (f)). Under the supervision and with the participation of our management, including our principal executive officer and our principal financial officer, we assessed the effectiveness of our internal control over financial reporting as of December 31, 2009. In making this assessment, our management used the criteria set forth by the Committee of Sponsoring Organizations of the Treadway Commission (COSO) in the Internal Control-Integrated Framework. Our management has concluded that, as of December 31, 2009, our internal control over financial reporting is effective based on these criteria.
REPORT OF INDEPENDENT REGISTERED PUBLIC ACCOUNTING FIRM
To The Board of Directors and Stockholders
Sigma-Aldrich Corporation:
We have audited the accompanying consolidated balance sheets of Sigma-Aldrich Corporation and subsidiaries (the Company) as of December 31, 2009 and 2008, and the related consolidated statements of income, stockholders’ equity and cash flows for each of the years in the three-year period ended December 31, 2009. We also have audited the Company’s internal control over financial reporting as of December 31, 2009, based on criteria established in Internal Control – Integrated Framework issued by the Committee of Sponsoring Organizations of the Treadway Commission (COSO). The Company’s management is responsible for these consolidated financial statements, for maintaining effective internal control over financial reporting, and for its assessment of the effectiveness of internal control over financial reporting, included in the accompanying Management’s Report on Internal Control over Financial Reporting. Our responsibility is to express an opinion on these consolidated financial statements and an opinion on the Company’s internal control over financial reporting based on our audits.
We conducted our audits in accordance with generally accepted auditing standards as established by the Auditing Standards Board (United States) and in accordance with the auditing standards of the Public Company Accounting Oversight Board (United States). Those standards require that we plan and perform the audit to obtain reasonable assurance about whether the financial statements are free of material misstatement and whether effective internal control over financial reporting was maintained in all material respects. Our audits of the consolidated financial statements included examining, on a test basis, evidence supporting the amounts and disclosures in the financial statements, assessing the accounting principles used and significant estimates made by management, as well as evaluating the overall financial statement presentation. Our audit of internal control over financial reporting included assessing the risk that a material weakness exists, and testing and evaluating the design and operating effectiveness of internal control based on the assessed risk. Our audits also include performing such other procedures as we considered necessary in the circumstances. We believe that our audits provide a reasonable basis for our opinions.
A company’s internal control over financial reporting is a process designed to provide reasonable assurance regarding the reliability of financial reporting and the preparation of financial statements for external purposes in accordance with U.S. generally accepted accounting principles. A company’s internal control over financial reporting includes those policies and procedures that (1) pertain to the maintenance of records that, in reasonable detail, accurately and fairly reflect the transactions and dispositions of the assets of the company; (2) provide reasonable assurance that the transactions are recorded as necessary to permit preparation of financial statements in accordance with U.S. generally accepted accounting principles, and that receipts and expenditures of the company are being made only in accordance with authorizations of management and directors of the company; and (3) provide reasonable assurance regarding prevention or timely detection of unauthorized acquisition, use, or disposition of the company’s assets that could have a material effect on the financial statements.
Because of its inherent limitations, internal control over financial reporting may not prevent or detect misstatements. Also, projections of any evaluation of effectiveness to future periods are subject to the risk that controls may become inadequate because of changes in conditions, or that the degree of compliance with the policies or procedures may deteriorate.
In our opinion, the consolidated financial statements referred to above present fairly, in all material respects, the financial position of Sigma-Aldrich Corporation and subsidiaries as of December 31, 2009 and 2008, and the results of their operations and their cash flows for each of the years in the three-year period ended December 31, 2009, in conformity with U.S. generally accepted accounting principles. Also in our opinion, the Company maintained, in all material respects, effective internal control over financial reporting as of December 31, 2009, based on criteria established in Internal Control – Integrated Framework issued by the Committee of Sponsoring Organizations of the Treadway Commission.
As discussed in note 10 to the consolidated financial statements, effective January 1, 2007, the Company adopted FASB Interpretation No. 48, Accounting for Uncertainty in Income Taxes, an interpretation of Statement of Financial Accounting Standard No. 109 (ASC 740).
/s/ KPMG LLP
St. Louis, Missouri
February 9, 2010
48 SIGMA-ALDRICH 2009 ANNUAL REPORT