Attached files
| file | filename |
|---|---|
| 8-K - United Financial Bancorp, Inc. | form8k-105267_ubnk.htm |
Holding Company for
NASDAQ: UBNK
Forward Looking Statements
Certain comments made in the course of this presentation by UBNK are forward-looking in nature. These include all statements about UBNK’s operating results or financial position for periods ending or
on dates occurring
after December 31, 2009 and usually use words such as “expect”, “anticipate”, “believe”, and similar expressions. These comments represent management’s current beliefs, based upon information
available to it at the time
the statements are made with regard to the matters addressed.
All forward looking statements are subject to risks and uncertainties that could cause UBNK’s actual results or financial condition to differ
materially from those expressed in or implied by such statements. Factors of particular
importance to UBNK include, but are not limited to: (1) changes in general economic conditions, including interest rates; (2) competition among providers
of financial services; (3) changes in the interest rate environment that
reduce our margins or reduce the fair value of financial instruments; (4) adverse changes in the securities markets; and (5) our ability to enter new markets successfully and capitalize
on growth opportunities. UBNK does not
undertake any obligation to update or revise any forward-looking statements, whether as a result of new information, future events or otherwise.
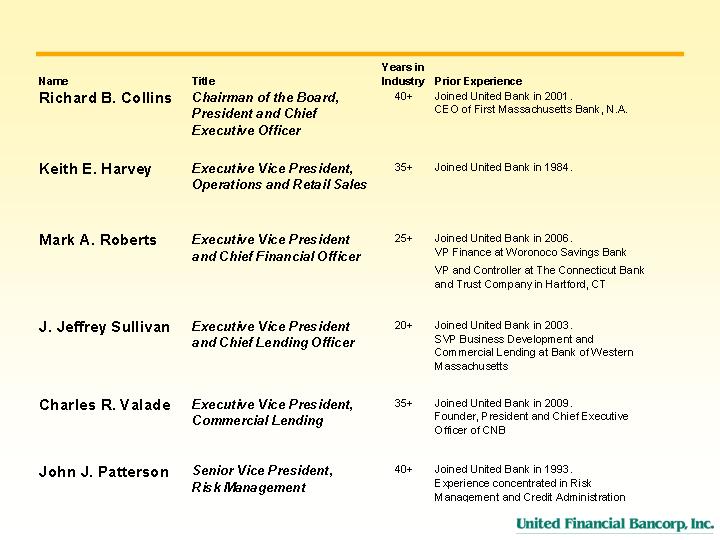
Why invest in United Financial Bancorp, Inc.?
Experienced Management Team focused on creating shareholder value
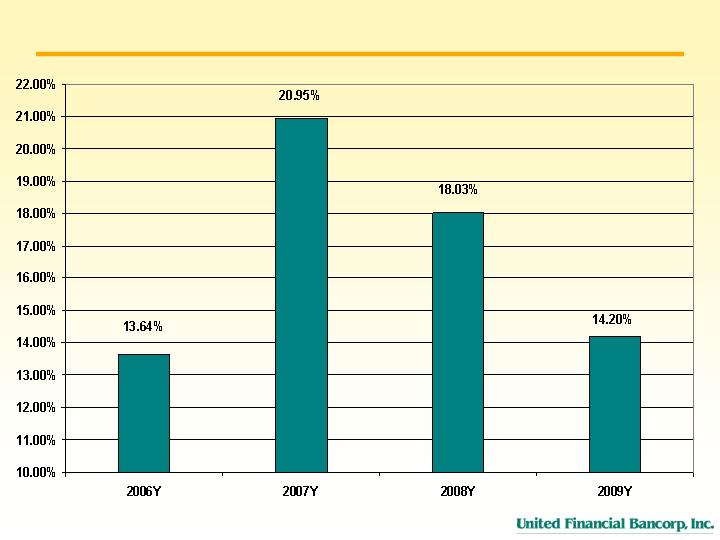
Well capitalized (14% Tangible Equity/ Tangible Assets)
Effective Capital Management Strategy with successful stock repurchase program and competitive dividend yield
Continuous growth through an expanding franchise
Organic growth
De Novo branching
Acquisition
Balanced Loan & Deposit Mix and Growth
Strong market position in both loans & deposits
More bank-like mix in loans
54% of deposits in core
Excellent asset quality
63% of NPLs driven by 5 loans with workout strategies
95% of Investment portfolio is agency backed

Deploying our Strong Capital Position
CAPITAL
Consistent Brand and Product Marketing:
Continue emphasis on core deposit growth
Leverage Customer Relationship Management
Franchise Expansion:
Organic growth
De Novo branching
Strategic acquisitions
Commercial Lending Focus:
Added 4 experienced Springfield Commercial
Lenders
Added 6 experienced Worcester Commercial
Lenders
Maintain focus on experience/ conservative
underwriting and credit administration
Expand/diversify sources of non-interest income:
$121.6mm AUM at United Wealth Management Group
Consistent growth in consumer/commercial checking accounts
Effective Capital Management Strategy:
Competitive dividend yield
Successful common stock repurchase program:
Completed: three buy back programs repurchasing
1,726,517 at average price of $13.44.
In progress: 5% program commenced on 12/1/09 to
repurchase 798,055 shares of which 215,368 have been
purchased to date at an avg price of $12.89.
To date: 2,018,173 shares at an average price of $13.34.
9
0
Worcester
Springfield
Boston
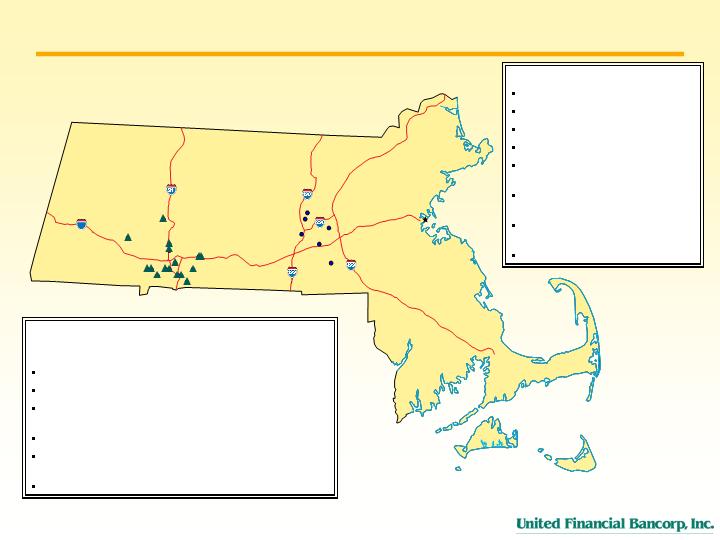
United Bank- founded in 1881
$1.3 billion in assets
16 Full-Service Branches
Two Express (Drive-Up) Branches
19 ATM locations
Located at the crossroads of New
England
Intersection of Interstate 91 and Mass
Turnpike
90 minutes from Albany, NY and
Boston, MA
30 minutes North of Hartford, CT
Commonwealth National Bank
Acquisition completed 11/30/09
$300 million in assets
6 Branches
Headquartered in Worcester, MA – 2nd largest population in
New
England
7 ATM locations
Market is adjacent to I-495 Technology Corridor & 30 minutes
to Boston’s Metro/West area
One hour to corporate headquarters in West Springfield
Expanding Franchise
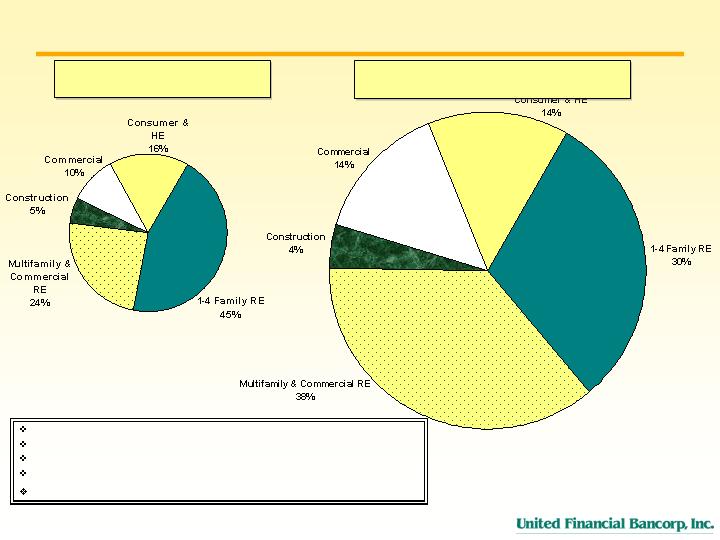
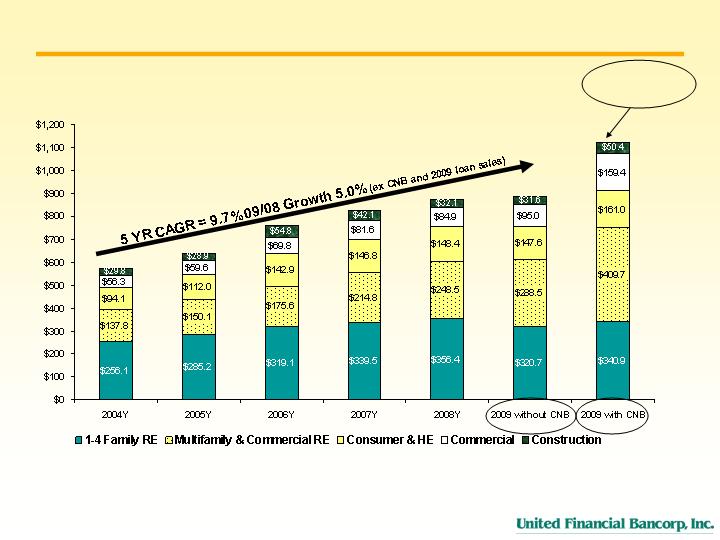
Shift toward Bank-Like Mix for Loans
Mortgage Market Share – Hampden County #1 in 2009, up from #5 in 2008.
5 yr CAGR 9.7%: 09/08 growth is 5.0% (ex CNB & 2009 loan sales).
Includes $243 million in CNB gross acquired loans as of 11/30/09.
Continued conservative Underwriting Standards.
Higher percentage of CRE loans with high degree of diversification.
Loan Mix as of December 31, 2009
(in millions)
$341.8
$159.4
$50.4
$409.7
Total Loans $1,122.2
Yield 5.51%
$256.1
$94.1
$56.3
$137.8
$29.8
Loan Mix as of December 31, 2004
(in millions)
Total Loans $574.1
Yield 5.51%
$29.8
$161.0
$50.4
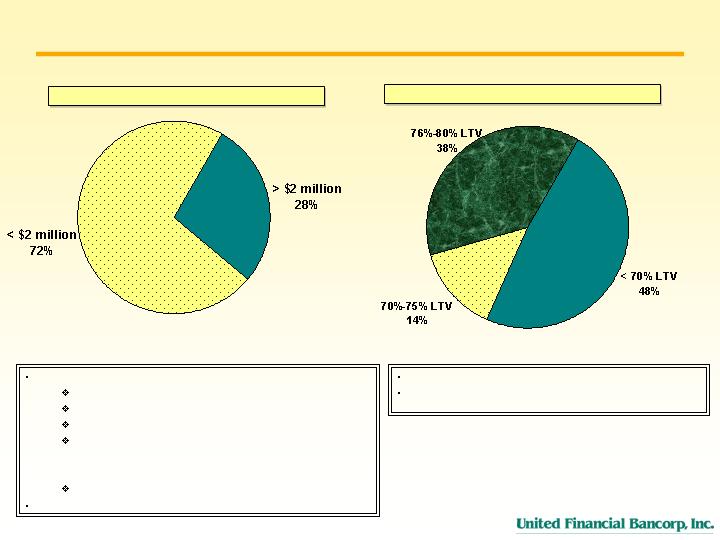
Commercial Loan Portfolio
$256.1
$233.1
No out of market loans above 70% LTV
LTV ratios estimated based on current appraised values
$29.8
Commercial Loans (in millions)
Total Commercial, CRE &
Construction Loans - $619 million
$29.8
$448
$171
$60
$77
$22
CRE’s over $2 million (in millions)
Total CRE loans > $2 million - $159 million
$171 million = 47 loans > $2 million:
$159 million CRE
$7 million C&I
$5 million Construction
Loan grade: $84 million - Strong or Good
$65 million - Acceptable
$22 million - Special Mention or Classified
$448 million = 940 loans < $2 million
Average size $294k; Median size $195k
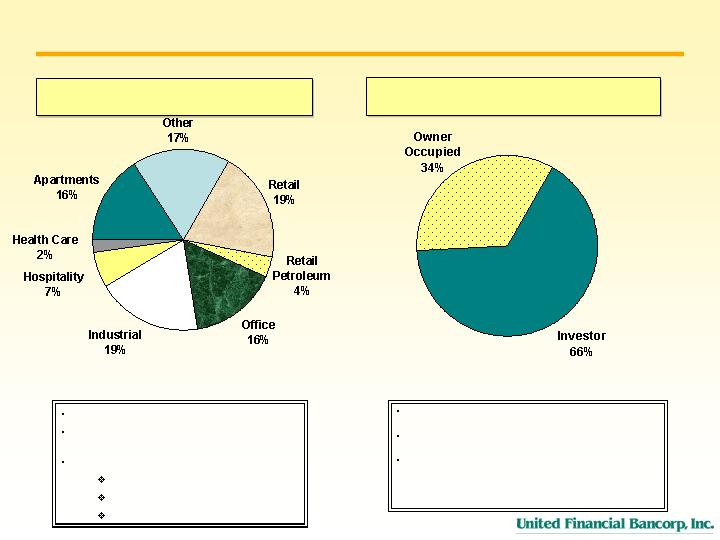
CRE Property Types & Owner Occupied %
$256.1
$29.8
CRE Mix as of December 31, 2009
(in millions)
Total CRE Loans $409.7
$233.1
Average Loan size $207,000
Two largest CRE loans are $14.1 million office
building and $10 million supermarket
Retail includes:
$27 million neighborhood retail
$19 million credit rated pharmacies
$10 million anchored supermarket
$256.1
$29.8
Owner Occupied % as of December 31, 2009
(in millions)
80% of non-owner occupied loans originated in primary market
area
65% of non-owner occupied portfolio originated by Springfield; 35%
originated
by Worcester
5 largest developer relationships are between $14-$16 million
$139.7
$270.0
Total CRE Loans $409.7
$81.2
$71.4
$65.5
$27.0
$77.6
$64.0
$14.7
$8.3
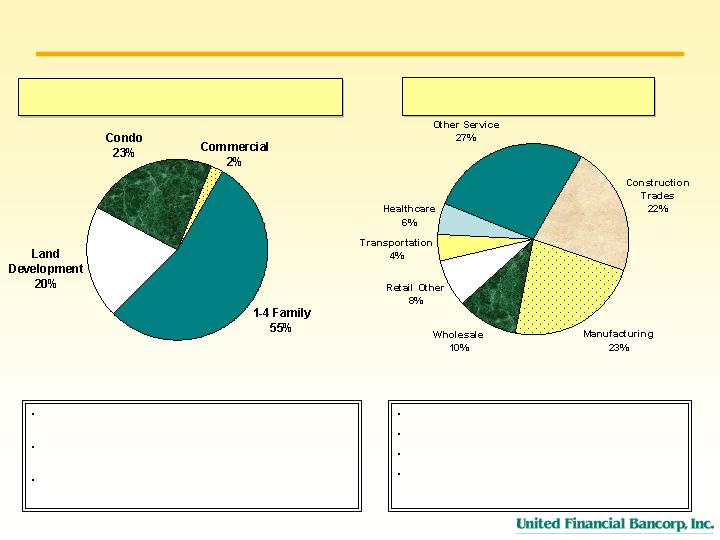
Reduced Construction and Diversified C&I Mix
$256.1
$29.8
$233.1
Portfolio is half of the balance at real estate construction
peak in 2006 ($94 million at 12/31/06 –including CNB)
Condo loans centered in 5 projects with strong local
sponsors
1-4 family loans are highly diversified across 61 projects
with average size under $500,000
$256.1
$29.8
C&I Mix as of December 31, 2009
(in millions)
Diversified
Average Loan size under $100k
Largest C&I Loan is $4.4 million
Regional Mix: $97 million Springfield and $64 million
Worcester
Commercial Construction Mix as of December 31, 2009
(in millions)
Total Commercial Construction Loans $48.8
4% of Overall Loan Portfolio
Total C&I Loans $159.4
$9.9
$11.4
$26.4
$35.0
$36.5
$16.3
$12.6
$7.0
$8.8
$43.2
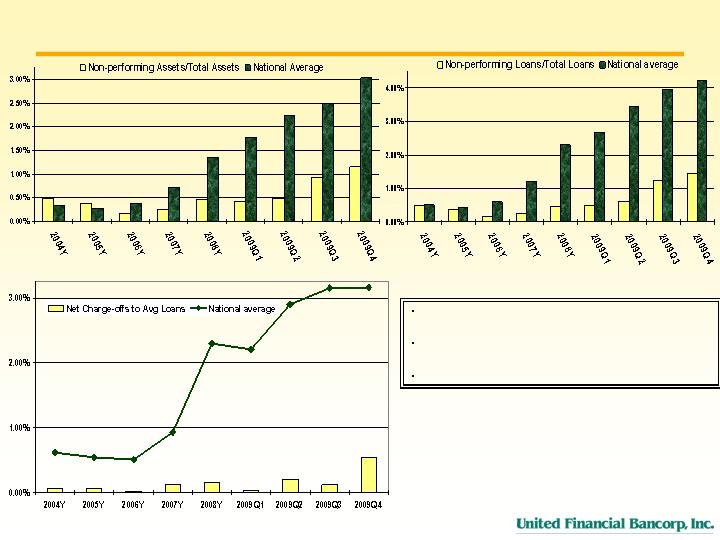
Excellent Asset Quality
5 commercial credits drive charge-offs and 63% of NPL’s. All with specific
workout strategies.
Reserves to Total Loans at 1.07%, excluding purchased loans (CNB $243
million and other purchased loans of $22.7 million).
Conservative investment portfolio – 95% gov’t owned or sponsored.

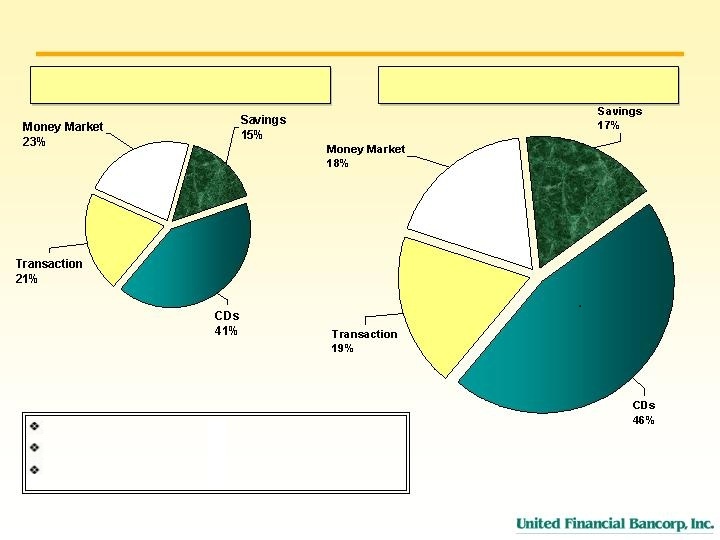
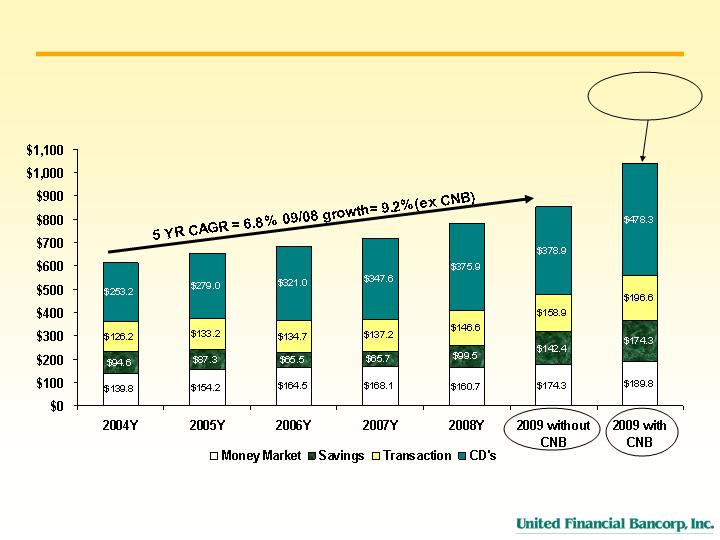
Includes $195 million in CNB acquired deposits as of 11/30/09.
Excluding CNB: 5 Yr Deposit CAGR: 6.8%, ‘09/’08 growth 9.2%
Core deposits >50% of total; 5 Yr Core Deposit CAGR 5.7%
Deposit Mix as of December 31, 2004
(in millions)
Deposit Mix and Growth
Total Deposits $613.7
QTD Cost of Deposits 1.54%
Total Deposits $1,038.9
QTD Cost of Deposits 1.47%
$196.6
$189.8
$478.3
$174.3
Deposit Mix as of December 31, 2009
(in millions)
$94.6
$139.8
$126.1
$253.2
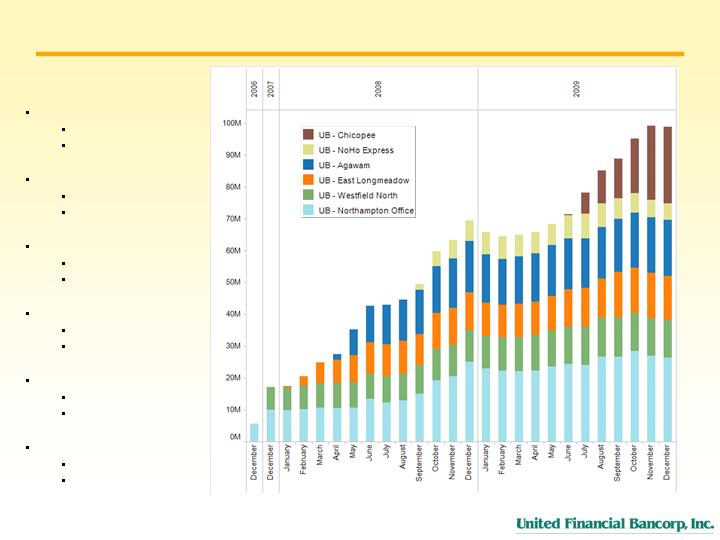
$98.8 Million in Deposits at De Novo Branches
As of 12/31/09:
Northampton
Opened 06/05/06
$26,292,402
Westfield North
Opened 12/29/06
$11,960,610
East Longmeadow
Opened 01/28/08
$13,798,445
Agawam
Opened 04/21/08
$17,612,607
Northampton Express
Opened 09/15/08
$5,070,841
Chicopee
Opened 06/29/09
$24,202,175
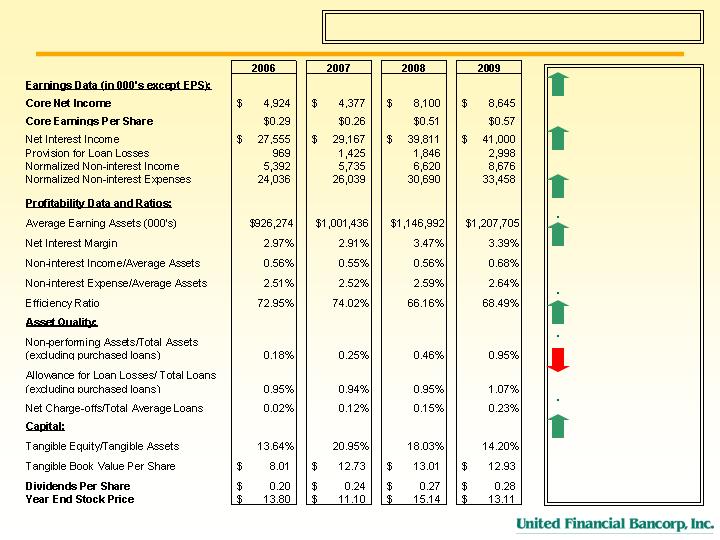
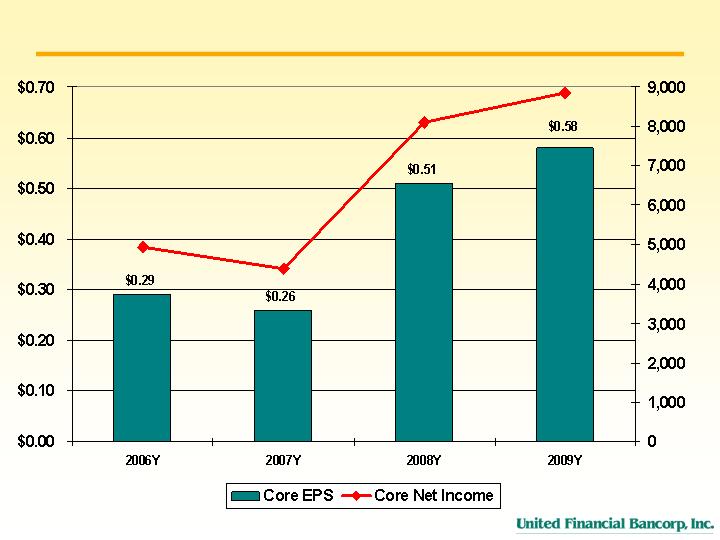
3 Yr CAGR: Core Net
Income 22% Core EPS
26%
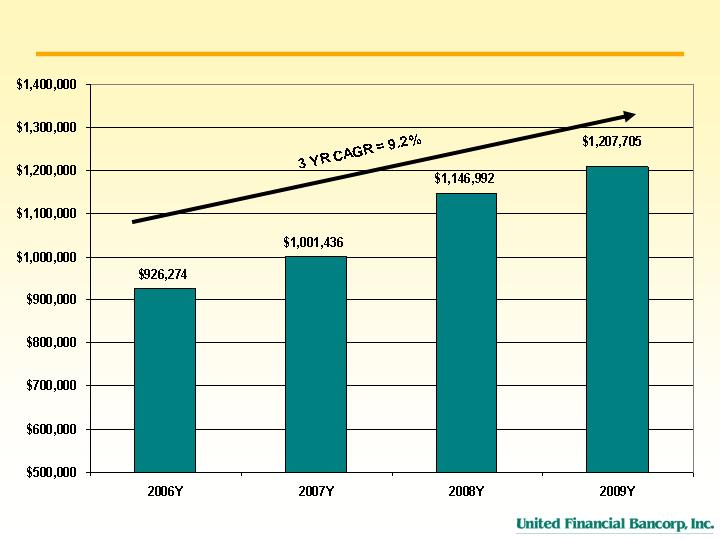
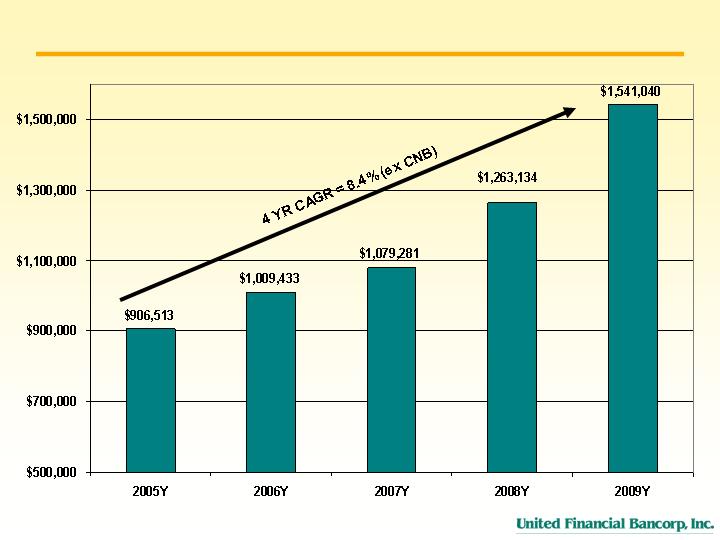
Loan growth drove 9% 3
Yr CAGR on average
earning assets
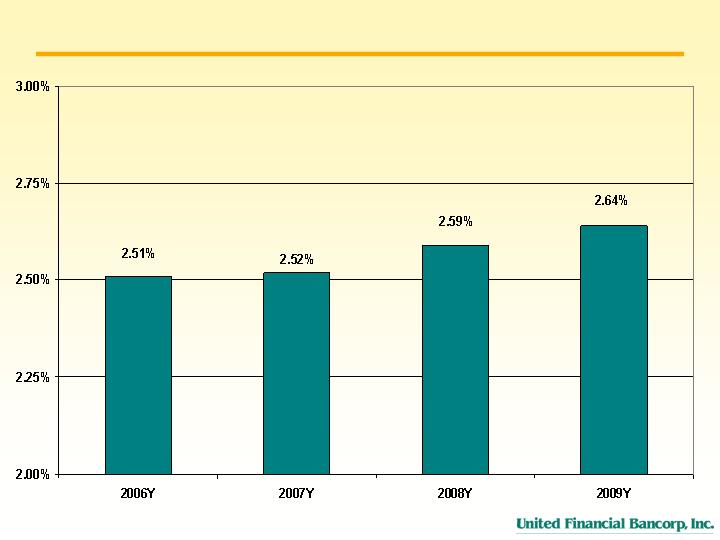
NIM improvement 42 bps
Non-interest income grew
in deposit service charges
(increase in accounts &
transactions) and Wealth
Mgmt (increase in AUM)
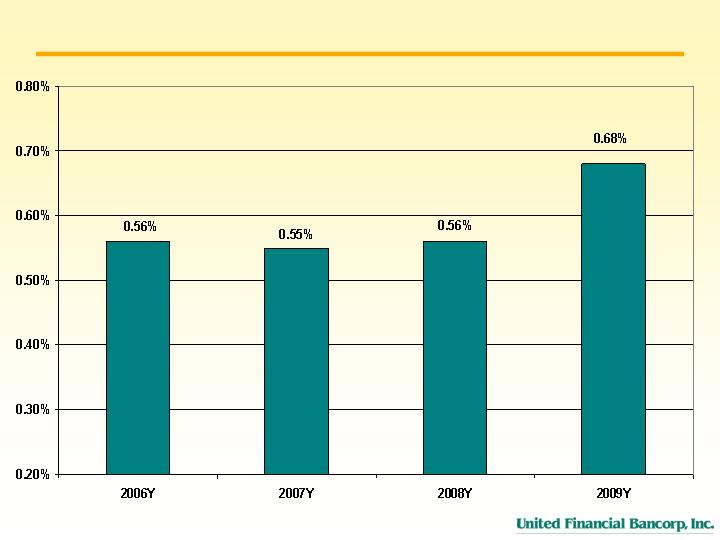
Efficiency ratio improving
as we grow
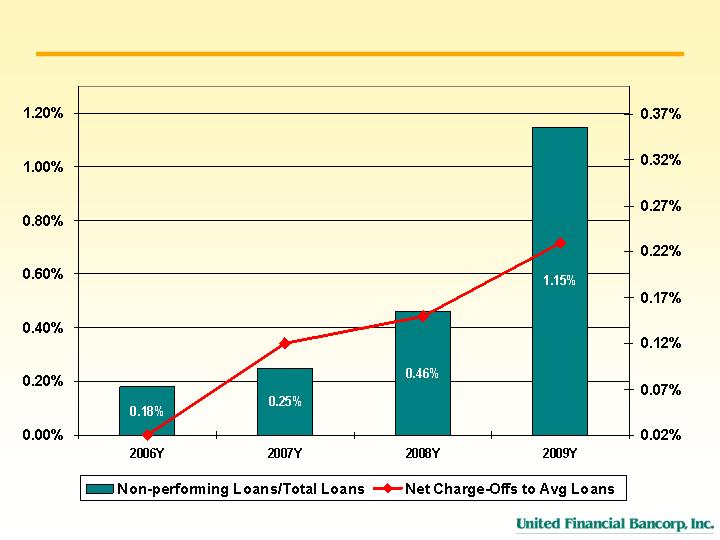
NPA and charge-offs
increased due to 5
commercial credits with
workout strategies
Well capitalized at 14%.
Decrease in tangible equity
to tangible assets driven by
buybacks, balance sheet
growth and CNB
acquisition
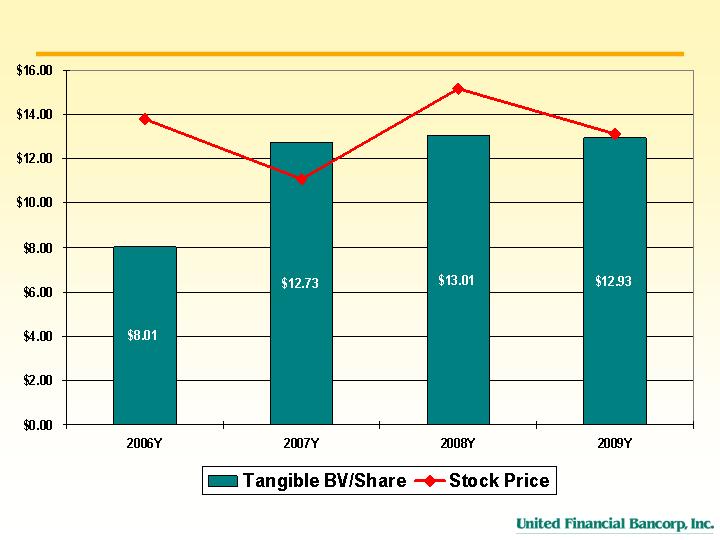
Financial Performance
CNB Earnings Impact: 2010 Earnings Accretion projected > initial projection of 9%.
Minimal dilution to tangible book value.

Why invest in United Financial Bancorp, Inc.?
Experienced Management Team focused on creating shareholder value
Well capitalized (14% Tangible Equity/ Tangible Assets)
Effective Capital Management Strategy with successful stock repurchase program and competitive dividend yield
Continuous growth through an expanding franchise
Organic growth
De Novo branching
Acquisition
Balanced Loan & Deposit Mix and Growth
Strong market position in both loans & deposits
More bank-like mix in loans
54% of deposits in core
Excellent asset quality
63% of NPLs driven by 5 loans with workout strategies
95% of Investment portfolio is agency backed

Holding Company for
FOR QUESTIONS, PLEASE CONTACT:
Dena M. Hall, SVP, Marketing and Investor Relations
(413) 787- 1292
dhall@bankatunited.com
Mark A. Roberts, Executive Vice President and Chief Financial Officer
(413) 787-1201
mroberts@bankatunited.com
Holding Company for
APPENDIX