Attached files
| file | filename |
|---|---|
| 8-K - 8-K FOR 2009 EARNINGS RELEASE - TEMPLE INLAND INC | tin8k2009earnings20100209.htm |
| EX-99.2 - CONFERENCE CALL SLIDES - TEMPLE INLAND INC | tinex99220100209.htm |
| EX-99.1 - 2009 EARNINGS RELEASE - TEMPLE INLAND INC | tinex99120100209.htm |

43
Our
job is to be the best
Investor
Presentation

44
This
presentation contains “forward-looking statements” within the meaning of
the federal securities laws. These statements reflect management’s current views
with respect to future events and are subject to risk and uncertainties. We note
that a variety of factors and uncertainties could cause our actual results to differ
significantly from the results discussed in the forward-looking statements.
Factors and uncertainties that might cause such differences include, but are not
limited to: general economic, market, or business conditions; the opportunities
(or lack thereof) that may be presented to us and that we may pursue;
fluctuations in costs and expenses including the costs of raw materials,
purchased energy, and freight; changes in interest rates; current conditions in
financial markets could adversely affect our ability to finance our operations;
demand for new housing; accuracy of accounting assumptions related to
impaired assets, pension and postretirement costs, contingency reserves, and
income taxes; competitive actions by other companies; changes in laws or
regulations; our ability to execute certain strategic and business improvement
initiatives; the accuracy of certain judgments and estimates concerning the
integration of acquired operations; and other factors, many of which are beyond
our control.
This
presentation includes non-GAAP financial measures. The
required
reconciliations to GAAP financial measures are included on our website,
www.templeinland.com.
reconciliations to GAAP financial measures are included on our website,
www.templeinland.com.
Forward
Looking Statements

45
Create
Superior and Sustainable Value
• Maximize
ROI
• Profitably grow our
business

46
2009
Scorecard
• Maximize ROI —» 7.0%
ROI
– Corrugated Packaging
—» 16.5%
ROI
• Record earnings of
$347 million
• Highest ROI in peer
group
• Fourth consecutive
year of above cost of capital
returns
returns
– Building
Products —»
(5.0)% ROI
• Generated positive
EBITDA of $17 million, a $9
million improvement over 2008
million improvement over 2008
• Significantly
outperformed peers

47
2009
Scorecard
• Profitably grow our
company
– PBL
acquisition
• $20 million of
synergies
• $30 million from
white-top
• 60%
ROI

48
$482
$710
$1,192
Long-term
debt reduced by $482 million in 2009
2009
Long-Term Debt Reduction

49
• Corrugated
Packaging
• Building
Products
Business
Description
Financial
Highlights
|
($
in Millions)
|
2004
|
2005
|
2006
|
2007
|
2008
|
2009
|
|
Revenue
|
$3,587
|
$3,723
|
$4,096
|
$3,850
|
$3,884
|
$3,577
|
|
EBIT
|
$134
|
$133
|
$331
|
$161
|
$111
|
$192
|
|
Investment
|
$2,370
|
$2,431
|
$2,620
|
$2,570
|
$2,484
|
$2,762
|
|
ROI
|
5.7%
|
5.5%
|
12.6%
|
6.3%
|
4.5%
|
7.0%
|
|
EBITDA
|
$340
|
$339
|
$542
|
$364
|
$317
|
$392
|
Notes: Excludes
2004-2007 timber and timberland segment results.
Temple-Inland

50
• 7 mills
- 3.9 million
tons
• 63 converting
facilities
- 3.7 million
tons
• # 3 industry
producer
Business
Highlights
Financial
Highlights
|
($
in Millions)
|
2003
|
2004
|
2005
|
2006
|
2007
|
2008
|
2009
|
|
Revenue
|
$2,700
|
$2,736
|
$2,825
|
$2,977
|
$3,044
|
$3,190
|
$3,001
|
|
EBIT
|
$18
|
$96
|
$120
|
$255
|
$287
|
$225
|
$347
|
|
Investment
|
$2,237
|
$2,042
|
$2,125
|
$2,039
|
$2,004
|
$1,990
|
$2,109
|
|
ROI
|
0.8%
|
4.7%
|
5.6%
|
12.5%
|
14.3%
|
11.3%
|
16.5%
|
|
EBITDA
|
$185
|
$255
|
$280
|
$408
|
$429
|
$371
|
$492
|
Corrugated Packaging
Segment Highlights

51
•
Maintain high integration level
- Box
plant consumption =
mill
capacity
• Drive
for
low
cost
- Asset utilization
and manufacturing excellence
• Improve
mix and margins
- Sales
excellence
•
Profitably grow business
-
Organically / Acquisition
Lowering
Costs, Improving Efficiencies and Growing Profitably
Corrugated Packaging
Strategic Initiatives

52
Source: Company
reports
Temple-Inland
is the most integrated producer of corrugated containers
Integration Level -
Highest in the Industry

53
Drive
For Low Cost
• Lower mill
costs
– Enhanced
reliability
– Targeted investments
to reduce energy consumption and
enhance mix flexibility
enhance mix flexibility
• Lower box plant
costs
– Box plant
transformation
• Cultural change to
lower costs by driving asset utilization
• Fewer plants, fewer
machines, fewer people

54
98”
CORRUGATOR
12
Machines
Asset
Utilization
Lexington Plant - Old Layout
Lexington Plant - Old Layout

55
98”
CORRUGATOR
T-CART
T-CART
66”
D/C
35”
EVOL
66”
D/C
4
Machines
35”
EVOL
Asset
Utilization
Lexington Plant - New Layout
Lexington Plant - New Layout

56
Box
Plant Transformation I (2006-2010)
• EBIT (Lower
Costs)
$80MM/Year
– Fewer Plants
4
– Fewer Machines
88
– Fewer People
1,157
• Investment
$174MM
• ROI
46%

57
Box
Plant Transformation II (2010-2013)
• EBIT (Lower
Costs)
$100MM/Year
– Fewer Plants
12
– Fewer Machines
66
– Fewer People
917
• Investment
$250MM
• ROI
40%

58
Improve
Mix and Margins
• Centralized pricing
decision making
• Structured and
disciplined approach to
market
market
• Target customers
where we can create
value
value

59
Food
& Beverage
63%
Misc.
Mfg.
3%
Other
14%
Chemicals
4%
Rubber
& Plastics
5%
Paper
& Allied
11%
Food
& Beverage
49%
Paper
& Allied
22%
Rubber
& Plastics
6%
Chemicals
5%
Misc.
Nondurables
4%
Misc.
Durable Goods
14%
Temple-Inland
Industry*
*Source: Fibre Box
Association
Shipments by End-Use
Industry

60
TIN
has highest ROA in the Peer Group
Notes:
(1) As reported by segment excluding special items
for TIN,
IP and Weyerhaeuser. For TIN and IP, the asset base was adjusted to include
acquisitions made in Q3 2008. (2) For PCA, EBIT =
Gross profit-selling and administrative expenses. (3) For SSCC, EBIT as reported by segment; total assets reported for the company in 2007, 2008 and 2009. For prior years, total assets =
segment assets + other assets of $3.3 billion.
Gross profit-selling and administrative expenses. (3) For SSCC, EBIT as reported by segment; total assets reported for the company in 2007, 2008 and 2009. For prior years, total assets =
segment assets + other assets of $3.3 billion.
Corrugated Packaging
- Highest ROA in
Peer Group
Peer Group

61
North
American Corrugated Packaging
Industry Fundamentals
Industry Fundamentals
• Consolidating industry
• Significant capacity
rationalization and
downtime
downtime
• Lower
inventories
• Improved
pricing

62
Top 5
Producers= 42%
1998
2010
Top 5
Producers= 74%
North
American Containerboard Market
Share 1998 vs. Today
Share 1998 vs. Today

63
(Million
Short Tons)
Source:
RISI and
Company
reports
Permanent
closure announcements of 2.9 million
tons,
7%
of North American capacity, since Q4 2008
Corrugated
Packaging
Industry Containerboard Capacity Changes and Operating Rate
Industry Containerboard Capacity Changes and Operating Rate
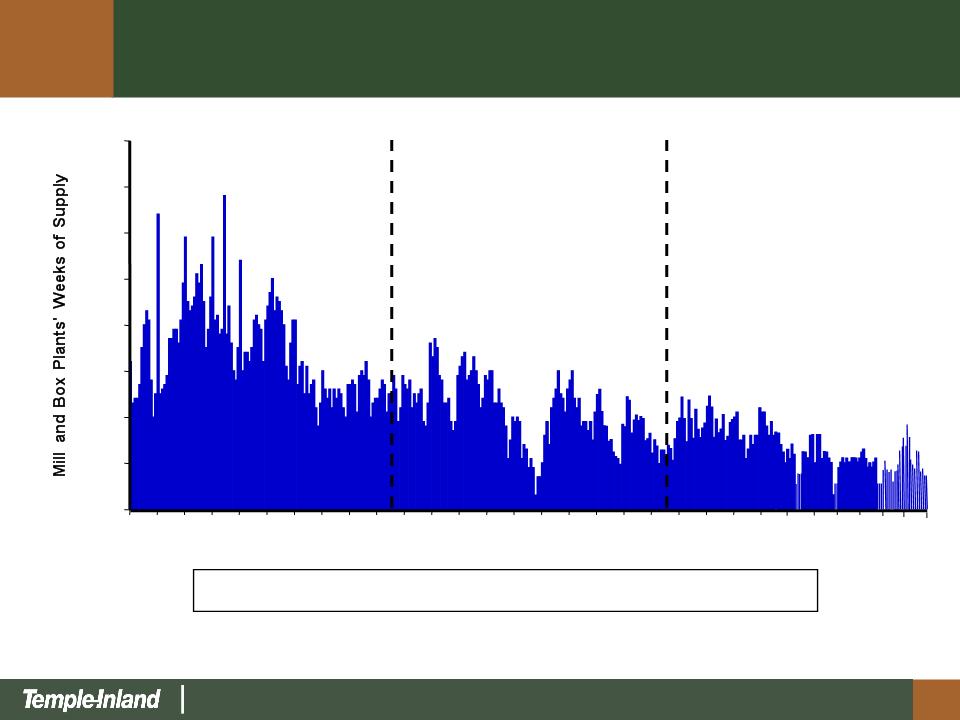
64
3.0
4.0
5.0
6.0
7.0
8.0
9.0
10.0
11.0
80
81
82
83
84
85
86
87
88
89
90
91
92
93
94
95
96
97
98
99
00
01
02
03
1980
- 1989
Average: 6.4 Weeks
Average: 6.4 Weeks
1990
- 1999
Average: 5.1 Weeks
Average: 5.1 Weeks
2000
- 2009
Average: 4.3 Weeks
Average: 4.3 Weeks
04
05
06
07
Source:
Fibre Box Association
Inventory
levels are at lowest levels since 1994
08
09
Inventory Levels
Continue to Decline

65
Source:
RISI
Linerboard
($/ton)
Improved
Linerboard Pricing
Linerboard Pricing
Trends
Average
annual linerboard price declined only modestly in 2009

66
Corrugated Packaging
Summary
• Simple, effective
strategy…execution = results
• Track record of
success
• Improving industry
fundamentals

67
• Portfolio
of Products
– Lumber
– Gypsum
– Particleboard
– MDF
• Lowest
quartile cost converting
operations
operations
• Located
near large, high-growth
markets
markets
Financial
Highlights
Business
Highlights
|
($
in Millions)
|
2004
|
2005
|
2006
|
2007
|
2008
|
2009
|
|
Revenue
|
$851
|
$898
|
$1,119
|
$806
|
$694
|
$576
|
|
EBIT
|
$129
|
$125
|
$221
|
$8
|
($40)
|
($27)
|
|
Investment
|
$396
|
$361
|
$586
|
$562
|
$560
|
$535
|
|
ROI
|
32.6%
|
34.6%
|
37.7%
|
1.4%
|
(7.1%)
|
(5.0%)
|
|
EBITDA
|
$167
|
$160
|
$265
|
$53
|
$8
|
$17
|
Building
Products

68
Building Products
Strategic Initiatives
• Deliver
tailored portfolio of building products
– Products for new
home, repair and remodeling
and commercial markets
and commercial markets
• Drive
low cost
– Manufacturing
excellence
• Serve
preferred markets
– Favorable
demographics
• Profitably
grow business

69
Buna
Pineland
Diboll
Rome
DeQuincy
Lumber
Competitive
Position
Temple-Inland
Sawmills
1st
Quartile
2nd
Quartile
3rd
Quartile
4th
Quartile
Source:
Beck &
RISI Studies
RISI Studies
Temple-Inland
Sawmills
Sawmill
Locations
Lumber
• Low cost, state of
art manufacturing system
• Logistically
advantaged to large growing markets
• Stable fiber supply
at market prices
70
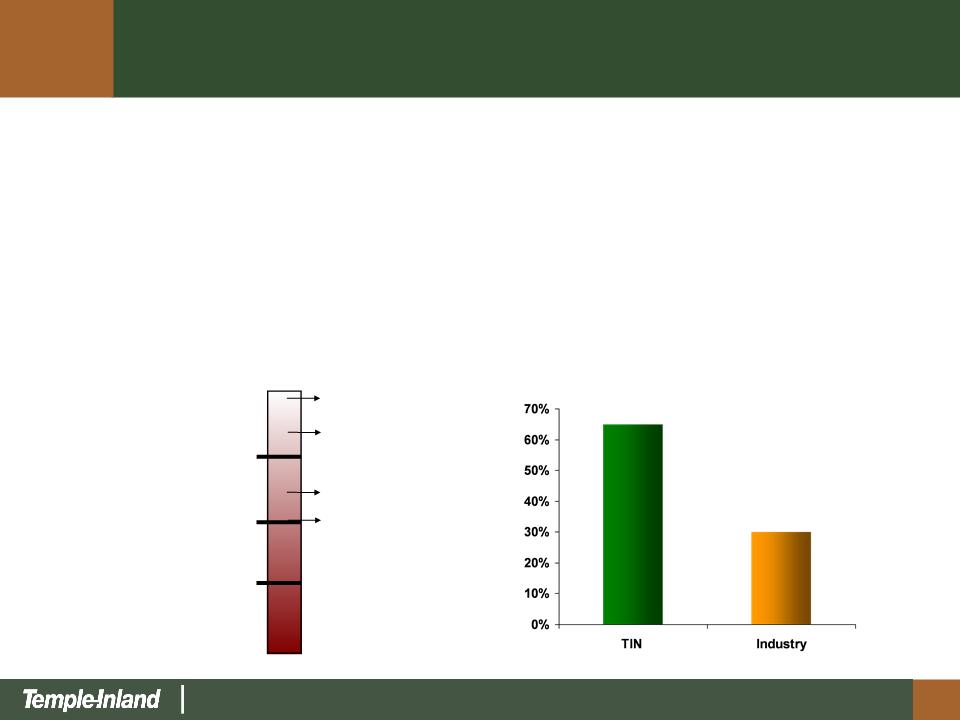
Synthetic
Gypsum Furnish
Gypsum
Competitive
Position
Cumberland
Fletcher
W. Memphis
McQueeney
1st
Quartile
2nd
Quartile
3rd
Quartile
4th
Quartile
Source:
Internal
Analysis
Internal
Analysis
Gypsum
• Low-cost
manufacturing system
• Synthetic gypsum
furnish 65% vs. 30% for industry

71
Panels
Competitive
Position
Monroeville
Hope
Diboll
Thomson
1st
Quartile
2nd
Quartile
3rd
Quartile
4th
Quartile
Source:
Beck Study
Beck Study
PB
MDF
El
Dorado
Mt.
Jewett
Industrial Panels -
Particleboard & MDF
• Lowest cost
system
• High-value
engineered family of
products
products
• Targeted
markets
– Kitchen
cabinets
– Laminators
– MDF laminate
flooring

72
Housing
Starts
TIN
EBITDA
2006
2007
2008
2,127
2009
906
554
$8
$17

73
2010
Financial Priorities
• Return cash to
shareholders
– Maintained dividend
during 2009
– Q1 2010 dividend
increased 10% to
annual rate of $0.44 per share
annual rate of $0.44 per share
• Reduce
debt
• Invest in our
business
• Grow

74
Feb
2010
Create
Superior and Sustainable Value
• Maximize
ROI
• Profitably grow our
business

75
Appendix

76
Total
Debt
$710
Borrowings
Under
Committed
Credit
Facilities
$155
Term
Debt
$555
($
In Millions)
Year-End 2009 Debt
Structure

77
Term
debt
($
In Millions)
Total
Term Debt = $555MM
Term
Debt Maturity Profile as of Year-End
2009
2009

78
Accounts
Receivable Committed
Securitization Credit
Facility Agreements Total
($
In Millions)
Year-End,
2009
Committed Credit Facilities
Committed Credit Facilities
Committed $
250 $
825 $1,075
Less:
Borrowings (130) (25) (155)
Letters
of credit - (30) (30)
Unused
borrowing capacity $ 120 $
770 $ 890
Facility
Maturities Oct,
2012 July,
2011 ($750MM revolver)
Covenants (as
specifically defined): 4Q-End,
2009
Debt/total
capital 43.0% 70%
Max
Interest
coverage * 10.2x
3.0x Min
* Best
4 out of 5 trailing quarters
4Q/2009
= 10.2x