Attached files
| file | filename |
|---|---|
| 8-K - FORM 8-K - Celanese Corp | d70963e8vk.htm |
| EX-99.1 - EX-99.1 - Celanese Corp | d70963exv99w1.htm |
Exhibit 99.2

| Dave Weidman, Chairman and CEO Steven Sterin, Senior Vice President and CFO Celanese 4Q 2009 Earnings Conference Call / Webcast Tuesday, February 9, 2010 10:00 a.m. ET |

| Forward Looking Statements Reconciliation and Use of Non-GAAP Measures to U.S. GAAP Forward-Looking Statements This presentation may contain "forward-looking statements," which include information concerning the company's plans, objectives, goals, strategies, future revenues or performance, capital expenditures, financing needs and other information that is not historical information. When used in this presentation, the words "outlook," "forecast," "estimates," "expects," "anticipates," "projects," "plans," "intends," "believes," and variations of such words or similar expressions are intended to identify forward-looking statements. All forward-looking statements are based upon current expectations and beliefs and various assumptions. There can be no assurance that the company will realize these expectations or that these beliefs will prove correct. There are a number of risks and uncertainties that could cause actual results to differ materially from the forward-looking statements contained in this presentation. Numerous factors, many of which are beyond the company's control, could cause actual results to differ materially from those expressed as forward-looking statements. Certain of these risk factors are discussed in the company's filings with the Securities and Exchange Commission. Any forward-looking statement speaks only as of the date on which it is made, and the company undertakes no obligation to update any forward-looking statements to reflect events or circumstances after the date on which it is made or to reflect the occurrence of anticipated or unanticipated events or circumstances. Reconciliation of Non-U.S. GAAP Measures to U.S. GAAP This presentation reflects five performance measures, operating EBITDA, affiliate EBITDA, adjusted earnings per share, net debt and adjusted free cash flow, as non-U.S. GAAP measures. These measurements are not recognized in accordance with U.S. GAAP and should not be viewed as an alternative to U.S. GAAP measures of performance. The most directly comparable financial measure presented in accordance with U.S. GAAP in our consolidated financial statements for operating EBITDA is operating profit; for affiliate EBITDA is equity in net earnings of affiliates; for adjusted earnings per share is earnings per common share-diluted; for net debt is total debt; and for adjusted free cash flow is cash flow from operations. Use of Non-U.S. GAAP Financial Information Operating EBITDA, a measure used by management to measure performance, is defined by the company as operating profit from continuing operations, plus equity in net earnings from affiliates, other income and depreciation and amortization, and further adjusted for other charges and adjustments. We may provide guidance on operating EBITDA and are unable to reconcile forecasted operating EBITDA to a U.S. GAAP financial measure because a forecast of Other Charges and Adjustments is not practical. Our management believes operating EBITDA is useful to investors because it is one of the primary measures our management uses for its planning and budgeting processes and to monitor and evaluate financial and operating results. Affiliate EBITDA, a measure used by management to measure performance of its equity investments, is defined by the company as the proportional operating profit plus the proportional depreciation and amortization of its equity investments. The company has determined that it does not have sufficient ownership for operating control of these investments to consider their results on a consolidated basis. The company believes that investors should consider affiliate EBITDA when determining the equity investments' overall value in the company. Adjusted earnings per share is a measure used by management to measure performance. It is defined by the company as net earnings (loss) available to common shareholders plus preferred dividends, adjusted for other charges and adjustments, and divided by the number of basic common shares, diluted preferred shares, and options valued using the treasury method. We may provide guidance on an adjusted earnings per share basis and are unable to reconcile forecasted adjusted earnings per share to a U.S. GAAP financial measure without unreasonable effort because a forecast of Other Items is not practical. We believe that the presentation of this non-U.S. GAAP measure provides useful information to management and investors regarding various financial and business trends relating to our financial condition and results of operations, and that when U.S. GAAP information is viewed in conjunction with non-U.S. GAAP information, investors are provided with a more meaningful understanding of our ongoing operating performance. Note: The tax rate used for adjusted earnings per share approximates the midpoint in a range of forecasted tax rates for the year, excluding changes in uncertain tax positions, discrete items and other material items adjusted out of our U.S. GAAP earnings for adjusted earnings per share purposes, and changes in management's assessments regarding the ability to realize deferred tax assets. We analyze this rate quarterly and adjust if there is a material change in the range of forecasted tax rates; an updated forecast would not necessarily result in a change to our tax rate used for adjusted earnings per share. The adjusted tax rate is an estimate and may differ significantly from the tax rate used for U.S. GAAP reporting in any given reporting period. It is not practical to reconcile our prospective adjusted tax rate to the actual U.S. GAAP tax rate in any future period. Net debt is defined by the company as total debt less cash and cash equivalents. We believe that the presentation of this non-U.S. GAAP measure provides useful information to management and investors regarding changes to the company's capital structure. Our management and credit analysts use net debt to evaluate the company's capital structure and assess credit quality. Adjusted free cash flow is defined by the company as cash flow from operations less capital expenditures, other productive asset purchases, operating cash from discontinued operations and certain other charges and adjustments. We believe that the presentation of this non-U.S. GAAP measure provides useful information to management and investors regarding changes to the company's cash flow. Our management and credit analysts use adjusted free cash flow to evaluate the company's liquidity and assess credit quality. Results Unaudited The results presented in this presentation, together with the adjustments made to present the results on a comparable basis, have not been audited and are based on internal financial data furnished to management. Quarterly results should not be taken as an indication of the results of operations to be reported for any subsequent period or for the full fiscal year. |

| Dave Weidman Chairman and Chief Executive Officer |

| Celanese Corporation 4Q and full year 2009 highlights in millions (except EPS) 4th Qtr 2009 4th Qtr 2008 FY 2009 FY 2008 Net Sales $1,388 $1,286 $5,082 $6,823 Operating Profit/(Loss) $109 ($152) $290 $440 Adjusted EPS $0.50 ($0.40) $1.71 $2.75 Operating EBITDA $227 $63 $847 $1,164 Fourth Quarter 2009: Sustained sequential performance Improved volume across most end markets; less than expected seasonality Delivered fixed spending reduction commitments |

| Recent strategic actions build earnings power of portfolio MOU announced for Acetate expansion project with current China partner Consumer Specialties 2011+: Increased earnings through JV dividends Nanjing VAE / Emulsion capacity expansion Industrial Specialties 2011+: Volume expansion supporting growth in China Well defined path forward - delivering today Nanjing successfully expanded to 1.2 kt/a acid capacity Ceased production at Pardies site Jiangxi Jiangwei VAM sourcing agreement Acetyl Intermediates 2010+: $40-50 million operating margin improvement Strengthen derivatives position Launch of innovative impact modified POM Acquired LFT business of FACT GmbH Advanced Engineered Materials 2010+: $500 million application opportunity growth Build on leading position |

| Productivity Driven Tax Rate 2010 Earnings Improvement AEM: Destocking complete AI: Technology, 2009 FIFO effect IS: Asia growth focus CS: Sustain performance Pardies & Cangrejera closures Other manufacturing realignment SG&A realignment Sustained lower tax rate Benefits of manufacturing and administrative restructuring Cash tax rate expected to be similar Volume Driven At least $100 million Low 20% range Depreciation & Amortization Lower D&A resulting from manufacturing realignment ~$30 million $80 - $100 million Adjusted EPS Operating EBITDA |

| Steven Sterin Senior Vice President and CFO |

| in millions 4th Qtr 2009 4th Qtr 2008 FY 2009 FY 2008 Net Sales $239 $195 $808 $1,061 Operating EBITDA $50 ($3) $134 $170 Advanced Engineered Materials Fourth Quarter 2009: Margin expansion reflecting significant operating leverage Net sales increased with volume recovery across all end-markets and geographies; offset by lower pricing due to product mix Lower raw material and energy costs along with productivity drove improved margins Outlook: Modest volume improvement driven by global automotive and electronics production Equity affiliate earnings improvement reflecting recovery trends Sequential raw material pressure |

| Fourth Quarter 2009: Strong performance with sustained margins from higher pricing in Acetate products and benefits from fixed spending reductions Volume decline from softer consumer demand and inventory destocking in the late-cycle businesses Strong finish to record year of earnings performance Consumer Specialties in millions 4th Qtr 2009 4th Qtr 2008 FY 2009 FY 2008 Net Sales $267 $286 $1,084 $1,155 Operating EBITDA $65 $65 $348 $293 Outlook: Modest destocking in end markets Sustained margins with continued benefits from fixed spending reductions |

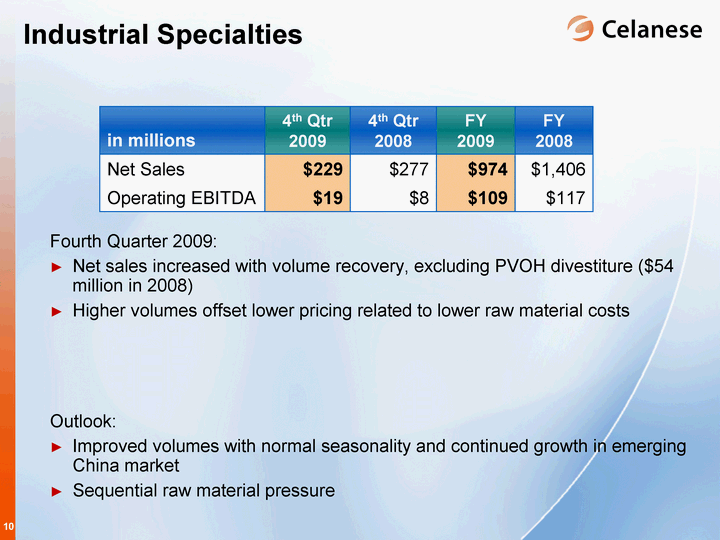
| Fourth Quarter 2009: Net sales increased with volume recovery, excluding PVOH divestiture ($54 million in 2008) Higher volumes offset lower pricing related to lower raw material costs Industrial Specialties in millions 4th Qtr 2009 4th Qtr 2008 FY 2009 FY 2008 Net Sales $229 $277 $974 $1,406 Operating EBITDA $19 $8 $109 $117 Outlook: Improved volumes with normal seasonality and continued growth in emerging China market Sequential raw material pressure |

| Acetyl Intermediates in millions 4th Qtr 2009 4th Qtr 2008 FY 2009 FY 2008 Net Sales $743 $656 $2,603 $3,875 Operating EBITDA $128 $21 $357 $676 Fourth Quarter 2009: Significant volume recovery and margin expansion in seasonally strong quarter Improved performance driven by higher volumes, lower raw material costs, and benefits from fixed spending reductions Dividends from the cost investments contributed $17 million to Operating EBITDA, $12 million lower than 4Q 2008 Outlook: Stable volume Sequential raw material pressure offset by benefits of manufacturing realignment |

| 4Q 2009 4Q 2008 FY 2009 FY 2008 Dividends - Equity Investments 6 2 37 64 Dividends - Cost Investments 17 29 98 167 4Q 2009 4Q 2008 FY 2009 FY 2008 Earnings - Equity Investments 4 8 48 54 Dividends - Cost Investments 17 29 98 167 4Q 2009: Earnings and dividends impact Lower dividends from Ibn Sina, driven by methanol and MTBE margins Lower equity earnings, driven by turnaround in AEM affiliate Outlook: Cost and equity affiliate improvement consistent with economic recovery and increasing raw material prices Income Statement Affiliate Performance Cash Flows |

| Solid cash generation Adjusted Free Cash Flow Adjusted Free Cash Flow Adjusted Free Cash Flow $ in millions FY2009 FY2008 Net cash provided by operating activities $596 $586 Adjustments to operating cash for discontinued operations $2 ($3) Net cash provided by operating activities from continuing operations $598 $583 Less: Capital expenditures $176 $274 Add: Other charges and adjustments1 ($12) $76 Adjusted Free Cash Flow $410 $385 1Amounts primarily associated with certain other charges and adjustments and the cash outflows for purchases of other productive assets that are classified as 'investing activities' for U.S. GAAP purposes. Factors contributing to cash generation during 2009: Continued strong free cash generation Lower cash taxes, interest expense and capital expenditures helped offset lower operating EBITDA |

| Strong cash generation continues throughout economic cycle Available Cash Available Cash Cash (as of 12/31/2009) $1,254 Kelsterbach Project ~($150) Operating Cash ~($300) Cash Available for Strategic Purposes ~$800 Expect to continue to generate positive free cash flow Ticona Kelsterbach relocation: Approximately $300 million expected outflow in 2010 Requires approximately $150 million incremental cash in 2010 (above cash included in ending cash balance on 12/31/09) Final project reimbursement of €110 million expected in 2011 2010E Cash Flow Expectation off EBITDA Base 2010E Cash Flow Expectation off EBITDA Base Cash Taxes $90 - $110 Capital Expenditures $255 - $275 Reserve/Other $110 - $130 Net Interest $200 - $210 Pension $40 - $50 Adjusted Free Cash Outflows $695 - $775 Dividends/Debt Service $75 - $100 $ in millions $ in millions |

| $240 million of 4.25% Convertible Perpetual Preferred Stock currently outstanding Company announced redemption of Preferred Stock for common shares on February 1, 2010 Redemption date: February 22, 2010 Holders have right to convert prior to redemption date Saves ~$8 million annually in cash dividends No EPS dilution Convertible Preferred Stock Redemption Details / Timeline Benefits of Redemption No impact to future diluted earnings per share |

| Appendix |

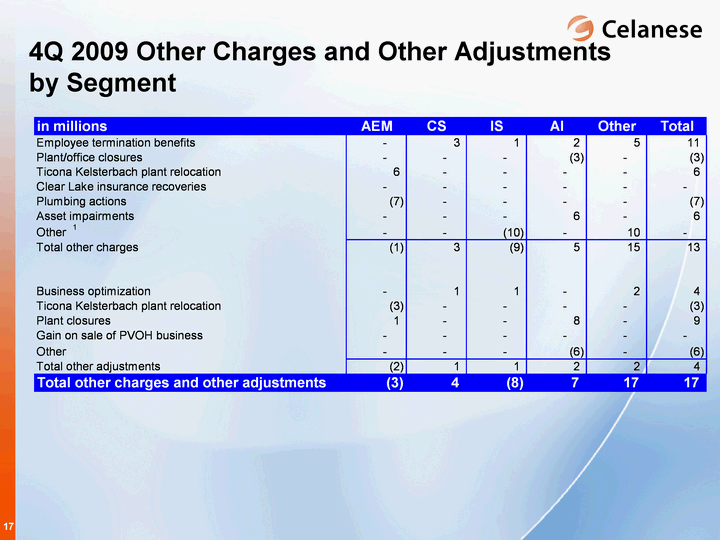
| 4Q 2009 Other Charges and Other Adjustments by Segment |

| FY 2009 Other Charges and Other Adjustments by Segment |

| Reg G: Reconciliation of Adjusted EPS |

| Reg G: Reconciliation of Net Debt |

| Reg G: Other Charges and Other Adjustments |

| Reg G: Reconciliation of Operating EBITDA |

| Reg G: Equity Affiliate Preliminary Results and Celanese Proportional Share - Unaudited |
