Attached files
 ©
2010 CareFusion Corporation or one of its subsidiaries. All rights reserved. February 9, 2010 Q2 and 1H Fiscal 2010 Investor/Analyst Call Exhibit 99.2 |
 ©
2010 CareFusion Corporation or one of its subsidiaries. All rights reserved. 2 Forward-Looking Statements and GAAP Reconciliation Forward-Looking Statements and GAAP Reconciliation contains forward-looking statements addressing expectations, prospects, estimates and other
matters that are dependent upon future events or developments. The matters
discussed in these forward-looking statements are subject to risks and
uncertainties that could cause actual results to differ materially from those projected, anticipated or implied. The most significant of these uncertainties are described in CareFusion’s
Form 10-K, Form 10-Q and Form 8-K reports (including all amendments to
those reports) and exhibits to those reports, and include (but are not limited to) the
following: we may be unable to effectively enhance our existing products or introduce
and market new products or may fail to keep pace with advances in technology; we are subject to complex and costly regulation; cost containment efforts of our customers, purchasing groups,
third-party payers and governmental organizations could adversely affect our sales
and profitability; declining economic conditions could adversely affect our results of
operations and financial condition; we may be unable to protect our intellectual
property rights or may infringe on the intellectual property rights of others; defects or failures associated with our products and/or our quality system could lead to the filing of adverse event reports,
recalls or safety alerts and negative publicity and could subject us to regulatory
actions; we are currently operating under a consent decree with the FDA and our failure
to comply with the requirements of the consent decree may have an adverse effect on our
business; and we may face significant uncertainty in the industry due to government healthcare reform. This presentation reflects management’s views as of February 9, 2010. Except to the extent required
by applicable law, we undertake no obligation to update or revise any
forward-looking statement. measures. Reconciliations can be found on slide 14 of this presentation. In addition,
definitions and reconciling information can be found on CareFusion’s website at www.carefusion.com under the SEC Filings link of the Investor Relations tab. “Safe Harbor” Statement under the Private Securities Litigation Reform Act of 1995: This presentation Non-GAAP Financial Measures: The financial information included in this presentation includes Non-GAAP financial |
 ©
2010 CareFusion Corporation or one of its subsidiaries. All rights reserved. 3 Today’s Speakers Today’s Speakers Dave Schlotterbeck, Chairman and Chief Executive Officer Ed Borkowski, Chief Financial Officer |
 ©
2010 CareFusion Corporation or one of its subsidiaries. All rights reserved. Q2 and 1H Fiscal 2010 Results Q2 and 1H Fiscal 2010 Results © 2010 CareFusion Corporation or one of its subsidiaries. All rights reserved.
|
 ©
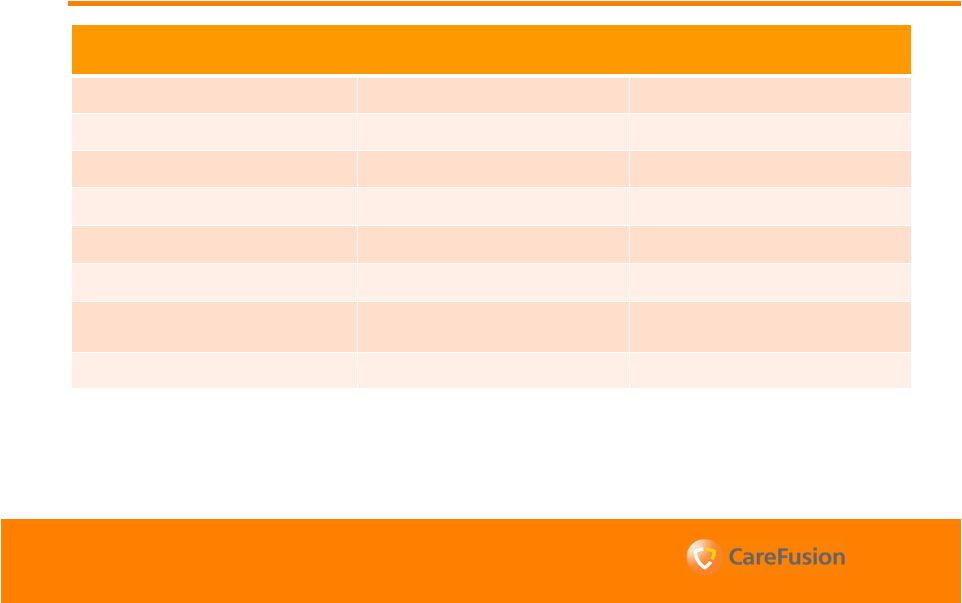
2010 CareFusion Corporation or one of its subsidiaries. All rights reserved. 3 3 2 Q2 Fiscal 2010 Year-Over-Year Quarterly Review Q2 Fiscal 2010 Year-Over-Year Quarterly Review 11% $329 16% $351 Operating Expenses % Change $M % Change $M $0.33 $73 $127 $1,019 GAAP (37)% (32)% (26)% 5% (20)% $88 Income From Continuing Operations (21)% $0.39 Diluted EPS From Continuing Operations Adjusted Revenue $1,019 5% Operating Income $149 (15)% 5 1 % Change over prior year period. 2 Adjusted operating income and adjusted operating expenses are Non-GAAP financial
measures that exclude nonrecurring items related to restructuring and
acquisition integration charges and nonrecurring spinoff related costs. 3 Adjusted income from continuing operations and adjusted diluted earnings per share are
Non-GAAP financial measures that exclude nonrecurring items related to
restructuring and acquisition integration charges, nonrecurring spinoff related costs and nonrecurring tax items. 1 2 1 |
 ©
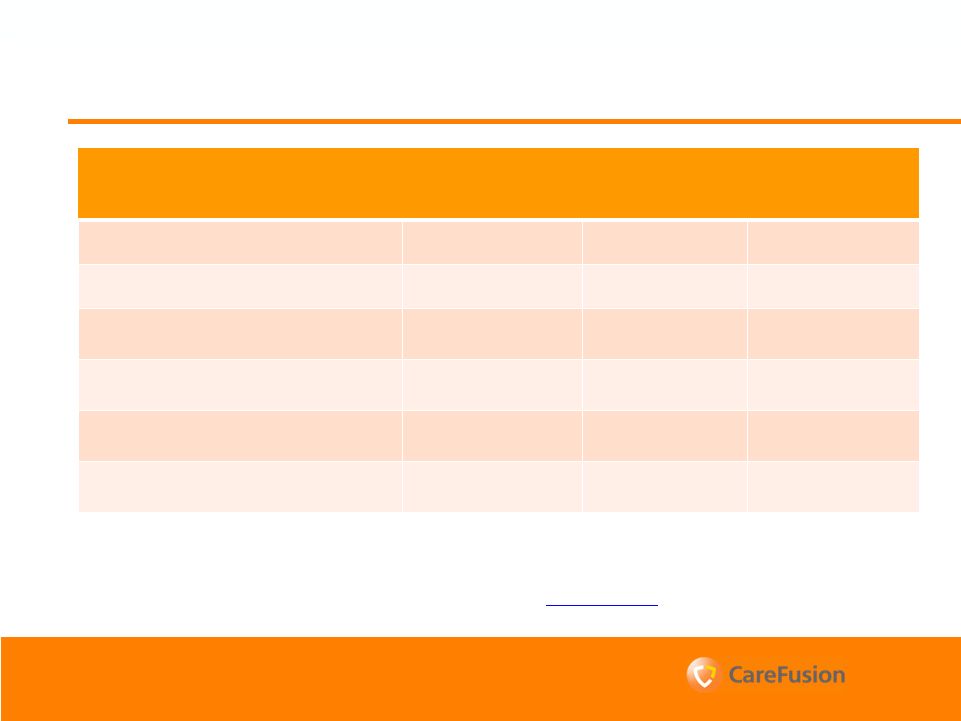
2010 CareFusion Corporation or one of its subsidiaries. All rights reserved. 15% $337 15% $337 Revenues (19)% (39)% $M $111 $682 $M GAAP $16 % Change (24)% 1% % Change % Change $M Critical Care Technologies % Change $M Medical Technologies and Services $23 Segment Profit Adjusted Revenues $682 1% Segment Profit $126 (15)% 6 Q2 Fiscal 2010 Year-Over-Year Quarterly Segment Review Q2 Fiscal 2010 Year-Over-Year Quarterly Segment Review 2 2 1 1 1 1 1 % Change over prior year period. 2 Adjusted segment profit is a Non-GAAP financial measure that excludes nonrecurring items
related to restructuring and acquisition integration charges and nonrecurring
spinoff related costs. |
 ©
2010 CareFusion Corporation or one of its subsidiaries. All rights reserved. 3 2 2 3 Q2 Fiscal 2010 Sequential Quarterly Review Q2 Fiscal 2010 Sequential Quarterly Review 3% $329 5% $351 Operating Expenses % Change $M % Change $M $0.33 $73 $127 $1,019 GAAP 32% 32% 9% 11% 1% $88 Income From Continuing Operations 0% $0.39 Diluted EPS From Continuing Operations Adjusted Revenue $1,019 11% Operating Income $149 12% 7 1 % Change over Q1 Fiscal 2010. 2 Adjusted operating income and adjusted operating expenses are Non-GAAP financial
measures that exclude nonrecurring items related to restructuring and
acquisition integration charges and nonrecurring spinoff related costs. 3 Adjusted income from continuing operations and adjusted diluted earnings per share are
Non-GAAP financial measures that exclude nonrecurring items related to
restructuring and acquisition integration charges, nonrecurring spinoff related costs and nonrecurring tax items. 1 1 |
 ©
2010 CareFusion Corporation or one of its subsidiaries. All rights reserved. 2 2 10% $337 10% $337 Revenues 6% (2)% $M $111 $682 $M GAAP $16 % Change 11% 11% % Change % Change $M Critical Care Technologies % Change $M Medical Technologies and Services $23 Segment Profit Adjusted Revenues $682 11% Segment Profit $126 13% 8 Q2 Fiscal 2010 Sequential Quarterly Segment Review Q2 Fiscal 2010 Sequential Quarterly Segment Review 1 1 1 1 1 % Change over Q1 Fiscal 2010. 2 Adjusted segment profit is a Non-GAAP financial measure that excludes nonrecurring items related
to restructuring and acquisition integration charges and nonrecurring spinoff
related costs. |
 ©
2010 CareFusion Corporation or one of its subsidiaries. All rights reserved. 1H Fiscal 2010 Review 1H Fiscal 2010 Review 5% $646 6% $685 Operating Expenses % Change $M % Change $M $0.58 $128 $244 $1,942 GAAP (11)% (7)% (7)% 3% 8% $174 Income From Continuing Operations 8% $0.79 Diluted EPS From Continuing Operations Adjusted Revenue $1,942 3% Operating Income $283 (5)% 9 1 % Change over prior year period. 2 Adjusted operating income and adjusted operating expenses are Non-GAAP financial
measures that exclude nonrecurring items related to restructuring and
acquisition integration charges and nonrecurring spinoff related costs. 3 Adjusted income from continuing operations and adjusted diluted earnings per share are
Non-GAAP financial measures that exclude nonrecurring items related to
restructuring and acquisition integration charges, nonrecurring spinoff related costs and nonrecurring tax items. 1 1 2 2 3 3 |
 ©
2010 CareFusion Corporation or one of its subsidiaries. All rights reserved. 1H Fiscal 2010 Segment Review 1H Fiscal 2010 Segment Review 9% $643 9% $643 Revenues (14)% (22)% $M $212 $1,299 $M GAAP $32 % Change (4)% 0% % Change % Change $M Critical Care Technologies % Change $M Medical Technologies and Services $46 Segment Profit Adjusted Revenues $ 1,299 0% Segment Profit $238 (3)% 10 1 2 1 1 2 1 1 % Change over prior year period. 2 Adjusted segment profit is a Non-GAAP financial measure that excludes nonrecurring items related
to restructuring and acquisition integration charges and nonrecurring
spinoff related costs. |
 ©
2010 CareFusion Corporation or one of its subsidiaries. All rights reserved. Fiscal 2010 Guidance Fiscal 2010 Guidance © 2010 CareFusion Corporation or one of its subsidiaries. All rights reserved.
|
 ©
2010 CareFusion Corporation or one of its subsidiaries. All rights reserved. $3,850 - $4,000 $3,950 - $4,050 Total Revenue ~47 - 48% ~48% Gross Margin 35% of total revenue 34 - 35% of total revenue Adjusted Operating Expenses ~25 - 26% ~28% Adjusted Tax Rate ~$120 -130 ~$120 - $130 Nonrecurring Items $1.35 - $1.45 $1.40 - $1.45 Adjusted Diluted EPS ~221 ~223 Diluted Weighted Average Shares Outstanding $180 $160 - $170 Capital Expenditures Updated FY10 Outlook $ in millions Previous FY10 Outlook 12 Revised Fiscal 2010 Financial Guidance Revised Fiscal 2010 Financial Guidance 2 3 3 4 1 1 Provided by CareFusion on November 5, 2009. 2 Adjusted operating expenses is a Non-GAAP financial measure that excludes nonrecurring items related
to restructuring and acquisition integration charges and nonrecurring spinoff related
costs. 3 Adjusted tax rate and adjusted diluted earnings per share are Non-GAAP financial measures that exclude
nonrecurring items related to restructuring and acquisition integration charges, nonrecurring
spinoff related costs, nonrecurring tax items and discontinued operations. 4
Nonrecurring items are related to restructuring and acquisition integration charges,
nonrecurring spinoff related costs and nonrecurring tax items. |
 Q&A
Q&A © 2010 CareFusion Corporation or one of its subsidiaries. All rights reserved.
|
 ©
2010 CareFusion Corporation or one of its subsidiaries. All rights reserved. www.carefusion.com under the SEC Filings link of the Investor Non-GAAP Reconciliations Non-GAAP Reconciliations $88 $15 $73 Income From Continuing Operations $0.39 $0.07 $0.33 Diluted EPS From Continuing Operations $329 $(22) $351 Operating Expenses $149 $22 $127 Operating Income FY10 Q2 GAAP $M Nonrecurring Items $M FY10 Q2 Adjusted $M Critical Care Technologies Segment Profit $111 $15 $126 Medical Technologies and Services Segment Profit $16 $7 $23 14 2 1 1 Nonrecurring items are related to restructuring and acquisition integration charges,
nonrecurring spinoff related costs and nonrecurring tax items. 2 Earnings per share calculations are performed for each column presented. Therefore, the
sum of the per share adjustments from the table above may not equal the
adjusted per share total presented. Note: A full GAAP to non-GAAP reconciliation can be
found on CareFusion’s website
at
Relations tab. A discussion of the reasons why management believes that the presentation of
non-GAAP financial measures provides useful information to investors regarding the
company’s financial condition and results of operations is included in Exhibit 99.3 of Form 8-K filed by the company on February 9, 2010. |