Attached files
| file | filename |
|---|---|
| 8-K - FORM 8-K ASHLAND INC. - ASHLAND LLC | form8k.htm |
| 8-K - PDF VERSION OF 8-K - ASHLAND LLC | form8k.pdf |
1 For the fiscal year
ended Sept. 30, 2009. Includes pro forma results from the acquired operations of
Hercules.
Ashland
Consumer
Markets
34%
Markets
34%
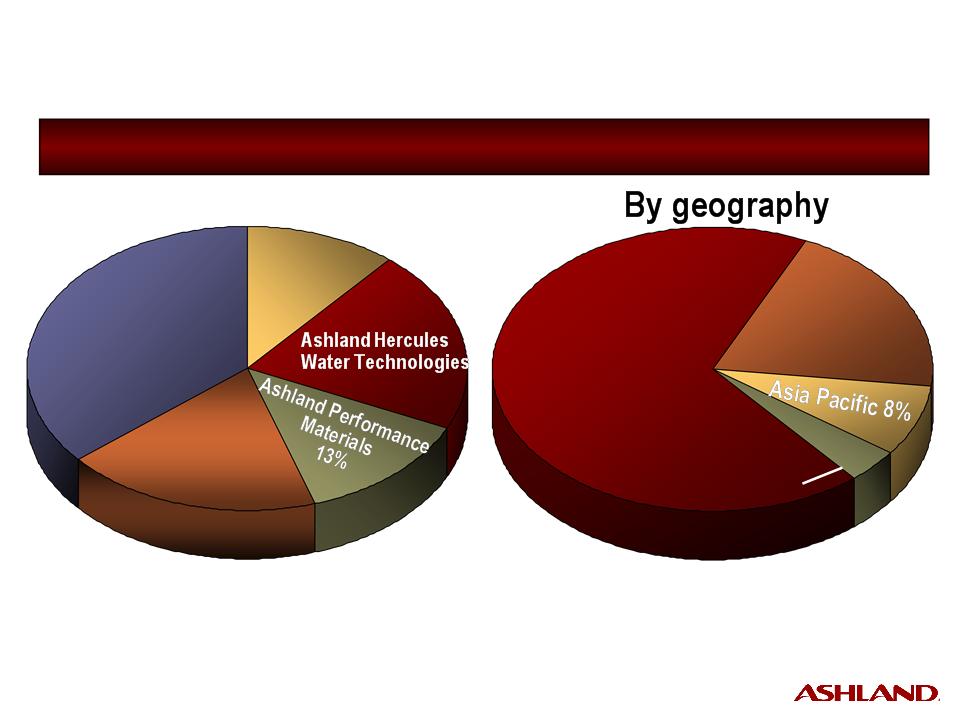
Ashland
Hercules
Water Technologies
Water Technologies
Ashland
Hercules
Water Technologies
Water Technologies
23%
23%
Ashland
Ashland
Aqualon
Functional
Aqualon
Functional
Ingredients
Ingredients
24%
24%
• 56
percent of EBITDA comes from specialty chemicals
• Nearly
25 percent from renewable materials
|
NYSE
Ticker Symbol:
|
ASH
|
|
Total
Employees:
|
~14,700
|
|
Outside
North America
|
33%
|
|
Number
of Countries
in Which Ashland Has Sales: |
More
than 100 |
Adjusted
EBITDA1: $854
million
Fiscal
2009
Corporate Profile
Corporate Profile
Exhibit
99.1
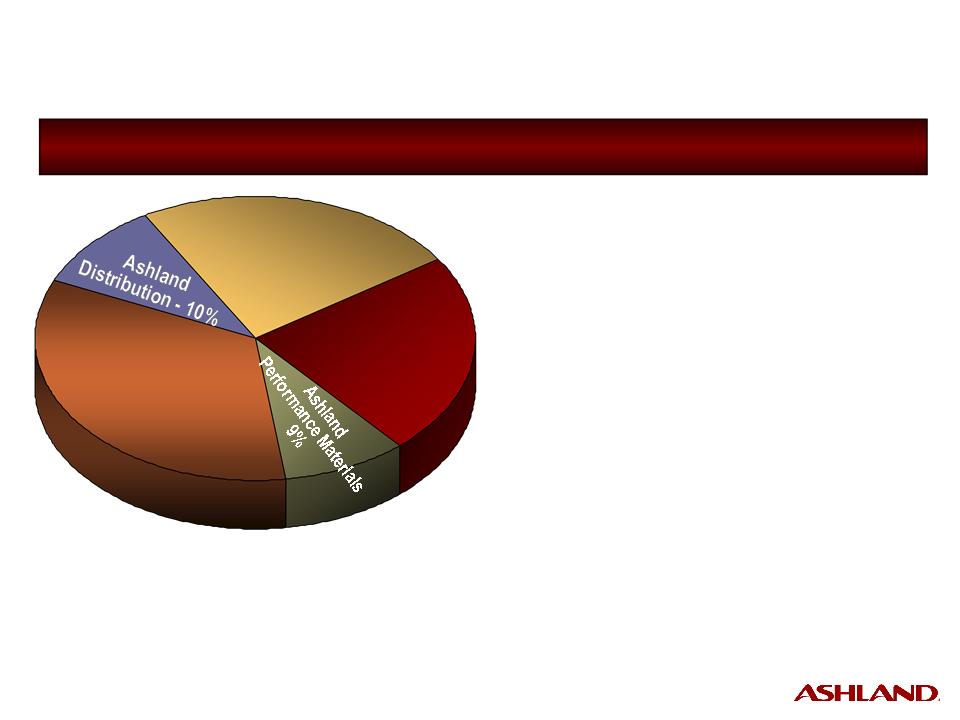
Ashland
Distribution
36%
Distribution
36%
Ashland
Distribution
36%
Distribution
36%
Ashland
Consumer
Markets
19%
Consumer
Markets
19%
By
commercial unit
21%
21%
Ashland
Aqualon
Functional
Ingredients
Aqualon
Functional
Ingredients
Ashland
Aqualon
Functional
Ingredients
Aqualon
Functional
Ingredients
11%
11%
2 For the fiscal year
ended Sept. 30, 2009. Includes intersegment sales and pro forma results from the
acquired
operations of Hercules.
operations of Hercules.
North
America
68%
America
68%
North
America
68%
America
68%
Latin
America/
Other - 4%
Other - 4%
Europe
Europe
20%
20%
~32
percent of total sales come
from outside North America
from outside North America
Adjusted
Sales2: $8.4
billion
Fiscal
2009
Corporate Profile
Corporate Profile
7%
7%
North
America
America
North
America
America
40%
40%
Asia
Pacific
Pacific
Asia
Pacific
Pacific
17%
17%
Europe
36%
Latin
America/
Other
- 7%
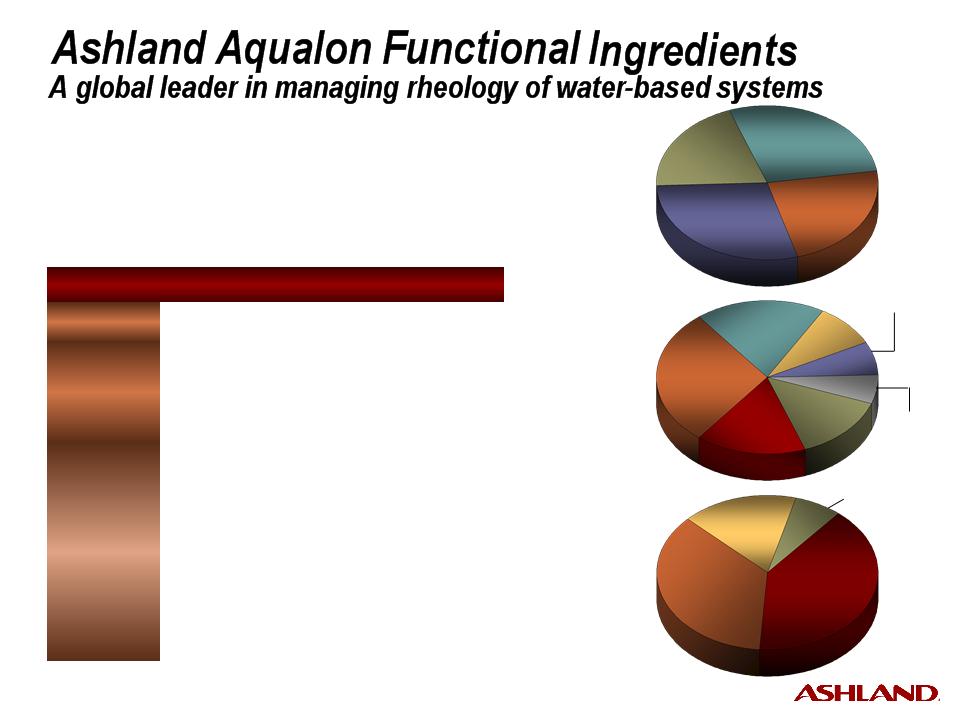
Coatings
Additives
28%
Additives
28%
Coatings
Additives
28%
Additives
28%
Energy
&
Specialties
Solutions
23%
Specialties
Solutions
23%
Regulated
Industries
29%
Industries
29%
Regulated
Industries
29%
Industries
29%
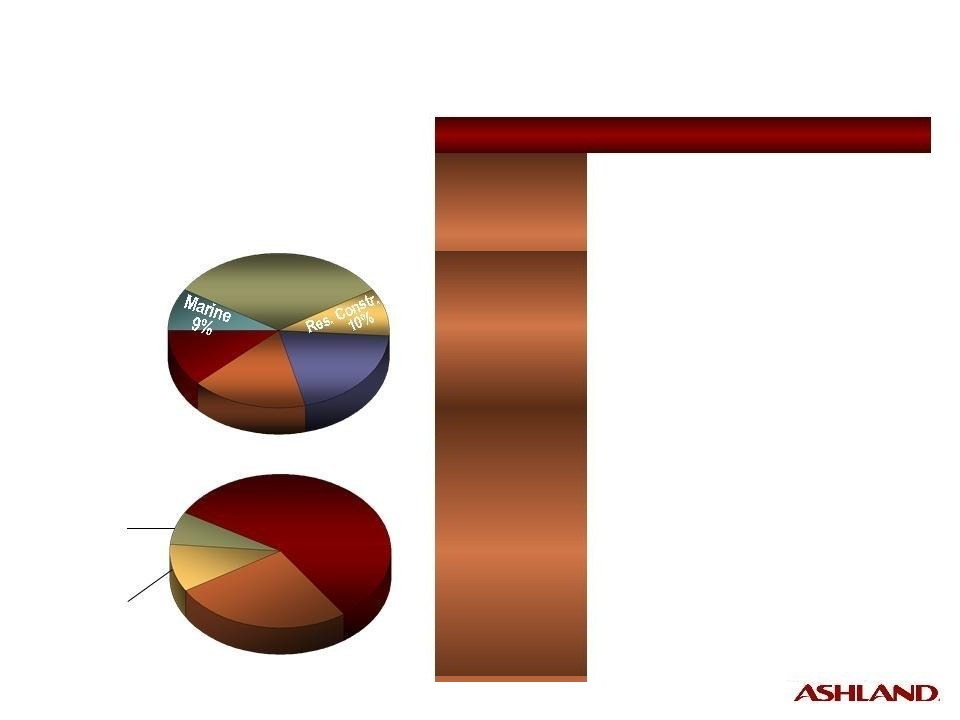
Sales
by Geography
by Geography
Sales
by Market
by Market
For
the Fiscal Year Ended Sept. 30, 2009
Adjusted
Sales: $0.9 billion
Adjusted
EBITDA: $203 million
Adjusted
EBITDA Margin: 22.0%
|
Business
Overview
|
|
|
Customers
|
• Diversified,
global customer base
|
|
Products
|
• Broad
product line based
on renewable resources - Water-soluble
polymers
(cellulose ethers and guar derivatives) |
|
Markets
|
• Water-based
paints
• Paper
coatings
• Construction
• Oilfield
(chemicals
and drilling muds)
• Regulated
markets
- Personal
care
- Food
- Pharmaceuticals
|
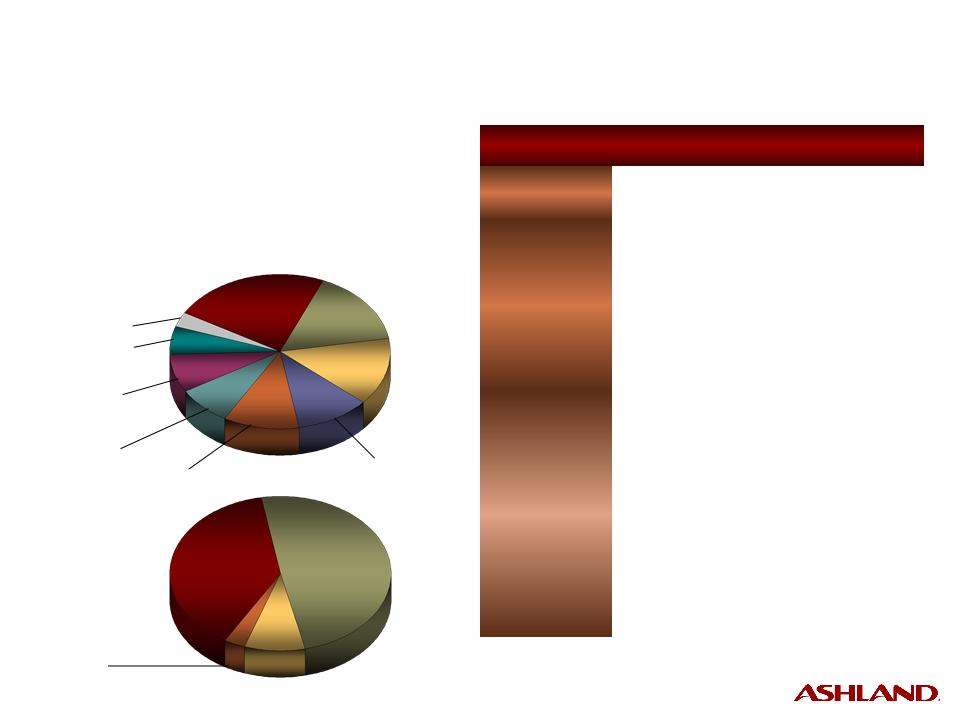
Sales
by Product
by Product
CMC
16%
16%
CMC
16%
16%
HEC
29%
29%
HEC
29%
29%
MC
19%
19%
MC
19%
19%
Guar
9%
9%
Guar
9%
9%
Other
14%
14%
Other
14%
14%
Stumpwood
Derivatives
Derivatives
Construction
20%
20%
Construction
20%
20%
Klucel®
6%
6%
North
America
America
North
America
America
46%
46%
Asia
Pacific
Pacific
Asia
Pacific
Pacific
12%
12%
Europe
35%
Latin
America/
Other
- 7%
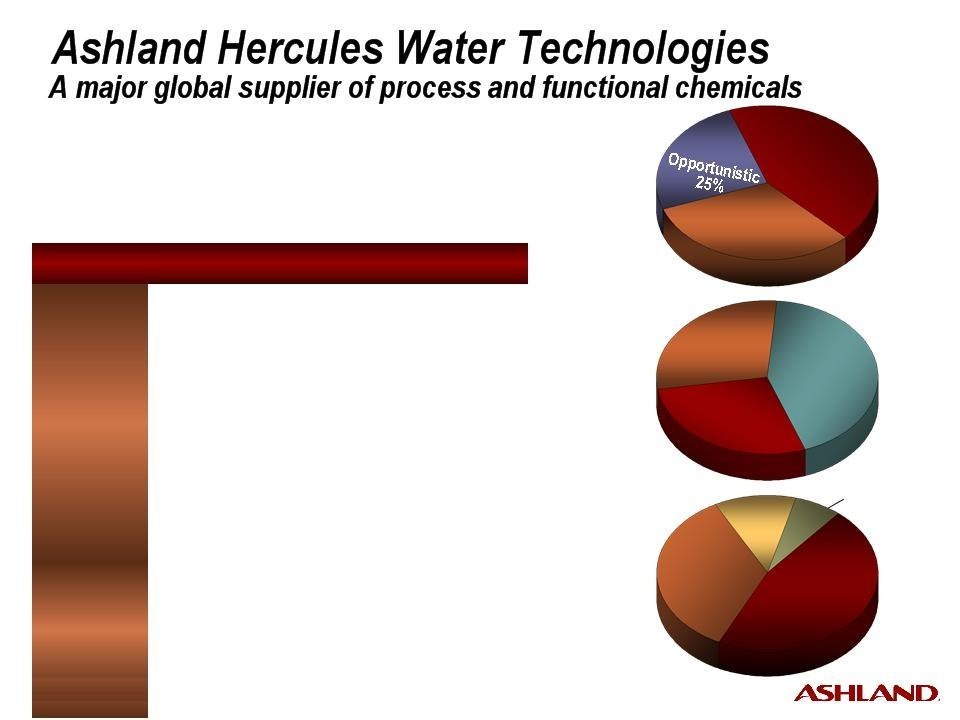
Growth
43%
43%
Growth
43%
43%
Base
32%
32%
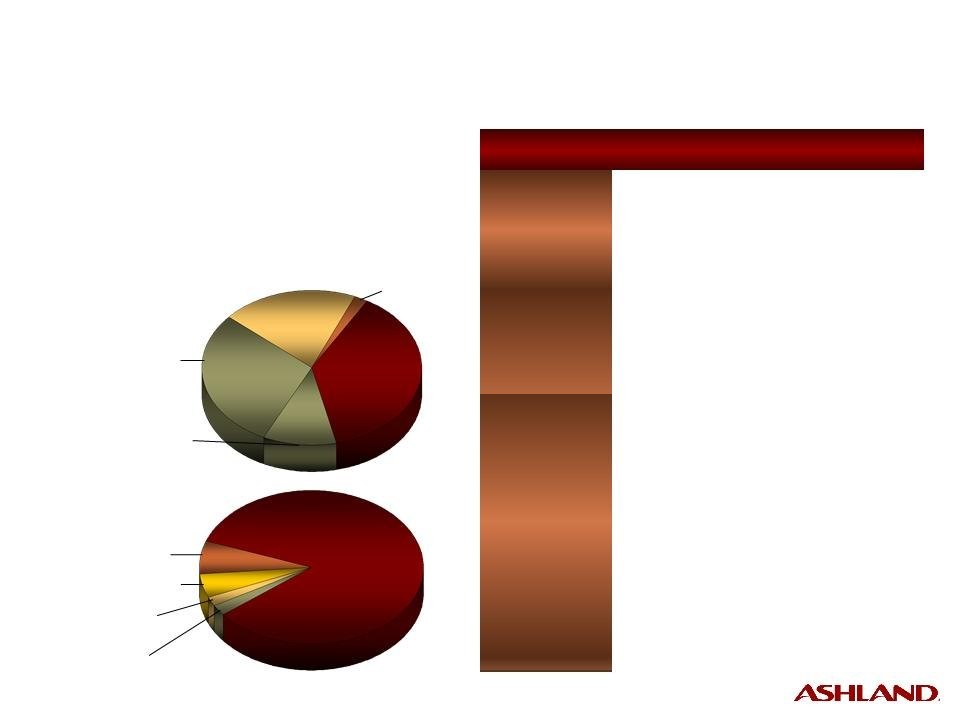
Sales
by Geography
by Geography
Sales
by Market
by Market
For
the Fiscal Year Ended Sept. 30, 2009
Adjusted
Sales: $1.8 billion
Adjusted
EBITDA: $198 million
Adjusted
EBITDA Margin: 11.0%
Sales
by Product
by Product
Process
28%
28%
Process
28%
28%
Utility
29%
29%
Utility
29%
29%
Functional
43%
43%
Functional
43%
43%
|
Business
Overview
|
|
|
Customers/
Markets |
• Growth
- Commercial
and
-
Packaging
institutional
-
Pulp
- Food
and beverage
-
Tissue/towel
- Mining
• Base
- Chemicals
- General
manufacturing
- Printing
and writing
• Opportunistic
- Lubricants
-
Marine*/Other
- Municipal * Divested 08/31/09
|
|
Products/
Services |
• Process
chemicals: microbial and
contaminant control, pulping aids, retention aids and defoamers • Utility
water treatments
• Functional
chemicals: sizing/wet
strength
|
Pkg.
&
Converting
20%
20%
North
America
America
North
America
America
57%
57%
Europe
26%
Latin
America/
Other - 7%
America/
Other - 7%
Trans-
portation
portation
Trans-
portation
portation
17%
17%
Ind.
Constr.
Constr.
32%
|
Business
Overview
|
|
|
Customers
|
• Auto
manufacturers; foundries; pipe
and tank fabricators; packaging and converting; bathware, countertop and window lineal manufacturers; pipe relining contractors; boat builders; wide and narrow web printers |
|
Products/
Services |
• Composites
and Adhesives
- Unsaturated
polyester resins
- Vinyl
ester resins
- Gelcoats
- Pressure-sensitive
adhesives
- Structural
adhesives
- Specialty
resins
• Casting
Solutions
- Foundry
binder resins
- Chemicals
- Sleeves
and filters
- Design
services
|
|
Markets
|
• Construction,
packaging and con-
verting, transportation, and marine |
Sales
by Geography
by Geography
Sales
by Market
by Market
For
the Fiscal Year Ended Sept. 30, 2009
Sales:
$1.1 billion
Adjusted
EBITDA: $76 million
Adjusted
EBITDA Margin: 6.9%
Infrastructure
12%
12%
Asia
Pacific - 10%
Ashland
Performance Materials
A global leader in specialty chemicals
A global leader in specialty chemicals
Lubricants
84%
Filters
- 2%
Valvoline
Int'l
20%
Int'l
20%
Valvoline
Int'l
20%
Int'l
20%
Do-It-
Yourself
Yourself
38%
|
Business
Overview
|
|
|
Customers
|
• Retail auto parts stores and
mass merchandisers who sell to consumers; installers, such as car dealers and quick lubes; distributors |
|
Products/
Services |
• Valvoline® lubricants and
automotive chemicals • MaxLife® lubricants
for high-mileage vehicles • SynPower® synthetic motor oil
• Eagle One® and Car Brite®
appearance products • Zerex® antifreeze
• Valvoline Instant Oil Change®
service |
|
Market
Channels |
• Do-It-Yourself
(DIY)
• Do-It-For-Me
(DIFM)
• Valvoline
International
|
Sales
by Product Line
by Product Line
Sales
by Market Channel
by Market Channel
Do-It-
For-Me
40%
For-Me
40%
DIFM:
Installer channel
29%
Installer channel
29%
Specialty/
Other - 2%
Other - 2%
DIFM:
Valvoline Instant
Oil Change - 11%
Valvoline Instant
Oil Change - 11%
Antifreeze
- 5%
Appearance
products - 2%
products - 2%
Chemicals
- 7%
For
the Fiscal Year Ended Sept. 30, 2009
Sales:
$1.7
billion
Adjusted
EBITDA: $288 million
Adjusted
EBITDA Margin: 17.5%
Ashland
Consumer Markets: A
leading worldwide
marketer of premium-branded automotive lubricants and chemicals
marketer of premium-branded automotive lubricants and chemicals
Chemicals
Chemicals
49%
49%
Plastics
39%
Environmental
Services/Other
- 3%
Services/Other
- 3%
Construction
Construction
23%
23%
Other
16%
|
Business
Overview
|
|
|
Customers
|
• Diversified
customer base
in North America and Europe |
|
Products/
Services |
• More
than 28,000 packaged and
bulk chemicals, solvents, plastics and additives • Comprehensive,
hazardous
and nonhazardous waste- management solutions in North America |
|
Markets
|
• Construction
• Transportation
• Chemical
manufacturing
• Paint
and coatings
• Retail
consumer
• Personal
care
• Medical
• Marine
|
Sales
by Product
Line
by Product
Line
Sales
by Market
by Market
Trans-
portation
portation
14%
Paint
& Coatings - 11%
Medical
- 6%
Marine
- 3%
Com-
posites
posites
9%
Chemical
Mfg.
- 11%
- 11%
Retail
Consumer - 8%
Consumer - 8%
Personal
Care - 8%
Care - 8%
For
the Fiscal Year Ended Sept. 30, 2009
Sales:
$3.0 billion
Adjusted
EBITDA: $84 million
Adjusted
EBITDA Margin: 2.8%
Ashland
Distribution
A leading North American chemicals and plastics distributor
A leading North American chemicals and plastics distributor

Regulation
G: Adjusted EBITDA
The
information presented herein regarding adjusted pro forma results does not
conform to generally
accepted accounting principles (GAAP) and should not be construed as an alternative to the reported
results determined in accordance with GAAP. Management has included this non-GAAP information
to assist in understanding the operating performance of the company and its segments. The non-
GAAP information provided may not be consistent with the methodologies used by other companies.
All non-GAAP information related to previous Ashland filings has been reconciled with reported
GAAP results. Certain prior period adjusted pro forma results could not be reconciled to previous
GAAP statements filed by Ashland since it relied upon pro forma information from Hercules
Incorporated ("Hercules").
The
unaudited adjusted pro forma results are presented for informational purposes
only and do not
reflect future events that may occur or any operating efficiencies or inefficiencies that may result
from the acquisition of Hercules. Certain significant and identifiable cost allocation, reporting and
accounting policy differences have been reflected in these adjusted pro forma results. However,
these adjusted pro forma results do not purport to identify all these differences. Therefore, the
unaudited adjusted pro forma results are not necessarily indicative of results that would have been
achieved had the businesses been combined during the period presented or the results that Ashland
will experience in the future. In addition, the preparation of financial statements in conformity with
GAAP requires management to make certain estimates and assumptions. These estimates and
assumptions affect the reported amounts of assets and liabilities and disclosure of contingent assets
and liabilities at the date of the financial statements and the reported amounts of sales and expenses
during the reporting period. These estimates and assumptions can be significantly different
depending on changes to conform to Ashland policy.
Ashland
Inc. and Consolidated Subsidiaries
Reconciliation
of Fiscal Year 2009 Non-GAAP Data
($ millions, except percentages)
|
Ashland
Aqualon Functional Ingredients
|
Ashland
FY 2009
GAAP
Results
|
Pre-Acquisition
Period:
Hercules
Oct.
1 - Nov. 13, 2008
|
Key
Items
|
Adjusted
|
||||||||||||
|
Sales
|
812 | 112 | 924 | |||||||||||||
|
Cost
of sales
|
595 | 77 | (30 | ) | 642 | |||||||||||
|
Selling,
general and administrative expenses (includes R&D)
|
181 | 20 | (15 | ) | 186 | |||||||||||
|
Equity
and other income
|
- | - | - | - | ||||||||||||
|
Operating
income
|
36 | 15 | 45 | 96 | ||||||||||||
|
Operating
income as a percent of sales
|
4.4 | % | 13.4 | % | 10.4 | % | ||||||||||
|
Gross
profit as a percent of sales
|
26.7 | % | 31.3 | % | 30.5 | % | ||||||||||
|
D&A
|
106 | 6 | (5 | ) | 107 | |||||||||||
|
EBITDA
|
142 | 21 | 40 | 203 | ||||||||||||
|
EBITDA
as a percent of sales
|
17.5 | % | 18.8 | % | 22.0 | % | ||||||||||
|
Ashland
Hercules Water Technologies
|
Ashland
FY 2009
GAAP
Results
|
Pre-Acquisition
Period:
Hercules
Oct.
1 - Nov. 13, 2008
|
Key
Items
|
Adjusted
|
||||||||||||
|
Sales
|
1,652 | 155 | 1,807 | |||||||||||||
|
Cost
of sales
|
1,092 | 116 | (7 | ) | 1,201 | |||||||||||
|
Selling,
general and administrative expenses (includes R&D)
|
484 | 34 | (9 | ) | 509 | |||||||||||
|
Equity
and other income
|
2 | - | - | 2 | ||||||||||||
|
Operating
income
|
78 | 5 | 16 | 99 | ||||||||||||
|
Operating
income as a percent of sales
|
4.7 | % | 3.2 | % | 5.5 | % | ||||||||||
|
Gross
profit as a percent of sales
|
33.9 | % | 25.2 | % | 33.5 | % | ||||||||||
|
D&A
|
99 | 5 | (5 | ) | 99 | |||||||||||
|
EBITDA
|
177 | 10 | 11 | 198 | ||||||||||||
|
EBITDA
as a percent of sales
|
10.7 | % | 6.5 | % | 11.0 | % | ||||||||||
(continued
next page)

Ashland
Inc. and Consolidated Subsidiaries
Reconciliation of Fiscal Year
2009 Non-GAAP Data (cont. from prior
page)
($ millions, except percentages)
|
Ashland
Performance Materials
|
Ashland
FY 2009
GAAP
Results
|
Pre-Acquisition
Period:
Hercules
Oct.
1 - Nov. 13, 2008
|
Key
Items
|
Adjusted
|
||||||||||||
|
Sales
|
1,106 | 1,106 | ||||||||||||||
|
Cost
of sales
|
918 | (17 | ) | 901 | ||||||||||||
|
Selling,
general and administrative expenses (includes R&D)
|
199 | (6 | ) | 193 | ||||||||||||
|
Equity
and other income
|
12 | 3 | 15 | |||||||||||||
|
Operating
income
|
1 | 26 | 27 | |||||||||||||
|
Operating
income as a percent of sales
|
0.1 | % | 2.4 | % | ||||||||||||
|
Gross
profit as a percent of sales
|
17.0 | % | 18.5 | % | ||||||||||||
|
D&A
|
63 | (14 | ) | 49 | ||||||||||||
|
EBITDA
|
64 | 12 | 76 | |||||||||||||
|
EBITDA
as a percent of sales
|
5.8 | % | 6.9 | % | ||||||||||||
|
Ashland
Consumer Markets
|
Ashland
FY 2009
GAAP
Results
|
Pre-Acquisition
Period:
Hercules
Oct.
1 - Nov. 13, 2008
|
Key
Items
|
Adjusted
|
||||||||||||
|
Sales
|
1,650 | 1,650 | ||||||||||||||
|
Cost
of sales
|
1,122 | - | 1,122 | |||||||||||||
|
Selling,
general and administrative expenses (includes R&D)
|
292 | - | 292 | |||||||||||||
|
Equity
and other income
|
16 | - | 16 | |||||||||||||
|
Operating
income
|
252 | - | 252 | |||||||||||||
|
Operating
income as a percent of sales
|
15.3 | % | 15.3 | % | ||||||||||||
|
Gross
profit as a percent of sales
|
32.0 | % | 32.0 | % | ||||||||||||
|
D&A
|
36 | - | 36 | |||||||||||||
|
EBITDA
|
288 | - | 288 | |||||||||||||
|
EBITDA
as a percent of sales
|
17.5 | % | 17.5 | % | ||||||||||||
(continued
next page)
Ashland
Inc. and Consolidated Subsidiaries
Reconciliation of Fiscal Year
2009 Non-GAAP Data (cont. from prior
page)
($ millions, except percentages)
|
Ashland
Distribution
|
Ashland
FY 2009
GAAP
Results
|
Pre-Acquisition
Period:
Hercules
Oct.
1 - Nov. 13, 2008
|
Key
Items
|
Adjusted
|
||||||||||||
|
Sales
|
3,020 | 3,020 | ||||||||||||||
|
Cost
of sales
|
2,719 | - | 2,719 | |||||||||||||
|
Selling,
general and administrative expenses (includes R&D)
|
253 | (4 | ) | 249 | ||||||||||||
|
Equity
and other income
|
4 | - | 4 | |||||||||||||
|
Operating
income
|
52 | 4 | 56 | |||||||||||||
|
Operating
income as a percent of sales
|
1.7 | % | 1.9 | % | ||||||||||||
|
Gross
profit as a percent of sales
|
10.0 | % | 10.0 | % | ||||||||||||
|
D&A
|
28 | - | 28 | |||||||||||||
|
EBITDA
|
80 | 4 | 84 | |||||||||||||
|
EBITDA
as a percent of sales
|
2.6 | % | 2.8 | % | ||||||||||||
|
Intersegment
Sales/Unallocated and Other
|
Ashland
FY 2009
GAAP
Results
|
Pre-Acquisition
Period:
Hercules
Oct.
1 - Nov. 13, 2008
|
Key
Items
|
Adjusted
|
||||||||||||
|
Sales
|
(134 | ) | (134 | ) | ||||||||||||
|
Cost
of sales
|
(129 | ) | (2 | ) | (131 | ) | ||||||||||
|
Selling,
general and administrative expenses (includes R&D)
|
28 | (25 | ) | 3 | ||||||||||||
|
Equity
and other income
|
4 | 4 | - | 8 | ||||||||||||
|
Operating
income
|
(29 | ) | 4 | 27 | 2 | |||||||||||
|
D&A
|
7 | (4 | ) | 3 | ||||||||||||
|
EBITDA
|
(22 | ) | 4 | 23 | 5 | |||||||||||
|
Ashland
Consolidated
|
Ashland
FY 2009
GAAP
Results
|
Pre-Acquisition
Period:
Hercules
Oct.
1 - Nov. 13, 2008
|
Key
Items
|
Adjusted
|
||||||||||||
|
Sales
|
8,106
|
|
267 | - |
8,373
|
|
||||||||||
|
Cost
of sales
|
6,317
|
|
193 |
(56
|
)
|
6,454
|
|
|||||||||
|
Selling,
general and administrative expenses (includes R&D)
|
1,437
|
54 |
(59
|
)
|
1,432
|
|||||||||||
|
Equity
and other income
|
38
|
4
|
3
|
45
|
||||||||||||
|
Operating
income
|
390
|
|
24
|
118
|
532
|
|||||||||||
|
Operating
income as a percent of sales
|
4.8 | % | 9.0 | % | 6.4 | % | ||||||||||
|
Gross
profit as a percent of sales
|
22.1 | % | 27.7 | % | 22.9 | % | ||||||||||
|
D&A
|
339
|
11 |
(28
|
)
|
322
|
|||||||||||
|
EBITDA
|
729
|
|
35
|
90
|
854
|
|||||||||||
|
EBITDA as a percent of
sales
|
9.0 | % | 13.1 | % | 10.2 | % | ||||||||||