Attached files
| file | filename |
|---|---|
| 8-K - FORM 8-K - Black Knight InfoServ, LLC | g22037e8vk.htm |
| EX-99.1 - EX-99.1 - Black Knight InfoServ, LLC | g22037exv99w1.htm |
Exhibit 99.2

| Lender Processing Services Fourth Quarter 2009 Supplemental Materials Lender Processing Services |
| Forward-Looking Statements Lender Processing Services 1 |

| Use of Non-GAAP Measures Lender Processing Services 2 Generally Accepted Accounting Principles (GAAP) is the term used to refer to the standard framework of guidelines for financial accounting. GAAP includes the standards, conventions, and rules accountants follow in recording and summarizing transactions, and in the preparation of financial statements. In addition to reporting financial results in accordance with GAAP, LPS reports several non-GAAP measures, including "adjusted net earnings" (GAAP net earnings adjusted for the impact of certain non-recurring adjustments, if applicable, plus the after-tax purchase price amortization of intangible assets added through acquisitions), "adjusted net earnings per diluted share" (adjusted net earnings divided by diluted weighted average shares), "pro forma adjusted net earnings" (adjusted net earnings less pro forma interest expense on our debt facilities for the first six months of 2008 as if such facilities had been outstanding as of January 1, 2008), "pro forma adjusted net earnings per diluted share" (pro forma adjusted net earnings divided by diluted weighted average shares), "adjusted free cash flow" (net cash provided by operating activities less additions to property, equipment and computer software, as well as non-recurring adjustments, if applicable), and "pro forma adjusted free cash flow" (adjusted free cash flow less pro forma interest expense on our debt facilities for the first six months of 2008 as if such facilities had been outstanding as of January 1, 2008). LPS provides these measures because it believes that they are helpful to investors in comparing year-over-year performance in light of our 2008 spin-off from Fidelity National Information Services, Inc. (FIS), and to better understand our financial performance, competitive position and future prospects. Non-GAAP measures should be considered in conjunction with the GAAP financial presentation and should not be considered in isolation or as a substitute for GAAP net earnings. A reconciliation of these non-GAAP measures to related GAAP measures is included in the 4Q09 earnings release. |
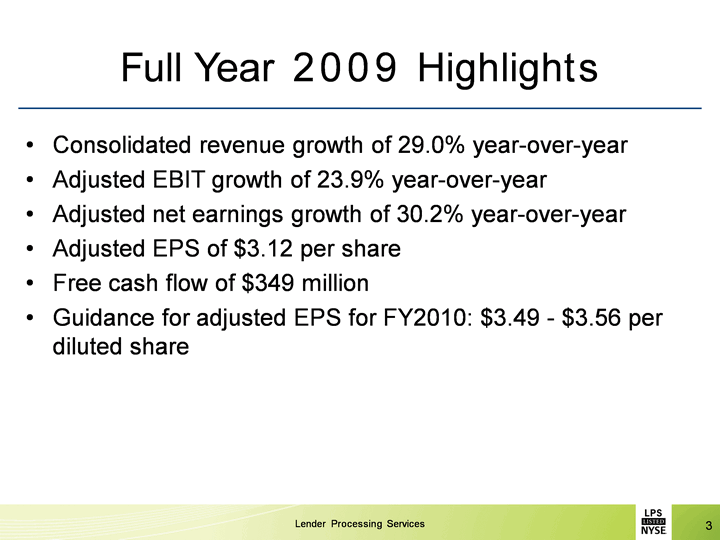
| Lender Processing Services Full Year 2009 Highlights Consolidated revenue growth of 29.0% year-over-yearAdjusted EBIT growth of 23.9% year-over-yearAdjusted net earnings growth of 30.2% year-over-yearAdjusted EPS of $3.12 per shareFree cash flow of $349 millionGuidance for adjusted EPS for FY2010: $3.49 - $3.56 per diluted share 3 |
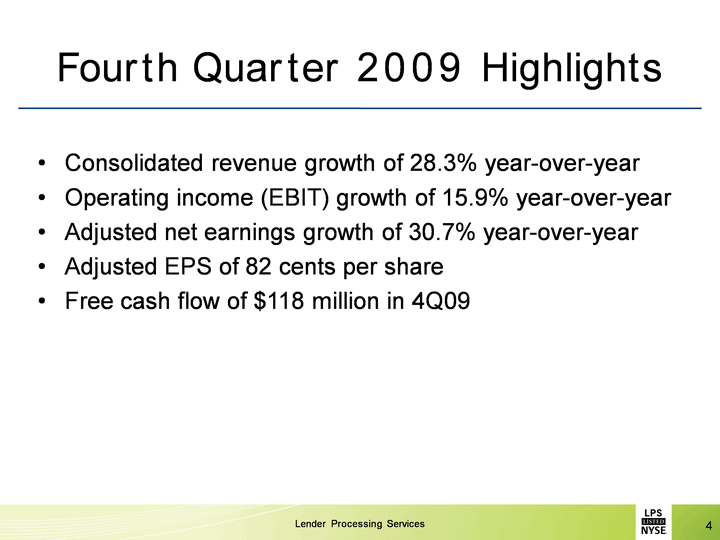
| Lender Processing Services Fourth Quarter 2009 Highlights Consolidated revenue growth of 28.3% year-over-yearOperating income (EBIT) growth of 15.9% year-over-yearAdjusted net earnings growth of 30.7% year-over-yearAdjusted EPS of 82 cents per shareFree cash flow of $118 million in 4Q09 4 |

| Core Market Revenue Opportunity of $15+B in 2010 LPS Core Market Revenue Opportunity Lender Processing Services Source: company and industry estimates ($ billions) 2009 2010 2011 2009 2010 2011 $7.0 $10.0 $7.0 5 |
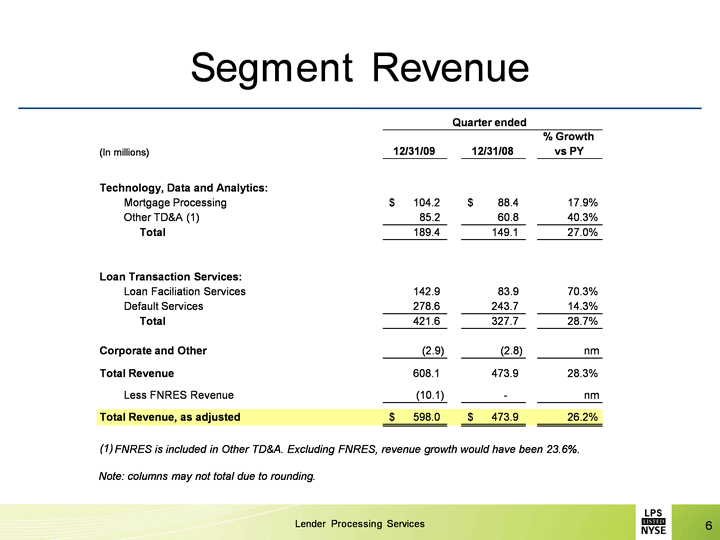
| Segment Revenue Lender Processing Services (In millions) 12/31/09 12/31/08 % Growth vs PY Technology, Data and Analytics: Mortgage Processing 104.2 $ 88.4 $ 17.9% Other TD&A (1) 85.2 60.8 40.3% Total 189.4 149.1 27.0% Loan Transaction Services: Loan Faciliation Services 142.9 83.9 70.3% Default Services 278.6 243.7 14.3% Total 421.6 327.7 28.7% Corporate and Other (2.9) (2.8) nm Total Revenue 608.1 473.9 28.3% Less FNRES Revenue (10.1) - nm Total Revenue, as adjusted 598.0 $ 473.9 $ 26.2% (1) FNRES is included in Other TD&A. Excluding FNRES, revenue growth would have been 23.6%. Note: columns may not total due to rounding. Quarter ended 6 |

| Segment EBIT Lender Processing Services % Growth 12/31/09 12/31/08 (In millions) 12/31/09 12/31/08 vs PY Margin % Margin % Technology, Data and Analytics (1) 63.5 $ 53.5 $ 18.6% 33.5% 35.9% Loan Transaction Services 97.2 84.1 15.5% 23.0% 25.7% Corporate and Other (19.8) (16.1) nm nm nm Total EBIT 140.9 121.6 15.9% 23.2% 25.6% Less: FNRES EBIT (0.1) Total EBIT, as adjusted (2) 140.8 $ 121.6 $ 15.9% 23.6% 25.6% (1) Excluding the impact of FNRES, the TD&A Q4-2009 EBIT margin would have been 35.4% (2) EBIT margin, as adjusted excludes the impact of FNRES revenue in Q4-2009 ($10.1m) Note: columns may not total due to rounding. Quarter ended 7 |

| Growth Analysis Lender Processing Services (In millions) 2009 2008 2009 2008 2009 2008 Results 608.1 $ 473.9 $ 140.9 $ 121.6 $ 74.9 $ 54.1 $ Purchase Amortization - - - - 4.7 6.8 Adjusted Results 608.1 473.9 140.9 121.6 79.6 60.9 Other Items: Impact of FNRES acquisition (10.1) - (0.1) - (0.0) - Adjusted Results After Other Items 598.0 $ 473.9 $ 140.8 $ 121.6 $ 79.6 $ 60.9 $ Growth Rate 26.2% 15.9% 30.7% Note: columns may not total due to rounding. Revenue EBIT Adjusted Earnings Quarter ended December 31 8 |
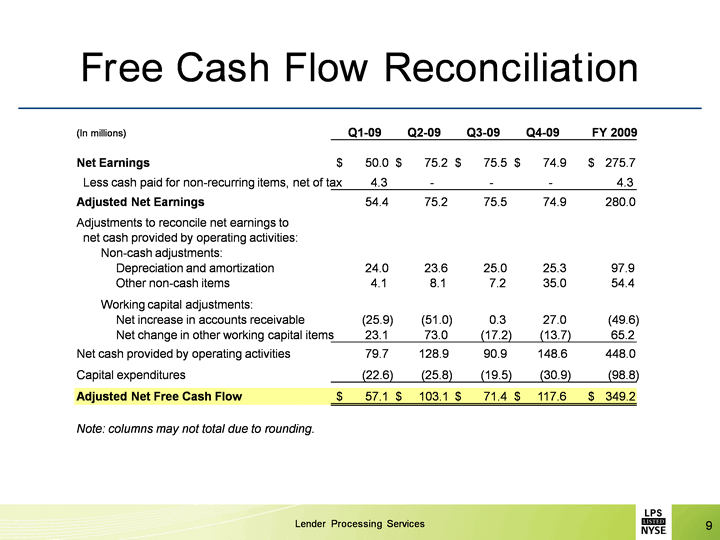
| Free Cash Flow Reconciliation Lender Processing Services 9 (In millions) Q1-09 Q2-09 Q3-09 Q4-09 FY 2009 Net Earnings 50.0 $ 75.2 $ 75.5 $ 74.9 $ 275.7 $ Less cash paid for non-recurring items, net of tax 4.3 - - - 4.3 Adjusted Net Earnings 54.4 75.2 75.5 74.9 280.0 Adjustments to reconcile net earnings to net cash provided by operating activities: Non-cash adjustments: Depreciation and amortization 24.0 23.6 25.0 25.3 97.9 Other non-cash items 4.1 8.1 7.2 35.0 54.4 Working capital adjustments: Net increase in accounts receivable (25.9) (51.0) 0.3 27.0 (49.6) Net change in other working capital items 23.1 73.0 (17.2) (13.7) 65.2 Net cash provided by operating activities 79.7 128.9 90.9 148.6 448.0 Capital expenditures (22.6) (25.8) (19.5) (30.9) (98.8) Adjusted Net Free Cash Flow 57.1 $ 103.1 $ 71.4 $ 117.6 $ 349.2 $ Note: columns may not total due to rounding. |

| Lender Processing Services 2010 Guidance 10 |
