Attached files
| file | filename |
|---|---|
| 8-K - HERITAGE FINANCIAL GROUP 8-K - Heritage Financial Group | a6170102.htm |
Exhibit
99

THERE FOR YOU THEN, HERE FOR YOU NOW.
CAUTIONARY STATEMENT This presentation contains forward-looking statements about future
financial performance, business plans and strategies of Heritage Financial
Group. Because forward-looking statements involve risks and
uncertainties, actual results may differ materially from those expressed or
implied. Investors are cautioned not to place undue reliance on these
forward-looking statements and are advised to carefully review the discussion of
forward-looking statements and risk factors in documents that the Company files
with the Securities and Exchange Commission, including the Company’s most recent
Annual Report on Form 10-K and Quarterly Report on Form
10-Q.
HISTORICAL HIGHLIGHTS Began operations in 1955 as AGE Federal
Credit Union Converted to a savings bank in 2001 Took a different route to
expansion into commercial banking by hiring seasoned bankers who have an average
of 28 years experience Completed First-Step common stock offering in June 2005,
selling 30% to the public
ABOUT THE COMPANY A lending leader in its home market of Albany,
Georgia, with a strong commercial focus Significant internal funding through
core deposits Expanded to Florida in mid-2006 with a de novo branch in Ocala;
subsequently opened a second office there Invested $1 million in North Georgia
de novoStrong capital base with 17% total risk-based capital
HBOS IS NOT THE TYPICAL MHC Most MHCs’ lending portfolios are
heavily weighted toward single family real estateMany have had unsuccessful,
even disastrous forays into commercial lending HeritageBank of the South has
greater lending balance, with almost 57% of its loan portfolio invested in
commercial-related loans HeritageBank of the South has a significant retail
presence, providing ample funding for loan growth HeritageBank of the South has
a substantial and growing source of non-interest income with its in-house
brokerage business, which has more than $126 million in assets under management
HeritageBank of the South is a state-chartered savings bank, which provides
greater flexibility; HBOS is OTS-regulated

ACQUISITION UPDATE In December 2009, acquired branch office in Lake City, FloridaOpened
a second market in FloridaHelped in-fill the footprint between Albany and
OcalaAdded $10 million in loans and $41 million in
deposits
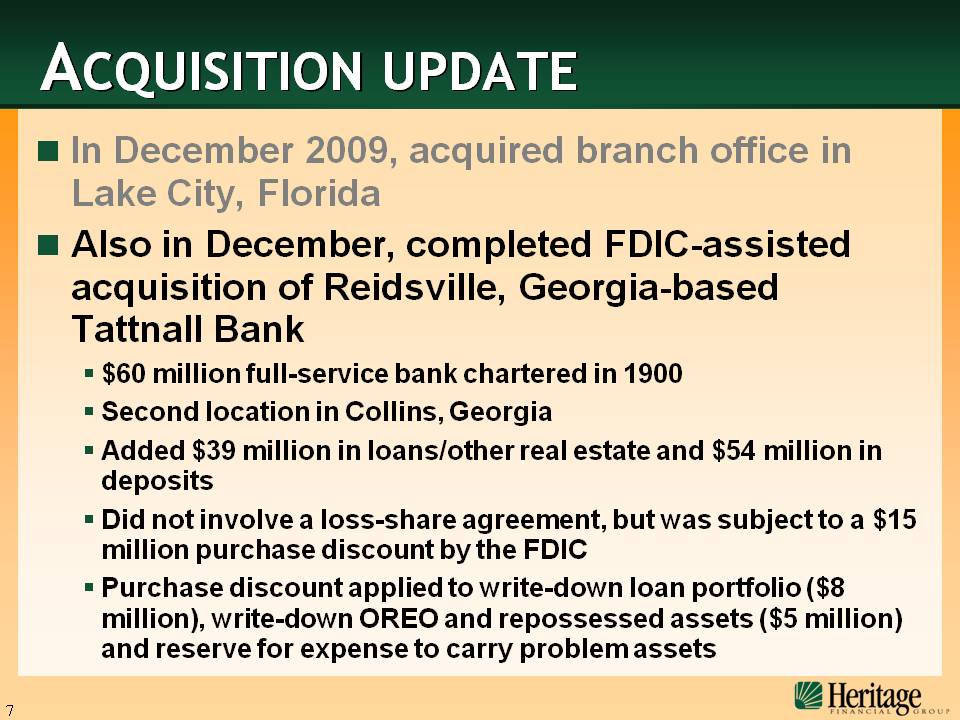
ACQUISITION UPDATE In December 2009, acquired branch office in Lake
City, Florida Also in December, completed FDIC-assisted acquisition of
Reidsville, Georgia-based Tattnall Bank $60 million full-service bank chartered
in 1900Second location in Collins, Georgia Added $39 million in loans/other real
estate and $54 million in deposits Did not involve a loss-share agreement, but
was subject to a $15 million purchase discount by the FDIC Purchase discount
applied to write-down loan portfolio ($8 million), write-down OREO and
repossessed assets ($5 million) and reserve for expense to carry problem
assets
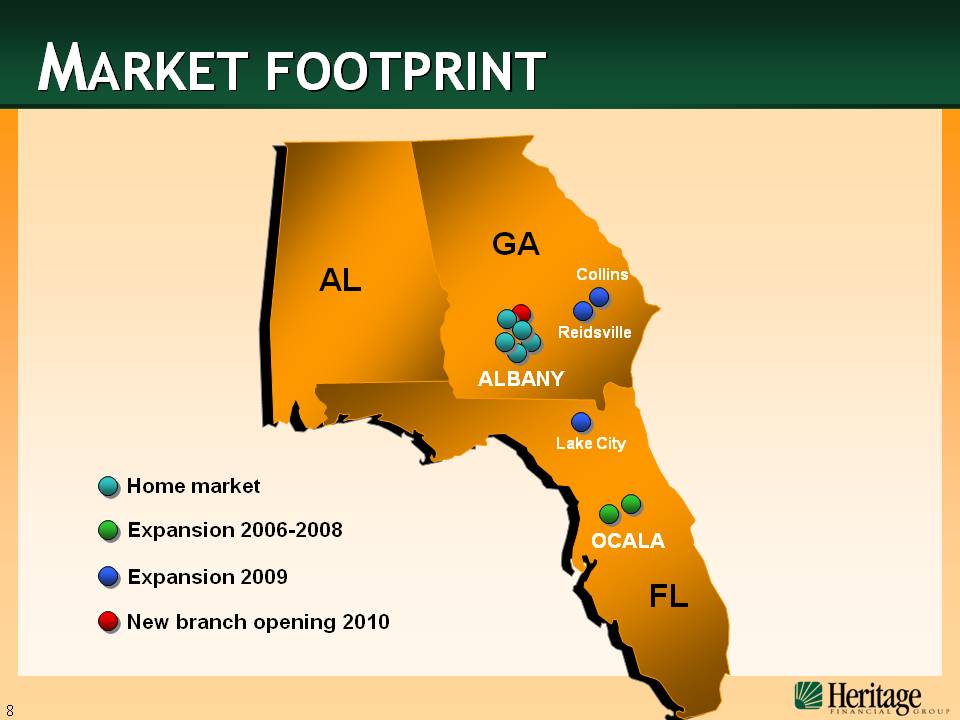
MARKET FOOTPRINT AL GA FL ALBANY OCALA Reidsville Collins Lake City Home market Expansion 2006-2008 Expansion 2009 New branch opening 2010

2007 2008 2009 2006 2005 $305 $302 $337 $254 $277 LOAN PORTFOLIO TRENDS (In millions)
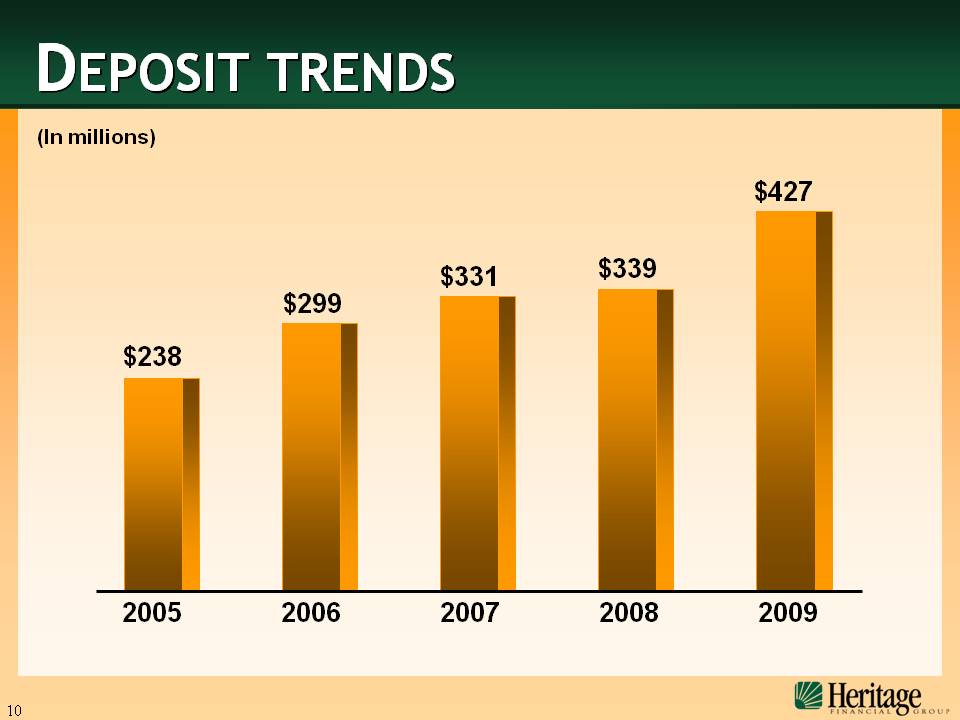
$427 $238 $299 $331 $339 DEPOSIT TRENDS (In millions) 2007 2008 2009 2006 2005
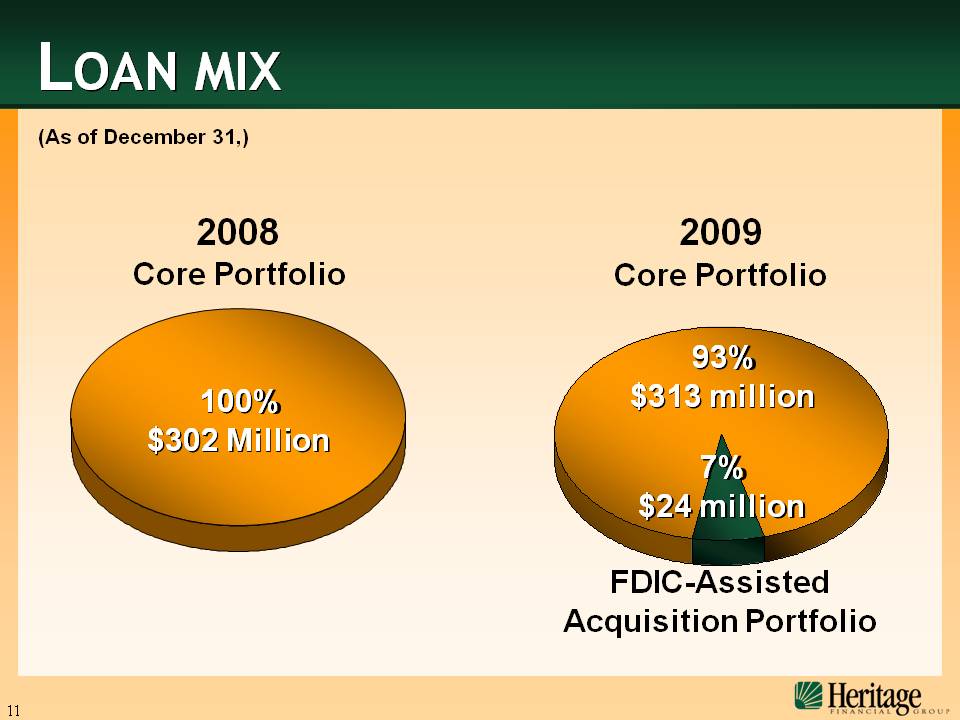
LOAN MIX 2008 2009 FDIC-Assisted Acquisition Portfolio 93%$313 million 7% $24 million 100% $302 Million (As of December 31,) Core Portfolio Core Portfolio
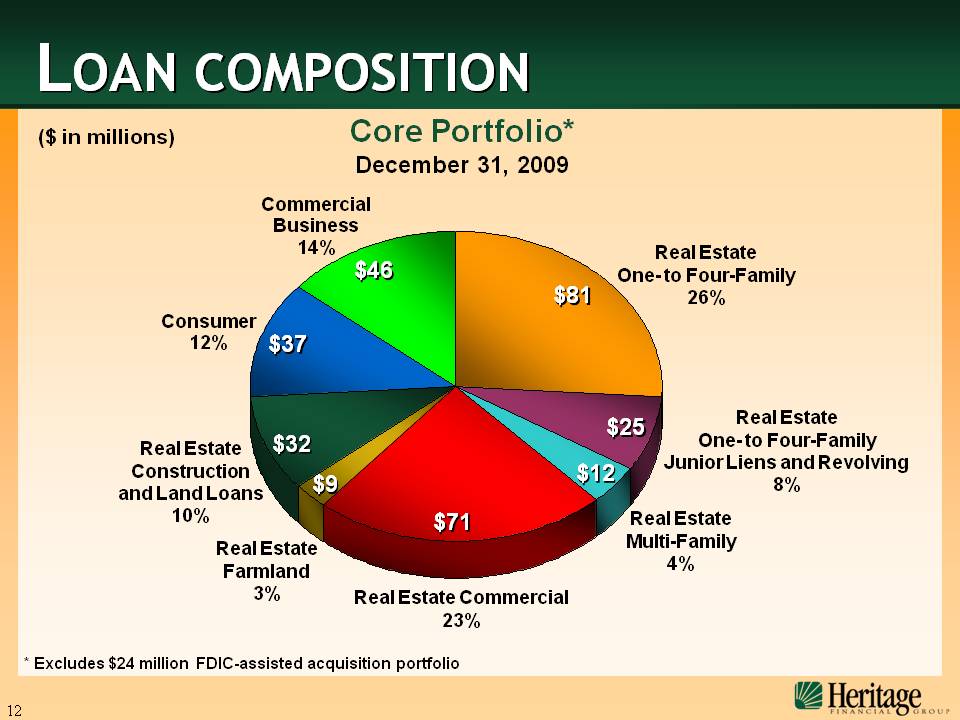
LOAN COMPOSITION Commercial Business
14% Consumer 12% Real Estate One- to Four-Family
26% Real Estate Commercial 23% Real Estate Multi-Family
4% Real Estate Farmland 3% Real Estate Construction
and Land Loans
10% $81 $12 $71 $9 $32 $37 $46 ($
in millions) Real Estate One- to Four-Family Junior Liens and
Revolving8% $25 * Excludes $24 million FDIC-assisted
acquisition portfolio Core Portfolio* December 31,
2009
KEY GROWTH STRATEGIES Maintain strong presence in our Albany
marketExpand and grow in our Ocala market
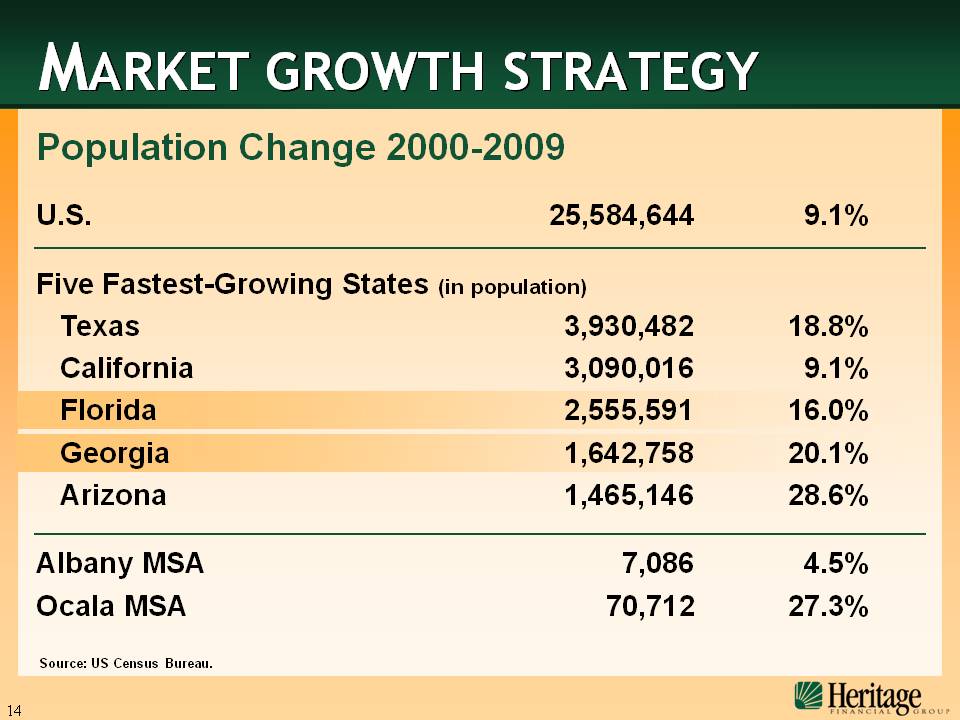
Source: US Census Bureau. Population Change 2000-2009 MARKET GROWTH
STRATEGY U.S. 25,584,644 9.1% Five Fastest-Growing States (in population)
Texas 3,930,482 18.8% California 3,090,016 9.1%
Florida 2,555,591 16.0% Georgia 1,642,758 20.1%
Arizona 1,465,146 28.6% Albany MSA 7,086 4.5% Ocala MSA 70,712
27.3%
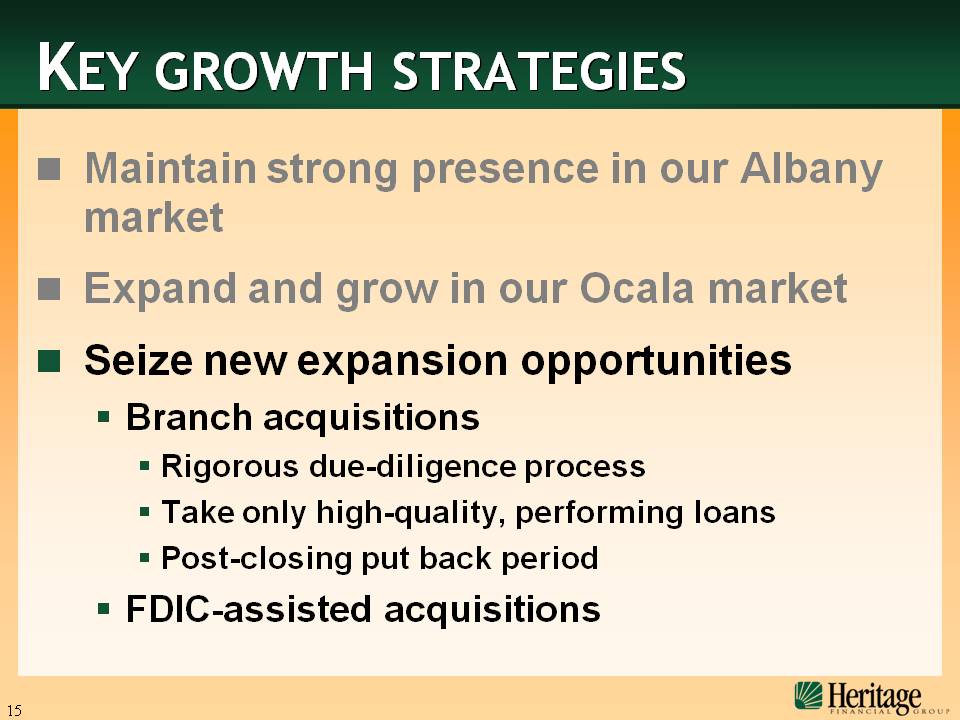
KEY GROWTH STRATEGIES Maintain strong presence in our Albany market
Expand and grow in our Ocala marketSeize new expansion opportunities Branch
acquisitions Rigorous due-diligence process Take only high-quality, performing
loansPost-closing put back period FDIC-assisted acquisitions

KEY GROWTH STRATEGIES Maintain strong presence in our Albany market
Expand and grow in our Ocala market Seize new expansion opportunities Leverage
our capabilities in commercial lending Commercial business loan portfolio has
grown at CGR of 17% over last five years
KEY GROWTH STRATEGIES Maintain strong presence in our Albany market
Expand and grow in our Ocala market Seize new expansion opportunities Leverage
our capabilities in commercial and consumer lending Focus on controlling
overhead and increasing operational efficiencies

FINANCIAL REVIEW
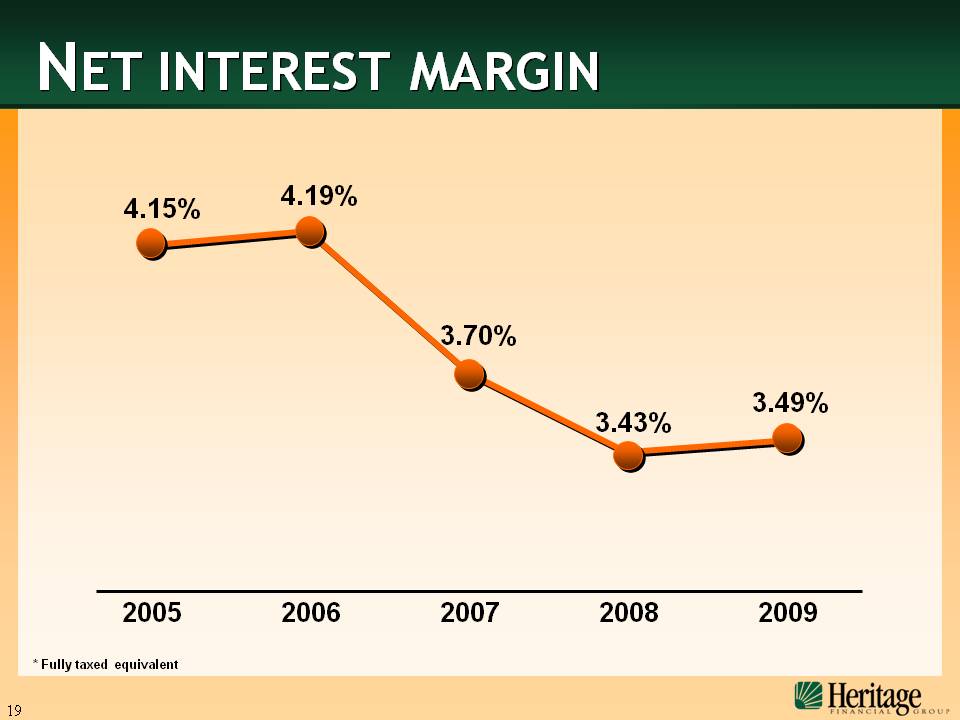
NET INTEREST
MARGIN 3.43% 3.49% 4.15% 4.19% 3.70% *
Fully taxed
equivalent 2007 2008 2009 2006 2005
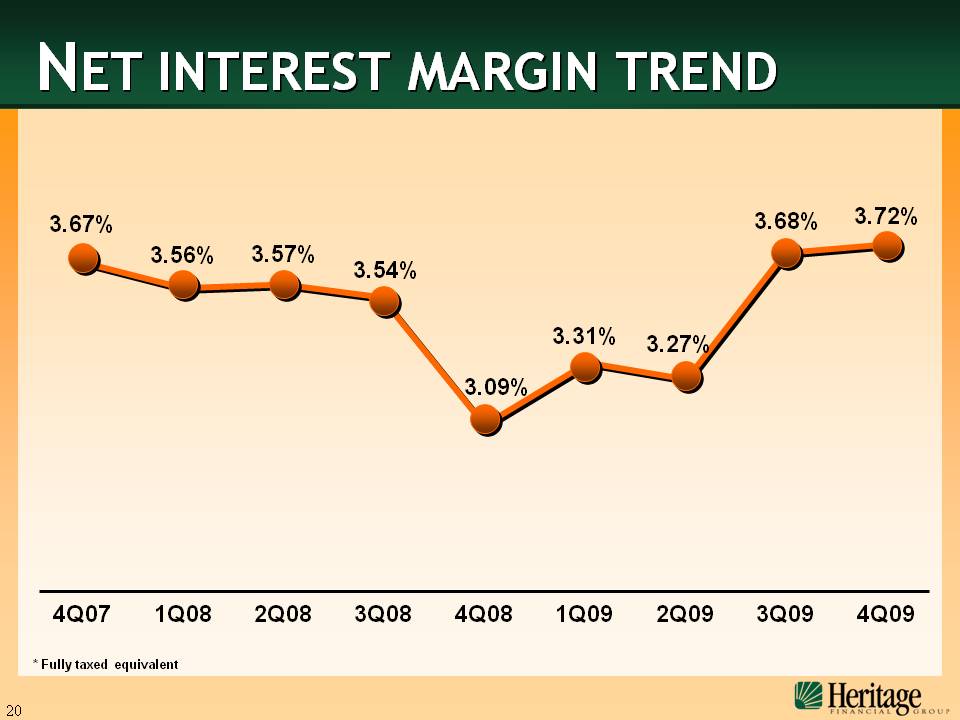
NET INTEREST MARGIN
TREND 4Q07 1Q08 2Q08 3Q08 4Q08 1Q09 2Q09 3Q09 4Q09 3.54% 3.09% 3.31% 3.27% 3.68% 3.72% 3.67% 3.56% 3.57% *
Fully taxed equivalent
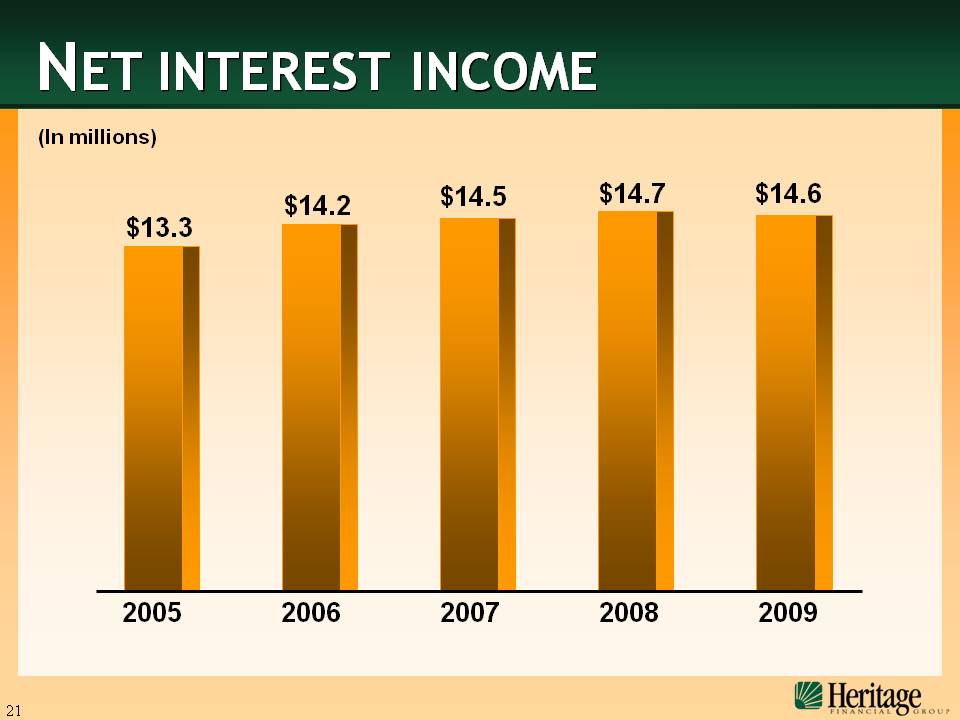
NET INTEREST
INCOME $14.7 $14.6 $13.3 $14.2 $14.5 (In
millions) 2007 2008 2009 2006 2005
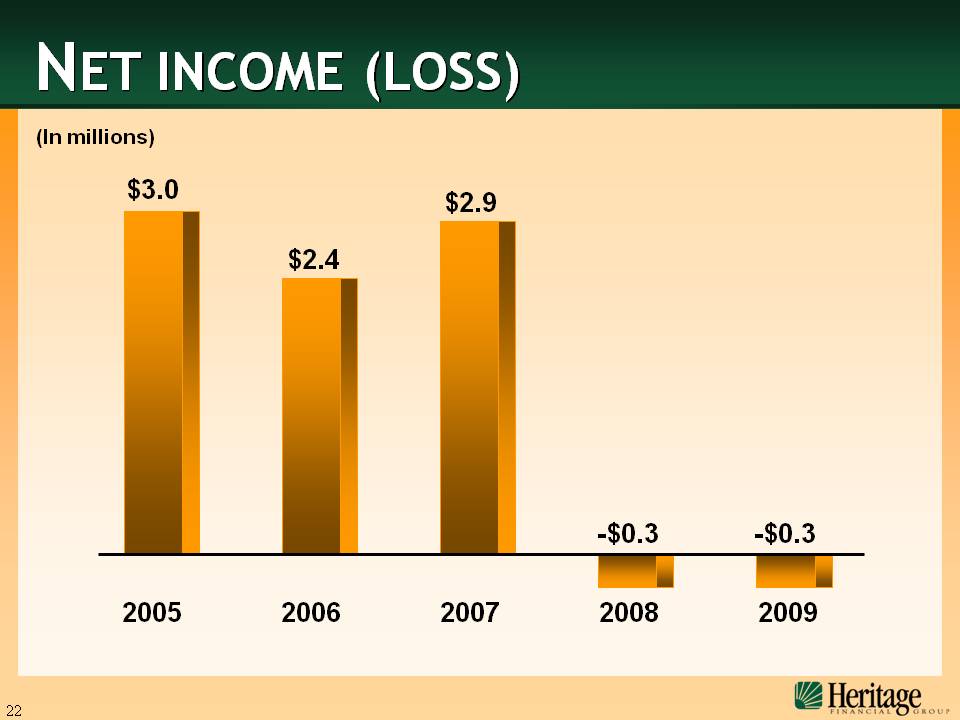
NET INCOME
(LOSS) -$0.3 -$0.3 $3.0 $2.4 $2.9 (In
millions) 2007 2008 2009 2006 2005
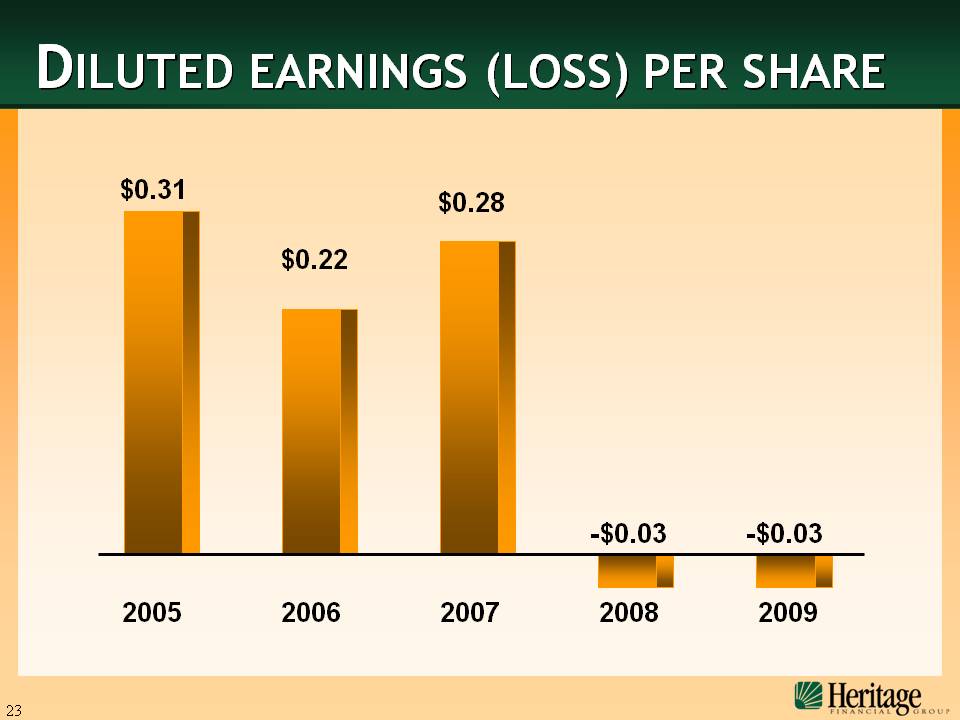
DILUTED EARNINGS (LOSS) PER
SHARE 2007 2008 2009 2006 2005 -$0.03 -$0.03 $0.31 $0.22 $0.28

2007 2008 2009 2006 2005* 2010** CASH
DIVIDENDS DECLARED PER
SHARE $0.28 $0.32 $0.05 $0.20 $0.24 $0.36 *
Dividend commences, fourth quarter ** Indicated annual
dividend
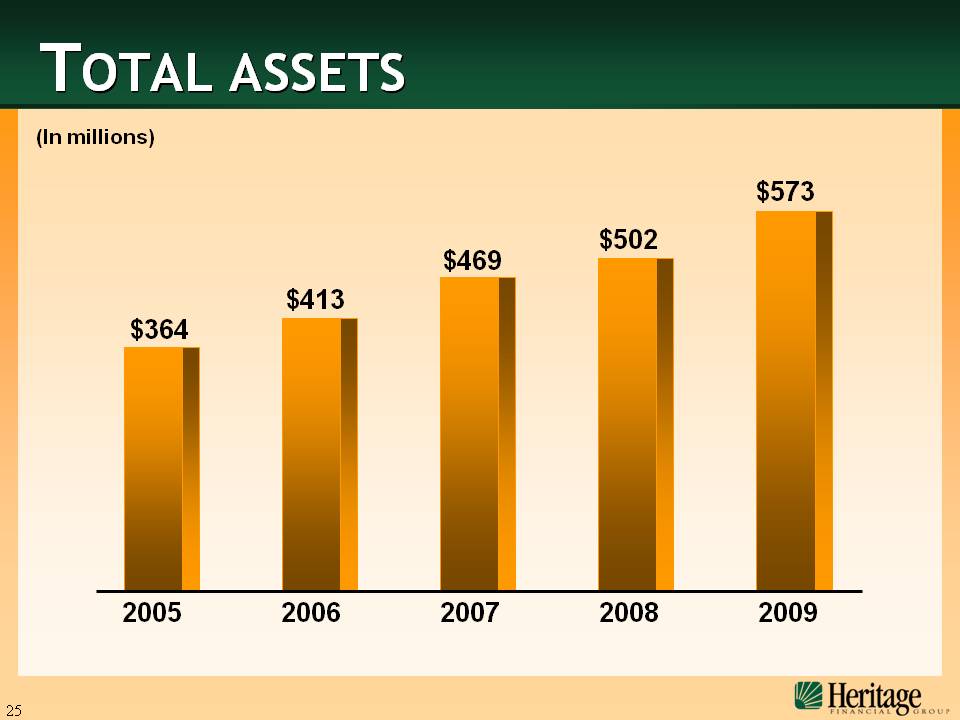
$469 $502 $573 $364 $413 TOTAL
ASSETS (In
millions) 2007 2008 2009 2006 2005
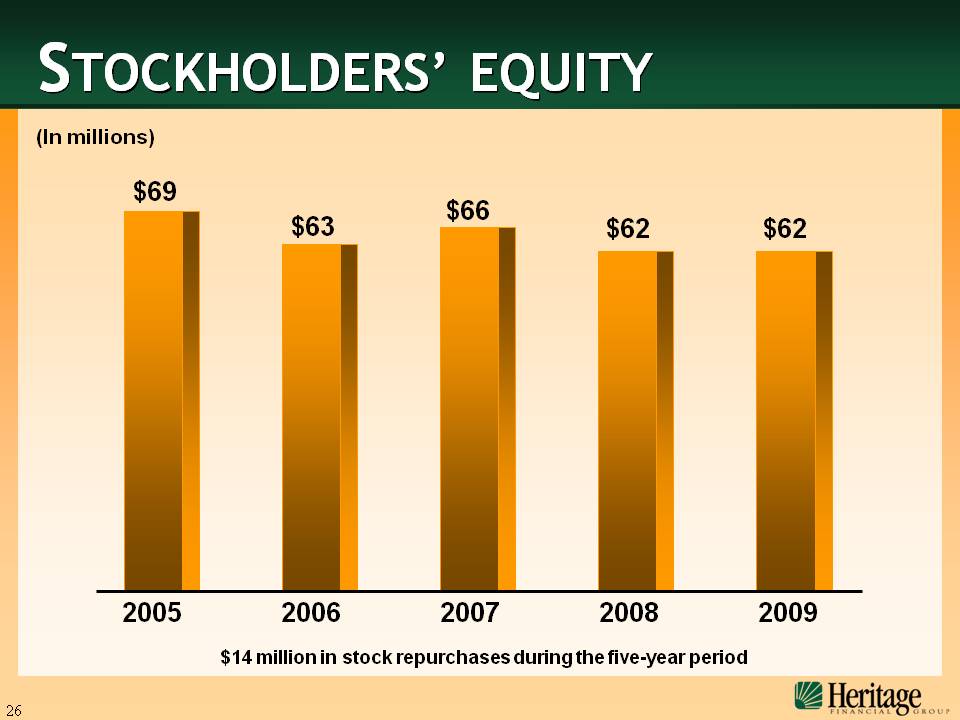
$66 $62 $62 $69 $63 STOCKHOLDERS’
EQUITY (In
millions) 2007 2008 2009 2006 2005 $14
million in stock repurchases during the five-year period
KEY INVESTMENT POINTS Record of solid financial performance Strong
commercial lending focus coupled with a significant retail presence Good growth
opportunities in new and legacy markets Increasing focus on strategic
relationships Ancillary financial services add balance to revenue
stream

FINANCIAL SUPPLEMENT
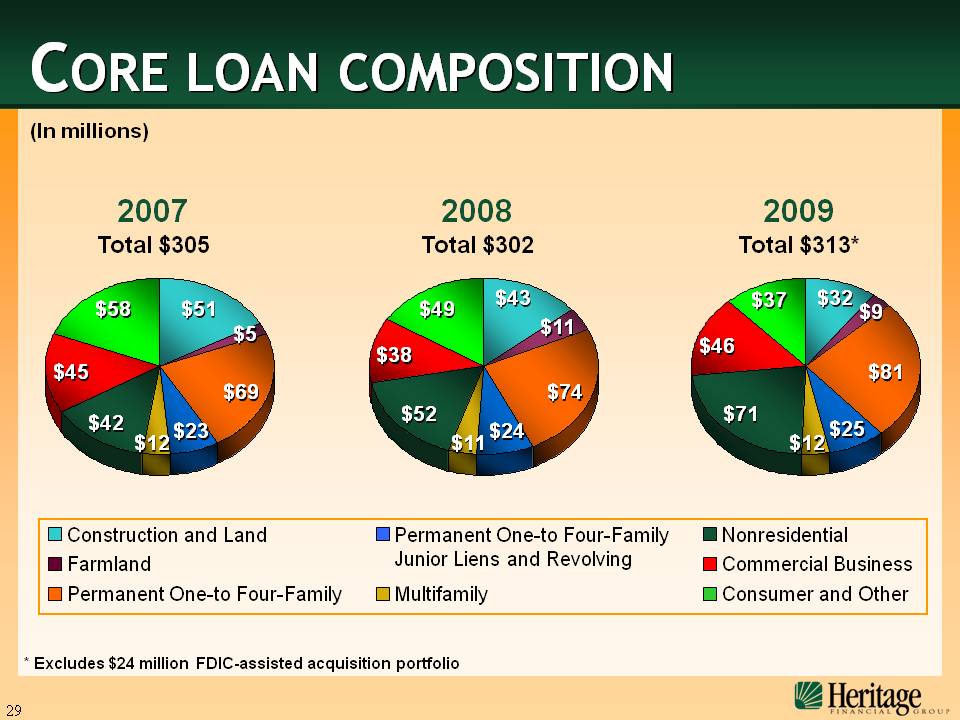
CORE LOAN
COMPOSITION $81 $12 $71 $9 $32 $37 $46 (In
millions) $25 * Excludes $24 million FDIC-assisted
acquisition portfolio 2009 Total $313* Construction and
Land Farmland Permanent One-to
Four-Family Permanent One-to Four-Family Junior Liens and
Revolving Multifamily Nonresidential Commercial
Business Consumer and
Other $74 $11 $52 $11 $43 $49 $38 $24 2008
Total
$302 $69 $12 $42 $5 $51 $58 $45 $23 2007
Total $305
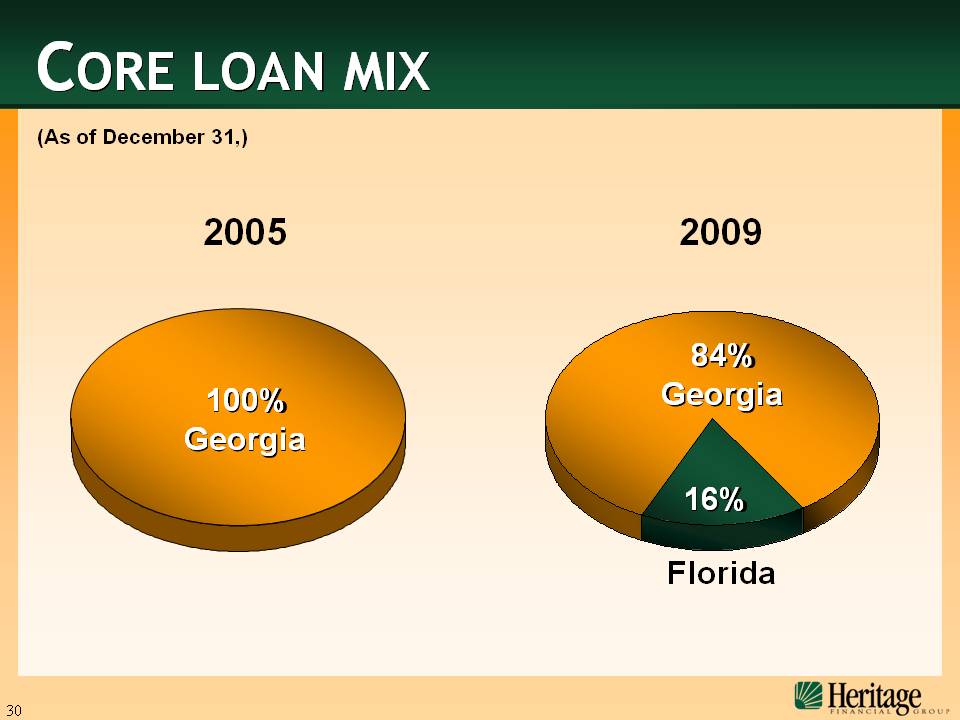
CORE LOAN
MIX 2005 2009 Florida 84% Georgia
16% 100% Georgia (As of December 31,)
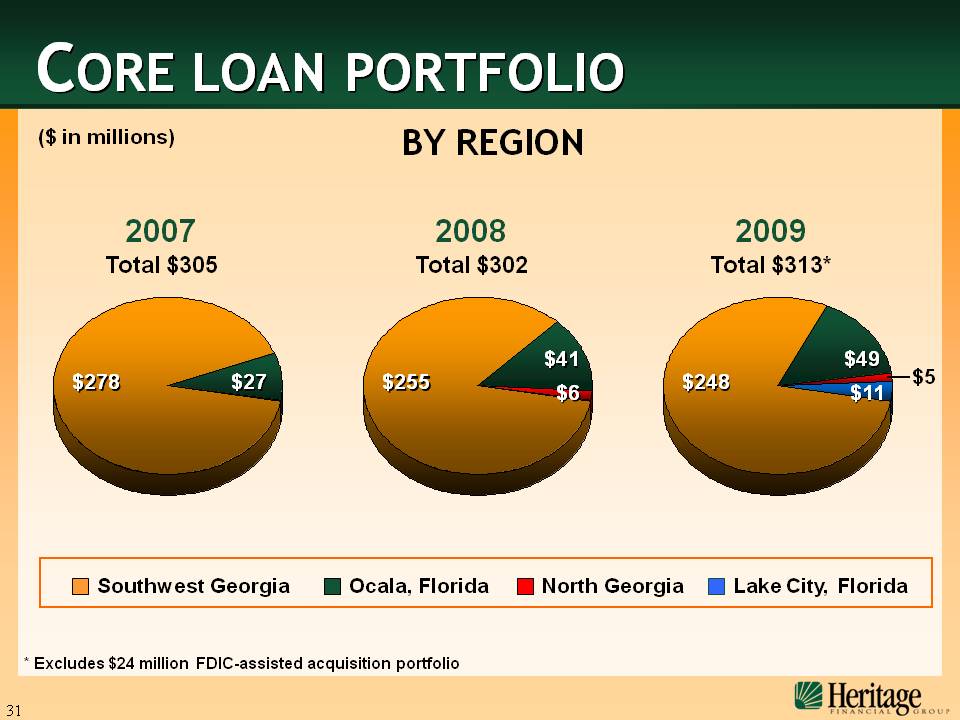
CORE LOAN PORTFOLIO ($ in millions) BY
REGION Southwest Georgia Ocala, Florida North
Georgia Lake City,
Florida $27 $278 2007 Total
$305 $41 $255 2008 Total
$302 $6 $49 $255 2008 Total
$313* $11 $5 * Excludes $24 million
FDIC-assisted acquisition portfolio

NON-PERFORMING
ASSETS $3.6 $9.4 $13.4 $0.9 $0.6 2007 2008 2009 2006 2005 (In
millions) (Gp:) OREO and repossessed assetsNon-performing
loans
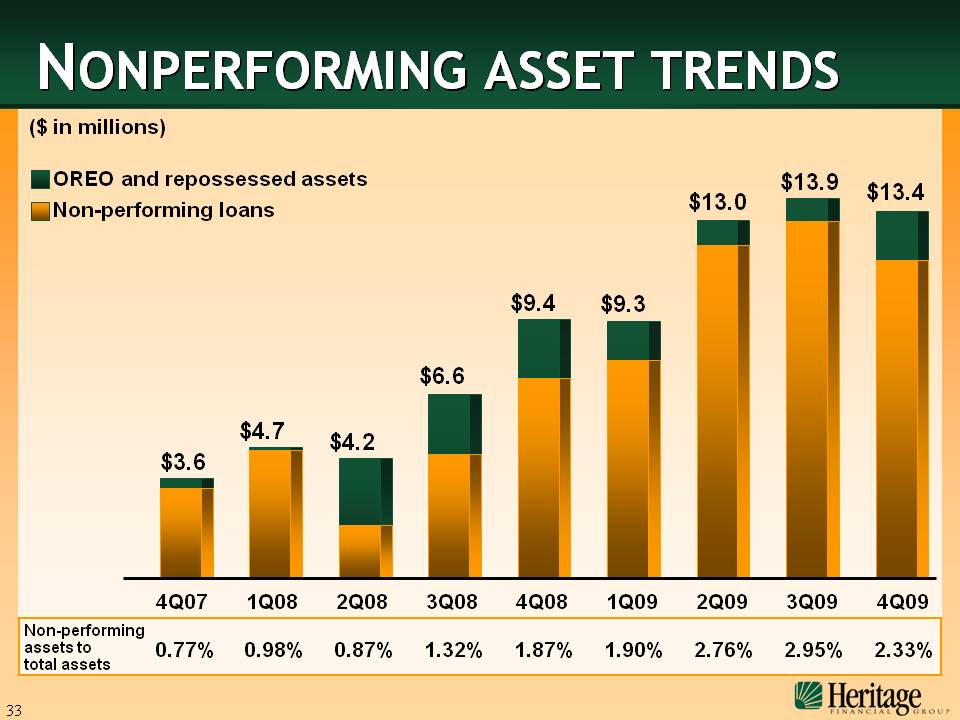
NONPERFORMING ASSET TRENDS ($ in
millions) $9.4 $9.3 $13.0 $13.9 $13.4 1.87% 1.90% 2.76% 2.95% 2.33% 0.77% 0.98% 0.87% 1.32% $3.6 $4.7 $4.2 $6.6 Non-performing
assets to total assets (Gp:) OREO and repossessed assetsNon-performing
loans 4Q07 1Q08 2Q08 3Q08 4Q08 1Q09 2Q09 3Q09 4Q09

NON-PERFORMING ASSETS (In
millions) 4Q07 1Q08 2Q08 3Q08 4Q08 1Q09 2Q09 3Q09 4Q09 $3.6 $4.7 $4.2 $7.6 $9.4 $9.3 $13.0 $13.9 Southwest
Georgia Ocala, Florida North Georgia Lake City,
Florida BY REGION $13.4 FDIC-assisted
portfolio
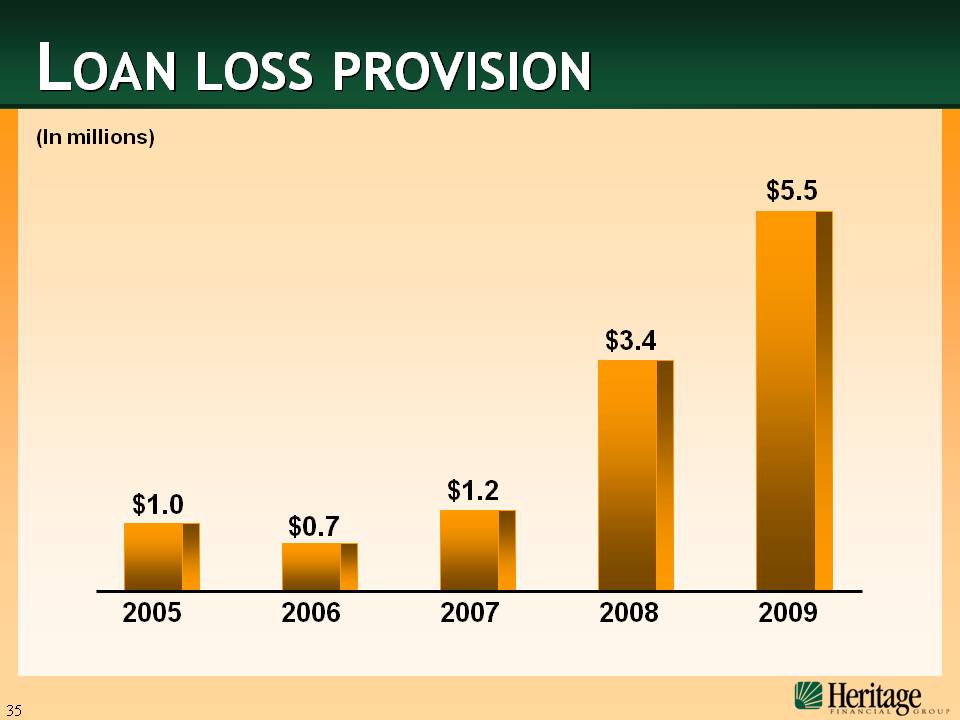
LOAN LOSS PROVISION (In
millions) $1.2 $3.4 $5.5 $1.0 $0.7 2007 2008 2009 2006 2005
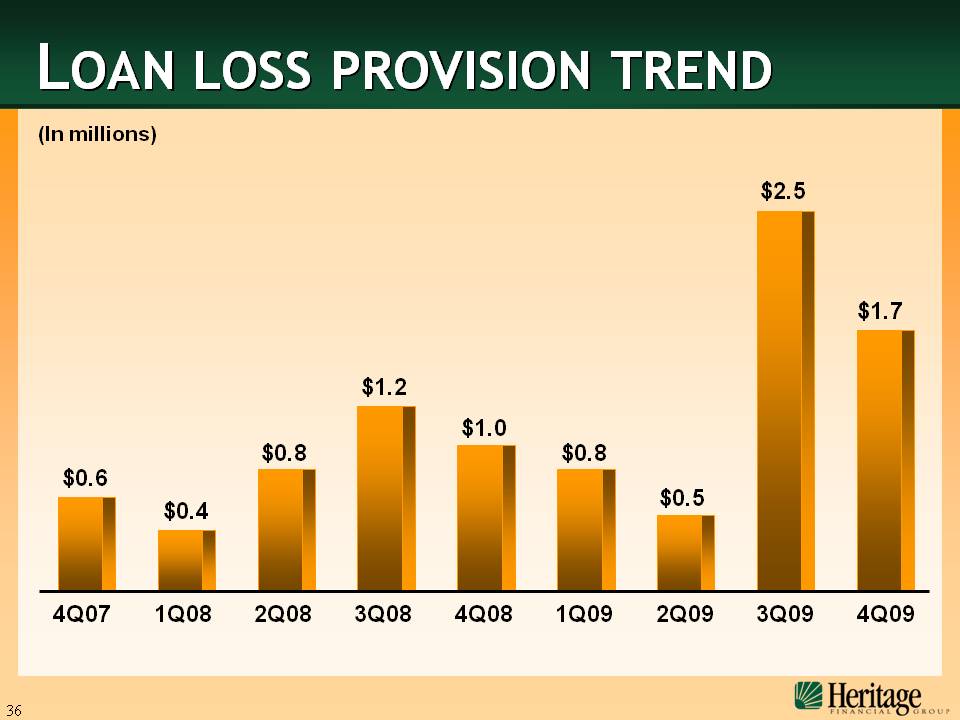
LOAN LOSS PROVISION TREND (In
millions) 4Q07 1Q08 2Q08 3Q08 4Q08 1Q09 2Q09 3Q09 4Q09 $0.6 $0.4 $0.8 $1.2 $1.0 $0.8 $0.5 $2.5 $1.7
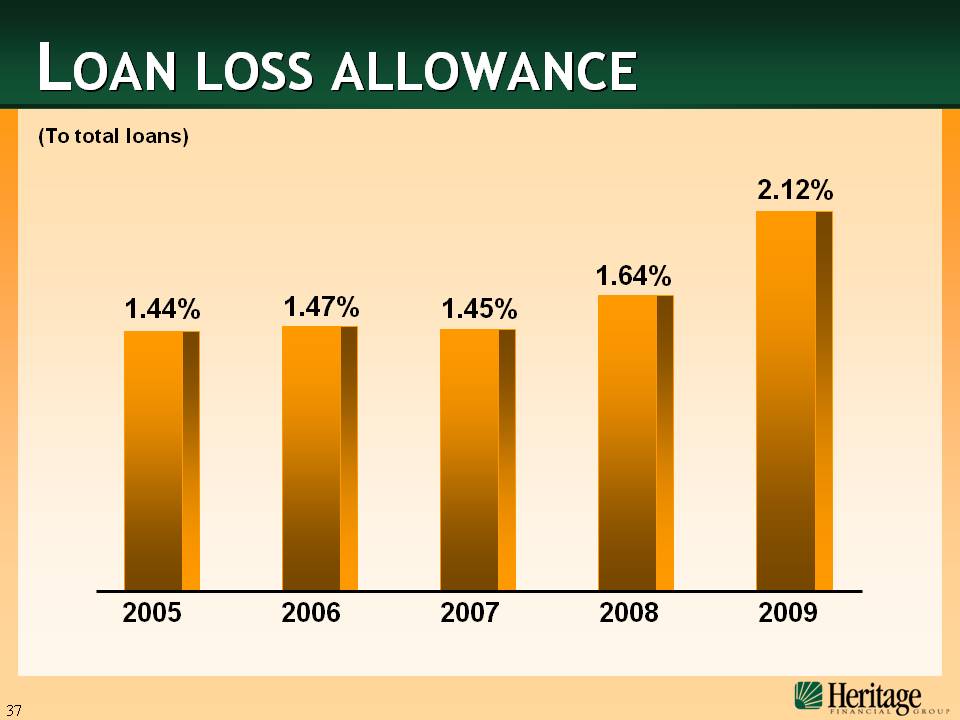
LOAN LOSS ALLOWANCE (To total
loans) 1.45% 1.64% 2.12% 1.44% 1.47% 2007 2008 2009 2006 2005
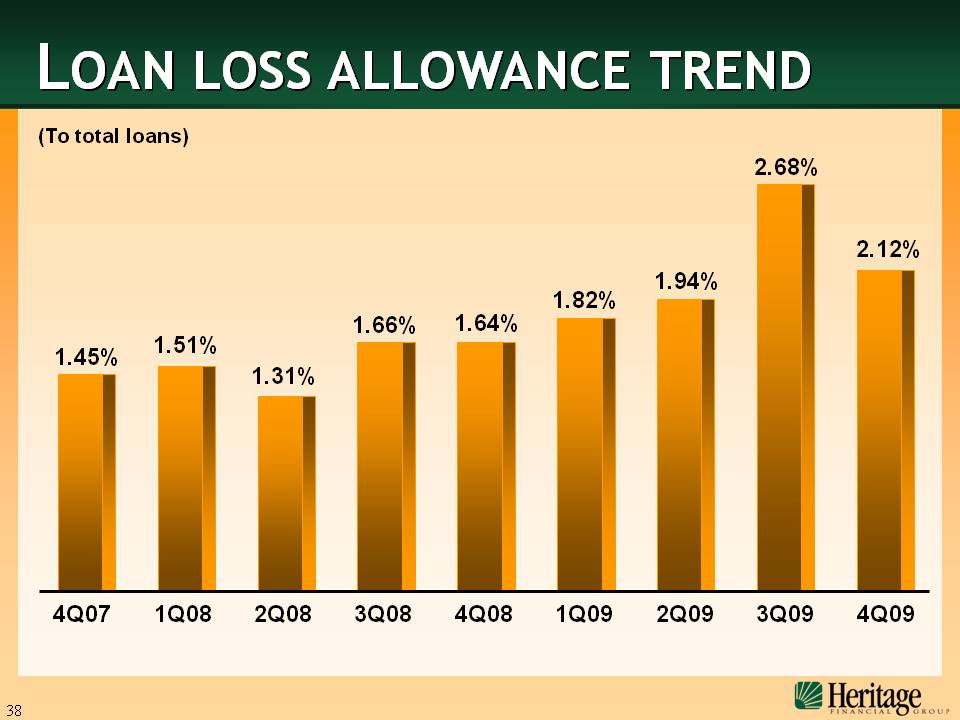
LOAN LOSS ALLOWANCE
TREND 4Q07 1Q08 2Q08 3Q08 4Q08 1Q09 2Q09 3Q09 4Q09 1.66% 1.64% 1.82% 1.94% 2.68% 2.12% (To
total
loans) 1.45% 1.51% 1.31
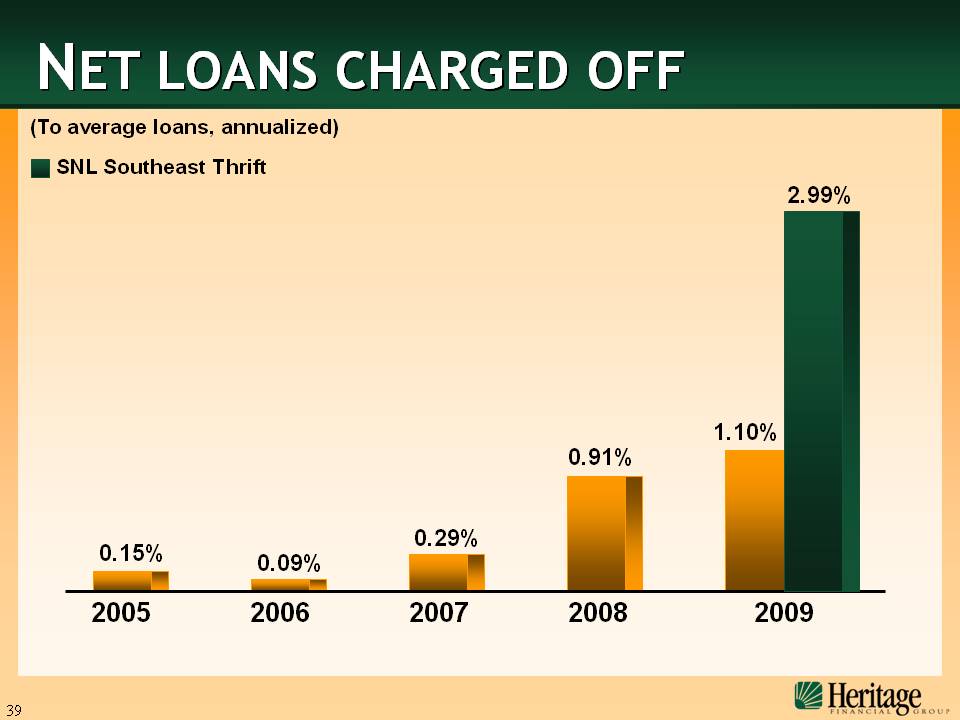
NET LOANS CHARGED OFF (To average loans,
annualized) SNL Southeast Thrift
2007 2008 2009 2006 2005 0.91% 1.10% 0.09% 0.29% 0.15% 2.99%

NET CHARGE-OFF TREND (To average loans,
annualized) 4Q07 1Q08 2Q08 3Q08 4Q08 1Q09 2Q09 3Q09 4Q09 0.99% 0.28% 1.77% 0.20% 1.58% 0.42% 0.26% 0.29% 3.36%
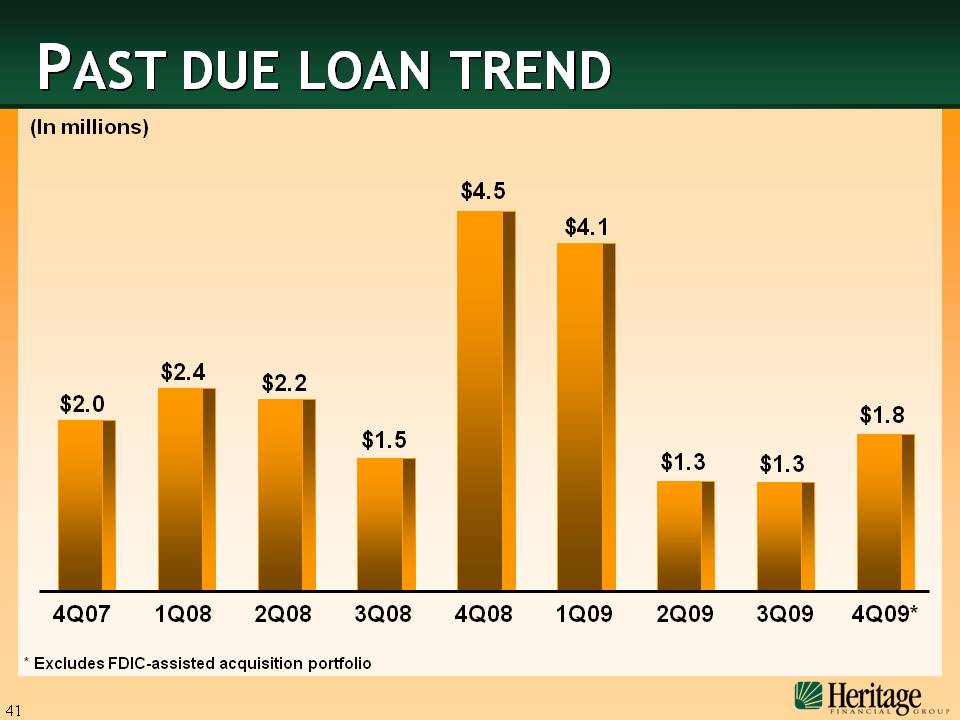
PAST DUE LOAN TREND (In
millions) 4Q07 1Q08 2Q08 3Q08 4Q08 1Q09 2Q09 3Q09 4Q09* $2.0 $2.4 $2.2 $1.5 $4.5 $4.1 $1.3 $1.3 $1.8 *
Excludes FDIC-assisted acquisition portfolio
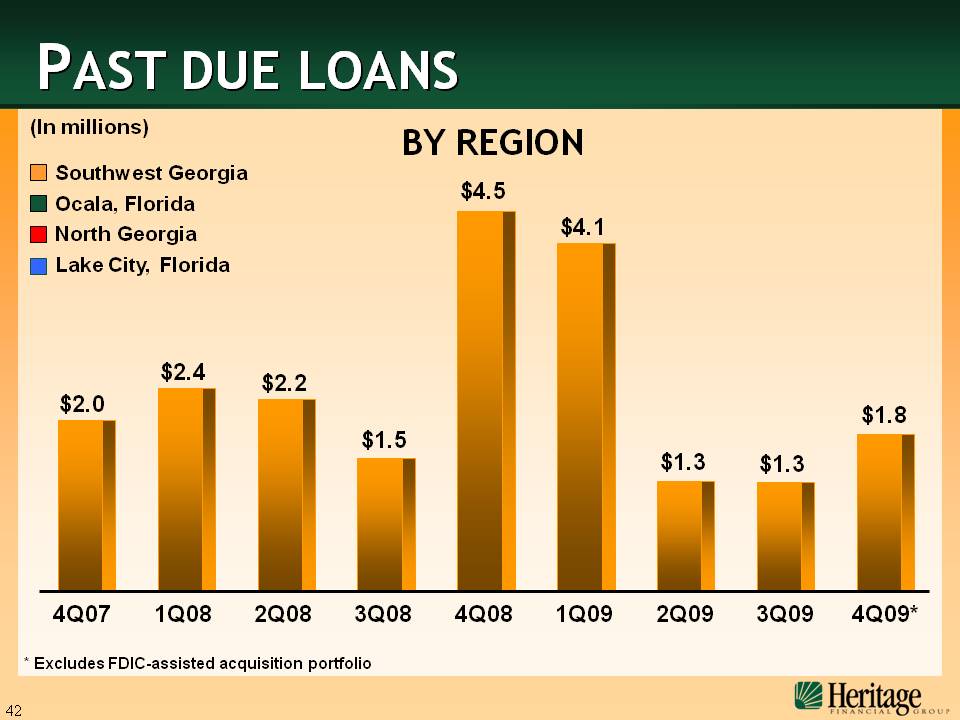
PAST DUE LOANS (In
millions) 4Q07 1Q08 2Q08 3Q08 4Q08 1Q09 2Q09 3Q09 4Q09* $2.0 $2.4 $2.2 $1.5 $4.5 $4.1 $1.3 $1.3 $1.8 Southwest
Georgia Ocala, Florida North Georgia Lake City,
Florida BY REGION * Excludes FDIC-assisted acquisition
portfolio
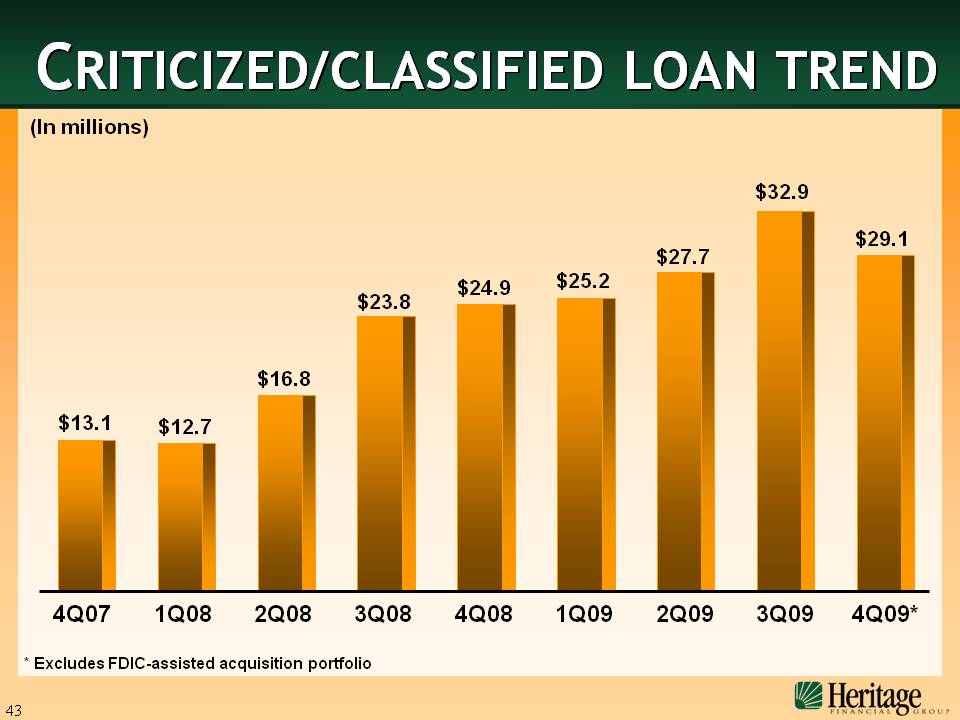
CRITICIZED/CLASSIFIED LOAN TREND (In
millions) 4Q07 1Q08 2Q08 3Q08 4Q08 1Q09 2Q09 3Q09 4Q09* $13.1 $12.7 $16.8 $23.8 $24.9 $25.2 $27.7 $32.9 $29.1 *
Excludes FDIC-assisted acquisition portfolio
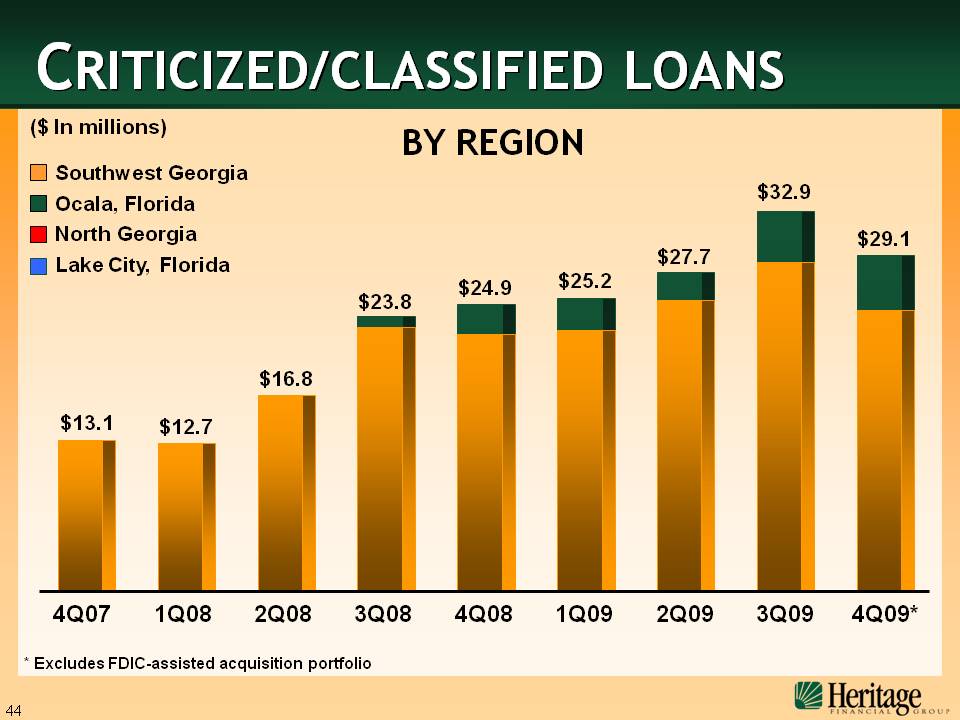
CRITICIZED/CLASSIFIED LOANS ($ In
millions) 4Q07 1Q08 2Q08 3Q08 4Q08 1Q09 2Q09 3Q09 4Q09* $13.1 $12.7 $16.8 $23.8 $24.9 $25.2 $27.7 $32.9 $29.1 Southwest
Georgia Ocala, Florida North Georgia Lake City,
Florida BY REGION * Excludes FDIC-assisted acquisition
portfolio
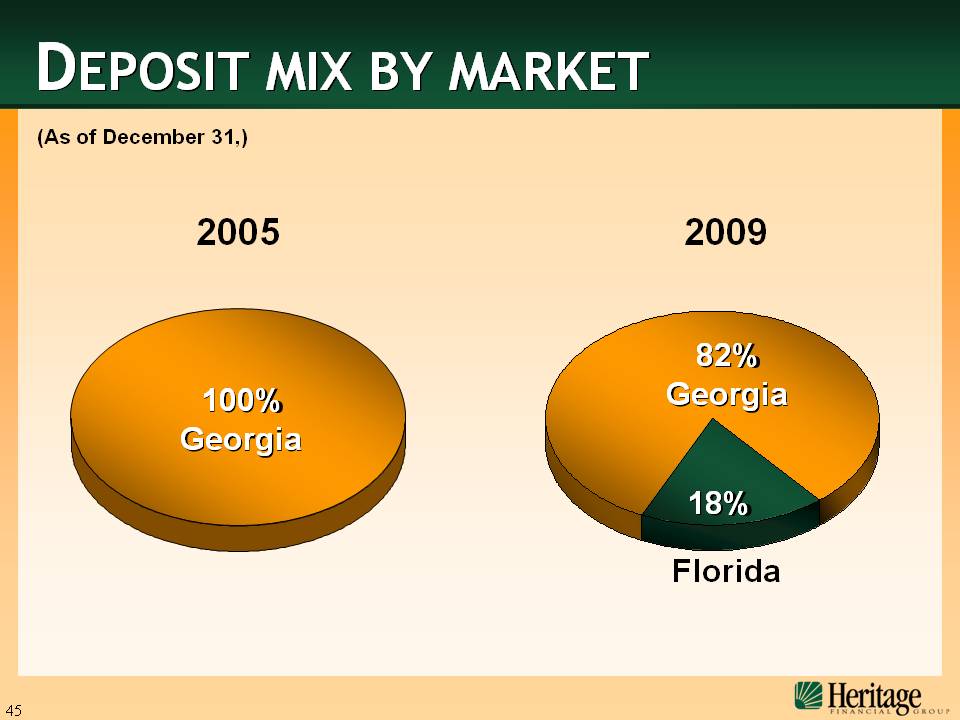
100% Georgia 2005 2009 DEPOSIT MIX BY
MARKET Florida 82% Georgia 18% (As of December
31,)
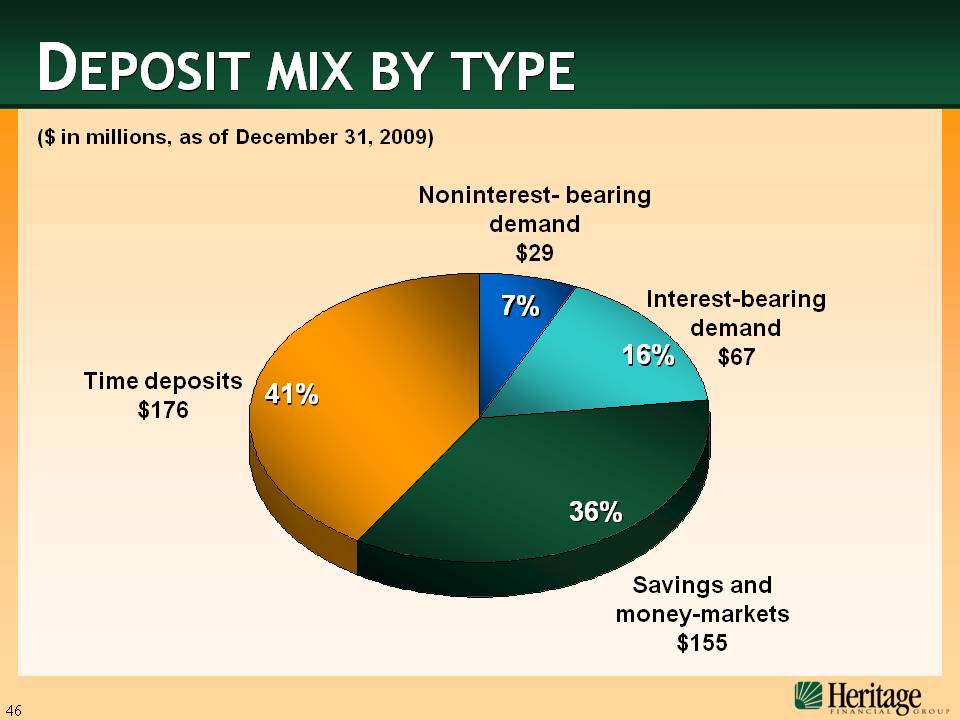
DEPOSIT MIX BY TYPE Noninterest- bearing demand $29 Interest-bearing
demand $67 Savings and money-markets $155 7% 16% 36% Time deposits$176 41% ($ in
millions, as of December 31, 2009)
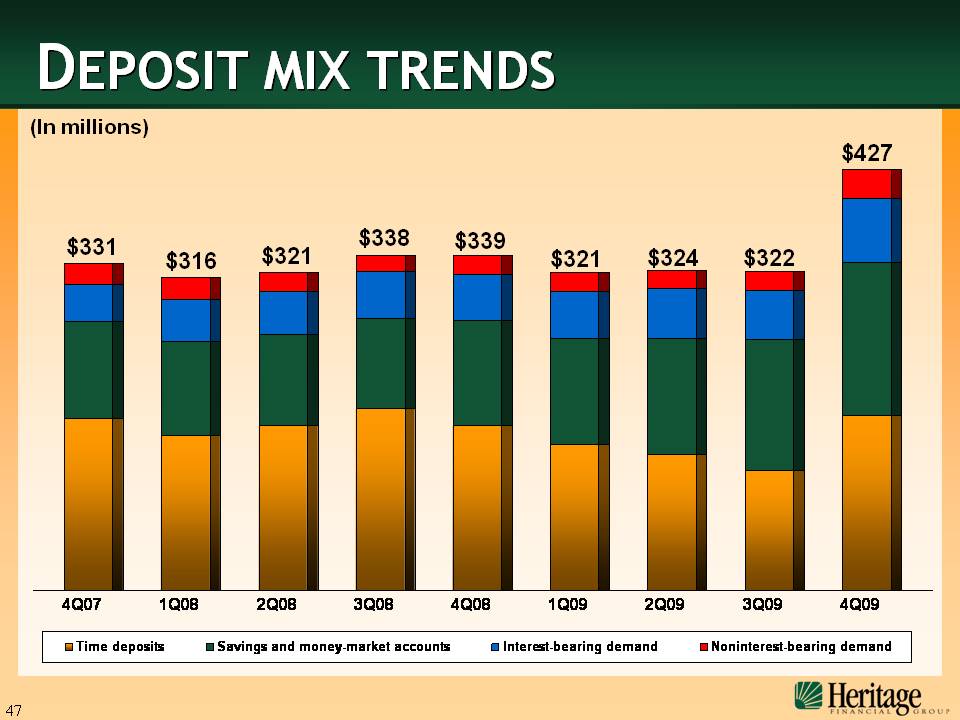
DEPOSIT MIX TRENDS (In
millions) $331 $316 $321 $338 $339 $321 $324 $322 $427

NASDAQ: HBOS