Attached files
Table of Contents
UNITED STATES
SECURITIES AND EXCHANGE COMMISSION
WASHINGTON, D.C. 20549
FORM 10-K
(Mark One)
| x | ANNUAL REPORT PURSUANT TO SECTION 13 OR 15(d) OF THE SECURITIES EXCHANGE ACT OF 1934 |
|||
| For the fiscal year ended December 31, 2009 | ||||
| OR | ||||
| ¨ | TRANSITION REPORT PURSUANT TO SECTION 13 OR 15(d) OF THE SECURITIES EXCHANGE ACT OF 1934 |
|||
For the transition period from to
Commission File Number 1-6075
UNION PACIFIC CORPORATION
(Exact name of registrant as specified in its charter)
| UTAH | 13-2626465 | |
| (State or other jurisdiction of incorporation or organization) |
(I.R.S. Employer Identification No.) |
1400 DOUGLAS STREET, OMAHA, NEBRASKA
(Address of principal executive offices)
68179
(Zip Code)
(402) 544-5000
(Registrant’s telephone number, including area code)
Securities registered pursuant to Section 12(b) of the Act:
| Title of each Class |
Name of each exchange on which registered | |
| Common Stock (Par Value $2.50 per share) |
New York Stock Exchange, Inc. |
| ¡ | Indicate by check mark if the registrant is a well-known seasoned issuer, as defined in Rule 405 of the Securities Act. |
þ Yes ¨ No
| ¡ | Indicate by check mark if the registrant is not required to file reports pursuant to Section 13 or Section 15(d) of the Act. |
¨ Yes þ No
| ¡ | Indicate by check mark whether the registrant (1) has filed all reports required to be filed by Section 13 or 15(d) of the Securities Exchange Act of 1934 during the preceding 12 months (or for such shorter period that the registrant was required to file such reports), and (2) has been subject to such filing requirements for the past 90 days. |
þ Yes ¨ No
| ¡ | Indicate by check mark whether the registrant has submitted electronically and posted on its corporate Website, if any, every Interactive Data File required to be submitted and posted pursuant to Rule 405 of Regulation S-T (§232.405 of this chapter) during the preceding 12 months (or for such shorter period that the registrant was required to submit and post such files). |
þ Yes ¨ No
| ¡ | Indicate by check mark if disclosure of delinquent filers pursuant to Item 405 of Regulation S-K (§229.405 of this chapter) is not contained herein, and will not be contained, to the best of the registrant’s knowledge, in definitive proxy or information statements incorporated by reference in Part III of this Form 10-K or any amendment to this Form 10-K. |
¨
| ¡ | Indicate by check mark whether the registrant is a large accelerated filer, an accelerated filer, a non-accelerated filer, or a smaller reporting company. See the definitions of “large accelerated filer,” “accelerated filer” and “smaller reporting company” in Rule 12b-2 of the Exchange Act. |
Large accelerated filer þ Accelerated filer ¨ Non-accelerated filer ¨ Smaller reporting company ¨
| ¡ | Indicate by check mark whether the registrant is a shell company (as defined in Rule 12b-2 of the Act). |
¨ Yes þ No
As of June 30, 2009, the aggregate market value of the registrant’s Common Stock held by non-affiliates (using the New York Stock Exchange closing price) was $28.7 billion.
The number of shares outstanding of the registrant’s Common Stock as of January 29, 2010 was 505,286,368.
Table of Contents
Documents Incorporated by Reference – Portions of the registrant’s definitive Proxy Statement for the Annual Meeting of Shareholders to be held on May 6, 2010, are incorporated by reference into Part III of this report. The registrant’s Proxy Statement will be filed with the Securities and Exchange Commission pursuant to Regulation 14A.
TABLE OF CONTENTS
| 3 | ||||
| 4 | ||||
| PART I | ||||
| Item 1. |
5 | |||
| Item 1A. |
10 | |||
| Item 1B. |
14 | |||
| Item 2. |
14 | |||
| Item 3. |
17 | |||
| Item 4. |
19 | |||
| Executive Officers of the Registrant and Principal Executive Officers of Subsidiaries |
20 | |||
| PART II | ||||
| Item 5. |
21 | |||
| Item 6. |
23 | |||
| Item 7. |
Management’s Discussion and Analysis of Financial Condition and Results of Operations |
24 | ||
| 47 | ||||
| 53 | ||||
| Item 7A. |
54 | |||
| Item 8. |
55 | |||
| 56 | ||||
| Item 9. |
Changes in and Disagreements with Accountants on Accounting and Financial Disclosure |
95 | ||
| Item 9A. |
95 | |||
| Management’s Annual Report on Internal Control Over Financial Reporting |
96 | |||
| 97 | ||||
| Item 9B. |
98 | |||
| PART III | ||||
| Item 10. |
98 | |||
| Item 11. |
98 | |||
| Item 12. |
Security Ownership of Certain Beneficial Owners and Management and Related Stockholder Matters |
99 | ||
| Item 13. |
Certain Relationships and Related Transactions and Director Independence |
99 | ||
| Item 14. |
99 | |||
| PART IV | ||||
| Item 15. |
100 | |||
| 101 | ||||
| Certifications |
||||
2
Table of Contents
Fellow Shareholders:
My message to you this year is one of pride in what your company has achieved and optimism for what lies ahead. Through the hard work and dedication of our employees, we not only survived the worst economic downturn since the Great Depression, but came through it a stronger company well positioned for future success.
As the year unfolded, we were hoping for the best, but planning for the worst. When the economy continued to falter, we adapted and responded with a continued focus on safety, service, innovative approaches to productivity, relentless cost control, new product offerings, and disciplined cash management. The result was the second highest EPS on record, an all-time low operating ratio, a strong balance sheet, and best-ever performance levels in safety and service.
Throughout it all, we never lost sight of the important role Union Pacific plays in our Nation’s economy. Customers struggling with declining markets sought more economical alternatives to ship their products, and we were there to provide cost effective, energy efficient, and environmentally sound transportation solutions. These are the hallmarks of the U.S. rail system, which is the best in the world and a critical part of our country’s future economic growth and global competitiveness.
As our Nation’s political leaders struggled with the significant challenges of restoring economic growth, the need to improve America’s infrastructure became more and more obvious. Most of these leaders recognize the need for a healthy freight rail system, and we have worked hard to help them keep this a national priority.
The next several years should bring tremendous opportunity to our company. Our balance of international and domestic business gives us an ability to be a part of any economic growth, regardless of where it starts and how it develops. Business levels will recover, and when they do, we have the operating leverage to handle that growth.
Perhaps not since the original construction of Union Pacific, connecting this country from east to west, have we been better positioned to fulfill our role of Building America. Our employees embrace this role and know that their economic well-being is linked to the company’s success. Our service now differentiates us, and our franchise is unparalleled and cannot be replicated. Our core strategy of safety, service and value is sound and proven. We will continue to invest wisely in support of our strategy, and to capitalize on opportunities for growth driven by the cost, energy and environmental advantages of rail.
Over the past decade and a half, Union Pacific has on average produced double-digit total annual returns to our shareholders that have outperformed the S&P 500. Opportunities lie ahead to continue creating significant value for our shareholders, customers and country. Together, the thousands of men and women who make this company great stand ready to seize the moment and make it even greater.

Chairman, President and
Chief Executive Officer
3
Table of Contents
DIRECTORS AND SENIOR MANAGEMENT
BOARD OF DIRECTORS
| Andrew H. Card, Jr. Consultant and Professional Speaker Board Committees: Audit, Finance
Erroll B. Davis, Jr. Chancellor University System of Georgia Board Committees: Compensation and Benefits, Corporate Governance and Nominating
Thomas J. Donohue President and Chief Executive Officer U.S. Chamber of Commerce Board Committees: Compensation and Benefits (Chair), Corporate Governance and Nominating
Archie W. Dunham Retired Chairman ConocoPhillips Board Committees: Finance (Chair), Corporate Governance and Nominating |
Judith Richards Hope Distinguished Visitor from Practice and Professor of Law Georgetown University Law Center Board Committees: Audit (Chair), Finance
Charles C. Krulak General, USMC, Ret. Former Commandant of the United States Marine Corps Board Committees: Audit, Finance
Michael R. McCarthy Chairman McCarthy Group, LLC Board Committees: Audit, Finance
Michael W. McConnell General Partner Brown Brothers Harriman & Co. Board Committees: Audit, Compensation and Benefits |
Thomas F. McLarty III President McLarty Associates Board Committees: Compensation and Benefits, Corporate Governance and Nominating
Steven R. Rogel Retired Chairman Weyerhaeuser Company Board Committees: Corporate Governance and Nominating (Chair), Compensation and Benefits
Jose H. Villarreal Advisor Akin, Gump, Strauss, Hauer & Feld, LLP Board Committees: Corporate Governance and Nominating, Finance
James R. Young Chairman, President and Chief Executive Officer Union Pacific Corporation and Union Pacific Railroad Company | ||
| SENIOR MANAGEMENT | ||||
| James R. Young Chairman, President and Chief Executive Officer Union Pacific Corporation and Union Pacific Railroad Company
Dennis J. Duffy Vice Chairman–Operations Union Pacific Railroad Company
Charles R. Eisele Senior Vice President–Strategic Planning Union Pacific Corporation
Bernard R. Gutschewski Vice President–Taxes Union Pacific Corporation
J. Michael Hemmer Senior Vice President–Law and General Counsel Union Pacific Corporation |
Mary Sanders Jones Vice President and Treasurer Union Pacific Corporation
Robert M. Knight, Jr. Executive Vice President–Finance and Chief Financial Officer Union Pacific Corporation
John J. Koraleski Executive Vice President– Marketing and Sales Union Pacific Railroad Company
Richard R. McClish Vice President–Continuous Improvement Union Pacific Railroad Company
Joseph E. O’Connor, Jr. Vice President–Purchasing Union Pacific Railroad Company
Michael A. Rock Vice President–External Relations Union Pacific Corporation |
Barbara W. Schaefer Senior Vice President–Human Resources and Secretary Union Pacific Corporation
Lynden L. Tennison Senior Vice President and Chief Information Officer Union Pacific Corporation
Jeffrey P. Totusek Vice President and Controller Union Pacific Corporation
Robert W. Turner Senior Vice President– Corporate Relations Union Pacific Corporation
William R. Turner Vice President–Labor Relations Union Pacific Railroad Company | ||
4
Table of Contents
PART I
GENERAL
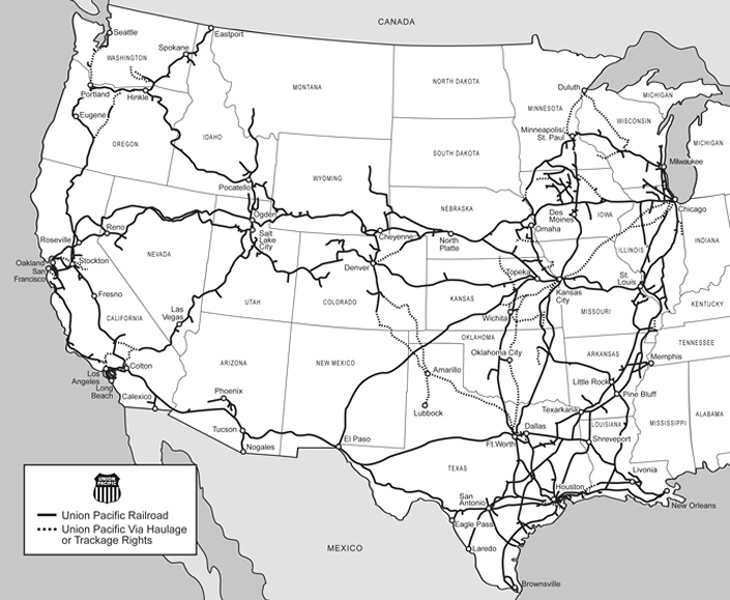
Union Pacific Corporation owns one of America’s leading transportation companies. Its principal operating company, Union Pacific Railroad Company, links 23 states in the western two-thirds of the country. Union Pacific Railroad Company serves many of the fastest-growing U.S. population centers and provides Americans with a fuel-efficient, environmentally responsible and safe mode of freight transportation. Union Pacific Railroad Company’s diversified business mix includes Agricultural Products, Automotive, Chemicals, Energy, Industrial Products and Intermodal. Union Pacific Railroad Company emphasizes excellent customer service and offers competitive routes from all major West Coast and Gulf Coast ports to eastern gateways. Union Pacific Railroad Company connects with Canada’s rail systems and is the only railroad serving all six major gateways to Mexico, making it North America’s premier rail franchise.
Union Pacific Corporation was incorporated in Utah in 1969 and maintains its principal executive offices at 1400 Douglas Street, Omaha, NE 68179. The telephone number at that address is (402) 544-5000. The common stock of Union Pacific Corporation is listed on the New York Stock Exchange (NYSE) under the symbol “UNP”.
For purposes of this report, unless the context otherwise requires, all references herein to “UPC”, “Corporation”, “we”, “us”, and “our” shall mean Union Pacific Corporation and its subsidiaries, including Union Pacific Railroad Company, which we separately refer to as “UPRR” or the “Railroad”.
Available Information – Our Internet website is www.up.com. We make available free of charge on our website (under the “Investors” caption link) our Annual Reports on Form 10-K; our Quarterly Reports on Form 10-Q; eXtensible Business Reporting Language (XBRL) documents for our 2009 Annual Report on Form 10-K and our 2009 Quarterly Reports on Form 10-Q for the second and third quarters; our current reports on Form 8-K; our proxy statements; Forms 3, 4, and 5, filed on behalf of directors and executive officers; and amendments to such reports filed or furnished pursuant to the Securities Exchange Act of 1934, as amended (the Exchange Act), as soon as reasonably practicable after such material is electronically filed with, or furnished to, the Securities and Exchange Commission (SEC). We also make available on our website previously filed SEC reports and exhibits via a link to EDGAR on the SEC’s Internet site at www.sec.gov. Additionally, our corporate governance materials, including By-Laws, Board Committee charters, governance guidelines and policies, and codes of conduct and ethics for directors, officers, and employees are available on our website. From time to time, the corporate governance materials on our website may be updated as necessary to comply with rules issued by the SEC and the NYSE or as desirable to promote the effective and efficient governance of our company. Any security holder wishing to receive, without charge, a copy of any of our SEC filings or corporate governance materials should send a written request to: Secretary, Union Pacific Corporation, 1400 Douglas Street, Omaha, NE 68179.
We have included the Chief Executive Officer (CEO) and Chief Financial Officer (CFO) certifications regarding our public disclosure required by Section 302 of the Sarbanes-Oxley Act of 2002 as Exhibits 31(a) and (b) to this report.
References to our website address in this report, including references in Management’s Discussion and Analysis of Financial Condition and Results of Operations, Item 7, are provided as a convenience and do not constitute, and should not be deemed, an incorporation by reference of the information contained on, or available through, the website. Therefore, such information should not be considered part of this report.
5
Table of Contents
OPERATIONS
The Railroad, along with its subsidiaries and rail affiliates, is our one reportable operating segment. Although revenue is analyzed by commodity group, we analyze the net financial results of the Railroad as one segment due to the integrated nature of our rail network. Additional information regarding our business and operations, including revenue and financial information and data and other information regarding environmental matters, is presented in Risk Factors, Item 1A; Legal Proceedings, Item 3; Selected Financial Data, Item 6; Management’s Discussion and Analysis of Financial Condition and Results of Operations, Item 7; and the Financial Statements and Supplementary Data, Item 8 (which include information regarding revenues, statements of income, and total assets).
| Operations – UPRR is a Class I railroad operating in the United States. We have approximately 32,094 route miles, linking Pacific Coast and Gulf Coast ports with the Midwest and eastern United States gateways and providing several corridors to key Mexican gateways. We serve the western two-thirds of the country and maintain coordinated schedules with other rail carriers to move freight to and from the Atlantic Coast, the Pacific Coast, the Southeast, the Southwest, Canada, and Mexico. Export and import traffic moves through Gulf Coast and Pacific Coast ports and across the Mexican and Canadian borders. Our freight traffic consists of bulk, manifest, and premium business. Bulk traffic is primarily coal, grain, rock, or soda ash in unit trains – trains transporting a single commodity from one source to one destination. Manifest traffic is individual carload or less than train-load business, including commodities such as lumber, steel, paper, and food. The transportation of finished vehicles and intermodal containers is part of our premium business. In 2009, we generated freight revenues totaling $13.4 billion from the following six commodity groups: |
2009 Freight Revenue
|
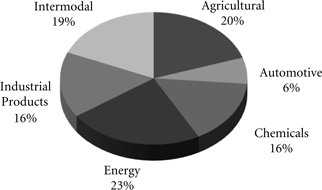
Agricultural – Transporting agricultural products, including whole grains, commodities produced from these grains, and food and beverage products, provided 20% of our 2009 freight revenues. With access to most major grain markets, we provide a critical link between the Midwest and western producing areas and export terminals in the Pacific Northwest (the PNW) and Gulf ports, as well as Mexico. Unit trains of grain efficiently shuttle between producers and export terminals or domestic markets. We also serve significant domestic markets, including grain processors, animal feeders, and ethanol producers in the Midwest, West, South, and Rocky Mountain states. Primary food commodities consist of a variety of fresh and frozen fruits and vegetables, dairy products, and beverages, which are moved to major U.S. population centers for distribution and consumption. Express Lane and Produce Unit Train compete with the trucking industry by providing premium perishable services that move fruits and vegetables from the PNW and California to destinations in the East. We transport frozen meat and poultry to the West Coast ports for export, while beverages, primarily beer, enter the U.S. from Mexico.
Automotive – We are the largest automotive carrier west of the Mississippi River, serving vehicle assembly plants and distributing imported vehicles from six West Coast ports and Houston. We off-load finished vehicles at 38 vehicle distribution centers for delivery by truck to all major western U.S. cities. In addition to transporting finished vehicles, we provide expedited handling of automotive parts in both boxcars and intermodal containers to several assembly plants. We carry automotive materials bound for assembly plants in Mexico, the U.S., and Canada, and we also transport finished vehicles from
6
Table of Contents
manufacturing facilities in Canada and Mexico. In 2009, transportation of finished vehicles and automotive materials accounted for 6% of our freight revenues.
Chemicals – Transporting chemicals provided 16% of our freight revenues in 2009. Our franchise enables us to serve the chemical producing areas along the Gulf Coast, as well as the Rocky Mountain region. Two-thirds of the chemicals business consists of industrial chemicals, plastics, and liquid petroleum products. In addition to transporting plastics, customers also use our storage-in-transit yards for intermediate storage of plastic resins. Soda ash shipments originate in southwestern Wyoming and California destined primarily for glass producing markets in the East, the West, and abroad. Fertilizer movements originate primarily in the Gulf Coast region, as well as the West and Canada, bound for major agricultural users in the Midwest and the western U.S.
Energy – Coal transportation accounted for 23% of our 2009 freight revenues. Our transportation network allows us to transport coal and coke to utilities, industrial facilities, interchange points, and water terminals. The water terminals provide access to the West and Gulf Coasts for export, and rail/barge interchange facilities on the Mississippi and Ohio Rivers and the Great Lakes. We serve mines located in the Southern Powder River Basin of Wyoming (SPRB), Colorado, Utah, southern Wyoming, and southern Illinois. SPRB coal represents the largest growth segment of the market, as utilities continue to favor its lower cost and low-sulfur content.
Industrial Products – Our extensive network enables us to move numerous commodities between thousands of origin and destination points throughout North America. Lumber shipments originate primarily in the PNW and Canada for destinations throughout the United States for new home construction and repair and remodeling. Commercial and highway construction drives shipments of steel and construction products, consisting of rock, cement, and roofing materials. Paper and consumer goods, including furniture and appliances, are shipped to major metropolitan areas for consumers. Nonferrous metals and industrial minerals are moved for industrial manufacturing. In addition, we provide efficient and safe transportation for government entities and waste companies. In 2009, transporting industrial products provided 16% of our freight revenues.
Intermodal – Our intermodal business, which represented 19% of our freight revenues in 2009, includes international and domestic shipments. International business consists of imported or exported container traffic that arrives at, or departs from, West Coast ports via ocean vessel. Domestic business includes domestic container and trailer traffic for major retailers and other U.S. businesses that is sold through intermodal marketing companies (primarily shipper agents and consolidators) and truckload carriers.
Seasonality – Some of the commodities we carry have peak shipping seasons, reflecting either or both the nature of the commodity, such as certain agricultural and food products that have specific growing and harvesting seasons, and the demand cycle for the commodity, such as intermodal traffic, which generally has a peak shipping season during the third quarter to meet holiday-related demand for consumer goods during the fourth quarter. The peak shipping seasons for these commodities can vary considerably from year to year depending upon various factors, including the strength of domestic and international economies and currencies and the strength of harvests and market prices of agricultural products. In response to an annual request delivered by the Surface Transportation Board (STB) of the United States Department of Transportation (DOT) to all of the Class I railroads operating in the U.S., we issue a letter during the third quarter detailing our plans for handling traffic during the third and fourth quarters and providing other information requested by the STB.
Working Capital – At December 31, 2009, we had a working capital surplus, which reflects our decision to maintain additional cash reserves to enhance liquidity in response to difficult economic conditions. At December 31, 2008, we had a working capital deficit. Historically, we have had a working capital deficit, which is common in our industry and does not indicate a lack of liquidity. We maintain adequate
7
Table of Contents
resources and, when necessary, have access to capital to meet any daily and short-term cash requirements, and we have sufficient financial capacity to satisfy our current liabilities.
Competition – We are subject to competition from other railroads, motor carriers, ship and barge operators, and pipelines. Our main rail competitor is Burlington Northern Santa Fe Corporation. Its rail subsidiary, BNSF Railway Company (BNSF), operates parallel routes in many of our main traffic corridors. In addition, we operate in corridors served by other railroads and motor carriers. Motor carrier competition exists for five of our six commodity groups (excluding energy). Because of the proximity of our routes to major inland and Gulf Coast waterways, barges can be particularly competitive, especially for grain and bulk commodities. In addition to price competition, we face competition with respect to transit times and quality and reliability of service. While we must build or acquire and maintain our rail system, trucks and barges are able to use public rights-of-way maintained by public entities. Any future improvements or expenditures materially increasing the quality or reducing the costs of these alternative modes of transportation, or legislation releasing motor carriers from their size or weight limitations, could have a material adverse effect on our business.
Equipment Suppliers – We depend on two key domestic suppliers of locomotives. Due to the capital intensive nature of the locomotive manufacturing business and sophistication of this equipment, potential new suppliers face high barriers to entry in this industry. Therefore, if one of these domestic suppliers discontinues manufacturing locomotives for any reason, including insolvency or bankruptcy, we could experience a significant cost increase and risk reduced availability of the locomotives that are necessary to our operations. Additionally, we utilize two suppliers of rail (one domestic and one international) that meet our specifications. Rail is critical for both maintenance of our network and replacement and improvement or expansion of our network and facilities. Rail manufacturing also has high barriers to entry, and, if one of those suppliers discontinues operations for any reason, including insolvency or bankruptcy, we could experience cost increases and difficulty obtaining rail.
Employees – Approximately 85% of our 43,531 full-time-equivalent employees are represented by 14 major rail unions. Current labor agreements became subject to modification on January 1, 2010. In January 2010, we began the next round of negotiations with the unions. Existing agreements remain in effect and will continue to remain in effect until new agreements are reached or the Railway Labor Act’s procedures (which include mediation, cooling-off periods, and the possibility of Presidential intervention) are exhausted. Contract negotiations with the various unions generally take place over an extended period of time, and we rarely experience work stoppages during negotiations.
Railroad Security – Operating a safe and secure railroad is first among our critical priorities and is a primary responsibility of all our employees. This emphasis helps us protect the public, our employees, our customers, and operations across our rail network. Our security efforts rely upon a wide variety of measures including employee training, cooperation with our customers, training of emergency responders, and partnerships with numerous federal, state, and local government agencies. While federal law requires us to protect the confidentiality of our security plans designed to safeguard against terrorism and other security incidents, the following provides a general overview of our security initiatives.
UPRR Security Measures – We maintain a comprehensive security plan designed to deter and to respond to any potential or actual threats as they arise. The plan includes four levels of alert status, each with its own set of countermeasures. We employ our own police force, consisting of more than 220 commissioned and highly-trained officers. Our employees also undergo recurrent security and preparedness training, as well as federally-mandated hazardous materials and security training. We regularly review the sufficiency of our employee training programs for ways to increase preparedness and to improve security.
We have an emergency response management center, which operates 24 hours a day. The center receives reports of emergencies, dangerous or potentially dangerous conditions, and other safety and security
8
Table of Contents
issues from our employees, the public, and law enforcement and other government officials. In cooperation with government officials, we monitor both threats and public events, and, as necessary, we may alter rail traffic flow near high-risk areas to minimize risk to communities we serve and our operations. We comply with the hazardous materials routing rules and other requirements imposed by federal law. We also design our operating plan to expedite the movement of hazardous material shipments to minimize the time rail cars remain idle at yards and terminals located in or near major population centers. Additionally, in compliance with new Transportation Security Agency (TSA) regulations that took effect on April 1, 2009, we deployed new information systems and instructed employees in tracking and documenting the handoff of Rail Security Sensitive Material (RSSM) with customers and interchange partners.
We also have established a number of our own innovative safety and security-oriented initiatives ranging from various investments in technology to The Officer on the Train program, which provides local law enforcement officers with the opportunity to ride with train crews to enhance their understanding of railroad operations and risks.
Cooperation with Federal, State, and Local Government Agencies – We work closely with government agencies ranging from the DOT and the Department of Homeland Security (DHS) to local police departments, fire departments, and other first responders. In conjunction with DOT, DHS, and other railroads, we sponsor Operation Respond, which provides first responders with secure links to electronic railroad resources, including mapping systems, shipment records, and other essential information required by emergency personnel to respond to accidents and other situations. We also participate in the National Joint Terrorism Task Force, a multi-agency effort established by the Justice Department and the Federal Bureau of Investigation to combat and prevent terrorism.
We work with the Coast Guard, U.S. Customs and Border Protection (CBP, formerly the U.S. Customs Service), and the Military Transport Management Command to monitor shipments entering the UPRR rail network at U.S. border crossings and ports. We were the first railroad in the United States to be named a partner in CBP’s Customs-Trade Partnership Against Terrorism (C-TPAT), a partnership designed to develop, enhance, and maintain effective security processes throughout the global supply chain.
Cooperation with Customers and Trade Associations – Along with other railroads, we work with the American Chemistry Council to train more than 200,000 emergency responders each year. We work closely with our chemical shippers to establish plant security plans, and we continue to take steps to more closely monitor and track hazardous materials shipments. In cooperation with the Federal Railroad Administration (FRA) and other railroads, we are also working to develop additional improvements to tank car design that will further limit the risk of releases of hazardous materials.
GOVERNMENTAL AND ENVIRONMENTAL REGULATION
Governmental Regulation – Our operations are subject to a variety of federal, state, and local regulations, generally applicable to all businesses (see also the discussion of certain regulatory proceedings in Legal Proceedings, Item 3).
The operations of the Railroad are also subject to the regulatory jurisdiction of the STB. The operations of the Railroad also are subject to the regulations of the FRA and other federal and state agencies. The STB has jurisdiction over rates charged on certain regulated rail traffic; common carrier service of regulated traffic; freight car compensation; transfer, extension, or abandonment of rail lines; and acquisition of control of rail common carriers. On January 12, 2010, the FRA issued final rules governing installation of positive train control (PTC) by the end of 2015. Although still under development, PTC is a collision avoidance technology intended to override locomotive controls and stop a train before an accident. The FRA acknowledged that projected costs will exceed projected benefits by a ratio of about 22 to one. We expect to invest approximately $200 million during 2010 in the development of PTC. Additionally, the
9
Table of Contents
U.S. Senate will consider a proposed bill in 2010 that would expand the regulatory authority of the STB and could include new antitrust provisions. We are closely monitoring this proposed legislation.
DOT, the Occupational Safety and Health Administration, and DHS, along with other federal agencies, have jurisdiction over certain aspects of safety, movement of hazardous materials, movement and disposal of hazardous waste, emissions requirements, and equipment standards. On October 16, 2008, President Bush signed the Rail Safety Improvement Act of 2008 into law, which, among other things, revised hours of service rules for train and certain other railroad employees, mandated implementation of PTC, imposed passenger service requirements, addressed safety at rail crossings, increased the number of safety related employees of the FRA, and increased fines that may be levied against railroads for safety violations. Additionally, various state and local agencies have jurisdiction over disposal of hazardous waste and seek to regulate movement of hazardous materials in areas not preempted by federal law.
Environmental Regulation – We are subject to extensive federal and state environmental statutes and regulations pertaining to public health and the environment. The statutes and regulations are administered and monitored by the Environmental Protection Agency (EPA) and by various state environmental agencies. The primary laws affecting our operations are the Resource Conservation and Recovery Act, regulating the management and disposal of solid and hazardous wastes; the Comprehensive Environmental Response, Compensation, and Liability Act, regulating the cleanup of contaminated properties; the Clean Air Act, regulating air emissions; and the Clean Water Act, regulating waste water discharges.
Information concerning environmental claims and contingencies and estimated remediation costs is set forth in Management’s Discussion and Analysis of Financial Condition and Results of Operations – Critical Accounting Policies – Environmental, Item 7 and Note 15 to the Consolidated Financial Statements in Item 8, Financial Statements and Supplementary Data.
The information set forth in this Item 1A should be read in conjunction with the rest of the information included in this report, including Item 7, Management’s Discussion and Analysis of Financial Condition and Results of Operations, and Item 8, Financial Statements and Supplementary Data.
We Are Subject to Significant Governmental Regulation – We are subject to governmental regulation by a significant number of federal, state, and local authorities covering a variety of health, safety, labor, environmental, economic (as discussed below), and other matters. Many laws and regulations require us to obtain and maintain various licenses, permits, and other authorizations, and we cannot guarantee that we will continue to be able to do so. Our failure to comply with applicable laws and regulations could have a material adverse effect on us. Governments may change the legislative or regulatory frameworks within which we operate without providing us any recourse to address any adverse effects on our business, including, without limitation, regulatory determinations or rules regarding dispute resolution, business relationships with other railroads, calculation of our cost of capital or other inputs relevant to computing our revenue adequacy, and costs and expenses. Significant legislative activity in Congress could expand regulation of railroad operations and prices for rail services, which could reduce capital spending on our rail network, facilities and equipment, and could have a material adverse effect on our results of operations, financial condition, and liquidity. As part of the Rail Safety Improvement Act of 2008, railroad carriers must implement PTC by the end of 2015, which could have a material adverse effect on our ability to make other capital investments. In addition to current legislative activity, one or more consolidations of Class I railroads could also lead to increased regulation of the rail industry.
We May Be Affected by General Economic Conditions – Prolonged severe adverse domestic and global economic conditions or disruptions of financial and credit markets, including the availability of short- and
10
Table of Contents
long-term debt financing, may affect the producers and consumers of the commodities we carry and may have a material adverse effect on our results of operations, financial condition, and liquidity.
We Are Required to Transport Hazardous Materials – Federal laws require railroads, including us, to transport hazardous materials regardless of risk or potential exposure of loss. Any rail accident or other incident or accident on our network, at our facilities, or at the facilities of our customers involving the release of hazardous materials, including toxic inhalation hazard (or TIH) materials such as certain chlorine compounds, could involve significant costs and claims for personal injury, property damage, and environmental penalties and remediation, which could have a material adverse effect on our results of operations, financial condition, and liquidity.
We Rely on Technology and Technology Improvements in Our Business Operations – We rely on information technology in all aspects of our business. If we do not have sufficient capital to acquire new technology or if we are unable to implement new technology, we may suffer a competitive disadvantage within the rail industry and with companies providing other modes of transportation service, which could have a material adverse effect on our results of operations, financial condition, and liquidity. Additionally, if we experience significant disruption or failure of one or more of our information technology systems, including computer hardware, software, and communications equipment, we could experience a service interruption, safety failure, security breach, or other operational difficulties, which could have a material adverse impact on our results of operations, financial condition, and liquidity.
We Must Manage Fluctuating Demand for Our Services and Network Capacity – If there is significant demand for our services that exceeds the designed capacity of our network, we may experience network difficulties, including congestion and reduced velocity, that could compromise the level of service we provide to our customers. This level of demand may also compound the impact of weather and weather-related events on our operations and velocity. Although we continue to improve our transportation plan, add capacity, and improve operations at our yards and other facilities, we cannot be sure that these measures will fully or adequately address any service shortcomings resulting from demand exceeding our planned capacity. We may experience other operational or service difficulties related to network capacity, dramatic and unplanned increases or decreases of demand for rail service with respect to one or more of our commodity groups, or other events that could have a negative impact on our operational efficiency, any of which could have a material adverse effect on our results of operations, financial condition, and liquidity. In the event that we experience significant reductions of demand for rail services with respect to one or more of our commodity groups, we may experience increased costs associated with resizing our operations, including higher unit operating costs and costs for the storage of locomotives, rail cars, and other equipment; work-force adjustments; and other related activities, which could have a material adverse effect on our results of operations, financial condition, and liquidity.
We Face Competition from Other Railroads and Other Transportation Providers – We face competition from other railroads, motor carriers, ships, barges, and pipelines. In addition to price competition, we face competition with respect to transit times and quality and reliability of service. While we must build or acquire and maintain our rail system, trucks and barges are able to use public rights-of-way maintained by public entities. Any future improvements or expenditures materially increasing the quality or reducing the cost of alternative modes of transportation, or legislation releasing motor carriers from their size or weight limitations, could have a material adverse effect on our results of operations, financial condition, and liquidity. Additionally, any future consolidation of the rail industry could materially affect the competitive environment in which we operate.
Severe Weather Could Result in Significant Business Interruptions and Expenditures – As a railroad with a vast network, we are exposed to severe weather conditions and other natural phenomena, including earthquakes, hurricanes, fires, floods, mudslides or landslides, extreme temperatures, and significant precipitation that may cause business interruptions, including line outages on our rail network, that can adversely affect our entire rail network and result in increased costs, increased liabilities, and decreased
11
Table of Contents
revenue, which could have a material adverse effect on our results of operations, financial condition, and liquidity.
Strikes or Work Stoppages Could Adversely Affect Our Operations as the Majority of Our Employees Belong to Labor Unions and Labor Agreements – The U.S. Class I railroads are party to collective bargaining agreements with various labor unions. Disputes with regard to the terms of these agreements or our potential inability to negotiate acceptable contracts with these unions could result in, among other things, strikes, work stoppages, or other slowdowns by the affected workers. If unionized workers were to engage in a strike, work stoppage, or other slowdown, or other employees were to become unionized, we could experience a significant disruption of our operations or higher ongoing labor costs, either of which could have a material adverse effect on our results of operations, financial condition, and liquidity. Additionally, future national labor agreements, or renegotiation of labor agreements or provisions of labor agreements, could compromise our service reliability and significantly increase our costs for healthcare, wages, and other benefits, which could have a material adverse impact on our results of operations, financial condition, and liquidity.
We May Be Subject to Various Claims and Lawsuits That Could Result in Significant Expenditures – As a railroad with operations in densely populated urban areas and other cities and a vast rail network, we are exposed to the potential for various claims and litigation related to labor and employment, personal injury, property damage, environmental liability, and other matters. Any material changes to litigation trends or a catastrophic rail accident or series of accidents involving any or all of property damage, personal injury, and environmental liability could have a material adverse effect on our results of operations, financial condition, and liquidity.
We Are Subject to Significant Environmental Laws and Regulations – Due to the nature of the railroad business, our operations are subject to extensive federal, state, and local environmental laws and regulations concerning, among other things, emissions to the air; discharges to waters; handling, storage, transportation, and disposal of waste and other materials; and hazardous material or petroleum releases. We generate and transport hazardous and non-hazardous waste in our operations, and we did so in our former operations. Environmental liability can extend to previously owned or operated properties, leased properties, and properties owned by third parties, as well as to properties we currently own. Environmental liabilities have arisen and may also arise from claims asserted by adjacent landowners or other third parties in toxic tort litigation. We have been and may be subject to allegations or findings that we have violated, or are strictly liable under, these laws or regulations. We could incur significant costs as a result of any of the foregoing, and we may be required to incur significant expenses to investigate and remediate known, unknown, or future environmental contamination, which could have a material adverse effect on our results of operations, financial condition, and liquidity.
We May Be Affected by Climate Change and Market or Regulatory Responses to Climate Change – Climate change, including the impact of global warming, could have a material adverse effect on our results of operations, financial condition, and liquidity. Restrictions, caps, taxes, or other controls on emissions of greenhouse gasses, including diesel exhaust, could significantly increase our operating costs. Restrictions on emissions could also affect our customers that (a) use commodities that we carry to produce energy, (b) use significant amounts of energy in producing or delivering the commodities we carry, or (c) manufacture or produce goods that consume significant amounts of energy or burn fossil fuels, including chemical producers, farmers and food producers, and automakers and other manufacturers. Significant cost increases, government regulation, or changes of consumer preferences for goods or services relating to alternative sources of energy or emissions reductions could materially affect the markets for the commodities we carry, which in turn could have a material adverse effect on our results of operations, financial condition, and liquidity. Government incentives encouraging the use of alternative sources of energy could also affect certain of our customers and the markets for certain of the commodities we carry in an unpredictable manner that could alter our traffic patterns, including, for example, the impacts of ethanol incentives on farming and ethanol producers. Finally, we could face
12
Table of Contents
increased costs related to defending and resolving legal claims and other litigation related to climate change and the alleged impact of our operations on climate change. Any of these factors, individually or in operation with one or more of the other factors, or other unforeseen impacts of climate change could reduce the amount of traffic we handle and have a material adverse effect on our results of operations, financial condition, and liquidity.
Rising or Elevated Fuel Costs and Whether We Are Able to Mitigate These Costs with Fuel Surcharges Could Materially and Adversely Affect Our Business – Fuel costs constitute a significant portion of our transportation expenses. Diesel fuel prices are subject to dramatic fluctuations, and significant price increases could have a material adverse effect on our operating results. Although we currently are able to recover a significant amount of our increased fuel expenses through revenue from fuel surcharges, we cannot be certain that we will always be able to mitigate rising or elevated fuel costs through surcharges. Future market conditions or legislative or regulatory activities could adversely affect our ability to apply fuel surcharges or adequately recover increased fuel costs through fuel surcharges. International, political, and economic circumstances affect fuel prices and supplies. Weather can also affect fuel supplies and limit domestic refining capacity. If a fuel supply shortage were to arise, higher fuel prices could, despite our fuel surcharge programs, have a material adverse effect on our results of operations, financial condition, and liquidity.
We Utilize Capital Markets – Due to the significant capital expenditures required to operate a safe and efficient railroad, we rely on the capital markets to provide some of our capital requirements. We utilize long-term debt instruments, bank financing and commercial paper from time-to-time, and we pledge certain of our receivables. Significant instability or disruptions of the capital markets, including the credit markets, or deterioration of our financial condition due to internal or external factors could restrict or prohibit our access to, and significantly increase the cost of, commercial paper and other financing sources, including bank credit facilities and the issuance of long-term debt, including corporate bonds. A deterioration of our financial condition could result in a reduction of our credit rating to below investment grade, which could prohibit or restrict us from utilizing our current sale of receivables program or accessing external sources of short- and long-term debt financing and significantly increase the costs associated with utilizing a sale of receivables program and issuing both commercial paper and long-term debt.
We Are Subject to Legislative, Regulatory, and Legal Developments Involving Taxes – Taxes are a significant part of our expenses. We are subject to U.S. federal, state, and foreign income, payroll, property, sales and use, fuel, and other types of taxes. Changes in tax rates, enactment of new tax laws, revisions of tax regulations, and claims or litigation with taxing authorities could result in substantially higher taxes and, therefore, could have a material adverse effect on our results of operations, financial condition, and liquidity.
The Availability of Qualified Personnel Could Adversely Affect Our Operations – Changes in demographics, training requirements, and the availability of qualified personnel could negatively affect our ability to meet demand for rail service. Unpredictable increases in demand for rail services and a lack of network fluidity may exacerbate such risks, which could have a negative impact on our operational efficiency and otherwise have a material adverse effect on our results of operations, financial condition, and liquidity.
We Are Dependent on Certain Key Suppliers of Locomotives and Rail – Due to the capital intensive nature and sophistication of locomotive equipment, potential new suppliers face high barriers to entry with respect to locomotive manufacturing. Therefore, if one of these domestic suppliers discontinues manufacturing locomotives for any reason, including bankruptcy or insolvency, we could experience significant cost increases and reduced availability of the locomotives that are necessary to our operations. Additionally, we utilize two suppliers of rail that meet our specifications. Rail is critical to our operations for rail replacement programs, maintenance, and for adding additional network capacity, new rail and
13
Table of Contents
storage yards, and expansions of existing facilities. This industry similarly has high barriers to entry, and if one of these suppliers discontinues operations for any reason, including bankruptcy or insolvency, we could experience both significant cost increases for rail purchases and difficulty obtaining sufficient rail for maintenance and other projects.
We May Be Affected by Acts of Terrorism, War, or Risk of War – Our rail lines, facilities, and equipment, including rail cars carrying hazardous materials, could be direct targets or indirect casualties of terrorist attacks. Terrorist attacks, or other similar events, any government response thereto, and war or risk of war may adversely affect our results of operations, financial condition, and liquidity. In addition, insurance premiums for some or all of our current coverages could increase dramatically, or certain coverages may not be available to us in the future.
Item 1B. Unresolved Staff Comments
None.
We employ a variety of assets in the management and operation of our rail business. Our rail network covers 23 states in the western two-thirds of the U.S.
14
Table of Contents
Track – Our rail network includes approximately 32,094 route miles. We own 26,223 miles and operate on the remainder pursuant to trackage rights or leases. The following table describes track miles at December 31, 2009 and 2008.
| 2009 |
2008 | |||
| Route |
32,094 | 32,012 | ||
| Other main line |
6,584 | 6,510 | ||
| Passing lines and turnouts |
3,040 | 3,037 | ||
| Switching and classification yard lines |
9,167 | 9,207 | ||
| Total miles |
50,885 | 50,766 |
Harriman Dispatching Center – The Harriman Dispatching Center (HDC), located in Omaha, Nebraska, is our primary dispatching facility. It is linked to regional dispatching and locomotive management facilities at various locations along our network. The HDC moves locomotives and trains, manages traffic on our network, and coordinates interchanges with other railroads. Over 900 employees currently work on-site in the facility.
Rail Facilities – In addition to our track structure, we operate numerous facilities, including terminals for intermodal and other freight; rail yards for train-building (classification yards), switching, storage-in-transit (the temporary storage of customer goods in rail cars prior to shipment) and other activities; offices to administer and manage our operations; dispatch centers to direct traffic on our rail network; crew quarters to house train crews along our network; and shops and other facilities for fueling, maintenance, and repair of locomotives and repair and maintenance of rail cars and other equipment. The following tables include the major yards and terminals on our system:
| Top 10 Classification Yards | 2009 |
Avg. Daily Car Volume | ||
| North Platte, Nebraska |
2,100 | 2,500 | ||
| North Little Rock, Arkansas |
1,300 | 1,600 | ||
| Englewood (Houston), Texas |
1,300 | 1,300 | ||
| Proviso (Chicago), Illinois |
1,200 | 1,500 | ||
| Fort Worth, Texas |
1,100 | 1,300 | ||
| Roseville, California |
1,100 | 1,300 | ||
| Livonia, Louisiana |
1,100 | 1,200 | ||
| West Colton, California |
1,000 | 1,200 | ||
| Pine Bluff, Arkansas |
1,000 | 1,200 | ||
| Neff (Kansas City), Missouri |
900 | 1,000 |
15
Table of Contents
| Top 10 Intermodal Terminals | 2009 |
Annual Lifts | ||
| ICTF (Los Angeles), California |
453,000 | 619,000 | ||
| East Los Angeles, California |
372,000 | 383,000 | ||
| Global I (Chicago), Illinois |
306,000 | 291,000 | ||
| Global II (Chicago), Illinois |
284,000 | 299,000 | ||
| Marion (Memphis), Tennessee |
265,000 | 360,000 | ||
| City of Industry (Los Angeles), California |
254,000 | 206,000 | ||
| Lathrop (Stockton), California |
250,000 | 198,000 | ||
| Dallas, Texas |
233,000 | 294,000 | ||
| Oakland, California |
202,000 | 222,000 | ||
| Yard Center (Chicago), Illinois |
199,000 | 227,000 |
Rail Equipment – Our equipment includes owned and leased locomotives and rail cars; heavy maintenance equipment and machinery; other equipment and tools in our shops, offices, and facilities; and vehicles for maintenance, transportation of crews, and other activities. As of December 31, 2009, we owned or leased the following units of equipment:
| Locomotives | Owned | Leased | Total |
Average | ||||
| Road |
5,076 | 2,659 | 7,735 | 15.1 | ||||
| Switching |
437 | 26 | 463 | 30.6 | ||||
| Other |
97 | 55 | 152 | 22.4 | ||||
| Total locomotives |
5,610 | 2,740 | 8,350 | N/A | ||||
| Freight cars | Owned | Leased | Total |
Average | ||||
| Covered hoppers |
12,764 | 20,024 | 32,788 | 30.1 | ||||
| Open hoppers |
12,615 | 4,936 | 17,551 | 30.2 | ||||
| Gondolas |
6,730 | 6,374 | 13,104 | 27.3 | ||||
| Boxcars |
5,891 | 2,312 | 8,203 | 27.1 | ||||
| Refrigerated cars |
2,630 | 4,484 | 7,114 | 21.6 | ||||
| Flat cars |
3,101 | 734 | 3,835 | 32.0 | ||||
| Other |
104 | 498 | 602 | N/A | ||||
| Total freight cars |
43,835 | 39,362 | 83,197 | N/A | ||||
Capital Expenditures – Our rail network requires significant annual capital investments for replacement, improvement, and expansion. These investments enhance safety, support the transportation needs of our customers, and improve our operational efficiency. Additionally, we add new locomotives and freight cars to our fleet to replace older, less efficient equipment, to support growth and customer demand, and to reduce our impact on the environment through the acquisition of more fuel efficient and low-emission locomotives.
2009 Capital Expenditures – During 2009, we made capital investments totaling $2.5 billion, which included cash spending of $2.4 billion (see the capital expenditures table in Management’s Discussion
16
Table of Contents
and Analysis of Financial Condition and Results of Operations – Liquidity and Capital Resources – Financial Condition, Item 7). Our capital plan included the acquisition of 127 locomotives at a cost of $287 million. We financed 44 of the 127 locomotives with a value of $100 million through a capital lease financing.
Infrastructure Expansion – With expected long-term growth in the intermodal market, we commenced construction of a new intermodal terminal in Joliet, Illinois in August 2009, with completion of the initial phase scheduled in August 2010. This new facility will support customer growth by increasing the Railroad’s international and domestic container capacity and improving rail traffic efficiencies in Chicago, the nation’s largest rail center. Once on line, customers from across our network will benefit from the Joliet facility’s annual capacity of 500,000 ocean-going containers. The integrated facility will include four 8,000-foot working tracks plus twelve 8,000-foot support tracks to stage and switch rail cars; 3,400 parking stalls; four cranes; an advanced yard system that coordinates all movement of rail cars, trucks, trailers and containers at the facility; and advanced gate technology and security systems.
2010 Capital Expenditures – In 2010, we expect to make capital investments of approximately $2.5 billion, including expenditures for PTC, which may be revised if business conditions or new laws or regulations affect our ability to generate sufficient returns on these investments. See discussion of our 2010 capital plan in Management’s Discussion and Analysis of Financial Condition and Results of Operations – 2010 Outlook, Item 7.
Equipment Encumbrance – Equipment with a carrying value of approximately $3.4 billion and $2.7 billion at December 31, 2009 and 2008, respectively, serves as collateral for capital leases and other types of equipment obligations in accordance with the secured financing arrangements utilized to acquire such railroad equipment.
As a result of the merger of Missouri Pacific Railroad Company (MPRR) with and into UPRR on January 1, 1997, and pursuant to the underlying indentures for the MPRR mortgage bonds, UPRR must maintain the same value of assets after the merger in order to comply with the security requirements of the mortgage bonds. As of the merger date, the value of the MPRR assets that secured the mortgage bonds was approximately $6.0 billion. In accordance with the terms of the indentures, this collateral value must be maintained during the entire term of the mortgage bonds irrespective of the outstanding balance of such bonds.
Environmental Matters – Certain of our properties are subject to federal, state, and local laws and regulations governing the protection of the environment (see discussion of environmental issues in Business – Governmental and Environmental Regulation, Item 1, and Management’s Discussion and Analysis of Financial Condition and Results of Operations – Critical Accounting Policies – Environmental, Item 7).
From time to time, we are involved in legal proceedings, claims, and litigation that occur in connection with our business. We routinely assess our liabilities and contingencies in connection with these matters based upon the latest available information and, when necessary, we seek input from our third-party advisors when making these assessments. Consistent with SEC rules and requirements, we describe below material pending legal proceedings (other than ordinary routine litigation incidental to our business), material proceedings known to be contemplated by governmental authorities, other proceedings arising under federal, state, or local environmental laws and regulations (including governmental proceedings involving potential fines, penalties, or other monetary sanctions in excess of $100,000) and such other pending matters that we may determine to be appropriate.
17
Table of Contents
ENVIRONMENTAL MATTERS
As we reported in our Annual Report on Form 10-K for 2005, the EPA considers the Railroad a potentially responsible party for the Omaha Lead Site. The Omaha Lead Site consists of approximately 25 square miles of residential property in the eastern part of Omaha, Nebraska, allegedly impacted by air emissions from two former lead smelters/refineries. One refinery was operated by ASARCO. The EPA identified the Railroad as a potentially responsible party because more than 60 years ago the Railroad owned land that was leased to ASARCO. The Railroad disputes both the legal and technical basis of the EPA’s allegations. It has nonetheless engaged in extensive negotiations with the EPA. These negotiations reached an apparent impasse. The EPA issued a Unilateral Administrative Order with an effective date of December 16, 2005, directing the Railroad to implement an interim remedy at the site at an estimated cost of $50 million. Failure to comply with the order without just cause could subject the Railroad to penalties of up to $32,500 per day and triple the EPA’s costs in performing the work. The Railroad believes it has just cause not to comply with the order, but it offered to perform some of the work specified in the order as a compromise. On August 5, 2009, the Railroad received a Special Notice Letter from EPA directing us to perform environmental remediation at approximately 9,000 residential yards in Omaha and to take other remedial measures as part of a final remedy. The Railroad continues to contest its purported liability for these costs but has submitted an offer to the EPA to attempt to negotiate a resolution of the matter. To date, the EPA has rejected all of the Railroad’s offers to settle or resolve this matter.
As we reported in our Annual Report on Form 10-K for 2005, the Illinois Attorney General’s office filed a complaint against the Railroad in the Circuit Court for the Twentieth Judicial Circuit (St. Clair County) for injunctive and other relief on November 28, 2005, alleging a diesel fuel spill from an above-ground storage tank in a rail yard in Dupo, St. Clair County, Illinois. The State of Illinois seeks to enjoin UPRR from further violations and a monetary penalty. The amount of the proposed penalty, although uncertain, could exceed $100,000.
As we reported in our Quarterly Report on Form 10-Q for the quarter ended June 30, 2008, the Railroad received notice from the United States Department of Justice on May 8, 2008, indicating its intent to file suit for civil penalties in connection with a March 6, 2005 derailment near Kamela, Oregon. The derailment resulted in the release of approximately 900 gallons of diesel fuel from ruptured fuel tanks of derailed refrigerator cars. Some of this fuel entered Dry Creek, a tributary to the Grande Ronde River. While the amount of the ultimate penalty is uncertain, it could exceed $100,000. Additionally, on June 9, 2009, the Oregon Department of Environmental Quality notified the Railroad that it would be seeking $40,000 in civil penalties from the Railroad under state law in connection with this incident.
As we reported in our Annual Report on Form 10-K for 2008, the Colorado Department of Public Health and Environment issued a Notice of Violation/Cease and Desist Order to the Railroad on April 26, 2007, involving certain alleged violations of the Railroad’s stormwater permits at its Burnham Shops and North Yard facilities in Denver, Colorado. The Order required the Railroad, among other things, to evaluate the effectiveness of the best management practices (BMPs) that were in place to control stormwater and pollutant discharges from the regulated portions of those facilities, take appropriate remedial actions, implement additional BMPs to control the discharge of pollutants at each of the facilities, and report the results of its evaluation and demonstrate compliance with its stormwater permits to the agency. The Railroad and the Colorado Department of Public Health and Environment reached an agreement during the fourth quarter of 2009 under which we will pay a penalty of $106,808 to resolve these matters.
We received notices from the EPA and state environmental agencies alleging that we are or may be liable under federal or state environmental laws for remediation costs at various sites throughout the United States, including sites on the Superfund National Priorities List or state superfund lists. We cannot predict the ultimate impact of these proceedings and suits because of the number of potentially responsible parties involved, the degree of contamination by various wastes, the scarcity and quality of volumetric data related to many of the sites, and the speculative nature of remediation costs.
18
Table of Contents
Information concerning environmental claims and contingencies and estimated remediation costs is set forth in Management’s Discussion and Analysis of Financial Condition and Results of Operations – Critical Accounting Policies – Environmental, Item 7.
OTHER MATTERS
As we reported in our Quarterly Report on Form 10-Q for the quarter ended June 30, 2007, 20 small rail shippers (many of whom are represented by the same law firms) filed virtually identical antitrust lawsuits in various federal district courts against us and four other Class I railroads in the U.S. The original plaintiff filed the first of these claims in the U.S. District Court in New Jersey on May 14, 2007, and the additional plaintiffs filed claims in district courts in various states, including Florida, Illinois, Alabama, Pennsylvania, and the District of Columbia. These suits allege that the named railroads engaged in price-fixing by establishing common fuel surcharges for certain rail traffic.
We received additional complaints following the initial claim, increasing the total number of complaints to 30. In addition to suits filed by direct purchasers of rail transportation, a few of the suits involve plaintiffs alleging that they are or were indirect purchasers of rail transportation and seek to represent a purported class of indirect purchasers of rail transportation that paid fuel surcharges. These complaints have added allegations under state antitrust and consumer protection laws. On November 6, 2007, the Judicial Panel on Multidistrict Litigation ordered that all of the rail fuel surcharge cases be transferred to Judge Paul Friedman of the U.S. District Court in the District of Columbia for coordinated or consolidated pretrial proceedings. Subsequently, the direct purchaser plaintiffs and the indirect purchaser plaintiffs filed Consolidated Amended Class Action Complaints against UPRR and three other Class I railroads.
One additional shipper filed a separate anti-trust suit during 2008. Subsequently, the shipper voluntarily dismissed the action without prejudice.
On October 10, 2008, Judge Friedman heard oral arguments with respect to the defendant railroads’ motions to dismiss. In a ruling on November 7, 2008, Judge Friedman denied the motion with respect to the direct purchasers’ complaint, and, therefore, that case has moved into discovery. On December 31, 2008, Judge Friedman ruled that the allegations of the indirect purchasers based upon state antitrust, consumer protection and unjust enrichment laws must be dismissed. He also ruled, however, that the plaintiffs can proceed with their claim for injunctive relief under the federal antitrust laws, which is identical to a claim by the direct purchaser plaintiffs. The indirect purchasers are appealing Judge Friedman’s ruling to the U.S. Court of Appeals for the District of Columbia.
We deny the allegations that our fuel surcharge programs violate the antitrust laws or any other laws. We believe that these lawsuits are without merit, and we will vigorously defend our actions. Therefore, we currently believe that these matters will not have a material adverse effect on any of our results of operations, financial condition, and liquidity.
Item 4. Submission of Matters to a Vote of Security Holders
No matters were submitted to a vote of security holders during the fourth quarter of 2009.
19
Table of Contents
Executive Officers of the Registrant and Principal Executive Officers of Subsidiaries
The Board of Directors typically elects and designates our executive officers on an annual basis at the board meeting held in conjunction with the Annual Meeting of Shareholders, and they hold office until their successors are elected. Executive officers also may be elected and designated throughout the year, as the Board of Directors considers appropriate. There are no family relationships among the officers, nor any arrangement or understanding between any officer and any other person pursuant to which the officer was selected. The following table sets forth certain information, as of February 1, 2010, relating to the executive officers.
| Name |
Position |
Age |
Business | |||
| James R. Young |
Chairman, President and Chief Executive Officer of UPC and the Railroad |
57 | [1] | |||
| Robert M. Knight, Jr. |
Executive Vice President – Finance and Chief Financial Officer of UPC and the Railroad |
52 | Current Position | |||
| J. Michael Hemmer |
Senior Vice President – Law and General Counsel of UPC and the Railroad |
60 | Current Position | |||
| Barbara W. Schaefer |
Senior Vice President – Human Resources and Secretary of UPC and the Railroad |
56 | Current Position | |||
| Jeffrey P. Totusek |
Vice President and Controller of UPC and Chief Accounting Officer and Controller of the Railroad |
51 | [2] | |||
| Dennis J. Duffy |
Vice Chairman – Operations of the Railroad |
59 | [3] | |||
| John J. Koraleski |
Executive Vice President – Marketing and Sales of the Railroad |
59 | Current Position | |||
| [1] | Mr. Young was elected Chief Executive Officer and President of UPC and the Railroad effective January 1, 2006. He was elected to the additional position of Chairman effective February 1, 2007. He was elected President and Chief Operating Officer of the Railroad, effective February 1, 2004, and he previously was Executive Vice President – Finance of UPC and Chief Financial Officer of the Railroad. |
| [2] | Mr. Totusek was elected to his current position effective January 1, 2008. He previously was Assistant Vice President – Financial Analysis of the Railroad. |
| [3] | Mr. Duffy was elected to his current position effective January 1, 2010. He previously was Executive Vice President – Operations of the Railroad. |
20
Table of Contents
PART II
| Item 5. | Market for the Registrant’s Common Equity, Related Stockholder Matters, and Issuer Purchases of Equity Securities |
Our common stock is traded on the NYSE under the symbol “UNP”. On May 28, 2008, we completed a two-for-one stock split, effected in the form of a 100% stock dividend. The stock split entitled all shareholders of record at the close of business on May 12, 2008, to receive one additional share of our common stock, par value $2.50 per share, for each share of common stock held on that date. All references to common shares and per share information have been restated to reflect the stock split for all periods presented. The following table presents the dividends declared and the high and low closing prices of our common stock for each of the indicated quarters.
| 2009 - Dollars Per Share | Q1 | Q2 | Q3 |
Q4 | ||||||||
| Dividends |
$ | 0.27 | $ | 0.27 | $ | 0.27 | $ | 0.27 | ||||
| Common stock price: |
||||||||||||
| High |
54.66 | 55.45 | 64.75 | 66.73 | ||||||||
| Low |
33.28 | 39.82 | 47.47 | 54.20 | ||||||||
| 2008 - Dollars Per Share | ||||||||||||
| Dividends |
$ | 0.22 | $ | 0.22 | $ | 0.27 | $ | 0.27 | ||||
| Common stock price: |
||||||||||||
| High |
65.29 | 82.76 | 85.80 | 71.78 | ||||||||
| Low |
52.66 | 62.98 | 67.34 | 41.84 | ||||||||
At January 29, 2010, there were 505,286,368 shares of outstanding common stock and 34,116 common shareholders of record. On that date, the closing price of the common stock on the NYSE was $60.50. We have paid dividends to our common shareholders during each of the past 110 years. We declared dividends totaling $544 million in 2009 and $501 million in 2008. On July 31, 2008, we increased the quarterly dividend to $0.27 per share, payable beginning on October 1, 2008, to shareholders of record on August 29, 2008. We are subject to certain restrictions regarding retained earnings with respect to the payment of cash dividends to our shareholders. The amount of retained earnings available for dividends increased to $11.7 billion at December 31, 2009, from $10.5 billion at December 31, 2008. See discussion of this restriction in Management’s Discussion and Analysis of Financial Condition and Results of Operations – Liquidity and Capital Resources, Item 7. We do not believe the restriction on retained earnings will affect our ability to pay dividends, and we currently expect to pay dividends in 2010 comparable to 2009.
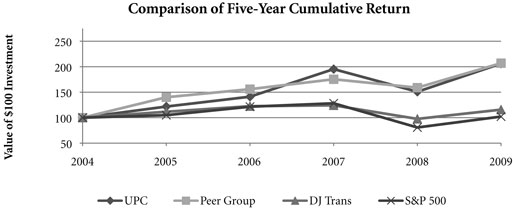
Comparison Over One- and Three-Year Periods – The following table presents the cumulative total shareholder returns, assuming reinvested dividends, over one- and three-year periods for the Corporation, a peer group index (comprised of Burlington Northern Santa Fe Corporation, CSX Corporation, and Norfolk Southern Corporation), the Dow Jones Transportation Index (Dow Jones), and the Standard & Poor’s 500 Stock Index (S&P 500).
| Period | UPC | Peer Group |
Dow Jones |
S&P | ||||
| 1 Year (2009) |
36.6% | 31.1% | 18.6% | 26.5% | ||||
| 3 Year (2007-2009) |
46.0 | 33.5 | (5.5) | (15.9) |
21
Table of Contents
Five-Year Performance Comparison – The following graph provides an indicator of cumulative total shareholder returns for the Corporation as compared to the peer group index (described above), the Dow Jones, and the S&P 500. The graph assumes that the value of the investment in the common stock of Union Pacific Corporation and each index was $100 on December 31, 2004, and that all dividends were reinvested.
Purchases of Equity Securities – During 2009, we repurchased shares of our common stock at an average price of $55.48 solely in connection with transactions with employees under equity compensation arrangements. The following table presents common stock repurchases during each month for the fourth quarter of 2009:
| Period | Total Number of Shares Purchased [a] |
Average Price Paid Per Share |
Total Number of Shares |
Maximum Number of Shares That May Yet Be Purchased Under the Plan or Program [b] | |||||
| Oct. 1 through Oct. 31 |
5,508 | $ | 63.62 | — | 32,577,090 | ||||
| Nov. 1 through Nov. 30 |
69,523 | 64.90 | — | 32,577,090 | |||||
| Dec. 1 through Dec. 31 |
13,150 | 65.48 | — | 32,577,090 | |||||
| Total |
88,181 | $ | 64.91 | — | N/A | ||||
| [a] | Total number of shares purchased during the quarter represents shares delivered or attested to UPC by employees to pay stock option exercise prices, satisfy excess tax withholding obligations for stock option exercises or vesting of retention units, and pay withholding obligations for vesting of retention shares. |
| [b] | On January 30, 2007, our Board of Directors authorized us to repurchase up to 40 million shares of our common stock through December 31, 2009. On May 1, 2008, our Board of Directors authorized additional repurchases of up to 40 million shares of our common stock through March 31, 2011. We did not repurchase any shares under this publicly announced plan during 2009. These repurchases may be made on the open market or through other transactions. Our management has sole discretion with respect to determining the timing and amount of these transactions. |
22
Table of Contents
Item 6. Selected Financial Data
The following table presents as of, and for the years ended, December 31, our selected financial data for each of the last five years. The selected financial data should be read in conjunction with Management’s Discussion and Analysis of Financial Condition and Results of Operations, Item 7, and with the Financial Statements and Supplementary Data, Item 8. The information below is not necessarily indicative of future financial condition or results of operations.
| Millions of Dollars, Except per Share Amounts, Carloads, Employee Statistics, and Ratios |
2009 | 2008 | 2007 | 2006 | 2005 [a] | ||||||||||||||
| For the Year Ended December 31 |
|||||||||||||||||||
| Operating revenues [b] |
$ | 14,143 | $ | 17,970 | $ | 16,283 | $ | 15,578 | $ | 13,578 | |||||||||
| Operating income |
3,392 | 4,075 | 3,375 | 2,884 | 1,795 | ||||||||||||||
| Net income |
1,898 | 2,338 | 1,855 | 1,606 | 1,026 | ||||||||||||||
| Earnings per share - basic [c] |
3.77 | 4.58 | 3.49 | 2.98 | 1.95 | ||||||||||||||
| Earnings per share - diluted [c] |
3.75 | 4.54 | 3.46 | 2.95 | 1.92 | ||||||||||||||
| Dividends declared per share [c] |
1.08 | 0.98 | 0.745 | 0.60 | 0.60 | ||||||||||||||
| Cash provided by operating activities |
3,234 | 4,070 | 3,277 | 2,880 | 2,595 | ||||||||||||||
| Cash used for capital investments |
(2,384) | (2,780 | ) | (2,496 | ) | (2,242 | ) | (2,169 | ) | ||||||||||
| Cash used for common share repurchases |
- | (1,609 | ) | (1,375 | ) | - | - | ||||||||||||
| At December 31 |
|||||||||||||||||||
| Total assets |
$ | 42,410 | $ | 39,722 | $ | 38,033 | $ | 36,515 | $ | 35,620 | |||||||||
| Debt due after one year |
9,636 | 8,607 | 7,543 | 6,000 | 6,760 | ||||||||||||||
| Common shareholders’ equity |
16,941 | 15,447 | 15,585 | 15,312 | 13,707 | ||||||||||||||
| Equity per common share [d] |
33.54 | 30.70 | 29.87 | 28.34 | 25.70 | ||||||||||||||
| Additional Data |
|||||||||||||||||||
| Freight revenues [b] |
$ | 13,373 | $ | 17,118 | $ | 15,486 | $ | 14,791 | $ | 12,856 | |||||||||
| Revenue carloads (units) (000) |
7,786 | 9,261 | 9,733 | 9,852 | 9,544 | ||||||||||||||
| Operating margin (%) [e] |
24.0 | 22.7 | 20.7 | 18.5 | 13.2 | ||||||||||||||
| Operating ratio (%) [e] |
76.0 | 77.3 | 79.3 | 81.5 | 86.8 | ||||||||||||||
| Average employees (000) |
43.5 | 48.2 | 50.1 | 50.7 | 49.7 | ||||||||||||||
| Operating revenues per employee (000) |
$ | 325.1 | $ | 372.8 | $ | 325.0 | $ | 307.2 | $ | 273.2 | |||||||||
| Financial Ratios (%) |
|||||||||||||||||||
| Debt to capital [f] |
36.8 | 36.6 | 33.0 | 30.7 | 35.1 | ||||||||||||||
| Return on average common shareholders’ equity [g] |
11.7 | 15.1 | 12.0 | 11.1 | 7.8 | ||||||||||||||
| [a] | 2005 net income includes a $118 million tax expense reduction to reflect a reduction in the estimated deferred income tax liability. |
| [b] | Includes fuel surcharge revenue of $605 million, $2,323 million, $1,478 million, $1,619 million, and $963 million for 2009, 2008, 2007, 2006, and 2005, respectively, which partially offsets increased operating expenses for fuel. Fuel surcharge revenue is not comparable from year to year due to implementation of new mileage-based fuel surcharge programs in each respective year. See further discussion in Management’s Discussion and Analysis of Financial Condition and Results of Operations – Results of Operations – Operating Revenues, Item 7. |
| [c] | Earnings per share and dividends have been restated to reflect the May 28, 2008 stock split. |
| [d] | Equity per common share is calculated as follows: common shareholders’ equity divided by common shares issued less treasury shares outstanding. Shares have been adjusted to reflect the May 28, 2008 stock split. |
| [e] | Operating margin is defined as operating income divided by operating revenues. Operating ratio is defined as operating expenses divided by operating revenues. |
| [f] | Debt to capital is determined as follows: total debt divided by total debt plus equity. |
| [g] | Return on average common shareholders’ equity is determined as follows: Net income divided by average common shareholders’ equity. |
23
Table of Contents
Item 7. Management’s Discussion and Analysis of Financial Condition and Results of Operations
The following discussion should be read in conjunction with the Consolidated Financial Statements and applicable notes to the Financial Statements and Supplementary Data, Item 8, and other information in this report, including Risk Factors set forth in Item 1A and Critical Accounting Policies and Cautionary Information at the end of this Item 7.
The Railroad, along with its subsidiaries and rail affiliates, is our one reportable operating segment. Although we analyze revenue by commodity group, we analyze the net financial results of the Railroad as one segment due to the integrated nature of our rail network.
EXECUTIVE SUMMARY
2009 Results
| • | Safety – During 2009, we continued our positive, multi-year trend in safety performance by setting records in many of our safety metrics. The employee injury incident rate per 200,000 man-hours declined 12% from 2008 to its lowest level ever. Our continued focus on derailment prevention resulted in a 10% reduction in our incident rate in 2009, with associated costs declining 3%. With respect to public safety, we closed 353 grade crossings to reduce our exposure to incidents. We also continued installing video cameras on our road locomotives, which assist us in reviewing grade crossing incidents, and we now have camera-equipped locomotives in the lead position of over 95% of our road trains. During 2009, we had the lowest number of crossing incidents on record, and the rate of grade crossing incidents per million train miles decreased 11%. Also, we have implemented extensive trespass reduction programs, and trespasser incidents declined 28% during the year. These improvements reflect comprehensive efforts to enhance employee training, increase public education, make targeted capital investments, and eliminate or reduce safety risks. |
| • | Financial Performance – In 2009, we generated operating income of $3.4 billion despite economic conditions that significantly reduced demand for our services across almost all market sectors. While a 16% reduction in volume drove the 17% decrease in operating income, core pricing gains, improved productivity, and cost savings from demand-driven resource adjustments translated into an all-time record operating ratio of 76.0% for 2009, outpacing our previous record of 77.3% set in 2008. Net income of $1.9 billion declined from $2.3 billion in 2008, but resulted in earnings of $3.75 per diluted share for 2009, surpassed only by financial results in 2008. |
| • | Freight Revenues – Our freight revenues declined 22% year-over-year to $13.4 billion. Freight revenues and volumes for all six commodity groups decreased, reflecting adverse economic conditions. Overall, volume decreased 16% in 2009, with the largest declines in automotive and industrial products shipments. Lower fuel surcharges due to lower fuel prices also reduced freight revenues for the year, partially offset by core pricing gains. We continued to focus on improving the reinvestibility of our business and we have repriced approximately 85% of our business since 2004. |
| • | Network Operations – In 2009, we built upon operational improvements achieved during 2008 by significantly improving the fluidity and efficiency of our transportation network, setting records in numerous operational metrics, including velocity, average terminal dwell, freight car utilization and service delivery. Lower volume levels, network management initiatives, and efforts to improve asset utilization were key drivers of our operational improvement. We increased average train speed by 16% and improved car utilization by 8% with ongoing enhancements to our transportation plan and continued efforts to improve train processing at our terminals. In 2009, customer satisfaction improved to record levels, surpassing records established in 2008, an indication that our ongoing efforts to improve operations again translated into better customer service. |
24
Table of Contents
| • | Asset Utilization – In response to economic conditions and lower revenue in 2009, we implemented productivity initiatives to improve efficiency and reduce costs, in addition to adjusting our resources to reflect lower demand. Although varying throughout the year, our resource reductions included removing from service approximately 26% of our road locomotives and 18% of our freight car inventory by year end. We also reduced shift levels at most rail facilities and closed or significantly reduced operations in 30 of our 114 principal rail yards. These demand-driven resource adjustments and our productivity initiatives combined to reduce our workforce by 10%. |
| • | Fuel Prices – As the economy worsened during the third and fourth quarters of 2008, fuel prices dropped dramatically, reaching $33.87 per barrel in December 2008, a near five-year low. Throughout 2009, crude oil prices generally increased, ending the year around $80 per barrel. Overall, our average fuel price decreased by 44% in 2009, reducing operating expenses by $1.3 billion compared to 2008. We also reduced our consumption rate by 4% during the year, saving approximately 40 million gallons of fuel. The use of newer, more fuel efficient locomotives; increased use of distributed locomotive power; fuel conservation programs; and improved network operations and asset utilization all contributed to this improvement. |
| • | Free Cash Flow – Cash generated by operating activities totaled $3.2 billion, yielding free cash flow of $515 million in 2009. Free cash flow is defined as cash provided by operating activities, less cash used in investing activities and dividends paid. |
Free cash flow is not considered a financial measure under accounting principles generally accepted in the United States (GAAP) by SEC Regulation G and Item 10 of SEC Regulation S-K. We believe free cash flow is important in evaluating our financial performance and measures our ability to generate cash without additional external financings. Free cash flow should be considered in addition to, rather than as a substitute for, cash provided by operating activities. The following table reconciles cash provided by operating activities (GAAP measure) to free cash flow (non-GAAP measure):
|
Millions of Dollars |
2009 | 2008 | 2007 | ||||||||
| Cash provided by operating activities |
$ | 3,234 | $ | 4,070 | $ | 3,277 | |||||
| Cash used in investing activities |
(2,175) | (2,764 | ) | (2,426 | ) | ||||||
| Dividends paid |
(544) | (481 | ) | (364 | ) | ||||||
| Free cash flow |
$ | 515 | $ | 825 | $ | 487 | |||||
2010 Outlook
| • | Safety – Operating a safe railroad benefits our employees, our customers, our shareholders, and the public. We will continue using a multi-faceted approach to safety, utilizing technology, risk assessment, quality control, and training, and by engaging our employees. We will continue implementing Total Safety Culture (TSC) throughout our operations. TSC is designed to establish, maintain, reinforce, and promote safe practices among co-workers. This process allows us to identify and implement best practices for employee and operational safety. Reducing grade-crossing incidents is a critical aspect of our safety programs, and we will continue our efforts to maintain, upgrade, and close crossings; install video cameras on locomotives; and educate the public about crossing safety through our own programs, various industry programs, and other activities. |
| • | Transportation Plan – To build upon our success in recent years, we will continue evaluating traffic flows and network logistic patterns, which can be quite dynamic from year-to-year, to identify additional opportunities to simplify operations, remove network variability and improve network efficiency and asset utilization. We plan to adjust manpower and our locomotive and rail car fleets to |
25
Table of Contents
| meet customer needs and put us in a position to handle demand changes. We will also continue utilizing industrial engineering techniques to improve productivity. |
| • | Fuel Prices – Uncertainty about the economy makes fuel price projections difficult, and we could see volatile fuel prices during the year, as they are sensitive to global and U.S. domestic demand, refining capacity, geopolitical issues and events, weather conditions and other factors. To reduce the impact of fuel price on earnings, we will continue to seek recovery from our customers through our fuel surcharge programs and to expand our fuel conservation efforts. |
| • | Capital Plan – In 2010, we plan to make total capital investments of approximately $2.5 billion, including expenditures for PTC, which may be revised if business conditions or new laws or regulations affect our ability to generate sufficient returns on these investments. See further discussion in this Item 7 under Liquidity and Capital Resources – Capital Plan. |
| • | Positive Train Control (PTC) – In response to a legislative mandate to implement PTC by the end of 2015, we expect to spend approximately $200 million during 2010 on the development of PTC. We currently estimate that PTC will cost us approximately $1.4 billion to implement by the end of 2015, in accordance with rules issued by the FRA. This includes costs for installing the new system along our tracks, upgrading locomotives to work with the new system, and adding digital data communication equipment so all the parts of the system can communicate with each other. |
| • | Financial Expectations – We remain cautious about economic conditions but expect volume to increase from 2009 levels. In addition, we anticipate continued pricing opportunities and further productivity improvements. |
RESULTS OF OPERATIONS
Operating Revenues
|
Millions of Dollars |
2009 | 2008 | 2007 | % Change 2009 v 2008 |
% Change 2008 v 2007 | ||||||||
| Freight revenues |
$ | 13,373 | $ | 17,118 | $ | 15,486 | (22)% | 11% | |||||
| Other revenues |
770 | 852 | 797 | (10) | 7 | ||||||||
| Total |
$ | 14,143 | $ | 17,970 | $ | 16,283 | (21)% | 10% | |||||
Freight revenues are revenues generated by transporting freight or other materials from our six commodity groups. Freight revenues vary with volume (carloads) and average revenue per car (ARC). Changes in price, traffic mix and fuel surcharges drive ARC. We provide some of our customers with contractual incentives for meeting or exceeding specified cumulative volumes or shipping to and from specific locations, which we record as a reduction to freight revenues based on the actual or projected future shipments. We recognize freight revenues on a percentage-of-completion basis as freight moves from origin to destination. We allocate freight revenues between reporting periods based on the relative transit time in each reporting period and recognize expenses as we incur them.
Other revenues include revenues earned by our subsidiaries, revenues from our commuter rail operations, and accessorial revenues, which we earn when customers retain equipment owned or controlled by us or when we perform additional services such as switching or storage. We recognize other revenues as we perform services or meet contractual obligations.
Freight revenues and volume levels for all six commodity groups decreased during 2009, reflecting continued economic weakness. We experienced the largest volume declines in automotive and industrial
26
Table of Contents
products shipments. Lower fuel surcharges due to lower fuel prices also reduced freight revenues in 2009 compared to 2008. ARC decreased 7% during the full year, driven by lower fuel cost recoveries, partially offset by core pricing gain of approximately 5%. Fuel cost recoveries include fuel surcharge revenue and the impact of resetting the base fuel price for certain traffic, which is described below in more detail.
Freight revenues from five of the six commodity groups increased during 2008, with particularly strong growth from agricultural and energy shipments. While revenues generated from chemical and industrial products shipments grew in 2008 compared to 2007, Hurricanes Gustav and Ike reduced shipments of these commodities. Revenues generated from automotive shipments declined versus 2007. Greater fuel cost recoveries and core pricing improvement combined to increase ARC during 2008. The severe economic downturn during the fourth quarter compounded already declining volumes experienced during the first nine months of 2008 due to ongoing weakness in certain market sectors. As a result, we moved fewer intermodal, automotive, industrial products, and chemical shipments, which more than offset volume growth from agricultural and energy shipments.
Our fuel surcharge programs (excluding index-based contract escalators that contain some provision for fuel) generated freight revenues of $605 million, $2.3 billion, and $1.5 billion in 2009, 2008, and 2007, respectively. Declines in both fuel prices and volume levels drove the lower fuel surcharge amounts in 2009. Fuel surcharge revenues are not comparable across years due to implementation of new mileage-based fuel surcharge programs. As disclosed in our 2006 Annual Report on Form 10-K, the STB issued a decision limiting the manner in which U.S. railroads can calculate fuel surcharges on traffic regulated by the STB. In April 2007, we converted regulated traffic, which represents approximately 22% of our current revenue base, to mileage-based fuel surcharge programs. In addition, we continue to convert portions of our non-regulated traffic to mileage-based fuel surcharge programs. At the time of introduction, we also reset the base fuel price at which the new mileage-based fuel surcharges take effect. Resetting the fuel price at which the fuel surcharge begins, in conjunction with rebasing the affected transportation rate to include a portion of what had been in the fuel surcharge, did not materially change our freight revenue as higher base rates offset lower fuel surcharge revenue.
In 2009, other revenues decreased from 2008 due primarily to lower revenues at our subsidiary that brokers intermodal and automotive services. Accessorial revenues also decreased in 2009 reflecting lower volume levels during the year.
The following tables summarize the year-over-year changes in freight revenues, revenue carloads, and ARC by commodity type:
|
Freight Revenues Millions of Dollars |
2009 | 2008 | 2007 | % Change 2009 v 2008 |
% Change 2008 v 2007 |
|||||||||
| Agricultural |
$ | 2,666 | $ | 3,174 | $ | 2,605 | (16)% | 22 | % | |||||
| Automotive |
854 | 1,344 | 1,458 | (36) | (8) | |||||||||
| Chemicals |
2,102 | 2,494 | 2,287 | (16) | 9 | |||||||||
| Energy |
3,118 | 3,810 | 3,134 | (18) | 22 | |||||||||
| Industrial Products |
2,147 | 3,273 | 3,077 | (34) | 6 | |||||||||
| Intermodal |
2,486 | 3,023 | 2,925 | (18) | 3 | |||||||||
| Total |
$ | 13,373 | $ | 17,118 | $ | 15,486 | (22)% | 11 | % | |||||
27
Table of Contents
|
Revenue Carloads Thousands |
2009 | 2008 | 2007 | % Change 2009 v 2008 |
% Change 2008 v 2007 |
|||||||||
| Agricultural |
865 | 947 | 902 | (9)% | 5 | % | ||||||||
| Automotive |
465 | 667 | 826 | (30) | (19) | |||||||||
| Chemicals |
761 | 885 | 928 | (14) | (5) | |||||||||
| Energy |
2,021 | 2,348 | 2,299 | (14) | 2 | |||||||||
| Industrial Products |
899 | 1,249 | 1,325 | (28) | (6) | |||||||||
| Intermodal |
2,775 | 3,165 | 3,453 | (12) | (8) | |||||||||
| Total |
7,786 | 9,261 | 9,733 | (16)% | (5) | % | ||||||||
| Average Revenue per Car | 2009 | 2008 | 2007 |
% Change |
% Change 2008 v 2007 |
|||||||||
| Agricultural |
$ | 3,080 | $ | 3,352 | $ | 2,888 | (8)% | 16 | % | |||||
| Automotive |
1,838 | 2,017 | 1,766 | (9) | 14 | |||||||||
| Chemicals |
2,761 | 2,818 | 2,464 | (2) | 14 | |||||||||
| Energy |
1,543 | 1,622 | 1,363 | (5) | 19 | |||||||||
| Industrial Products |
2,388 | 2,620 | 2,322 | (9) | 13 | |||||||||
| Intermodal |
896 | 955 | 847 | (6) | 13 | |||||||||
| Average |
$ | 1,718 | $ | 1,848 | $ | 1,591 | (7)% | 16 | % | |||||
| Agricultural Products – Lower volume and fuel surcharges decreased agricultural freight revenue in 2009 versus 2008. Price improvements partially offset these declines. Lower demand in both export and domestic markets led to fewer shipments of corn and feed grains, down 11% in 2009 compared to 2008. Weaker worldwide demand also reduced export shipments of wheat and food grains in 2009 versus 2008.
|
2009 Agricultural Revenue
| |
| Price improvements, fuel surcharges, and volume growth generated higher agricultural freight revenue in 2008 versus 2007. Strong global demand for grain and a weak dollar drove higher shipments of corn and feed grains and shipments of wheat and food grains for 2008. Shipments of ethanol, a grain product used as an alternative fuel and fuel additive, and its co-products (primarily livestock feed) also increased. |
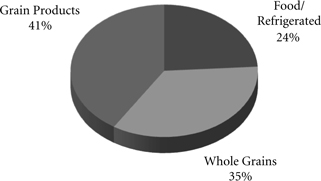
28
Table of Contents
| Automotive – Declines in shipments of finished vehicles and auto parts and lower fuel surcharges reduced freight revenue in 2009 compared to 2008. Vehicle shipments were down 35% and parts were down 24%. Core pricing gains partially offset these declines. These volume declines resulted from economic conditions that reduced sales and vehicle production. In addition, two major domestic automotive manufacturers declared bankruptcy in the second quarter of 2009, affecting production levels. Although the federal Car Allowance Rebate System (the “cash for clunkers” program) helped stimulate vehicle sales and shipments in the third quarter of 2009, production cuts and soft demand throughout the year more than offset the program’s benefits.
Double-digit declines in shipments of both finished vehicles and auto parts drove freight revenue lower in 2008 compared to 2007. |
2009 Automotive Revenue
| |
| Price improvements and fuel surcharges partially offset these lower volumes. The manufacturers experienced poor sales and reduced vehicle production during 2008 due to the recessionary economy, which in turn reduced shipments of finished vehicles and parts. In addition, a major parts supplier strike reduced volume levels compared to 2007. Shipments of finished vehicles decreased 23% in 2008 versus 2007.
| ||
| Chemicals – Reduced volume and fuel surcharges decreased freight revenue from chemical shipments in 2009 versus 2008. Pricing improvements partially offset these declines. Weak market conditions reduced shipments of industrial chemicals in 2009 compared to 2008, driving volume levels down 16%. High inventories, production curtailments, and delayed purchases combined to reduce fertilizer shipments by 29% in 2009. Additionally, business interruptions resulting from Hurricanes Gustav and Ike lowered volume levels in the third quarter of 2008, contributing to a more favorable year-over-year comparison.
|
2009 Chemicals Revenue
| |
| Price improvements and increased fuel surcharges drove higher revenue from chemicals shipments during 2008, which were partially offset by a decrease in volume levels compared to 2007. Weak market conditions and business interruptions in chemical producing areas resulting from Hurricanes Gustav and Ike all contributed to lower industrial chemicals shipments. Plastics shipments also declined in part due to the impact of Hurricanes Gustav and Ike.
|
||
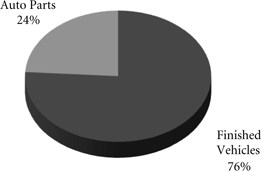
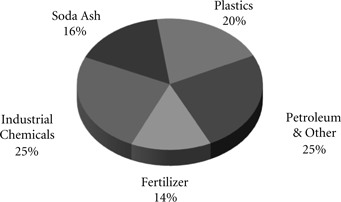
29
Table of Contents
| Energy – Lower volume and fuel surcharges reduced freight revenue from energy shipments in 2009 versus 2008. Price increases partially offset these declines. Shipments from the Southern Powder River Basin of Wyoming (SPRB) and the Colorado and Utah mines decreased 14% and 25%, respectively, in 2009 compared to 2008. Continued economic weakness and high coal inventories resulted in reduced demand at our utility customers, resulting in lower volumes. Production problems at the Colorado and Utah mines and the loss of SPRB customer contracts also contributed to the volume declines.
|
2009 Energy Revenue
| |
| Price increases, fuel surcharges, and higher volume produced revenue growth in 2008 versus 2007. Shipments from the SPRB were up 5% compared to 2007 despite mine flooding and network interruptions caused by extensive flooding in the Midwest in June of 2008. Conversely, shipments from the Colorado and Utah mines were down 4% in 2008 versus 2007, due to mine production problems.
|
||
| Industrial Products – Reduced volume and fuel surcharges resulted in lower freight revenue from industrial products shipments in 2009 versus 2008. Price improvements partially offset these declines. Weak demand and inventory reductions resulting from the economic downturn drove a 53% decline in steel shipments in 2009 compared to 2008. The continued weakness in the housing market reduced lumber shipments, while surplus production and overall market uncertainty resulted in lower paper and newsprint shipments in 2009 versus 2008. In addition, cement and stone shipments declined during the year due to high inventories and weak commercial and residential construction activity.
|
2009 Industrial Products Revenue
| |
| Price improvements and fuel surcharges contributed to higher freight revenue in 2008 compared to 2007. Lower volume partially offset these increases. Continued softening of the housing market and weak market conditions resulted in lower lumber shipments. In addition, cement and stone shipments declined due to a weak overall residential and commercial construction market. Business interruptions resulting from |
||
| the hurricanes also reduced various construction-related shipments, primarily stone. Conversely, we shipped more steel in 2008 than in 2007 as the weak dollar increased the cost of steel imports during most of the year, creating a strong demand for domestic steel. | ||
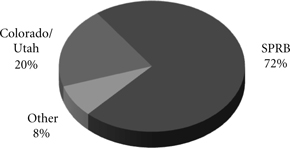
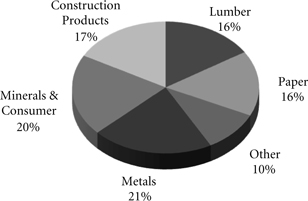
30
Table of Contents
| Intermodal – Decreased volumes and fuel surcharges reduced freight revenue from intermodal shipments in 2009 versus 2008. Volume from international traffic decreased 24% in 2009 compared to 2008, reflecting economic conditions, continued weak imports from Asia, and diversions to non-UPRR served ports. Additionally, continued weakness in the domestic housing and automotive sectors translated into weak demand in large sectors of the international intermodal market, which also contributed to the volume decline. Conversely, domestic traffic increased 8% in 2009 compared to 2008. A new contract with Hub Group, Inc., which included additional shipments, was executed in the second quarter of 2009 and more than offset the impact of weak market conditions in the second half of 2009.
|
2009 Intermodal Revenue
| |
| Price increases and fuel surcharges generated higher revenue in 2008, partially offset by lower volume levels. International traffic declined 11% in 2008, reflecting continued softening of imports from China and the loss of a customer contract. Notably, the peak intermodal shipping season, which usually starts in the third quarter, was particularly weak in 2008. Additionally, continued weakness in domestic housing and automotive sectors translated into weak demand in large sectors of the international intermodal market, which also contributed to lower volumes. Domestic traffic declined 3% in 2008 due to the loss of a customer contract and lower volumes from less-than-truckload shippers. Additionally, the flood-related embargo on traffic in the Midwest during the second quarter hindered intermodal volume levels in 2008. | ||
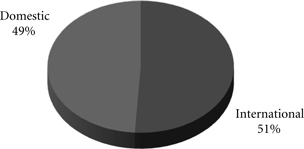
Mexico Business – Each of our commodity groups include revenue from shipments to and from Mexico. Revenue from Mexico business decreased 26% in 2009 versus 2008 to $1.2 billion. Volume declined in five of our six commodity groups, down 19% in 2009, driven by 32% and 24% reductions in industrial products and automotive shipments, respectively. Conversely, energy shipments increased 9% in 2009 versus 2008, partially offsetting these declines.
Revenue from Mexico business increased 13% to $1.6 billion in 2008 compared to 2007. Price improvements and fuel surcharges contributed to these increases, partially offset by a 4% decline in volume in 2008 compared to 2007.
Operating Expenses
| Millions of Dollars | 2009 | 2008 | 2007 |
% Change |
% Change 2008 v 2007 |
|||||||||
| Compensation and benefits |
$ | 4,063 | $ | 4,457 | $ | 4,526 | (9)% | (2 | )% | |||||
| Fuel |
1,763 | 3,983 | 3,104 | (56) | 28 | |||||||||
| Purchased services and materials |
1,614 | 1,902 | 1,856 | (15) | 2 | |||||||||
| Depreciation |
1,444 | 1,387 | 1,321 | 4 | 5 | |||||||||
| Equipment and other rents |
1,180 | 1,326 | 1,368 | (11) | (3 | ) | ||||||||
| Other |
687 | 840 | 733 | (18) | 15 | |||||||||
| Total |
$ | 10,751 | $ | 13,895 | $ | 12,908 | (23)% | 8 | % | |||||
31
Table of Contents
| Operating expenses decreased $3.1 billion in 2009 versus 2008. Our fuel price per gallon declined 44% during the year, decreasing operating expenses by $1.3 billion compared to 2008. Cost savings from lower volume, productivity improvements, and better resource utilization also decreased operating expenses in 2009. In addition, lower casualty expense resulting primarily from improving trends in safety performance decreased operating expenses in the year. Conversely, wage and benefit inflation partially offset these reductions.
|
2009 Operating Expenses
| |
| Operating expenses increased $987 million in 2008. Our fuel price per gallon rose 39% during the year, increasing operating expenses by $1.1 billion compared to 2007. Wage, benefit, and materials inflation, higher depreciation, and costs associated with the January Cascade mudslide and Hurricanes Gustav and Ike also increased expenses during the year. Cost savings from productivity improvements, better resource utilization, and lower volume helped offset these increases. |
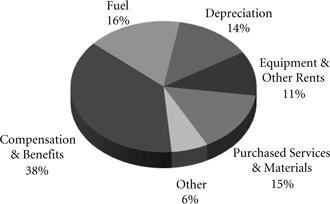
Compensation and Benefits – Compensation and benefits include wages, payroll taxes, health and welfare costs, pension costs, other postretirement benefits, and incentive costs. Lower volume and productivity initiatives led to a 10% decline in our workforce in 2009 compared to 2008, saving $516 million during the year. Conversely, general wage and benefit inflation increased expenses, partially offsetting these savings.
Productivity initiatives in all areas, combined with lower volume, led to a 4% decline in our workforce for 2008, saving $227 million compared to 2007. Conversely, general wage and benefit inflation and higher pension and postretirement benefits increased expenses in 2008, partially offsetting these reductions.
Fuel – Fuel includes locomotive fuel and gasoline for highway and non-highway vehicles and heavy equipment. Lower diesel fuel prices, which averaged $1.75 per gallon (including taxes and transportation costs) in 2009 compared to $3.15 per gallon in 2008, reduced expenses by $1.3 billion. Volume, as measured by gross ton-miles, decreased 17% in the year, lowering expenses by $664 million compared to 2008. Our fuel consumption rate improved 4% in 2009, resulting in $147 million of cost savings versus 2008. Newer, more fuel efficient locomotives reflecting locomotive acquisitions in recent years and the impact of a smaller fleet due to storage of some of our older locomotives; increased use of distributed locomotive power; our fuel conservation programs; and improved network operations all drove this improvement. Distributed locomotive power is the practice of distributing locomotives throughout a train rather than positioning all of them in the lead resulting in safer and more efficient train operations.
Diesel fuel prices, which averaged $3.15 per gallon (including taxes and transportation costs) in 2008 compared to $2.27 per gallon in 2007, increased expenses by $1.1 billion. A 4% improvement in our fuel consumption rate resulted in $136 million of cost savings due to the use of newer, more fuel efficient locomotives; our fuel conservation programs; improved network operations; and a shift in commodity mix, primarily due to growth in bulk shipments. Volume, as measured by gross ton-miles, decreased 3% in the year, lowering expenses by $101 million compared to 2007.
Purchased Services and Materials – Purchased services and materials expense includes the costs of services purchased from outside contractors; materials used to maintain the Railroad’s lines, structures, and equipment; costs of operating facilities jointly used by UPRR and other railroads; transportation and
32
Table of Contents
lodging for train crew employees; trucking and contracting costs for intermodal containers; leased automobile maintenance expenses; and tools and supplies. Contract services expense (including equipment maintenance) decreased $138 million in 2009 versus 2008 due to lower volume levels and a favorable year-over-year comparison due to expenses incurred in 2008 resulting from Hurricanes Gustav and Ike. In addition, lower volume levels drove cost reductions of $55 million in transportation and lodging costs and $27 million in expenses associated with operating jointly owned facilities in 2009 versus 2008. We also performed fewer locomotive and freight car repairs as a result of lower volumes and having portions of these fleets stored, which reduced related materials expenses by $87 million in 2009 versus 2008. Clean-up and restoration expenses related to the Cascade mudslide in January, flooding in the Midwest in June, and the two September hurricanes also increased expenses in 2008, creating a favorable year-over-year comparison.
In 2008, higher contract costs (including restoration costs related to the January Cascade mudslide, June Midwest flooding, and September hurricanes) increased expenses $40 million compared to 2007. Higher material costs for freight car wheel sets during the year and an increase in the number of wheel sets required to repair flood-damaged freight cars also contributed to higher materials expense in 2008. Conversely, rail scrap proceeds associated with our rail replacement program partially offset these increases for the year.
Depreciation – The majority of depreciation relates to track structure, including rail, ties, and other track material. A higher depreciable asset base, reflecting higher capital spending in recent years, increased depreciation expense in 2009 versus 2008. Costs also increased $34 million in 2009 due to the restructuring of certain locomotive leases (see further discussion in this Item 7 under Liquidity and Capital Resources – Financing Activities). Lower depreciation rates for rail and other track material partially offset the increases. The lower rates, which became effective January 1, 2009, resulted from longer asset lives as determined by service life studies and reduced track usage (based on lower gross ton-miles).
A higher depreciable asset base, reflecting higher capital spending in recent years, increased depreciation expense in 2008 versus 2007.
Equipment and Other Rents – Equipment and other rents expense primarily includes rental expense that the Railroad pays for freight cars owned by other railroads or private companies; freight car, intermodal, and locomotive leases; other specialty equipment leases; and office and other rentals. Fewer shipments of industrial products and intermodal containers primarily contributed to the $85 million reduction in our short-term freight car rental expense in 2009 versus 2008. In addition, the restructuring of locomotive leases reduced lease expense by $52 million in 2009 compared to 2008 (see further discussion in this Item 7 under Liquidity and Capital Resources – Financing Activities). Lower lease expense for freight cars, intermodal containers, and fleet vehicles also decreased costs in 2009 versus 2008.
Fewer shipments of finished vehicles, industrial products and intermodal containers reduced our short term freight car rental expense by $62 million in 2008 compared to 2007. Lower lease expense for freight cars, intermodal containers, and locomotives also decreased costs. Conversely, lease expense for fleet vehicles increased costs in 2008 compared to 2007.
Other – Other expenses include personal injury, freight and property damage, insurance, environmental, bad debt, state and local taxes, utilities, telephone and cellular, employee travel, computer software, and other general expenses. Other costs were lower in 2009 compared to 2008 driven by a reduction in personal injury expense (including asbestos-related claims). We completed actuarial studies of personal injury expenses in both the second and fourth quarters of 2009 and 2008 and annual reviews of asbestos-related claims in both years, which resulted in a net reduction of $55 million in casualty expense in 2009 versus 2008. The reduction reflects improvements in our safety experience and lower estimated costs to resolve claims. In addition, the year-over-year comparison was favorably impacted by $28 million due to
33
Table of Contents
an adverse development with respect to one claim in 2008 and favorable developments in three cases in 2009. Other costs were also lower in 2009 compared to 2008, driven by a decrease in expenses for freight and property damages, employee travel, and utilities. In addition, higher bad debt expense in 2008 due to the uncertain impact of the recessionary economy drove a favorable year-over-year comparison. Conversely, an additional expense of $30 million related to a transaction with Pacer International, Inc. and higher property taxes partially offset lower costs in 2009.
Other costs were higher in 2008 compared to 2007 due to an increase in bad debts, state and local taxes, loss and damage expenses, utility costs, and other miscellaneous expenses totaling $122 million. Conversely, personal injury costs (including asbestos-related claims) were $8 million lower in 2008 compared to 2007. The reduction reflects improvements in our safety experience and lower estimated costs to resolve claims as indicated in the actuarial studies of our personal injury expense and annual reviews of asbestos-related claims in both 2008 and 2007. The year-over-year comparison also includes the negative impact of adverse development associated with one claim in 2008. In addition, environmental and toxic tort expenses were $7 million lower in 2008 compared to 2007.
Non-Operating Items
| Millions of Dollars | 2009 | 2008 | 2007 |
% Change |
% Change 2008 v 2007 | ||||||||||
| Other income |
$ | 195 | $ | 92 | $ | 116 | 112 % | (21)% | |||||||
| Interest expense |
(600) | (511 | ) | (482 | ) | 17 | 6 | ||||||||
| Income taxes |
(1,089) | (1,318 | ) | (1,154 | ) | (17) | 14 | ||||||||
Other Income – Other income increased $103 million in 2009 compared to 2008 primarily due to higher gains from real estate sales, which included the $116 million pre-tax gain from a land sale to the Regional Transportation District (RTD) in Colorado and lower interest expense on our sale of receivables program, resulting from lower interest rates and a lower outstanding balance. Reduced rental and licensing income and lower returns on cash investments, reflecting lower interest rates, partially offset these increases.
Other income decreased in 2008 compared to 2007 due to lower gains from real estate sales and decreased returns on cash investments reflecting lower interest rates. Higher rental and licensing income and lower interest expense on our sale of receivables program partially offset the decreases.
Interest Expense – Interest expense increased in 2009 versus 2008 due primarily to higher weighted-average debt levels. In 2009, the weighted-average debt level was $9.6 billion (including the restructuring of locomotive leases in May of 2009), compared to $8.3 billion in 2008. Our effective interest rate was 6.3% in 2009, compared to 6.1% in 2008.
Interest expense increased in 2008 versus 2007 due to a higher weighted-average debt level of $8.3 billion, compared to $7.3 billion in 2007. A lower effective interest rate of 6.1% in 2008, compared to 6.6% in 2007, partially offset the effects of the higher weighted-average debt level.
Income Taxes – Income taxes were lower in 2009 compared to 2008, driven by lower pre-tax income. Our effective tax rate for the year was 36.5% compared to 36.1% in 2008.
Income taxes were higher in 2008 compared to 2007, driven by higher pre-tax income. Our effective tax rates were 36.1% and 38.4% in 2008 and 2007, respectively. The lower effective tax rate in 2008 resulted from several reductions in tax expense related to federal audits and state tax law changes. In addition, the effective tax rate in 2007 was increased by Illinois legislation that increased deferred tax expense in the third quarter of 2007.
34
Table of Contents
OTHER OPERATING/PERFORMANCE AND FINANCIAL STATISTICS
We report key Railroad performance measures weekly to the Association of American Railroads (AAR), including carloads, average daily inventory of rail cars on our system, average train speed, and average terminal dwell time. We provide this data on our website at www.up.com/investors/reports/index.shtml.
Operating/Performance Statistics
Included in the table below are Railroad performance measures reported to the AAR:
| 2009 | 2008 | 2007 |
% Change |
% Change 2008 v 2007 | ||||||
| Average train speed (miles per hour) |
27.3 | 23.5 | 21.8 | 16 % | 8 % | |||||
| Average terminal dwell time (hours) |
24.8 | 24.9 | 25.1 | - | (1)% | |||||
| Average rail car inventory (thousands) |
283.1 | 300.7 | 309.9 | (6)% | (3)% | |||||
| Gross ton-miles (billions) |
846.5 | 1,020.4 | 1,052.3 | (17)% | (3)% | |||||
| Revenue ton-miles (billions) |
479.2 | 562.6 | 561.8 | (15)% | - | |||||
| Operating ratio |
76.0 | 77.3 | 79.3 | (1.3)pt | (2.0)pt | |||||
| Employees (average) |
43,531 | 48,242 | 50,089 | (10)% | (4)% | |||||
| Customer satisfaction index |
88 | 83 | 79 | 5 pt | 4 pt |
Average Train Speed – Average train speed is calculated by dividing train miles by hours operated on our main lines between terminals. Lower volume levels, ongoing network management initiatives, and productivity improvements contributed to 16% and 8% improvements in average train speed in 2009 and 2008, respectively.
Average Terminal Dwell Time – Average terminal dwell time is the average time that a rail car spends at our terminals. Lower average terminal dwell time improves asset utilization and service. Average terminal dwell time improved slightly in 2009 compared to 2008 and improved 1% in 2008 versus 2007. Lower volumes combined with initiatives to more timely deliver rail cars to our interchange partners and customers improved dwell time in both periods.
Gross and Revenue Ton-Miles – Gross ton-miles are calculated by multiplying the weight of loaded and empty freight cars by the number of miles hauled. Revenue ton-miles are calculated by multiplying the weight of freight by the number of tariff miles. Gross and revenue-ton-miles decreased 17% and 15% in 2009 compared to 2008 due to a 16% decrease in carloads. Commodity mix changes (notably automotive shipments, which were 30% lower in 2009 compared to 2008) drove the difference in declines between gross ton-miles and revenue ton-miles. Gross ton-miles decreased 3%, while revenue ton-miles were flat in 2008 compared to 2007 with commodity mix changes (notably autos and coal) explaining the variance in year over year growth between the two metrics.
Operating Ratio – Operating ratio is defined as our operating expenses as a percentage of operating revenue. Our operating ratios improved 1.3 points to 76.0% in 2009 and 2.0 points to 77.3% in 2008. Core pricing gains, lower fuel prices, network management initiatives, and improved productivity drove the improvement in 2009 and more than offset the 16% volume decline. Price increases, fuel cost recoveries, network management initiatives, and improved productivity drove the improvement in 2008 and more than offset the impact of higher fuel prices.
Employees – Productivity initiatives and lower volumes reduced employee levels 10% throughout the Company in 2009 versus 2008 and 4% in 2008 compared to 2007. Fewer train and engine personnel due
35
Table of Contents
to lower volumes and network initiatives, combined with improved productivity within the support organizations, contributed to the lower full-time equivalent force levels.
Customer Satisfaction Index – Our customer satisfaction survey asks customers to rate how satisfied they are with our performance over the last 12 months on a variety of attributes. A higher score indicates higher customer satisfaction. The improvement in survey results in 2009 and 2008 generally reflects customer recognition of our improving service.
Return on Average Common Shareholders’ Equity
| Millions of Dollars, Except Percentages |
2009 |
2008 | 2007 | ||||||||
| Net income |
$ | 1,898 | $ | 2,338 | $ | 1,855 | |||||
| Average equity |
$ | 16,194 | $ | 15,516 | $ | 15,448 | |||||
| Return on average common shareholders’ equity |
11.7% | 15.1% | 12.0% | ||||||||
|
Return on Invested Capital as Adjusted (ROIC)
|
|||||||||||
| Millions of Dollars, Except Percentages |
2009 |
2008 | 2007 | ||||||||
| Net income |
$ | 1,898 | $ | 2,338 | $ | 1,855 | |||||
| Add: Interest expense |
600 | 511 | 482 | ||||||||
| Add: Sale of receivables fees |
9 | 23 | 35 | ||||||||
| Add: Interest on present value of operating leases |
232 | 299 | 292 | ||||||||
| Less: Taxes on interest and fees |
(307) | (301 | ) | (310 | ) | ||||||
| Net operating profit after taxes as adjusted (a) |
$ | 2,432 | $ | 2,870 | $ | 2,354 | |||||
| Average equity |
$ | 16,194 | $ | 15,516 | $ | 15,448 | |||||
| Add: Average debt |
9,388 | 8,305 | 7,232 | ||||||||
| Add: Average value of sold receivables |
492 | 592 | 600 | ||||||||
| Add: Average present value of operating leases |
3,681 | 3,737 | 3,648 | ||||||||
| Average invested capital as adjusted (b) |
$ | 29,755 | $ | 28,150 | $ | 26,928 | |||||
| Return on invested capital as adjusted (a/b) |
8.2% | 10.2% | 8.7% | ||||||||
ROIC is considered a non-GAAP financial measure by SEC Regulation G and Item 10 of SEC Regulation S-K, and may not be defined and calculated by other companies in the same manner. We believe this measure is important in evaluating the efficiency and effectiveness of the Corporation’s long-term capital investments, and we currently use ROIC as a performance criteria in determining certain elements of equity compensation for our executives. ROIC should be considered in addition to, rather than as a substitute for, other information provided in accordance with GAAP. The most comparable GAAP measure is Return on Average Common Shareholders’ Equity. The tables above provide a reconciliation from return on average common shareholders’ equity to ROIC. Our 2009 ROIC decreased 2.0 points compared to 2008 primarily as a result of lower earnings and higher average debt and equity levels.
36
Table of Contents
Debt to Capital / Adjusted Debt to Capital
| Millions of Dollars, Except Percentages |
2009 |
2008 | ||||
| Debt (a) |
$ | 9,848 | $ | 8,927 | ||
| Equity |
16,941 | 15,447 | ||||
| Capital (b) |
$ | 26,789 | $ | 24,374 | ||
| Debt to capital (a/b) |
36.8% | 36.6% | ||||
| Millions of Dollars, Except Percentages |
2009 |
2008 | ||||
| Debt |
$ | 9,848 | $ | 8,927 | ||
| Net present value of operating leases |
3,672 | 3,690 | ||||
| Value of sold receivables |
400 | 584 | ||||
| Unfunded pension and OPEB |
456 | 733 | ||||
| Adjusted debt (a) |
$ | 14,376 | $ | 13,934 | ||
| Equity |
16,941 | 15,447 | ||||
| Adjusted capital (b) |
$ | 31,317 | $ | 29,381 | ||
| Adjusted debt to capital (a/b) |
45.9% | 47.4% | ||||
Adjusted debt to capital is a non-GAAP financial measure under SEC Regulation G and Item 10 of SEC Regulation S-K. We believe this measure is important to management and investors in evaluating the total amount of leverage in our capital structure, including off-balance sheet lease obligations, which we generally incur in connection with financing the acquisition of locomotives and freight cars and certain facilities. Operating leases were discounted using 6.3% at December 31, 2009 and 8.0% at December 31, 2008. The lower discount rate reflects changes to interest rates and our current financing costs. We monitor the ratio of adjusted debt to capital as we manage our capital structure to balance cost-effective and efficient access to the capital markets with the Corporation’s overall cost of capital. Adjusted debt to capital should be considered in addition to, rather than as a substitute for, debt to capital. The tables above provide a reconciliation from debt to capital to adjusted debt to capital. Our December 31, 2009 debt to capital ratios increased as a result of a $921 million net increase in debt from December 31, 2008. Equity at December 31, 2008, was reduced by $704 million for other comprehensive losses. Other comprehensive losses in 2008 were related primarily to pensions. See Note 9 to our consolidated financial statements in Item 8 for more information.
LIQUIDITY AND CAPITAL RESOURCES
As of December 31, 2009, our principal sources of liquidity included cash, cash equivalents, the sale of certain receivables, and our revolving credit facility, as well as the availability of commercial paper and other sources of financing through the capital markets. We had $1.9 billion of committed credit available under our credit facility, with no borrowings outstanding as of December 31, 2009. We did not make any borrowings under this facility during 2009. The value of the outstanding undivided interest held by investors under the sale of receivables program was $400 million as of December 31, 2009. The sale of receivables program is subject to certain requirements, including maintenance of an investment grade bond rating. If our bond rating were to deteriorate, it could have an adverse impact on our liquidity. Access to commercial paper as well as other capital market financings is dependent on market conditions. Deterioration of our operating results or financial condition due to internal or external factors could negatively impact our ability to utilize commercial paper as a source of liquidity. Access to liquidity through the capital markets is also dependent on our financial stability. We expect that we will continue to
37
Table of Contents
have access to liquidity by issuing bonds to public or private investors based on our assessment of the current condition of the credit markets.
At December 31, 2009, we had a working capital surplus of approximately $1.0 billion, which reflects our decision to maintain additional cash reserves to enhance liquidity in response to difficult economic conditions. At December 31, 2008, we had a working capital deficit of approximately $100 million. Historically, we have had a working capital deficit, which is common in our industry and does not indicate a lack of liquidity. We maintain adequate resources and, when necessary, have access to capital to meet any daily and short-term cash requirements, and we have sufficient financial capacity to satisfy our current liabilities.
|
Cash Flows |
|||||||||||
| Millions of Dollars | 2009 | 2008 | 2007 | ||||||||
| Cash provided by operating activities |
$ | 3,234 | $ | 4,070 | $ | 3,277 | |||||
| Cash used in investing activities |
(2,175) | (2,764 | ) | (2,426 | ) | ||||||
| Cash used in financing activities |
(458) | (935 | ) | (800 | ) | ||||||
| Net change in cash and cash equivalents |
$ | 601 | $ | 371 | $ | 51 | |||||
Operating Activities
Lower net income in 2009, a reduction of $184 million in the outstanding balance of our accounts receivable securitization program, higher pension contributions of $72 million, and changes to working capital combined to decrease cash provided by operating activities compared to 2008. Higher net income and changes in working capital combined to increase cash provided by operating activities in 2008 compared to 2007. In addition, accelerated tax deductions enacted in 2008 on certain new operating assets resulted in lower income tax payments in 2008 versus 2007. Voluntary pension contributions in 2008 totaling $200 million and other pension contributions of $8 million partially offset the year-over-year increase versus 2007.
Investing Activities
Lower capital investments and higher proceeds from asset sales drove the decrease in cash used in investing activities in 2009 versus 2008. Increased capital investments and lower proceeds from asset sales drove the increase in cash used in investing activities in 2008 compared to 2007.
38
Table of Contents
The tables below detail cash capital investments and track statistics for the years ended December 31, 2009, 2008, and 2007:
| Millions of Dollars |
2009 |
2008 | 2007 | ||||||
| Rail and other track material |
$ | 644 | $ | 646 | $ | 628 | |||
| Ties |
449 | 425 | 404 | ||||||
| Ballast |
208 | 243 | 206 | ||||||
| Other [a] |
354 | 386 | 355 | ||||||
| Total road infrastructure replacements |
1,655 | 1,700 | 1,593 | ||||||
| Line expansion and other capacity projects |
162 | 488 | 419 | ||||||
| Commercial facilities |
193 | 254 | 115 | ||||||
| Total capacity and commercial facilities |
355 | 742 | 534 | ||||||
| Locomotives and freight cars |
272 | 164 | 263 | ||||||
| Technology and other |
102 | 174 | 106 | ||||||
| Total cash capital investments |
$ | 2,384 | $ | 2,780 | $ | 2,496 | |||
| [a] Other includes bridges and tunnels, signals, other road assets, and road work equipment.
|
|||||||||
|
2009 |
2008 | 2007 | |||||||
| Track miles of rail replaced |
841 | 810 | 877 | ||||||
| Track miles of rail capacity expansion |
62 | 118 | 79 | ||||||
| New ties installed (thousands) |
4,814 | 4,599 | 4,267 | ||||||
| Miles of track surfaced |
15,128 | 14,454 | 12,328 | ||||||
Capital Plan – In 2010, we expect our total capital investments to be approximately $2.5 billion, which may be revised if business conditions or new laws or regulations affect our ability to generate sufficient returns on these investments. We expect approximately 73% of our 2010 capital investments will replace and improve existing capital assets. Major investment categories include replacing and improving track infrastructure; increasing network and terminal capacity; improving locomotives and freight cars; improving technology, including investing in PTC; and other capital projects. We expect to fund our 2010 cash capital investments through cash generated from operations, the sale or lease of various operating and non-operating properties, issuance of long-term debt, and cash on hand at December 31, 2009. Our annual capital plan is a critical component of our long-term strategic plan, which we expect will enhance the long-term value of the Corporation for our shareholders by providing sufficient resources to (i) replace and improve our existing track infrastructure to provide safe and fluid operations, (ii) increase network efficiency by adding or improving facilities and track, and (iii) make investments that meet customer demand and take advantage of opportunities for long-term growth.
Financing Activities
Cash used in financing activities decreased in 2009 versus 2008. During 2009 we did not repurchase any shares under our common stock repurchase program, compared to $1.6 billion of repurchases in 2008. Additionally, debt repayments were $337 million lower in 2009, partially offset by lower new debt issuances of $1.4 billion and higher dividend payments (we increased our dividend from $0.22 per share to its current level of $0.27 per share, effective in the third quarter of 2008). The restructuring of equipment leases also generated $87 million in cash consideration, further contributing to the decrease (see further discussion in this Item 7 under Liquidity and Capital Resources – Financing Activities). Cash
39
Table of Contents
used in financing activities increased in 2008 versus 2007 due to higher debt repayments of $416 million, an increase of $234 million for the repurchase of common shares (see further discussion of common shares in Market for the Registrant’s Common Equity, Related Stockholder Matters, and Issuer Purchases of Equity Securities - Purchases of Equity Securities Part II, Item 5) and an increase of dividends paid, reflecting a higher quarterly dividend. Higher debt issuances of $676 million partially offset these increases.
Credit Facilities – On December 31, 2009, we had $1.9 billion of credit available under our revolving credit facility (the facility). The facility is designated for general corporate purposes and supports the issuance of commercial paper. We did not draw on the facility during 2009. Commitment fees and interest rates payable under the facility are similar to fees and rates available to comparably rated, investment-grade borrowers. The facility allows borrowings at floating rates based on London Interbank Offered Rates, plus a spread, depending upon our senior unsecured debt ratings. The facility requires Union Pacific Corporation to maintain a debt-to-net-worth coverage ratio as a condition to making a borrowing. At December 31, 2009, and December 31, 2008 (and at all times during these periods), we were in compliance with this covenant.
The definition of debt used for purposes of calculating the debt-to-net-worth coverage ratio includes, among other things, certain credit arrangements, capital leases, guarantees and unfunded and vested pension benefits under Title IV of ERISA. At December 31, 2009, the debt-to-net-worth coverage ratio allowed us to carry up to $33.9 billion of debt (as defined in the facility), and we had $10.4 billion of debt (as defined in the facility) outstanding at that date. Under our current capital plans, we expect to continue to satisfy the debt-to-net-worth coverage ratio; however, many factors beyond our reasonable control (including the Risk Factors in Item 1A of this report) could affect our ability to comply with this provision in the future. The facility does not include any other financial restrictions, credit rating triggers (other than rating-dependent pricing), or any other provision that could require us to post collateral. The facility also includes a $75 million cross-default provision and a change-of-control provision. The facility will expire in April 2012 in accordance with its terms, and we currently intend to replace the facility with a substantially similar credit agreement on or before the expiration date, which is consistent with our past practices with respect to our credit facilities.
At December 31, 2009, we had no commercial paper outstanding. Our commercial paper balance is supported by our revolving credit facility but does not reduce the amount of borrowings available under the facility. During 2009, we issued $100 million of commercial paper and repaid $200 million.
At December 31, 2009, we reclassified as long-term debt approximately $320 million of debt due within one year that we intend to refinance. This reclassification reflected our ability and intent to refinance any short-term borrowings and certain current maturities of long-term debt on a long-term basis. At December 31, 2008, we reclassified as long-term debt approximately $400 million of debt due within one year that we intended to refinance at that time.
Ratio of Earnings to Fixed Charges
For each of the years ended December 31, 2009, 2008, and 2007, our ratio of earnings to fixed charges was 4.9, 5.9, and 5.1, respectively. The ratio of earnings to fixed charges was computed on a consolidated basis. Earnings represent income from continuing operations, less equity earnings net of distributions, plus fixed charges and income taxes. Fixed charges represent interest charges, amortization of debt discount, and the estimated amount representing the interest portion of rental charges. See Exhibit 12 to this report for the calculation of the ratio of earnings to fixed charges.
40
Table of Contents
Common Shareholders’ Equity
Dividend Restrictions – Our revolving credit facility includes a debt-to-net worth covenant that, under certain circumstances, restricts the payment of cash dividends to our shareholders. The amount of retained earnings available for dividends was $11.7 billion and $10.5 billion at December 31, 2009 and 2008, respectively.
Stock Split – On May 28, 2008, we completed a two-for-one stock split, effected in the form of a 100% stock dividend. The stock split entitled all shareholders of record at the close of business on May 12, 2008, to receive one additional share of our common stock, par value $2.50 per share, for each share of common stock held on that date.
Share Repurchase Program – On January 30, 2007, our Board of Directors authorized the repurchase of up to 40 million shares of Union Pacific Corporation common stock through the end of 2009. On May 1, 2008, our Board of Directors authorized the repurchase of an additional 40 million common shares by March 31, 2011. Management’s assessments of market conditions and other pertinent facts guide the timing and volume of all repurchases. During 2009, we did not repurchase shares under this program. In 2008, we repurchased approximately 22 million shares at an aggregate purchase price of approximately $1.5 billion. These shares were recorded in treasury stock at cost, which includes any applicable commissions and fees. If we elect to make repurchases of our common stock under this program in 2010, we expect to fund such repurchases through cash generated from operations, the sale or lease of various operating and non-operating properties, debt issuances, and cash on hand.
Shelf Registration Statement and Significant New Borrowings – Under our current shelf registration statement, we may issue, from time to time, any combination of debt securities, preferred stock, common stock, or warrants for debt securities or preferred stock in one or more offerings. In July 2008, our Board of Directors authorized the issuance of an additional $3 billion of debt securities under our shelf registration. At December 31, 2009, we had remaining authority to issue up to $2.25 billion of debt securities.
During 2009, we issued the following unsecured, fixed-rate debt securities under our current shelf registration:
| Date | Description of Securities | |
| February 20, 2009 |
$350 million of 5.125% Notes due February 15, 2014 | |
| February 20, 2009 |
$400 million of 6.125% Notes due February 15, 2020 | |
The net proceeds from these offerings were for general corporate purposes, including the repurchase of common stock pursuant to our share repurchase program. These debt securities include change-of-control provisions.
We have no immediate plans to issue equity securities; however, we will continue to explore opportunities to replace existing debt or access capital through issuances of debt securities under our shelf registration, and, therefore, we may issue additional debt securities at any time.
During the second quarter of 2009, we restructured lease agreements for 813 locomotives resulting in a change in lease classification from operating to capital. As part of the restructuring arrangements, we received $87 million in cash consideration. We recorded capital lease assets of approximately $742 million and related capital lease obligations totaling approximately $843 million. Included in our capital lease obligations is the $87 million in cash consideration and $14 million of accrued operating lease
41
Table of Contents
payables that were reclassified as part of our capital lease obligations. Capital lease obligations are reported in our Consolidated Statements of Financial Position as debt.
On October 15, 2009, we entered into a capital lease agreement for 44 locomotives with a total equipment cost of $100 million. The lessor purchased the 44 locomotives from the Corporation and subsequently leased the locomotives back to the Railroad. These capital lease obligations are reported in our Consolidated Statements of Financial Position as debt at December 31, 2009.
Off-Balance Sheet Arrangements, Contractual Obligations, and Commercial Commitments
As described in the notes to the Consolidated Financial Statements and as referenced in the tables below, we have contractual obligations and commercial commitments that may affect our financial condition. Based on our assessment of the underlying provisions and circumstances of our contractual obligations and commercial commitments, including material sources of off-balance sheet and structured finance arrangements, other than the risks that we and other similarly situated companies face with respect to the condition of the capital markets (as described in Item 1A of Part II of this report), there is no known trend, demand, commitment, event, or uncertainty that is reasonably likely to occur that would have a material adverse effect on our consolidated results of operations, financial condition, or liquidity. In addition, our commercial obligations, financings, and commitments are customary transactions that are similar to those of other comparable corporations, particularly within the transportation industry.
The following tables identify material obligations and commitments as of December 31, 2009:
| Payments Due by December 31, | ||||||||||||||||||||||||
| Contractual Obligations Millions of Dollars |
Total | 2010 | 2011 | 2012 | 2013 | 2014 |
After |
Other | ||||||||||||||||
| Debt [a] |
$ | 12,645 | $ | 846 | $ | 896 | $ | 1,104 | $ | 985 | $ | 951 | $ | 7,863 | $ | - | ||||||||
| Operating leases |
5,312 | 576 | 570 | 488 | 425 | 352 | 2,901 | - | ||||||||||||||||
| Capital lease obligations [b] |
2,975 | 290 | 292 | 247 | 256 | 267 | 1,623 | - | ||||||||||||||||
| Purchase obligations [c] |
2,738 | 386 | 317 | 242 | 249 | 228 | 1,284 | 32 | ||||||||||||||||
| Other post retirement benefits [d] |
435 | 41 | 42 | 43 | 43 | 44 | 222 | - | ||||||||||||||||
| Income tax contingencies [e] |
61 | 1 | - | - | - | - | - | 60 | ||||||||||||||||
| Total contractual obligations |
$ | 24,166 | $ | 2,140 | $ | 2,117 | $ | 2,124 | $ | 1,958 | $ | 1,842 | $ | 13,893 | $ | 92 | ||||||||
| [a] | Excludes capital lease obligations of $2,061 million, unamortized discount of $(110) million, and market value adjustments of $15 million for debt with qualifying hedges that are recorded as liabilities on the Consolidated Statements of Financial Position. Includes an interest component of $4,763 million. |
| [b] | Represents total obligations, including interest component of $914 million. |
| [c] | Purchase obligations include locomotive maintenance contracts; purchase commitments for ties, ballast, and rail; and agreements to purchase other goods and services. For amounts where we can not reasonably estimate the year of settlement, they are reflected in the Other column. |
| [d] | Includes estimated other post retirement, medical, and life insurance payments and payments made under the unfunded pension plan for the next ten years. No amounts are included for funded pension as no contributions are currently required. |
| [e] | Future cash flows for income tax contingencies reflect the recorded liability for unrecognized tax benefits, including interest and penalties, as of December 31, 2009. Where we can reasonably estimate the years in which these liabilities may be settled, this is shown in the table. For amounts where we can not reasonably estimate the year of settlement, they are reflected in the Other column. |
42
Table of Contents
| Amount of Commitment Expiration per Period | |||||||||||||||||||||
| Other Commercial Commitments Millions of Dollars |
Total | 2010 | 2011 | 2012 | 2013 | 2014 |
After | ||||||||||||||
| Credit facilities [a] |
$ | 1,900 | $ | - | $ | - | $ | 1,900 | $ | - | $ | - | $ | - | |||||||
| Sale of receivables [b] |
600 | 600 | - | - | - | - | - | ||||||||||||||
| Guarantees [c] |
416 | 29 | 76 | 24 | 8 | 214 | 65 | ||||||||||||||
| Standby letters of credit [d] |
22 | 22 | - | - | - | - | - | ||||||||||||||
| Total commercial commitments |
$ | 2,938 | $ | 651 | $ | 76 | $ | 1,924 | $ | 8 | $ | 214 | $ | 65 | |||||||
| [a] | None of the credit facility was used as of December 31, 2009. |
| [b] | $400 million of the sale of receivables program was utilized at December 31, 2009. |
| [c] | Includes guaranteed obligations related to our headquarters building, equipment financings, and affiliated operations. |
| [d] | None of the letters of credit were drawn upon as of December 31, 2009. |
Off-Balance Sheet Arrangements
Sale of Receivables – The Railroad transfers most of its accounts receivable to Union Pacific Receivables, Inc. (UPRI), a bankruptcy-remote subsidiary, as part of a sale of receivables facility. UPRI sells, without recourse on a 364-day revolving basis, an undivided interest in such accounts receivable to investors. The total capacity to sell undivided interests to investors under the facility was $600 million and $700 million at December 31, 2009 and 2008, respectively. The value of the outstanding undivided interest held by investors under the facility was $400 million and $584 million at December 31, 2009 and 2008, respectively. During 2009, UPRI reduced the outstanding undivided interest held by investors due to a decrease in available receivables. The value of the undivided interest held by investors is not included in our Consolidated Financial Statements. The value of the undivided interest held by investors was supported by $817 million and $1,015 million of accounts receivable held by UPRI at December 31, 2009 and 2008, respectively. At December 31, 2009 and 2008, the value of the interest retained by UPRI was $417 million and $431 million, respectively. This retained interest is included in accounts receivable in our Consolidated Financial Statements. The interest sold to investors is sold at carrying value, which approximates fair value, and there is no gain or loss recognized from the transaction.
The value of the outstanding undivided interest held by investors could fluctuate based upon the availability of eligible receivables and is directly affected by changing business volumes and credit risks, including default and dilution. If default or dilution ratios increase one percent, the value of the outstanding undivided interest held by investors would not change as of December 31, 2009. Should our credit rating fall below investment grade, the value of the outstanding undivided interest held by investors would be reduced, and, in certain cases, the investors would have the right to discontinue the facility.
The Railroad services the sold receivables; however, the Railroad does not recognize any servicing asset or liability, as the servicing fees adequately compensate us for these responsibilities. The Railroad collected approximately $13.8 billion and $17.8 billion during the years ended December 31, 2009 and 2008, respectively. UPRI used certain of these proceeds to purchase new receivables under the facility.
The costs of the sale of receivables program are included in other income and were $9 million, $23 million, and $35 million for 2009, 2008, and 2007, respectively. The costs include interest, which will vary based on prevailing commercial paper rates, program fees paid to banks, commercial paper issuing costs, and fees for unused commitment availability. The decrease in the 2009 costs was primarily attributable to lower commercial paper rates and a decrease in the outstanding interest held by investors.
43
Table of Contents
The investors have no recourse to the Railroad’s other assets except for customary warranty and indemnity claims. Creditors of the Railroad do not have recourse to the assets of UPRI.
In August 2009, the sale of receivables facility was renewed for an additional 364-day period at comparable terms and conditions, although the capacity to sell undivided interests was reduced from $700 million to $600 million.
See further discussion in this Item 7 under Other Matters – Accounting Pronouncements for information about recent accounting pronouncements that will have an impact on the accounting treatment of our sale of receivables program.
Guarantees – At December 31, 2009, we were contingently liable for $416 million in guarantees. We have recorded a liability of $3 million and $4 million for the fair value of these obligations as of December 31, 2009 and 2008, respectively. We entered into these contingent guarantees in the normal course of business, and they include guaranteed obligations related to our headquarters building, equipment financings, and affiliated operations. The final guarantee expires in 2022. We are not aware of any existing event of default that would require us to satisfy these guarantees. We do not expect that these guarantees will have a material adverse effect on our consolidated financial condition, results of operations, or liquidity.
OTHER MATTERS
Inflation – The cumulative effect of long periods of inflation significantly increases asset replacement costs for capital-intensive companies. As a result, assuming that we replace all operating assets at current price levels, depreciation charges (on an inflation-adjusted basis) would be substantially greater than historically reported amounts.
Derivative Financial Instruments – We may use derivative financial instruments in limited instances to assist in managing our overall exposure to fluctuations in interest rates and fuel prices. We are not a party to leveraged derivatives and, by policy, do not use derivative financial instruments for speculative purposes. Derivative financial instruments qualifying for hedge accounting must maintain a specified level of effectiveness between the hedging instrument and the item being hedged, both at inception and throughout the hedged period. We formally document the nature and relationships between the hedging instruments and hedged items at inception, as well as our risk-management objectives, strategies for undertaking the various hedge transactions, and method of assessing hedge effectiveness. Changes in the fair market value of derivative financial instruments that do not qualify for hedge accounting are charged to earnings. We may use swaps, collars, futures, and/or forward contracts to mitigate the risk of adverse movements in interest rates and fuel prices; however, the use of these derivative financial instruments may limit future benefits from favorable price movements.
Market and Credit Risk – We address market risk related to derivative financial instruments by selecting instruments with value fluctuations that highly correlate with the underlying hedged item. We manage credit risk related to derivative financial instruments, which is minimal, by requiring high credit standards for counterparties and periodic settlements. At December 31, 2009 and 2008, we were not required to provide collateral, nor had we received collateral, relating to our hedging activities.
Determination of Fair Value – We determine the fair values of our derivative financial instrument positions based upon current fair values as quoted by recognized dealers or the present value of expected future cash flows.
Sensitivity Analyses – The sensitivity analyses that follow illustrate the economic effect that hypothetical changes in interest rates could have on our results of operations and financial condition. These hypothetical changes do not consider other factors that could impact actual results.
44
Table of Contents
At December 31, 2009, we had variable-rate debt representing approximately 4% of our total debt. If variable interest rates average one percentage point higher in 2010 than our December 31, 2009 variable rate, which was approximately 2%, our interest expense would increase by approximately $4 million. This amount was determined by considering the impact of the hypothetical interest rate on the balances of our variable-rate debt at December 31, 2009.
Market risk for fixed-rate debt is estimated as the potential increase in fair value resulting from a hypothetical one percentage point decrease in interest rates as of December 31, 2009, and amounts to an increase of approximately $774 million to the fair value of our debt at December 31, 2009. We estimated the fair values of our fixed-rate debt by considering the impact of the hypothetical interest rates on quoted market prices and current borrowing rates.
Interest Rate Fair Value Hedges – We manage our overall exposure to fluctuations in interest rates by adjusting the proportion of fixed and floating rate debt instruments within our debt portfolio over a given period. We generally manage the mix of fixed and floating rate debt through the issuance of targeted amounts of each as debt matures or as we require incremental borrowings. We employ derivatives, primarily swaps, as one of the tools to obtain the targeted mix. In addition, we also obtain flexibility in managing interest costs and the interest rate mix within our debt portfolio by evaluating the issuance of and managing outstanding callable fixed-rate debt securities.
Swaps allow us to convert debt from fixed rates to variable rates and thereby hedge the risk of changes in the debt’s fair value attributable to the changes in interest rates. We account for swaps as fair value hedges using the short-cut method as allowed by the Derivatives and Hedging Topic of the Financial Accounting Standards Board (FASB) Accounting Standards Codification (ASC); therefore, we do not record any ineffectiveness within our Consolidated Financial Statements.
Interest Rate Cash Flow Hedges – We report changes in the fair value of cash flow hedges in accumulated other comprehensive income/loss until the hedged item affects earnings. At December 31, 2009 and 2008, we had reductions of $3 million and $4 million, respectively, recorded as an accumulated other comprehensive income/loss that is being amortized on a straight-line basis through September 30, 2014. As of December 31, 2009 and 2008, we had no interest rate cash flow hedges outstanding.
Accounting Pronouncements – In January 2010, the FASB issued Accounting Standards Update No. 2010-06, Improving Disclosures about Fair Value Measurements. The Update provides amendments to FASB ASC 820-10 that require entities to disclose separately the amounts of significant transfers in and out of Level 1 and Level 2 fair value measurements and describe the reasons for the transfers. In addition the Update requires entities to present separately information about purchases, sales, issuances, and settlements in the reconciliation for fair value measurements using significant unobservable inputs (Level 3). The disclosures related to Level 1 and Level 2 fair value measurements are effective for us in 2010 and the disclosures related to Level 3 fair value measurements are effective for us in 2011. The Update requires new disclosures only, and will have no impact on our consolidated financial position, results of operations, or cash flows.
In June 2009, the FASB issued Statement No. 166, Accounting for Transfers of Financial Assets—an amendment of FASB Statement No. 140 (FAS 166). FAS 166 limits the circumstances in which transferred financial assets can be derecognized and requires enhanced disclosures regarding transfers of financial assets and a transferor’s continuing involvement with transferred financial assets. In addition, the concept of a qualifying special-purpose entity is no longer relevant for accounting purposes. Therefore, formerly qualifying special-purpose entities (as defined under previous accounting standards) should be evaluated for consolidation by reporting entities on and after the effective date in accordance with the applicable consolidation guidance. FAS 166 will be effective for us beginning in 2010. After adoption, transfers of undivided interests in accounts receivable to investors under our sale of receivables program will no longer qualify for sale treatment, but rather will be accounted for as secured borrowings
45
Table of Contents
in our Consolidated Statements of Financial Position. We are still evaluating the impact on our Consolidated Statements of Cash Flows related to the adoption of this standard. The value of the outstanding undivided interest held by investors under our sale of receivables program at December 31, 2009 was $400 million.
In June 2009, the FASB issued Statement No. 167, Amendments to FASB Interpretation No. 46(R) (FAS 167). FAS 167 retains the scope of Interpretation 46(R), Consolidation of Variable Interest Entities, with the addition of entities previously considered qualifying special-purpose entities, as the concept of these entities was eliminated in FASB Statement No. 166, Accounting for Transfers of Financial Assets—an amendment of FASB Statement No. 140. FAS 167 will be effective for us beginning in 2010. The adoption of FAS 167 will not affect our consolidated financial position, results of operations, or cash flows.
In June 2009, the FASB issued Statement No. 168, The FASB Accounting Standards CodificationTM and the Hierarchy of Generally Accepted Accounting Principles—a replacement of FASB Statement No. 162 (FAS 168). The Codification became the source of authoritative GAAP recognized by the FASB to be applied by nongovernmental entities. Rules and interpretive releases of the SEC under authority of federal securities laws are also sources of authoritative GAAP for SEC registrants. On the effective date of FAS 168, the Codification superseded all then-existing non-SEC accounting and reporting standards. All other nongrandfathered non-SEC accounting literature not included in the Codification became nonauthoritative. FAS 168 was effective for financial statements issued for interim and annual periods ending after September 15, 2009. The adoption of FAS 168 did not affect our consolidated financial position, results of operations, or cash flows.
In May 2009, the FASB issued Statement No. 165, Subsequent Events (FAS 165) (codified as FASB ASC 855-10-50). FAS 165 establishes general standards of accounting for and disclosures of events that occur after the balance sheet date but before financial statements are issued or are available to be issued. It requires the disclosure of the date through which an entity has evaluated subsequent events and the basis for that date. FAS 165 was effective for interim or annual financial periods ending after June 15, 2009. The adoption of FAS 165 did not affect our consolidated financial position, results of operations, or cash flows.
In April 2009, the FASB issued FSP No. FAS 107-1 and APB 28-1, Interim Disclosures about Fair Value of Financial Instruments (codified as FASB ASC 820-10-50). This FSP amends FASB Statement No. 107, to require disclosures about fair values of financial instruments for interim reporting periods as well as in annual financial statements. The FSP also amends APB Opinion No. 28 to require those disclosures in summarized financial information at interim reporting periods. This FSP was effective for interim reporting periods ending after June 15, 2009. The adoption of this FSP did not affect our consolidated financial position, results of operations, or cash flows.
In December 2008, the FASB issued FSP FAS 132(R)-1, Employers’ Disclosure about Postretirement Benefit Plan Assets (codified as FASB ASC 715-20-50), which amended Statement 132(R) to require more detailed disclosures about employers’ pension plan assets. New disclosures include more information on investment strategies, major categories of plan assets, concentrations of risk within plan assets and valuation techniques used to measure the fair value of plan assets. This new standard required new disclosures only, and had no impact on our consolidated financial position, results of operations or cash flows. These new disclosures are included in Note 5 to the Consolidated Financial Statements.
Change in Accounting Principle – We have historically accounted for rail grinding costs as a capital asset. Beginning in the first quarter of 2010, we will change our accounting policy for rail grinding costs from a capitalization method, under which we have capitalized the cost of rail grinding and depreciated such capitalized costs, to a direct expense method, under which we will expense rail grinding costs as incurred. The expense as incurred method is preferable, as it eliminates the subjectivity in determining
46
Table of Contents
the period of benefit associated with rail grinding over which to depreciate the associated capitalized costs. We will reflect this change as a change in accounting principle from an acceptable accounting principle to a preferable accounting principle. The application of this preferable accounting principle will be presented retrospectively to all periods presented in future earnings releases and SEC filings. When the accounting principle is retrospectively applied, net income for the years ended December 31, 2009, 2008, and 2007 will decrease by approximately $8 million, $3 million, and $7 million, or $0.01, $0.01 and $0.02 per share, respectively. This change in accounting principle is not expected to have a material impact on our consolidated financial position, results of operations, or cash flows.
Asserted and Unasserted Claims – Various claims and lawsuits are pending against us and certain of our subsidiaries. We cannot fully determine the effect of all asserted and unasserted claims on our consolidated results of operations, financial condition, or liquidity; however, to the extent possible, where asserted and unasserted claims are considered probable and where such claims can be reasonably estimated, we have recorded a liability. We do not expect that any known lawsuits, claims, environmental costs, commitments, contingent liabilities, or guarantees will have a material adverse effect on our consolidated results of operations, financial condition, or liquidity after taking into account liabilities and insurance recoveries previously recorded for these matters.
Indemnities – Our maximum potential exposure under indemnification arrangements, including certain tax indemnifications, can range from a specified dollar amount to an unlimited amount, depending on the nature of the transactions and the agreements. Due to uncertainty as to whether claims will be made or how they will be resolved, we cannot reasonably determine the probability of an adverse claim or reasonably estimate any adverse liability or the total maximum exposure under these indemnification arrangements. We do not have any reason to believe that we will be required to make any material payments under these indemnity provisions.
Climate Change – Although climate change could have an adverse impact on our operations and financial performance in the future (see Risk Factors under Item 1A of this report), we are currently unable to predict the manner or severity of such impact. However, we continue to take steps and explore opportunities to reduce the impact of our operations on the environment, including investments in new technologies, using training programs to reduce fuel consumption, and changing our operations to increase fuel efficiency.
Our Consolidated Financial Statements have been prepared in accordance with GAAP. The preparation of these financial statements requires estimation and judgment that affect the reported amounts of revenues, expenses, assets, and liabilities. We base our estimates on historical experience and on various other assumptions that we believe are reasonable under the circumstances, the results of which form the basis for making judgments about the carrying values of assets and liabilities that are not readily apparent from other sources. The following critical accounting policies are a subset of our significant accounting policies described in Note 2 to the Financial Statements and Supplementary Data, Item 8. These critical accounting policies affect significant areas of our financial statements and involve judgment and estimates. If these estimates differ significantly from actual results, the impact on our Consolidated Financial Statements may be material.
Personal Injury – The cost of personal injuries to employees and others related to our activities is charged to expense based on estimates of the ultimate cost and number of incidents each year. We use third-party actuaries to assist us in measuring the expense and liability, including unasserted claims. The Federal Employers’ Liability Act (FELA) governs compensation for work-related accidents. Under FELA, damages are assessed based on a finding of fault through litigation or out-of-court settlements. We offer a comprehensive variety of services and rehabilitation programs for employees who are injured at work.
47
Table of Contents
Our personal injury liability is discounted to present value using applicable U.S. Treasury rates. Approximately 13% of the recorded liability related to asserted claims, and approximately 87% related to unasserted claims at December 31, 2009. Because of the uncertainty surrounding the ultimate outcome of personal injury claims, it is reasonably possible that future costs to settle these claims may range from approximately $545 million to $602 million. We record an accrual at the low end of the range as no amount of loss is more probable than any other. Our personal injury liability activity was as follows:
| Millions of Dollars |
2009 |
2008 | 2007 | ||||||||
| Beginning balance |
$ | 621 | $ | 593 | $ | 631 | |||||
| Accruals |
79 | 201 | 165 | ||||||||
| Payments |
(155) | (173 | ) | (203 | ) | ||||||
| Ending balance at December 31 |
$ | 545 | $ | 621 | $ | 593 | |||||
| Current portion, ending balance at December 31 |
$ | 158 | $ | 186 | $ | 204 | |||||
|
Our personal injury claims activity was as follows:
|
|||||||||||
|
2009 |
2008 | 2007 | |||||||||
| Open claims, beginning balance |
4,079 | 4,084 | 4,126 | ||||||||
| New claims |
3,012 | 3,692 | 4,133 | ||||||||
| Settled or dismissed claims |
(3,591) | (3,697 | ) | (4,175 | ) | ||||||
| Open claims, ending balance at December 31 |
3,500 | 4,079 | 4,084 | ||||||||
Asbestos – We are a defendant in a number of lawsuits in which current and former employees and other parties allege exposure to asbestos. We engage a third party with extensive experience in estimating resolution costs for asbestos-related claims to assist us in assessing our potential liability. This liability is updated annually and excludes future defense and processing costs. The liability for resolving both asserted and unasserted claims was based on the following assumptions:
| • | The ratio of future claims by alleged disease would be consistent with historical averages. |
| • | The number of claims filed against us will decline each year. |
| • | The average settlement values for asserted and unasserted claims will be equivalent to historical averages. |
| • | The percentage of claims dismissed in the future will be equivalent to historical averages. |
48
Table of Contents
Our liability for asbestos-related claims is not discounted to present value due to the uncertainty surrounding the timing of future payments. Approximately 21% of the recorded liability related to asserted claims and approximately 79% related to unasserted claims at December 31, 2009. Because of the uncertainty surrounding the ultimate outcome of asbestos-related claims, it is reasonably possible that future costs to settle these claims may range from approximately $174 million to $189 million. We record an accrual at the low end of the range as no amount of loss is more probable than any other. In conjunction with the liability update performed in 2009, we also reassessed estimated insurance recoveries. We have recognized an asset for estimated insurance recoveries at December 31, 2009 and 2008. Our asbestos-related liability activity was as follows:
| Millions of Dollars |
2009 |
2008 | 2007 | ||||||||
| Beginning balance |
$ | 213 | $ | 265 | $ | 302 | |||||
| Accruals/(credits) |
(25) | (42 | ) | (20 | ) | ||||||
| Payments |
(14) | (10 | ) | (17 | ) | ||||||
| Ending balance at December 31 |
$ | 174 | $ | 213 | $ | 265 | |||||
| Current portion, ending balance at December 31 |
$ | 13 | $ | 12 | $ | 11 | |||||
|
Our asbestos-related claims activity was as follows:
|
|||||||||||
|
2009 |
2008 | 2007 | |||||||||
| Open claims, beginning balance |
1,867 | 2,086 | 2,277 | ||||||||
| New claims |
249 | 256 | 269 | ||||||||
| Settled or dismissed claims |
(446) | (475 | ) | (460 | ) | ||||||
| Open claims, ending balance at December 31 |
1,670 | 1,867 | 2,086 | ||||||||
We believe that our estimates of liability for asbestos-related claims and insurance recoveries are reasonable and probable. The amounts recorded for asbestos-related liabilities and related insurance recoveries were based on currently known facts. However, future events, such as the number of new claims to be filed each year, average settlement costs, and insurance coverage issues, could cause the actual costs and insurance recoveries to be higher or lower than the projected amounts. Estimates also may vary in the future if strategies, activities, and outcomes of asbestos litigation materially change; federal and state laws governing asbestos litigation increase or decrease the probability or amount of compensation of claimants; and there are material changes with respect to payments made to claimants by other defendants.
Environmental – We are subject to federal, state, and local environmental laws and regulations. We identified 307 sites at which we are or may be liable for remediation costs associated with alleged contamination or for violations of environmental requirements. This includes 32 sites that are the subject of actions taken by the U.S. government, 17 of which are currently on the Superfund National Priorities List. Certain federal legislation imposes joint and several liability for the remediation of identified sites; consequently, our ultimate environmental liability may include costs relating to activities of other parties, in addition to costs relating to our own activities at each site.
49
Table of Contents
When we identify an environmental issue with respect to property owned, leased, or otherwise used in our business, we and our consultants perform environmental assessments on the property. We expense the cost of the assessments as incurred. We accrue the cost of remediation where our obligation is probable and we can reasonably estimate such costs. We do not discount our environmental liabilities when the timing of the anticipated cash payments is not fixed or readily determinable. At December 31, 2009, approximately 12% of our environmental liability was discounted at 3.4%, while approximately 13% of our environmental liability was discounted at 3.5% at December 31, 2008. Our environmental liability activity was as follows:
| Millions of Dollars |
2009 |
2008 | 2007 | ||||||||
| Beginning balance |
$ | 209 | $ | 209 | $ | 210 | |||||
| Accruals |
49 | 46 | 41 | ||||||||
| Payments |
(41) | (46 | ) | (42 | ) | ||||||
| Ending balance at December 31 |
$ | 217 | $ | 209 | $ | 209 | |||||
| Current portion, ending balance at December 31 |
$ | 82 | $ | 58 | $ | 63 | |||||
|
Our environmental site activity was as follows:
|
|||||||||||
|
2009 |
2008 | 2007 | |||||||||
| Open sites, beginning balance |
339 | 339 | 367 | ||||||||
| New sites |
49 | 82 | 72 | ||||||||
| Closed sites |
(81) | (82 | ) | (100 | ) | ||||||
| Open sites, ending balance at December 31 |
307 | 339 | 339 | ||||||||
The liability includes future costs for remediation and restoration of sites, as well as ongoing monitoring costs, but excludes any anticipated recoveries from third parties. Cost estimates are based on information available for each site, financial viability of other potentially responsible parties, and existing technology, laws, and regulations. The ultimate liability for remediation is difficult to determine because of the number of potentially responsible parties, site-specific cost sharing arrangements with other potentially responsible parties, the degree of contamination by various wastes, the scarcity and quality of volumetric data related to many of the sites, and the speculative nature of remediation costs. Estimates of liability may vary over time due to changes in federal, state, and local laws governing environmental remediation. Current obligations are not expected to have a material adverse effect on our consolidated results of operations, financial condition, or liquidity.
Property and Depreciation – Our railroad operations are highly capital intensive, and our large base of homogeneous, network-type assets turns over on a continuous basis. Each year we develop a capital program for the replacement of assets and for the acquisition or construction of assets that enable us to enhance our operations or provide new service offerings to customers. Assets purchased or constructed throughout the year are capitalized if they meet applicable minimum units of property criteria. Properties and equipment are carried at cost and are depreciated on a straight-line basis over their estimated service lives, which are measured in years, except for rail in high-density traffic corridors (i.e., all rail lines except for those subject to abandonment, yard and switching tracks, and electronic yards), which are measured in millions of gross tons per mile of track. We use the group method of depreciation in which all items with similar characteristics, use, and expected life are grouped together in asset classes, and are depreciated using composite depreciation rates. The group method of depreciation treats each asset class as a pool of resources, not as singular items. We currently have more than 60 depreciable asset classes,
50
Table of Contents
and we may increase or decrease the number of asset classes due to changes in technology, asset strategies, or other factors.
We determine the estimated service lives of depreciable railroad property by means of depreciation studies. We perform depreciation studies at least every three years for equipment and every six years for track assets (i.e., rail and other track material, ties, and ballast) and other road property. Our depreciation studies take into account the following factors:
| • | Statistical analysis of historical patterns of use and retirements of each of our asset classes; |
| • | Evaluation of any expected changes in current operations and the outlook for continued use of the assets; |
| • | Evaluation of technological advances and changes to maintenance practices; and |
| • | Expected salvage to be received upon retirement. |
For rail in high-density traffic corridors, we measure estimated service lives in millions of gross tons per mile of track. It has been our experience that the lives of rail in high-density traffic corridors are closely correlated to usage (i.e., the amount of weight carried over the rail). The service lives also vary based on rail weight, rail condition, (e.g., new or secondhand), and rail type (e.g., straight or curve). Our depreciation studies for rail in high density traffic corridors consider each of these factors in determining the estimated service lives. For rail in high-density traffic corridors, we calculate depreciation rates annually by dividing the number of gross ton-miles carried over the rail (i.e., the weight of loaded and empty freight cars, locomotives and maintenance of way equipment transported over the rail) by the estimated service lives of the rail measured in millions of gross tons per mile. Rail in high-density traffic corridors accounts for approximately 70 percent of the historical cost of rail and other track material. Based on the number of gross ton-miles carried over our rail in high density traffic corridors during 2009, the estimated service lives of the majority of this rail ranged from 14 years to 30 years. For all other depreciable assets, we compute depreciation based on the estimated service lives of our assets as determined from the analysis of our depreciation studies. Changes in the estimated service lives of our assets and their related depreciation rates are implemented prospectively.
Estimated service lives of depreciable railroad property may vary over time due to changes in physical use, technology, asset strategies, and other factors that will have an impact on the retirement profiles of our assets. We are not aware of any specific factors that are reasonably likely to significantly change the estimated service lives of our assets. Actual use and retirement of our assets may vary from our current estimates, which would impact the amount of depreciation expense recognized in future periods.
Changes in estimated useful lives of our assets due to the results of our depreciation studies could significantly impact future periods’ depreciation expense and have a material impact on our Consolidated Financial Statements. If the estimated useful lives of all depreciable assets were increased by one year, annual depreciation expense would decrease by approximately $43 million. If the estimated useful lives of all depreciable assets were decreased by one year, annual depreciation expense would increase by approximately $46 million. Our recent depreciation studies have resulted in changes in depreciation rates for some asset classes, which did not significantly affect our annual depreciation expense.
Under group depreciation, the historical cost (net of salvage) of depreciable property that is retired or replaced in the ordinary course of business is charged to accumulated depreciation and no gain or loss is recognized. The historical cost of certain track assets is estimated using (i) inflation indices published by the Bureau of Labor Statistics and (ii) the estimated useful life of the assets as determined by our depreciation studies. The indices were selected because they closely correlate with the major costs of the properties comprising the applicable track asset classes. Because of the number of estimates inherent in the depreciation and retirement processes and because it is impossible to precisely estimate each of these variables until a group of property is completely retired, we continually monitor the estimated service
51
Table of Contents
lives of our assets and the accumulated depreciation associated with each asset class to ensure our depreciation rates are appropriate.
For retirements of depreciable railroad properties that do not occur in the normal course of business, a gain or loss may be recognized if the retirement meets each of the following three conditions: (i) is unusual, (ii) is material in amount, and (iii) varies significantly from the retirement profile identified through our depreciation studies. During the last three fiscal years, no gains or losses were recognized due to the retirement of depreciable railroad properties. A gain or loss is recognized in other income when we sell land or dispose of assets that are not part of our railroad operations.
Income Taxes – We account for income taxes by recording taxes payable or refundable for the current year and deferred tax assets and liabilities for the expected future tax consequences of events that have been recognized in our financial statements or tax returns. These expected future tax consequences are measured based on current tax law; the effects of future changes in tax laws are not anticipated. Future tax law changes, such as a change in the corporate tax rate, could have a material impact on our financial condition, results of operations, or liquidity. For example, a 1% increase in future income tax rates would increase our deferred tax liability by approximately $280 million.
When appropriate, we record a valuation allowance against deferred tax assets to reflect that these tax assets may not be realized. In determining whether a valuation allowance is appropriate, we consider whether it is more likely than not that all or some portion of our deferred tax assets will not be realized, based on management’s judgments using available evidence about future events. The valuation allowance at December 31, 2009 was $8 million. There was no valuation allowance at December 31, 2008.
At times, we may claim tax benefits that may be challenged by a tax authority. We recognize tax benefits only for tax positions that are more likely than not to be sustained upon examination by tax authorities. The amount recognized is measured as the largest amount of benefit that is greater than 50 percent likely to be realized upon settlement. A liability for “unrecognized tax benefits” is recorded for any tax benefits claimed in our tax returns that do not meet these recognition and measurement standards.
Pension and Other Postretirement Benefits – We use third-party actuaries to assist us in properly measuring the liabilities and expenses associated with providing pension and defined contribution medical and life insurance benefits (OPEB) to eligible employees. In order to use actuarial methods to value the liabilities and expenses, we must make several assumptions. The critical assumptions used to measure pension obligations and expenses are the discount rate and expected rate of return on pension assets. For OPEB, the critical assumptions are the discount rate and healthcare cost trend rate.
We evaluate our critical assumptions at least annually, and selected assumptions are based on the following factors:
| • | Discount rate is based on a Mercer yield curve of high quality corporate bonds (rated AA by a recognized rating agency) for which the timing and amount of cash flows matches our plans’ expected benefit payments. |
| • | Expected return on plan assets is based on our asset allocation mix and our historical return, taking into consideration current and expected market conditions. |
| • | Healthcare cost trend rate is based on our historical rates of inflation and expected market conditions. |
52
Table of Contents
The following tables present the key assumptions used to measure pension and OPEB expense for 2009 and the estimated impact on 2009 pension and OPEB expense relative to a change in those assumptions:
| Assumptions |
Pension |
OPEB | ||||
| Discount rate |
6.25% | 6.25% | ||||
| Expected return on plan assets |
8.00% | N/A | ||||
| Salary increase |
3.50% | N/A | ||||
| Healthcare cost trend rate: |
||||||
| Pre-65 current |
N/A | 7.50% | ||||
| Pre-65 level in 2028 |
N/A | 4.50% | ||||
| Post-65 current |
N/A | 9.10% | ||||
| Post-65 level in 2028 |
N/A | 4.50% | ||||
| Sensitivities |
Increase in Expense | |||||
| Millions of Dollars | Pension | OPEB | ||||
| 0.25% decrease in discount rate |
$ | 6 | $ | 1 | ||
| 0.25% increase in salary scale |
$ | 1 | N/A | |||
| 0.25% decrease in expected return on plan assets |
$ | 5 | N/A | |||
| 1% increase in healthcare cost trend rate |
N/A | $ | 1 | |||
Certain statements in this report, and statements in other reports or information filed or to be filed with the SEC (as well as information included in oral statements or other written statements made or to be made by us), are, or will be, forward-looking statements as defined by the Securities Act of 1933 and the Securities Exchange Act of 1934. These forward-looking statements and information include, without limitation, (A) statements in the Chairman’s letter preceding Part I regarding future economic conditions, our ability to participate in future economic growth and create value for our shareholders, and future capital investments; statements regarding planned capital expenditures under the caption “2010 Capital Expenditures” in Item 2 of Part I; statements regarding dividends in Item 5 and statements; and information set forth under the captions “2010 Outlook” and “Liquidity and Capital Resources” in this Item 7, and (B) any other statements or information in this report (including information incorporated herein by reference) regarding: expectations as to financial performance, revenue growth and cost savings; the time by which goals, targets, or objectives will be achieved; projections, predictions, expectations, estimates, or forecasts as to our business, financial and operational results, future economic performance, and general economic conditions; expectations as to operational or service performance or improvements; expectations as to the effectiveness of steps taken or to be taken to improve operations and/or service, including capital expenditures for infrastructure improvements and equipment acquisitions, any strategic business acquisitions, and modifications to our transportation plans (including statements set forth in Item 2 as to expectations related to our planned capital expenditures); expectations as to existing or proposed new products and services; expectations as to the impact of any new regulatory activities or legislation on our operations or financial results; estimates of costs relating to environmental remediation and restoration; expectations that claims, litigation, environmental costs, commitments, contingent liabilities, labor negotiations or agreements, or other matters will not have a material adverse effect on our consolidated results of operations, financial condition, or liquidity and any other similar expressions concerning matters that are not historical facts. Forward-looking statements may be identified by their use of forward-looking terminology, such as “believes,” “expects,” “may,” “should,”
53
Table of Contents
“would,” “will,” “intends,” “plans,” “estimates,” “anticipates,” “projects” and similar words, phrases or expressions.
Forward-looking statements should not be read as a guarantee of future performance or results, and will not necessarily be accurate indications of the times that, or by which, such performance or results will be achieved. Forward-looking statements and information are subject to risks and uncertainties that could cause actual performance or results to differ materially from those expressed in the statements and information. Forward-looking statements and information reflect the good faith consideration by management of currently available information, and may be based on underlying assumptions believed to be reasonable under the circumstances. However, such information and assumptions (and, therefore, such forward-looking statements and information) are or may be subject to variables or unknown or unforeseeable events or circumstances over which management has little or no influence or control. The Risk Factors in Item 1A of this report could affect our future results and could cause those results or other outcomes to differ materially from those expressed or implied in any forward-looking statements or information. To the extent circumstances require or we deem it otherwise necessary, we will update or amend these risk factors in a Form 10-Q, Form 8-K or subsequent Form 10-K. All forward-looking statements are qualified by, and should be read in conjunction with, these Risk Factors.
Forward-looking statements speak only as of the date the statement was made. We assume no obligation to update forward-looking information to reflect actual results, changes in assumptions or changes in other factors affecting forward-looking information. If we do update one or more forward-looking statements, no inference should be drawn that we will make additional updates with respect thereto or with respect to other forward-looking statements.
Item 7A. Quantitative and Qualitative Disclosures about Market Risk
Information concerning market risk sensitive instruments is set forth under Management’s Discussion and Analysis of Financial Condition and Results of Operations – Other Matters, Item 7.
****************************************
54
Table of Contents
Item 8. Financial Statements and Supplementary Data
| Index to Consolidated Financial Statements |
Page | |
| 56 | ||
| Consolidated Statements of Income |
||
| 57 | ||
| Consolidated Statements of Financial Position |
||
| 58 | ||
| Consolidated Statements of Cash Flows |
||
| 59 | ||
| Consolidated Statements of Changes in Common Shareholders’ Equity |
||
| 60 | ||
| 61 | ||
55
Table of Contents
REPORT OF INDEPENDENT REGISTERED PUBLIC ACCOUNTING FIRM
Union Pacific Corporation, its Directors, and Shareholders:
We have audited the accompanying consolidated statements of financial position of Union Pacific Corporation and Subsidiary Companies (the Corporation) as of December 31, 2009 and 2008, and the related consolidated statements of income, changes in common shareholders’ equity, and cash flows for each of the three years in the period ended December 31, 2009. Our audits also included the financial statement schedule listed in the Table of Contents at Part IV, Item 15. These financial statements and financial statement schedule are the responsibility of the Corporation’s management. Our responsibility is to express an opinion on the consolidated financial statements and financial statement schedule based on our audits.
We conducted our audits in accordance with the standards of the Public Company Accounting Oversight Board (United States). Those standards require that we plan and perform the audit to obtain reasonable assurance about whether the financial statements are free of material misstatement. An audit includes examining, on a test basis, evidence supporting the amounts and disclosures in the financial statements. An audit also includes assessing the accounting principles used and significant estimates made by management, as well as evaluating the overall financial statement presentation. We believe that our audits provide a reasonable basis for our opinion.
In our opinion, such consolidated financial statements present fairly, in all material respects, the financial position of Union Pacific Corporation and Subsidiary Companies as of December 31, 2009 and 2008, and the results of their operations and their cash flows for each of the three years in the period ended December 31, 2009, in conformity with accounting principles generally accepted in the United States of America. Also, in our opinion, such financial statement schedule, when considered in relation to the basic consolidated financial statements taken as a whole, presents fairly, in all material respects, the information set forth therein.
We have also audited, in accordance with the standards of the Public Company Accounting Oversight Board (United States), the Corporation’s internal control over financial reporting as of December 31, 2009, based on the criteria established in Internal Control — Integrated Framework issued by the Committee of Sponsoring Organizations of the Treadway Commission and our report dated February 5, 2010, expressed an unqualified opinion on the Corporation’s internal control over financial reporting.
 |
| Omaha, Nebraska |
| February 5, 2010 |
56
Table of Contents
CONSOLIDATED STATEMENTS OF INCOME
Union Pacific Corporation and Subsidiary Companies
|
Millions, Except Per Share Amounts, for the Years Ended December 31, |
2009 | 2008 | 2007 | ||||||||
| Operating revenues: |
|||||||||||
| Freight revenues |
$ | 13,373 | $ | 17,118 | $ | 15,486 | |||||
| Other revenues |
770 | 852 | 797 | ||||||||
| Total operating revenues |
14,143 | 17,970 | 16,283 | ||||||||
| Operating expenses: |
|||||||||||
| Compensation and benefits |
4,063 | 4,457 | 4,526 | ||||||||
| Fuel |
1,763 | 3,983 | 3,104 | ||||||||
| Purchased services and materials |
1,614 | 1,902 | 1,856 | ||||||||
| Depreciation |
1,444 | 1,387 | 1,321 | ||||||||
| Equipment and other rents |
1,180 | 1,326 | 1,368 | ||||||||
| Other |
687 | 840 | 733 | ||||||||
| Total operating expenses |
10,751 | 13,895 | 12,908 | ||||||||
| Operating income |
3,392 | 4,075 | 3,375 | ||||||||
| Other income (Note 6) |
195 | 92 | 116 | ||||||||
| Interest expense |
(600) | (511 | ) | (482 | ) | ||||||
| Income before income taxes |
2,987 | 3,656 | 3,009 | ||||||||
| Income taxes (Note 7) |
(1,089) | (1,318 | ) | (1,154 | ) | ||||||
| Net income |
$ | 1,898 | $ | 2,338 | $ | 1,855 | |||||
| Share and Per Share (Note 8) |
|||||||||||
| Earnings per share - basic |
$ | 3.77 | $ | 4.58 | $ | 3.49 | |||||
| Earnings per share - diluted |
$ | 3.75 | $ | 4.54 | $ | 3.46 | |||||
| Weighted average number of shares - basic |
503.0 | 510.6 | 531.9 | ||||||||
| Weighted average number of shares - diluted |
505.8 | 515.0 | 536.8 | ||||||||
| Dividends declared per share |
$ | 1.08 | $ | 0.98 | $ | 0.745 | |||||
The accompanying notes are an integral part of these Consolidated Financial Statements.
57
Table of Contents
CONSOLIDATED STATEMENTS OF FINANCIAL POSITION
Union Pacific Corporation and Subsidiary Companies
| Millions of Dollars, as of December 31, |
2009 |
2008 | |||||
| Assets |
|||||||
| Current assets: |
|||||||
| Cash and cash equivalents |
$ | 1,850 | $ | 1,249 | |||
| Accounts receivable |
666 | 594 | |||||
| Materials and supplies |
475 | 450 | |||||
| Current deferred income taxes (Note 7) |
339 | 276 | |||||
| Other current assets |
350 | 244 | |||||
| Total current assets |
3,680 | 2,813 | |||||
| Investments |
1,036 | 974 | |||||
| Net properties (Note 10) |
37,428 | 35,701 | |||||
| Other assets |
266 | 234 | |||||
| Total assets |
$ | 42,410 | $ | 39,722 | |||
| Liabilities and Common Shareholders’ Equity |
|||||||
| Current liabilities: |
|||||||
| Accounts payable and other current liabilities (Note 11) |
$ | 2,470 | $ | 2,560 | |||
| Debt due within one year (Note 13) |
212 | 320 | |||||
| Total current liabilities |
2,682 | 2,880 | |||||
| Debt due after one year (Note 13) |
9,636 | 8,607 | |||||
| Deferred income taxes (Note 7) |
11,130 | 10,282 | |||||
| Other long-term liabilities |
2,021 | 2,506 | |||||
| Commitments and contingencies (Note 15) |
|||||||
| Total liabilities |
25,469 | 24,275 | |||||
| Common shareholders’ equity (Note 3): |
|||||||
| Common shares, $2.50 par value, 800,000,000 authorized; |
|||||||
| 553,497,981 and 552,775,812 issued; 505,039,952 and 503,225,705 outstanding, respectively |
1,384 | 1,382 | |||||
| Paid-in-surplus |
3,968 | 3,949 | |||||
| Retained earnings |
15,167 | 13,813 | |||||
| Treasury stock |
(2,924) | (2,993 | ) | ||||
| Accumulated other comprehensive loss (Note 9) |
(654) | (704 | ) | ||||
| Total common shareholders’ equity |
16,941 | 15,447 | |||||
| Total liabilities and common shareholders’ equity |
$ | 42,410 | $ | 39,722 | |||
The accompanying notes are an integral part of these Consolidated Financial Statements.
58
Table of Contents
CONSOLIDATED STATEMENTS OF CASH FLOWS
Union Pacific Corporation and Subsidiary Companies
| Millions of Dollars, for the Years Ended December 31, |
2009 |
2008 | 2007 | ||||||||
| Operating Activities |
|||||||||||
| Net income |
$ | 1,898 | $ | 2,338 | $ | 1,855 | |||||
| Adjustments to reconcile net income to cash provided by operating activities: |
|||||||||||
| Depreciation |
1,444 | 1,387 | 1,321 | ||||||||
| Deferred income taxes and unrecognized tax benefits |
723 | 547 | 332 | ||||||||
| Net gain on non-operating asset disposition |
(162) | (41 | ) | (52 | ) | ||||||
| Other operating activities, net |
(376) | 89 | (207 | ) | |||||||
| Changes in current assets and liabilities: |
|||||||||||
| Accounts receivable, net |
(72) | 38 | 47 | ||||||||
| Materials and supplies |
(25) | 3 | (58 | ) | |||||||
| Other current assets |
(106) | 51 | (104 | ) | |||||||
| Accounts payable and other current liabilities |
(90) | (342 | ) | 143 | |||||||
| Cash provided by operating activities |
3,234 | 4,070 | 3,277 | ||||||||
| Investing Activities |
|||||||||||
| Capital investments |
(2,384) | (2,780 | ) | (2,496 | ) | ||||||
| Proceeds from asset sales |
187 | 93 | 122 | ||||||||
| Acquisition of equipment pending financing |
(100) | (388 | ) | (621 | ) | ||||||
| Proceeds from sale of assets financed |
100 | 388 | 621 | ||||||||
| Other investing activities, net |
22 | (77 | ) | (52 | ) | ||||||
| Cash used in investing activities |
(2,175) | (2,764 | ) | (2,426 | ) | ||||||
| Financing Activities |
|||||||||||
| Debt issued |
843 | 2,257 | 1,581 | ||||||||
| Common share repurchases (Note 16) |
- | (1,609 | ) | (1,375 | ) | ||||||
| Debt repaid |
(871) | (1,208 | ) | (792 | ) | ||||||
| Dividends paid |
(544) | (481 | ) | (364 | ) | ||||||
| Other financing activities, net |
114 | 106 | 150 | ||||||||
| Cash used in financing activities |
(458) | (935 | ) | (800 | ) | ||||||
| Net change in cash and cash equivalents |
601 | 371 | 51 | ||||||||
| Cash and cash equivalents at beginning of year |
1,249 | 878 | 827 | ||||||||
| Cash and cash equivalents at end of year |
$ | 1,850 | $ | 1,249 | $ | 878 | |||||
| Supplemental Cash Flow Information |
|||||||||||
| Non-cash investing and financing activities: |
|||||||||||
| Capital lease financings |
$ | 842 | $ | 175 | $ | 82 | |||||
| Cash dividends declared but not yet paid |
132 | 132 | 112 | ||||||||
| Capital investments accrued but not yet paid |
96 | 93 | 126 | ||||||||
| Settlement of current liabilities for debt |
14 | - | - | ||||||||
| Common shares repurchased but not yet paid |
- | - | 82 | ||||||||
| Cash paid during the year for: |
|||||||||||
| Interest, net of amounts capitalized |
$ | (578) | $ | (500 | ) | $ | (467 | ) | |||
| Income taxes, net of refunds |
(452) | (699 | ) | (839 | ) | ||||||
The accompanying notes are an integral part of these Consolidated Financial Statements.
59
Table of Contents
CONSOLIDATED STATEMENTS OF CHANGES IN COMMON SHAREHOLDERS’ EQUITY
Union Pacific Corporation and Subsidiary Companies
| Millions of Dollars Thousands of Shares |
Common Shares |
Treasury Shares |
Common Shares |
Paid-in- Surplus |
Retained Earnings |
Treasury Stock |
AOCI [a] |
Total | ||||||||||||||||||||
| Balance at January 1, 2007 (Note 3) |
551.9 | (11.6 | ) | $ | 1,381 | $ | 3,943 | $ | 10,517 | $ | (394 | ) | $ | (142 | ) | $ | 15,305 | |||||||||||
| Comprehensive income: |
||||||||||||||||||||||||||||
| Net income |
- | - | 1,855 | - | - | 1,855 | ||||||||||||||||||||||
| Other comp. income |
- | - | - | - | 68 | 68 | ||||||||||||||||||||||
| Total comp. income (Note 9) |
- | - | 1,855 | - | 68 | 1,923 | ||||||||||||||||||||||
| Conversion, stock option exercises, forfeitures, and other |
0.4 | 6.2 | - | (17 | ) | - | 227 | - | 210 | |||||||||||||||||||
| Share repurchases (Note 16) |
- | (25.2 | ) | - | - | - | (1,457 | ) | - | (1,457 | ) | |||||||||||||||||
| Cash dividends declared |
- | - | - | - | (396 | ) | - | - | (396 | ) | ||||||||||||||||||
| Balance at December 31, 2007 (Note 3) |
552.3 | (30.6 | ) | $ | 1,381 | $ | 3,926 | $ | 11,976 | $ | (1,624 | ) | $ | (74 | ) | $ | 15,585 | |||||||||||
| Comprehensive income: |
||||||||||||||||||||||||||||
| Net income |
- | - | 2,338 | - | - | 2,338 | ||||||||||||||||||||||
| Other comp. income/(loss) |
- | - | - | - | (630 | ) | (630 | ) | ||||||||||||||||||||
| Total comp. income (Note 9) |
- | - | 2,338 | - | (630 | ) | 1,708 | |||||||||||||||||||||
| Conversion, stock option exercises, forfeitures, and other |
0.5 | 3.2 | 1 | 23 | - | 158 | - | 182 | ||||||||||||||||||||
| Share repurchases (Note 16) |
- | (22.2 | ) | - | - | - | (1,527 | ) | - | (1,527 | ) | |||||||||||||||||
| Cash dividends declared |
- | - | - | - | (501 | ) | - | - | (501 | ) | ||||||||||||||||||
| Balance at December 31, 2008 |
552.8 | (49.6 | ) | $ | 1,382 | $ | 3,949 | $ | 13,813 | $ | (2,993 | ) | $ | (704 | ) | $ | 15,447 | |||||||||||
| Comprehensive income: |
||||||||||||||||||||||||||||
| Net income |
- | - | 1,898 | - | - | 1,898 | ||||||||||||||||||||||
| Other comp. income |
- | - | - | - | 50 | 50 | ||||||||||||||||||||||
| Total comp. income (Note 9) |
- | - | 1,898 | - | 50 | 1,948 | ||||||||||||||||||||||
| Conversion, stock option exercises, forfeitures, and other |
0.7 | 1.1 | 2 | 19 | - | 69 | - | 90 | ||||||||||||||||||||
| Share repurchases (Note 16) |
- | - | - | - | - | - | - | - | ||||||||||||||||||||
| Cash dividends declared |
- | - | - | - | (544 | ) | - | - | (544 | ) | ||||||||||||||||||
| Balance at December 31, 2009 |
553.5 | (48.5 | ) | $ | 1,384 | $ | 3,968 | $ | 15,167 | $ | (2,924 | ) | $ | (654 | ) | $ | 16,941 | |||||||||||
[a] AOCI = Accumulated Other Comprehensive Income/(Loss) (Note 9)
The accompanying notes are an integral part of these Consolidated Financial Statements.
60
Table of Contents
NOTES TO THE CONSOLIDATED FINANCIAL STATEMENTS
Union Pacific Corporation and Subsidiary Companies
For purposes of this report, unless the context otherwise requires, all references herein to the “Corporation”, “UPC”, “we”, “us”, and “our” mean Union Pacific Corporation and its subsidiaries, including Union Pacific Railroad Company, which will be separately referred to herein as “UPRR” or the “Railroad”.
1. Nature of Operations
Operations and Segmentation – We are a Class I railroad that operates in the United States. We have 32,094 route miles, linking Pacific Coast and Gulf Coast ports with the Midwest and eastern United States gateways and providing several corridors to key Mexican gateways. We serve the western two-thirds of the country and maintain coordinated schedules with other rail carriers for the handling of freight to and from the Atlantic Coast, the Pacific Coast, the Southeast, the Southwest, Canada, and Mexico. Export and import traffic is moved through Gulf Coast and Pacific Coast ports and across the Mexican and Canadian borders.
The Railroad, along with its subsidiaries and rail affiliates, is our one reportable operating segment. Although revenues are analyzed by commodity group, we analyze the net financial results of the Railroad as one segment due to the integrated nature of our rail network. The following table provides revenue by commodity group:
| Millions of Dollars |
2009 |
2008 | 2007 | ||||||
| Agricultural |
$ | 2,666 | $ | 3,174 | $ | 2,605 | |||
| Automotive |
854 | 1,344 | 1,458 | ||||||
| Chemicals |
2,102 | 2,494 | 2,287 | ||||||
| Energy |
3,118 | 3,810 | 3,134 | ||||||
| Industrial Products |
2,147 | 3,273 | 3,077 | ||||||
| Intermodal |
2,486 | 3,023 | 2,925 | ||||||
| Total freight revenues |
$ | 13,373 | $ | 17,118 | $ | 15,486 | |||
| Other revenues |
770 | 852 | 797 | ||||||
| Total operating revenues |
$ | 14,143 | $ | 17,970 | $ | 16,283 | |||
Although our revenues are principally derived from customers domiciled in the United States, the ultimate points of origination or destination for some products transported are outside the United States.
Basis of Presentation – The Consolidated Financial Statements are presented in accordance with accounting principles generally accepted in the United States of America (GAAP) as codified in the Financial Accounting Standards Board (FASB) Accounting Standards Codification (ASC).
Subsequent Events Evaluation – We evaluated the effects of all subsequent events through February 5, 2010, the date of this report, which is concurrent with the date we file this report with the U.S. Securities and Exchange Commission (SEC).
2. Significant Accounting Policies
Change in Accounting Principle – We have historically accounted for rail grinding costs as a capital asset. Beginning in the first quarter of 2010, we will change our accounting policy for rail grinding costs
61
Table of Contents
from a capitalization method, under which we have capitalized the cost of rail grinding and depreciated such capitalized costs, to a direct expense method, under which we will expense rail grinding costs as incurred. The expense as incurred method is preferable, as it eliminates the subjectivity in determining the period of benefit associated with rail grinding over which to depreciate the associated capitalized costs. We will reflect this change as a change in accounting principle from an acceptable accounting principle to a preferable accounting principle. The application of this preferable accounting principle will be presented retrospectively to all periods presented in future earnings releases and SEC filings. When the accounting principle is retrospectively applied, net income for the years ended December 31, 2009, 2008, and 2007 will decrease by approximately $8 million, $3 million, and $7 million, or $0.01, $0.01 and $0.02 per share, respectively. This change in accounting principle is not expected to have a material impact on our consolidated financial position, results of operations, or cash flows.
Principles of Consolidation – The Consolidated Financial Statements include the accounts of Union Pacific Corporation and all of its subsidiaries. Investments in affiliated companies (20% to 50% owned) are accounted for using the equity method of accounting. All intercompany transactions are eliminated. We currently have no less than majority-owned investments that require consolidation under variable interest entity requirements.
Cash and Cash Equivalents – Cash equivalents consist of investments with original maturities of three months or less.
Investments – Investments represent our investments in affiliated companies (20% to 50% owned) that are accounted for under the equity method of accounting and investments in companies (less than 20% owned) accounted for under the cost method of accounting.
Materials and Supplies – Materials and supplies are carried at the lower of average cost or market.
Property and Depreciation – See Note 10.
Impairment of Long-lived Assets – We review long-lived assets, including identifiable intangibles, for impairment when events or changes in circumstances indicate that the carrying amount of an asset may not be recoverable. If impairment indicators are present and the estimated future undiscounted cash flows are less than the carrying value of the long-lived assets, the carrying value is reduced to the estimated fair value as measured by the discounted cash flows.
Revenue Recognition – We recognize freight revenues on a percentage-of-completion basis as freight moves from origin to destination. The allocation of revenue between reporting periods is based on the relative transit time in each reporting period with expenses recognized as incurred. Other revenues are recognized as service is performed or contractual obligations are met. Customer incentives, which are primarily provided for shipping a specified cumulative volume or shipping to/from specific locations, are recorded as a reduction to operating revenues based on actual or projected future customer shipments.
Translation of Foreign Currency – Our portion of the assets and liabilities related to foreign investments are translated into U.S. dollars at the exchange rates in effect at the balance sheet date. Revenue and expenses are translated at the average rates of exchange prevailing during the year. Unrealized gains or losses are reflected within common shareholders’ equity as accumulated other comprehensive income or loss.
Financial Instruments – The carrying value of our non-derivative financial instruments approximates fair value. The fair value of our derivative financial instruments is generally determined by reference to market values as quoted by recognized dealers or developed based upon the present value of expected future cash flows.
62
Table of Contents
We periodically use derivative financial instruments, for other than trading purposes, to manage risk related to changes in fuel prices and interest rates.
Fair Value Measurements – We use a fair value hierarchy that prioritizes the inputs to valuation techniques used to measure fair value into three broad levels. The level in the fair value hierarchy within which the fair value measurement in its entirety falls is determined based on the lowest level input that is significant to the fair value measurement in its entirety. These levels include:
Level 1: Quoted market prices in active markets for identical assets or liabilities.
Level 2: Observable market based inputs or unobservable inputs that are corroborated by market data.
Level 3: Unobservable inputs that are not corroborated by market data.
We have applied fair value measurements to our pension plan assets (see Note 5) and to our interest rate fair value hedges (see Note 12).
Stock-Based Compensation – We have several stock-based compensation plans under which employees and non-employee directors receive stock options, nonvested retention shares, and nonvested stock units. We refer to the nonvested shares and stock units collectively as “retention awards”. We have elected to issue treasury shares to cover option exercises and stock unit vestings, while new shares are issued when retention shares vest.
We measure and recognize compensation expense for all stock-based awards made to employees and directors, including stock options. Compensation expense is based on the calculated fair value of the awards as measured at the grant date and is expensed ratably over the service period of the awards (generally the vesting period). The fair value of retention awards is the closing stock price on the date of grant, while the fair value of stock options is determined by using the Black-Scholes option pricing model.
Information regarding stock-based compensation appears in the table below:
| Millions of Dollars |
2009 |
2008 | 2007 | ||||||
| Stock-based compensation, before tax: |
|||||||||
| Stock options |
$ | 19 | $ | 25 | $ | 21 | |||
| Retention awards |
39 | 40 | 23 | ||||||
| Total stock-based compensation, before tax |
$ | 58 | $ | 65 | $ | 44 | |||
| Total stock-based compensation, after tax |
$ | 36 | $ | 40 | $ | 27 | |||
| Excess tax benefits from equity compensation plans |
$ | 10 | $ | 54 | $ | 76 | |||
Earnings Per Share – Basic earnings per share are calculated on the weighted-average number of common shares outstanding during each period. Diluted earnings per share include shares issuable upon exercise of outstanding stock options and stock-based awards where the conversion of such instruments would be dilutive.
Use of Estimates – Our Consolidated Financial Statements include estimates and assumptions regarding certain assets, liabilities, revenue, and expenses and the disclosure of certain contingent assets and liabilities. Actual future results may differ from such estimates.
Income Taxes – We account for income taxes by recording taxes payable or refundable for the current year and deferred tax assets and liabilities for the expected future tax consequences of events that have
63
Table of Contents
been recognized in our financial statements or tax returns. These expected future tax consequences are measured based on current tax law; the effects of future changes in tax laws are not anticipated. Future tax law changes, such as a change in the corporate tax rate, could have a material impact on our financial condition, results of operations, or liquidity.
When appropriate, we record a valuation allowance against deferred tax assets to reflect that these tax assets may not be realized. In determining whether a valuation allowance is appropriate, we consider whether it is more likely than not that all or some portion of our deferred tax assets will not be realized, based on management’s judgments using available evidence about future events.
At times, we may claim tax benefits that may be challenged by a tax authority. We recognize tax benefits only for tax positions that are more likely than not to be sustained upon examination by tax authorities. The amount recognized is measured as the largest amount of benefit that is greater than 50 percent likely to be realized upon settlement. A liability for “unrecognized tax benefits” is recorded for any tax benefits claimed in our tax returns that do not meet these recognition and measurement standards.
Pension and Postretirement Benefits – We incur certain employment-related expenses associated with pensions and postretirement health benefits. In order to measure the expense associated with these benefits, we must make various assumptions including discount rates used to value certain liabilities, expected return on plan assets used to fund these expenses, salary increases, employee turnover rates, anticipated mortality rates, and expected future healthcare costs. The assumptions used by us are based on our historical experience as well as current facts and circumstances. We use third-party actuaries to assist us in properly measuring the expense and liability associated with these benefits.
Personal Injury – The cost of injuries to employees and others on our property is charged to expense based on estimates of the ultimate cost and number of incidents each year. We use third-party actuaries to assist us in properly measuring the expense and liability. Our personal injury liability is discounted to present value using applicable U.S. Treasury rates. Legal fees and incidental costs are expensed as incurred.
Asbestos – We estimate a liability for asserted and unasserted asbestos-related claims based on an assessment of the number and value of those claims. We use an external consulting firm to assist us in properly measuring our potential liability. Our liability for asbestos-related claims is not discounted to present value due to the uncertainty surrounding the timing of future payments. Legal fees and incidental costs are expensed as incurred.
Environmental – When environmental issues have been identified with respect to property currently or formerly owned, leased, or otherwise used in the conduct of our business, we and our consultants perform environmental assessments on such property. We expense the cost of the assessments as incurred. We accrue the cost of remediation where our obligation is probable and such costs can be reasonably estimated. We do not discount our environmental liabilities when the timing of the anticipated cash payments is not fixed or readily determinable. Legal fees and incidental costs are expensed as incurred.
3. Stock Split
On May 28, 2008, we completed a two-for-one stock split, effected in the form of a 100% stock dividend. The stock split entitled all shareholders of record at the close of business on May 12, 2008, to receive one additional share of our common stock, par value $2.50 per share, for each share of common stock held on that date. All references to common shares and per share amounts have been restated to reflect the stock split for all periods presented.
64
Table of Contents
4. Stock Options and Other Stock Plans
We have 100,962 options outstanding under the 1993 Stock Option and Retention Stock Plan of Union Pacific Corporation (1993 Plan). There are 7,140 restricted shares outstanding under the 1992 Restricted Stock Plan for Non-Employee Directors of Union Pacific Corporation. We no longer grant options or awards of retention shares and units under these plans.
In April 2000, the shareholders approved the Union Pacific Corporation 2000 Directors Plan (Directors Plan) whereby 1,100,000 shares of our common stock were reserved for issuance to our non-employee directors. Under the Directors Plan, each non-employee director, upon his or her initial election to the Board of Directors, receives a grant of 2,000 shares of retention shares or retention stock units. Prior to December 31, 2007, each non-employee director received annually an option to purchase at fair value a number of shares of our common stock, not to exceed 10,000 shares during any calendar year, determined by dividing 60,000 by 1/3 of the fair market value of one share of our common stock on the date of such Board of Directors meeting, with the resulting quotient rounded up or down to the nearest 50 shares. As of December 31, 2009, 18,000 restricted shares were outstanding under the Directors Plan and 292,000 options were outstanding under the Directors Plan.
The Union Pacific Corporation 2001 Stock Incentive Plan (2001 Plan) was approved by the shareholders in April 2001. The 2001 Plan reserved 24,000,000 shares of our common stock for issuance to eligible employees of the Corporation and its subsidiaries in the form of non-qualified options, incentive stock options, retention shares, stock units, and incentive bonus awards. Non-employee directors were not eligible for awards under the 2001 Plan. As of December 31, 2009, 3,366,230 options were outstanding under the 2001 Plan. We no longer grant any stock options or other stock or unit awards under this plan.
The Union Pacific Corporation 2004 Stock Incentive Plan (2004 Plan) was approved by shareholders in April 2004. The 2004 Plan reserved 42,000,000 shares of our common stock for issuance, plus any shares subject to awards made under the 2001 Plan and the 1993 Plan that were outstanding on April 16, 2004, and became available for regrant pursuant to the terms of the 2004 Plan. Under the 2004 Plan, non-qualified options, stock appreciation rights, retention shares, stock units, and incentive bonus awards may be granted to eligible employees of the Corporation and its subsidiaries. Non-employee directors are not eligible for awards under the 2004 Plan. As of December 31, 2009, 8,939,710 and 3,778,997 retention shares and stock units were outstanding under the 2004 Plan.
Pursuant to the above plans 33,559,150; 36,961,123; and 38,601,728 shares of our common stock were authorized and available for grant at December 31, 2009, 2008, and 2007, respectively.
Stock Options – We estimate the fair value of our stock option awards using the Black-Scholes option pricing model. Groups of employees and non-employee directors that have similar historical and expected exercise behavior are considered separately for valuation purposes. The table below shows the annual weighted-average assumptions used for valuation purposes:
| Weighted-Average Assumptions |
|
2009 |
2008 | 2007 | |||||
| Risk-free interest rate |
1.9% | 2.8% | 4.9% | ||||||
| Dividend yield |
2.3% | 1.4% | 1.4% | ||||||
| Expected life (years) |
5.1 | 5.3 | 4.7 | ||||||
| Volatility |
31.3% | 22.2% | 20.9% | ||||||
| Weighted-average grant-date fair value of options granted |
$ | 11.33 | $ | 13.35 | $ | 11.19 |
65
Table of Contents
The risk-free rate is based on the U.S. Treasury yield curve in effect at the time of grant; the dividend yield is calculated as the ratio of dividends paid per share of common stock to the stock price on the date of grant; the expected life is based on historical and expected exercise behavior; and volatility is based on the historical volatility of our stock price over the expected life of the option.
A summary of stock option activity during 2009 is presented below:
| Shares (thous.) |
Weighted- Average Exercise Price |
Weighted-Average Remaining Contractual Term |
Aggregate Intrinsic Value (millions) | ||||||
| Outstanding at January 1, 2009 |
11,983 | $ 40.81 | 5.6 yrs. | $ 108 | |||||
| Granted |
1,865 | 47.28 | N/A | N/A | |||||
| Exercised |
(1,130 | ) | 34.86 | N/A | N/A | ||||
| Forfeited or expired |
(19 | ) | 57.06 | N/A | N/A | ||||
| Outstanding at December 31, 2009 |
12,699 | $ 42.27 | 5.5 yrs. | $ 275 | |||||
| Vested or expected to vest |
12,599 | $ 42.19 | 5.5 yrs. | $ 274 | |||||
| Options exercisable at December 31, 2009 |
9,385 | $ 38.84 | 4.4 yrs. | $ 235 |
Stock options are granted at the closing price on the date of grant, have ten-year contractual terms, and vest no later than three years from the date of grant. None of the stock options outstanding at December 31, 2009 are subject to performance or market-based vesting conditions.
At December 31, 2009, there was $22 million of unrecognized compensation expense related to nonvested stock options, which is expected to be recognized over a weighted-average period of 1.2 years. Additional information regarding stock option exercises appears in the table below:
| Millions of Dollars |
2009 |
2008 | 2007 | ||||||||
| Intrinsic value of stock options exercised |
$ | 29 | $ | 169 | $ | 208 | |||||
| Cash received from option exercises |
39 | 83 | 132 | ||||||||
| Treasury shares repurchased for employee payroll taxes |
(8) | (28 | ) | (61 | ) | ||||||
| Tax benefit realized from option exercises |
11 | 63 | 78 | ||||||||
| Aggregate grant-date fair value of stock options vested |
29 | 21 | 11 | ||||||||
Retention Awards – The fair value of retention awards is based on the closing price of the stock on the grant date. Dividends and dividend equivalents are paid to participants during the vesting periods.
66
Table of Contents
Changes in our retention awards during 2009 were as follows:
|
Shares (thous.) |
Weighted-Average Grant-Date Fair Value | ||||
| Nonvested at January 1, 2009 |
2,015 | $ 49.39 | |||
| Granted |
988 | 47.43 | |||
| Vested |
(243 | ) | 32.84 | ||
| Forfeited |
(41 | ) | 51.58 | ||
| Nonvested at December 31, 2009 |
2,719 | $ 50.13 |
Retention awards are granted at no cost to the employee or non-employee director and vest over periods lasting up to four years. At December 31, 2009, there was $64 million of total unrecognized compensation expense related to nonvested retention awards, which is expected to be recognized over a weighted-average period of 1.8 years.
Performance Retention Awards – In February 2009, our Board of Directors approved performance stock unit grants. Other than different performance targets, the basic terms of these performance stock units are identical to those granted in January 2007 and 2008, including using annual return on invested capital (ROIC) as the performance measure. Additionally, a change was made to an underlying assumption used in connection with calculating a component of ROIC. A lower discount rate (an assumed interest rate) will be used in both the numerator and denominator when calculating the present value of our future operating lease payments to reflect changes to interest rates and our financing costs. This rate will be consistent with the methodology used to calculate our adjusted debt-to-capital ratio. We will use this new discount rate to calculate ROIC in connection with determining awards of performance stock units granted in 2009. For performance stock units granted in 2007 and 2008, we will continue calculating ROIC with the methodology and assumptions in effect when the performance stock units were granted. See calculation of ROIC in Management’s Discussion and Analysis of Financial Condition and Results of Operations – Other Operating/Performance and Financial Statistics – Return on Invested Capital as Adjusted (ROIC), Item 7.
Stock units awarded to selected employees under these grants are subject to continued employment for 37 months and the attainment of certain levels of ROIC. We expense the fair value of the units that are probable of being earned based on our forecasted ROIC over the 3-year performance period. We measure the fair value of these performance stock units based upon the closing price of the underlying common stock as of the date of grant, reduced by the present value of estimated future dividends. Dividend equivalents are paid to participants only after the units are earned.
The assumptions used to calculate the present value of estimated future dividends related to the February 2009 grant were as follows:
|
2009 | |||
| Dividend per share per quarter |
$ | 0.27 | |
| Risk-free interest rate at date of grant |
1.9% | ||
67
Table of Contents
Changes in our performance retention awards during 2009 were as follows:
| Shares (thous.) |
Weighted-Average Grant-Date Fair Value | ||||
| Nonvested at January 1, 2009 |
873 | $ 50.70 | |||
| Granted |
449 | 47.28 | |||
| Vested |
(240 | ) | 43.23 | ||
| Forfeited |
(22 | ) | 53.86 | ||
| Nonvested at December 31, 2009 |
1,060 | $ 50.88 |
At December 31, 2009, there was $22 million of total unrecognized compensation expense related to nonvested performance retention awards, which is expected to be recognized over a weighted-average period of 1.3 years. A portion of this expense is subject to achievement of the ROIC levels established for the performance stock unit grants.
5. Retirement Plans
Pension and Other Postretirement Benefits
Pension Plans – We provide defined benefit retirement income to eligible non-union employees through qualified and non-qualified (supplemental) pension plans. Qualified and non-qualified pension benefits are based on years of service and the highest compensation during the latest years of employment, with specific reductions made for early retirements.
Other Postretirement Benefits (OPEB) – We provide defined contribution medical and life insurance benefits for eligible retirees. These benefits are funded as medical claims and life insurance premiums are paid.
Plan Amendment
Effective January 1, 2010, Medicare-eligible retirees who are enrolled in the Union Pacific Retiree Medical Program will receive a contribution to a Health Reimbursement Account, which can be used to pay eligible out-of-pocket medical expenses. The impact of the plan amendment is reflected in the projected benefit obligation (PBO) at December 31, 2009.
Funded Status
We are required by GAAP to separately recognize the overfunded or underfunded status of our pension and OPEB plans as an asset or liability. The funded status represents the difference between the PBO and the fair value of the plan assets. The PBO is the present value of benefits earned to date by plan participants, including the effect of assumed future salary increases. The PBO of the OPEB plan is equal to the accumulated benefit obligation, as the present value of the OPEB liabilities is not affected by salary increases. Plan assets are measured at fair value. We use a December 31 measurement date for plan assets and obligations for all our retirement plans.
68
Table of Contents
Changes in our PBO and plan assets are as follows for the years ended December 31:
| Funded Status |
Pension |
OPEB | |||||||||||||
| Millions of Dollars | 2009 | 2008 | 2009 | 2008 | |||||||||||
| Projected Benefit Obligation |
|||||||||||||||
| Projected benefit obligation at beginning of year |
$ | 2,272 | $ | 2,112 | $ | 418 | $ | 326 | |||||||
| Service cost |
38 | 34 | 2 | 3 | |||||||||||
| Interest cost |
140 | 137 | 18 | 24 | |||||||||||
| Plan amendments |
- | - | (78 | ) | (9 | ) | |||||||||
| Actuarial loss (gain) |
140 | 132 | (21 | ) | 101 | ||||||||||
| Gross benefits paid |
(142) | (143 | ) | (25 | ) | (27 | ) | ||||||||
| Projected benefit obligation at end of year |
$ | 2,448 | $ | 2,272 | $ | 314 | $ | 418 | |||||||
| Plan Assets |
|||||||||||||||
| Fair value of plan assets at beginning of year |
$ | 1,543 | $ | 2,058 | $ | - | $ | - | |||||||
| Actual return on plan assets |
350 | (592 | ) | - | - | ||||||||||
| Voluntary funded pension plan contributions |
280 | 200 | - | - | |||||||||||
| Other funded pension plan contributions |
- | 8 | - | - | |||||||||||
| Non-qualified plan benefit contributions |
13 | 12 | 25 | 27 | |||||||||||
| Gross benefits paid |
(142) | (143 | ) | (25 | ) | (27 | ) | ||||||||
| Fair value of plan assets at end of year |
$ | 2,044 | $ | 1,543 | $ | - | $ | - | |||||||
| Funded status at end of year |
$ | (404) | $ | (729 | ) | $ | (314 | ) | $ | (418 | ) | ||||
| Amounts recognized in the statement of financial position as of December 31, 2009 and 2008 consist of:
|
| ||||||||||||||
|
Pension |
OPEB | ||||||||||||||
| Millions of Dollars | 2009 | 2008 | 2009 | 2008 | |||||||||||
| Noncurrent assets |
$ | 1 | $ | - | $ | - | $ | - | |||||||
| Current liabilities |
(13) | (12 | ) | (28 | ) | (30 | ) | ||||||||
| Noncurrent liabilities |
(392) | (717 | ) | (286 | ) | (388 | ) | ||||||||
| Net amounts recognized at end of year |
$ | (404) | $ | (729 | ) | $ | (314 | ) | $ | (418 | ) | ||||
Pre-tax amounts recognized in accumulated other comprehensive income/(loss) as of December 31, 2009 consist of:
| Millions of Dollars |
Pension |
OPEB | Total | |||||||||
| Prior service (cost)/credit |
$ | (7 | ) | $ | 146 | $ | 139 | |||||
| Net actuarial loss |
(942 | ) | (140 | ) | (1,082 | ) | ||||||
| Total |
$ | (949 | ) | $ | 6 | $ | (943 | ) | ||||
69
Table of Contents
Pre-tax amounts recognized in accumulated other comprehensive income/(loss) as of December 31, 2008 consist of:
| Millions of Dollars |
Pension |
OPEB | Total | |||||||||
| Prior service (cost)/credit |
$ | (12 | ) | $ | 111 | $ | 99 | |||||
| Net actuarial loss |
(1,023 | ) | (172 | ) | (1,195 | ) | ||||||
| Total |
$ | (1,035 | ) | $ | (61 | ) | $ | (1,096 | ) | |||
Other pre-tax changes recognized in other comprehensive income during 2009, 2008 and 2007 were as follows:
|
Pension |
OPEB | ||||||||||||||||||||||
| Millions of Dollars |
2009 | 2008 | 2007 | 2009 | 2008 | 2007 | |||||||||||||||||
| Prior service credit |
$ | - | $ | - | $ | - | $ | (78 | ) | $ | (9 | ) | $ | (10 | ) | ||||||||
| Net actuarial (gain)/loss |
(51) | 875 | (73 | ) | (21 | ) | 101 | (32 | ) | ||||||||||||||
| Amortization of: |
|||||||||||||||||||||||
| Prior service cost/(credit) |
(5) | (6 | ) | (6 | ) | 44 | 34 | 33 | |||||||||||||||
| Actuarial loss |
(30) | (10 | ) | (18 | ) | (12 | ) | (13 | ) | (8 | ) | ||||||||||||
| Total |
$ | (86) | $ | 859 | $ | (97 | ) | $ | (67 | ) | $ | 113 | $ | (17 | ) | ||||||||
Amounts included in accumulated other comprehensive income expected to be amortized into net periodic cost (benefit) during 2010:
| Millions of Dollars |
Pension |
OPEB | Total | ||||||||
| Prior service cost (credit) |
$ | 4 | $ | (44 | ) | $ | (40 | ) | |||
| Net actuarial loss |
43 | 13 | 56 | ||||||||
| Total |
$ | 47 | $ | (31 | ) | $ | 16 | ||||
Underfunded Accumulated Benefit Obligation – The accumulated benefit obligation (ABO) is the present value of benefits earned to date, assuming no future salary growth. The underfunded accumulated benefit obligation represents the difference between the ABO and the fair value of plan assets. At December 31, 2008, the only pension plan that was underfunded was our non-qualified (supplemental) plan, which is not funded by design. At December 31, 2009, the non-qualified (supplemental) plan ABO was $229 million. The PBO, ABO, and fair value of plan assets for pension plans with accumulated benefit obligations in excess of the fair value of the plan assets were as follows for the years ended December 31:
| Underfunded Accumulated Benefit Obligation | |||||||
| Millions of Dollars | 2009 | 2008 | |||||
| Projected benefit obligation |
$ | (2,431) | $ | (2,272 | ) | ||
| Accumulated benefit obligation |
$ | (2,389) | $ | (2,201 | ) | ||
| Fair value of plan assets |
2,026 | 1,543 | |||||
| Underfunded accumulated benefit obligation |
$ | (363) | $ | (658 | ) | ||
70
Table of Contents
The ABO for all defined benefit pension plans was $2.4 billion and $2.2 billion at December 31, 2009 and 2008, respectively.
Assumptions – The weighted-average actuarial assumptions used to determine benefit obligations at December 31:
|
Pension |
OPEB | |||||||
| Percentages | 2009 | 2008 | 2009 | 2008 | ||||
| Discount rate |
5.90% | 6.25% | 5.55% | 6.25% | ||||
| Salary increase |
3.45% | 3.50% | N/A | N/A | ||||
| Health care cost trend rate for next year (employees under 65) |
N/A | N/A | 7.50% | 6.60% | ||||
| Health care cost trend rate for next year (employees over 65) |
N/A | N/A | 9.10% | 9.40% | ||||
| Ultimate health care cost trend rate |
N/A | N/A | 4.50% | 4.50% | ||||
| Year ultimate trend rate reached |
N/A | N/A | 2028 | 2028 | ||||
Expense
Both pension and OPEB expense are determined based upon the annual service cost of benefits (the actuarial cost of benefits earned during a period) and the interest cost on those liabilities, less the expected return on plan assets. The expected long-term rate of return on plan assets is applied to a calculated value of plan assets that recognizes changes in fair value over a five-year period. This practice is intended to reduce year-to-year volatility in pension expense, but it can have the effect of delaying the recognition of differences between actual returns on assets and expected returns based on long-term rate of return assumptions. Differences in actual experience in relation to assumptions are not recognized in net income immediately, but are deferred and, if necessary, amortized as pension or OPEB expense.
The components of our net periodic pension and OPEB cost/(benefit) were as follows for the years ended December 31:
|
Pension |
OPEB | |||||||||||||||||
| Millions of Dollars | 2009 | 2008 | 2007 | 2009 | 2008 | 2007 | ||||||||||||
| Net Periodic Benefit Cost: |
||||||||||||||||||
| Service cost |
$ | 38 | $ | 34 | $ | 34 | $ | 2 | $ | 3 | $ | 3 | ||||||
| Interest cost |
140 | 137 | 124 | 18 | 24 | 20 | ||||||||||||
| Expected return on plan assets |
(159) | (152) | (144) | - | - | - | ||||||||||||
| Amortization of: |
||||||||||||||||||
| Prior service cost/(credit) |
5 | 6 | 6 | (44) | (35) | (33) | ||||||||||||
| Actuarial loss |
30 | 10 | 18 | 12 | 13 | 8 | ||||||||||||
| Net periodic benefit cost/(benefit) |
$ | 54 | $ | 35 | $ | 38 | $ | (12) | $ | 5 | $ | (2) | ||||||
71
Table of Contents
Assumptions – The weighted-average actuarial assumptions used to determine expense were as follows for the years ended December 31:
|
Pension |
OPEB | |||||||||||
| Percentages | 2009 | 2008 | 2007 | 2009 | 2008 | 2007 | ||||||
| Discount rate |
6.25% | 6.50% | 6.00% | 6.25% | 6.50% | 6.00% | ||||||
| Expected return on plan assets |
8.00% | 8.00% | 8.00% | N/A | N/A | N/A | ||||||
| Salary increase |
3.50% | 3.50% | 3.00% | N/A | N/A | N/A | ||||||
| Health care cost trend rate for next year (employees under 65) |
N/A | N/A | N/A | 7.50% | 8.00% | 9.00% | ||||||
| Health care cost trend rate for next year (employees over 65) |
N/A | N/A | N/A | 9.10% | 10.00% | 11.00% | ||||||
| Ultimate healthcare cost trend rate |
N/A | N/A | N/A | 4.50% | 5.00% | 5.00% | ||||||
| Year ultimate trend reached |
N/A | N/A | N/A | 2028 | 2013 | 2013 | ||||||
For 2009 and 2008, the discount rate was based on a Mercer yield curve of high quality corporate bonds with cash flows matching our plans’ expected benefit payments. For 2007, the discount rate was based on a hypothetical portfolio of high quality corporate bonds with cash flows matching our plans’ expected benefit payments. The expected return on plan assets is based on our asset allocation mix and our historical return, taking into account current and expected market conditions. The actual return (loss) on pension plan assets, net of fees, was approximately 23% in 2009, (30)% in 2008, and 9% in 2007.
Assumed healthcare cost trend rates have a significant effect on the expense and liabilities reported for healthcare plans. The assumed healthcare cost trend rate is based on historical rates and expected market conditions. A one-percentage point change in the assumed healthcare cost trend rates would have the following effects on OPEB:
| Millions of Dollars |
One % pt. Increase |
One % pt. Decrease |
|||||
| Effect on total service and interest cost components |
$ | 1 | $ | (1 | ) | ||
| Effect on accumulated benefit obligation |
9 | (8 | ) | ||||
Cash Contributions
The following table details our cash contributions for the qualified pension plan and the benefit payments for the non-qualified and OPEB plans:
|
Pension |
||||||||
| Millions of Dollars | Qualified | Non-qualified | OPEB | |||||
| 2008 |
$ | 208 | $ 12 | $ | 27 | |||
| 2009 |
280 | 13 | 25 | |||||
Our policy with respect to funding the qualified plans is to fund at least the minimum required by law and not more than the maximum amount deductible for tax purposes. All contributions made to the qualified pension plans in 2009 were voluntary and were made with cash generated from operations.
The OPEB plans are not funded and are not subject to any minimum regulatory funding requirements. Benefit payments for each year represent claims paid for medical and life insurance, and we anticipate our 2010 OPEB payments will be made from cash generated from operations.
72
Table of Contents
Benefit Payments
The following table details expected benefit payments for the years 2010 through 2019:
| Millions of Dollars |
Pension |
OPEB | ||||
| 2010 |
$ | 139 | $ | 28 | ||
| 2011 |
144 | 28 | ||||
| 2012 |
149 | 28 | ||||
| 2013 |
155 | 28 | ||||
| 2014 |
162 | 28 | ||||
| Years 2015 -2019 |
885 | 130 | ||||
Asset Allocation Strategy
Our pension plan asset allocation at December 31, 2009 and 2008, and target allocation for 2010, are as follows:
|
Target 2010 |
Percentage of Plan Assets |
||||||
| 2009 | 2008 | ||||||
| Equity securities |
47% to 63% | 61% | 68 | % | |||
| Debt securities |
30% to 40% | 31 | 23 | ||||
| Real estate |
2% to 8% | 4 | 6 | ||||
| Commodities |
4% to 6% | 4 | 3 | ||||
| Total |
100% | 100 | % | ||||
The investment strategy for pension plan assets is to maintain a broadly diversified portfolio designed to achieve our target of an average long-term rate of return of 8%. While we believe we can achieve a long-term average rate of return of 8%, we cannot be certain that the portfolio will perform to our expectations. Assets are strategically allocated among equity, debt, and other investments in order to achieve a diversification level that dampens fluctuations in investment returns. Asset allocation target ranges for equity, debt, and other portfolios are evaluated at least every three years with the assistance of an independent external consulting firm. Actual asset allocations are monitored monthly, and rebalancing actions are executed at least quarterly, if needed.
The pension plan investments are held in a Master Trust, with The Northern Trust Company. The majority of pension plan assets are invested in equity securities, because equity portfolios have historically provided higher returns than debt and other asset classes over extended time horizons, and are expected to do so in the future. Correspondingly, equity investments also entail greater risks than other investments. Equity risks are balanced by investing a significant portion of the plan’s assets in high quality debt securities. The average credit rating of the debt portfolio exceeded A+ as of December 31, 2009 and 2008. The debt portfolio is also broadly diversified and invested primarily in U.S. Treasury, mortgage, and corporate securities. The weighted-average maturity of the debt portfolio was 12 and 5 years at December 31, 2009 and 2008, respectively. The weighted-average maturity increased significantly in 2009 as a new long-term bond allocation was added to the investment portfolio. This new long-term bond allocation was established primarily to mitigate funding status risk associated with potential interest rate changes.
73
Table of Contents
The investment of pension plan assets in securities issued by Union Pacific is specifically prohibited for both the equity and debt portfolios, other than through index fund holdings.
Fair Value Measurements
The pension plan assets are valued at fair value. The following is a description of the valuation methodologies used for the investments measured at fair value, including the general classification of such instruments pursuant to the valuation hierarchy.
Temporary Cash Investments – These investments consist of U.S. dollars and foreign currencies held in master trust accounts at The Northern Trust Company. Foreign currencies held are reported in terms of U.S. dollars based on currency exchange rates readily available in active markets. These temporary cash investments are classified as Level 1 investments.
Registered Investment Companies – Registered Investment Companies are mutual funds, unit trusts, and other commingled funds registered with the Securities and Exchange Commission. Mutual fund and unit trust shares are traded actively on public exchanges. The share prices for mutual funds and unit trusts are published at the close of each business day. Holdings of mutual funds and unit trusts are classified as Level 1 investments. Other registered commingled funds are not traded publicly, but the underlying assets (stocks and bonds) held in these funds are traded on active markets and the prices for these assets are readily observable. Holdings in other registered commingled funds are classified as Level 2 investments.
U.S. Government Securities – U.S. Government Securities consist of bills, notes, bonds, and other fixed income securities issued directly by the U.S. Treasury or by government-sponsored enterprises. These assets are valued using a bid evaluation process with bid data provided by independent pricing sources. U.S. Government Securities are classified as Level 2 investments.
Corporate Bonds & Debentures – Corporate bonds and debentures consist of fixed income securities issued by U.S. and non-U.S. corporations. These assets are valued using a bid evaluation process with bid data provided by independent pricing sources. Corporate bonds & debentures are classified as Level 2 investments.
Corporate Stock – This investment category consists of common and preferred stock issued by U.S. and non-U.S. corporations. Common and preferred shares are traded actively on exchanges and price quotes for these shares are readily available. Holdings of corporate stock are classified as Level 1 investments.
Venture Capital and Partnerships – This investment category is comprised primarily of interests in limited partnerships that invest in privately-held companies or privately-held real estate assets. Due to the private nature of the partnership investments, pricing inputs are not readily observable. Asset valuations are developed by the general partners that manage the partnerships. These valuations are based on property appraisals, application of public market multiples to private company cash flows, utilization of market transactions that provide valuation information for comparable companies, and other methods. Holdings of limited partnership interests are classified as Level 3 investments.
This category also includes an investment in a limited liability company that invests in publicly-traded convertible securities. The limited liability company investment is a fund that invests in both long and short positions in convertible securities, stocks, and fixed income securities. The underlying securities held by the fund are traded actively on exchanges and price quotes for these investments are readily available. Interest in the limited liability company is classified as a Level 2 investment.
74
Table of Contents
This category also holds a small amount of public securities distributed by the partnerships. These public securities are classified as Level 1 investments.
Real Estate – Most of the real estate investments are partnership interests and are therefore included in the Venture Capital and Partnerships category. This category pertains to the real estate investments held in less commonly used structures such as private real estate investment trusts and pooled separate accounts. Asset valuations for the assets held in these structures are valued in a manner similar to that used for partnership investments. As with the limited partnership interests, the valuations for the holdings in these structures are not based on readily observable inputs. Interests in private real estate investment funds and pooled separate accounts are classified as Level 3 investments.
Common Trust Funds – Common trust funds are comprised of shares or units in commingled funds that are not publicly traded. The underlying assets in these funds (equity securities, fixed income securities, and commodity-related securities) are publicly traded on exchanges and price quotes for the assets held by these funds are readily available. Holdings of common trust funds are classified as Level 2 investments.
Other Investments – The category includes several miscellaneous assets such as commodity hedge fund investments. Some of these investments have directly observable values and are classified as Level 1 investments, but the majority of these investments have valuations that are based on observable inputs and are classified as Level 2 investments.
As of December 31, 2009, the pension plan assets measured at fair value on a recurring basis were as follows:
| Millions of Dollars |
Quoted Prices |
Significant Other Observable Inputs (Level 2) |
Significant (Level 3) |
Total | |||||
| Plan net assets: |
|||||||||
| Temporary cash investments |
$ 9 | $ - | $ - | $ | 9 | ||||
| Registered investment companies |
8 | 176 | - | 184 | |||||
| U.S. government securities |
- | 131 | - | 131 | |||||
| Corporate bonds & debentures |
- | 284 | - | 284 | |||||
| Corporate stock |
479 | 6 | - | 485 | |||||
| Venture capital and partnerships |
- | 94 | 206 | 300 | |||||
| Real estate |
- | - | 14 | 14 | |||||
| Common trust funds |
- | 574 | - | 574 | |||||
| Other investments |
3 | 27 | - | 30 | |||||
| Total plan net assets at fair value |
$ 499 | $ 1,292 | $ 220 | 2,011 | |||||
| Other assets [a] |
33 | ||||||||
| Total plan net assets |
$ | 2,044 | |||||||
| [a] | Other assets include accrued receivables and pending broker settlements. |
75
Table of Contents
The following table presents a reconciliation of the beginning and ending balances of the fair value measurements using significant unobservable inputs (Level 3):
| Millions of Dollars |
Venture |
Real Estate |
Total | |||||||||
| Beginning balance - January 1, 2009 |
$ | 218 | $ | 21 | $ | 239 | ||||||
| Realized gains/(losses) |
3 | - | 3 | |||||||||
| Unrealized gains/(losses) |
(38 | ) | (9 | ) | (47 | ) | ||||||
| Purchases, issuances, & settlements |
23 | 2 | 25 | |||||||||
| Ending balance - December 31, 2009 |
$ | 206 | $ | 14 | $ | 220 | ||||||
Other Retirement Programs
Thrift Plan – We provide a defined contribution plan (thrift plan) to eligible non-union employees and make matching contributions to the thrift plan. We match 50 cents for each dollar contributed by employees up to the first six percent of compensation contributed. Our thrift plan contributions were $14 million in 2009, 2008 and 2007.
Railroad Retirement System – All Railroad employees are covered by the Railroad Retirement System (the System). Contributions made to the System are expensed as incurred and amounted to approximately $562 million in 2009, $620 million in 2008, and $616 million in 2007.
Collective Bargaining Agreements – Under collective bargaining agreements, we provide certain postretirement healthcare and life insurance benefits for eligible union employees. Premiums under the plans are expensed as incurred and amounted to $48 million in 2009, $49 million in 2008, and $40 million in 2007.
6. Other Income
Other income included the following for the years ended December 31:
| Millions of Dollars |
2009 |
2008 | 2007 | ||||||||
| Rental income |
$ | 73 | $ | 87 | $ | 68 | |||||
| Net gain on non-operating asset dispositions |
162 | 41 | 52 | ||||||||
| Interest income |
5 | 21 | 50 | ||||||||
| Sale of receivables fees |
(9) | (23 | ) | (35 | ) | ||||||
| Non-operating environmental costs and other |
(36) | (34 | ) | (19 | ) | ||||||
| Total |
$ | 195 | $ | 92 | $ | 116 | |||||
In June of 2009, we completed a $118 million sale of land to the Regional Transportation District (RTD) in Colorado, resulting in a $116 million pre-tax gain. The agreement with the RTD involves a 33-mile industrial lead track in Boulder, Colorado.
76
Table of Contents
7. Income Taxes
Components of income tax expense/(benefit) were as follows for the years ended December 31:
| Millions of Dollars |
2009 |
2008 | 2007 | ||||||
| Current |
$ | 366 | $ | 771 | $ | 822 | |||
| Deferred |
685 | 681 | 354 | ||||||
| Unrecognized tax benefits |
38 | (134) | (22) | ||||||
| Total income tax expense |
$ | 1,089 | $ | 1,318 | $ | 1,154 | |||
|
For the years ended December 31, reconciliation between statutory and effective tax rates is as follows:
|
|||||||||
| Tax Rate Percentages |
2009 |
2008 | 2007 | ||||||
| Federal statutory tax rate |
35.0% | 35.0% | 35.0% | ||||||
| State statutory rates, net of federal benefits |
3.2 | 3.0 | 2.9 | ||||||
| Deferred tax adjustments |
(0.8) | (0.7) | 1.0 | ||||||
| Tax credits |
(0.8) | (0.9) | (0.6) | ||||||
| Other |
(0.1) | (0.3) | 0.1 | ||||||
| Effective tax rate |
36.5% | 36.1% | 38.4% | ||||||
In February of 2009, California enacted legislation that changed how corporate taxpayers determine the amount of their income subject to California tax. This change reduced our 2009 deferred tax expense by $14 million.
In 2007, the State of Illinois enacted legislation that changed how we determine the amount of our income subject to Illinois tax. This legislation increased our 2007 deferred tax expense by $27 million. In January of 2008, Illinois enacted technical corrections legislation that made additional changes in how we determine the amount of our income subject to Illinois tax. This legislation reduced our 2008 deferred tax expense by $16 million.
Deferred tax assets and liabilities are recorded for the expected future tax consequences of events that are reported in different periods for financial reporting and income tax purposes. The majority of our deferred tax liabilities relate to differences between the tax bases and financial reporting amounts of our land and depreciable property, due to accelerated tax depreciation, revaluation of assets in purchase accounting transactions, and differences in capitalization methods.
Deferred income tax liabilities/(assets) were comprised of the following at December 31:
|
Millions of Dollars |
2009 | 2008 | |||||
| Net current deferred income tax asset |
$ | (339) | $ | (276 | ) | ||
| Property |
10,494 | 10,006 | |||||
| State taxes, net of federal benefits |
726 | 675 | |||||
| Other |
(90) | (399) | |||||
| Net long-term deferred income tax liabilities |
11,130 | 10,282 | |||||
| Net deferred income tax liability |
$ | 10,791 | $ | 10,006 | |||
77
Table of Contents
When appropriate, we record a valuation allowance against deferred tax assets to reflect that these tax assets may not be realized. In determining whether a valuation allowance is appropriate, we consider whether it is more likely than not that all or some portion of our deferred tax assets will not be realized, based on management’s judgments using available evidence about future events. Our total valuation allowance at December 31, 2009 was $8 million. There was no valuation allowance at December 31, 2008.
Tax benefits are recognized only for tax positions that are more likely than not to be sustained upon examination by tax authorities. The amount recognized is measured as the largest amount of benefit that is greater than 50 percent likely to be realized upon settlement. Unrecognized tax benefits are tax benefits claimed in our tax returns that do not meet these recognition and measurement standards.
A reconciliation of changes in unrecognized tax benefits liabilities/(assets) from the beginning to the end of the reporting period is as follows:
| Millions of Dollars |
2009 |
2008 | ||||
| Unrecognized tax benefits at January 1 |
$ | 26 | $ | 161 | ||
| Increases for positions taken in current year |
18 | 10 | ||||
| Increases for positions taken in prior years |
50 | 1 | ||||
| Decreases for positions taken in prior years |
(28) | (23) | ||||
| Settlements with taxing authorities |
(3) | (55) | ||||
| Increases (decreases) for interest and penalties |
3 | (68) | ||||
| Lapse of statutes of limitations |
(5) | - | ||||
| Unrecognized tax benefits at December 31 |
$ | 61 | $ | 26 | ||
A portion of our unrecognized tax benefits would, if recognized, reduce our effective tax rate. The remaining unrecognized tax benefits relate to tax positions for which only the timing of the benefit is uncertain. Recognition of these tax benefits would reduce our effective tax rate only through a reduction of accrued interest and penalties. The unrecognized tax benefits that would reduce our effective tax rate are as follows:
| Millions of Dollars |
2009 |
2008 | ||||
| Unrecognized tax benefits that would reduce the effective tax rate |
$ | 86 | $ | 79 | ||
| Unrecognized tax benefits that would not reduce the effective tax rate |
(25) | (53) | ||||
| Total unrecognized tax benefits |
$ | 61 | $ | 26 | ||
We recognize interest and penalties as part of income tax expense. Total accrued liabilities for interest and penalties were $13 million and $10 million at December 31, 2009 and 2008, respectively. Total interest and penalties recognized as part of income tax expense (benefit) were $(11) million for 2009, $(9) million for 2008, and $3 million for 2007.
Internal Revenue Service (IRS) examinations have been completed and settled for all years prior to 1999, and the statute of limitations bars any additional tax assessments. Some interest calculations remain open back to 1986. The IRS has completed its examinations and issued notices of deficiency for tax years 1999 through 2006. We disagree with many of their proposed adjustments, and we are at IRS Appeals for these years. The IRS is examining the Corporation’s federal income tax returns for 2007 and 2008. Several state tax authorities are examining our state income tax returns for tax years 2003 through 2006.
78
Table of Contents
We filed interest refund claims in 2007 for years 1986 through 1994, and we received refunds of $12 million in 2008. In 2008, we signed a closing agreement resolving all tax matters at IRS Appeals for tax years 1995 through 1998. In connection with the settlement, in 2008 we paid the IRS $52 million of tax and $67 million of interest. We filed interest refund claims in 2009 for years 1995-1998, and received refunds of $17 million in October of 2009. The audit settlement and interest refund claims had only immaterial effects on our income tax expense for 2008 and 2009.
We expect that our unrecognized tax benefits will increase in the next 12 months as 2010 tax positions are added and we accrue interest. We do not anticipate any significant settlements during 2010; however, it is reasonably possible that some state tax disputes may be resolved, which could reduce unrecognized tax benefits by up to $10 million. Of the $61 million balance at December 31, 2009, $1 million is classified as current in the Consolidated Statement of Financial Position.
8. Earnings Per Share
The following table provides a reconciliation between basic and diluted earnings per share for the years ended December 31:
| Millions of Dollars, Except Per Share Amounts |
2009 |
2008 | 2007 | ||||||
| Net income |
$ | 1,898 | $ | 2,338 | $ | 1,855 | |||
| Weighted-average number of shares outstanding: |
|||||||||
| Basic |
503.0 | 510.6 | 531.9 | ||||||
| Dilutive effect of stock options |
1.5 | 3.4 | 4.2 | ||||||
| Dilutive effect of retention shares and units |
1.3 | 1.0 | 0.7 | ||||||
| Diluted |
505.8 | 515.0 | 536.8 | ||||||
| Earnings per share – basic |
$ | 3.77 | $ | 4.58 | $ | 3.49 | |||
| Earnings per share – diluted |
$ | 3.75 | $ | 4.54 | $ | 3.46 | |||
Common stock options totaling 4.6 million, 1.0 million, and 0.8 million for 2009, 2008, and 2007, respectively, were excluded from the computation of diluted earnings per share because the exercise prices of these options exceeded the average market price of our common stock for the respective periods, and the effect of their inclusion would be anti-dilutive.
79
Table of Contents
9. Comprehensive Income/(Loss)
Comprehensive income/(loss) was as follows:
| Millions of Dollars | 2009 |
2008 |
2007 | |||||||
| Net income |
$ | 1,898 | $ | 2,338 | $ | 1,855 | ||||
| Other comprehensive income/(loss): |
||||||||||
| Defined benefit plans |
44 | (604 | ) | 65 | ||||||
| Foreign currency translation |
6 | (26 | ) | 2 | ||||||
| Derivatives |
- | - | 1 | |||||||
| Total other comprehensive income/(loss) [a] |
50 | (630 | ) | 68 | ||||||
| Total comprehensive income |
$ | 1,948 | $ | 1,708 | $ | 1,923 | ||||
| [a] | Net of deferred taxes of $(101) million, $390 million, and $52 million during 2009, 2008, and 2007, respectively. |
The after-tax components of accumulated other comprehensive loss were as follows:
| Millions of Dollars |
Dec. 31, |
Dec. 31, 2008 | ||||
| Defined benefit plans |
$ | (615) | $ | (659) | ||
| Foreign currency translation |
(35) | (41) | ||||
| Derivatives |
(4) | (4) | ||||
| Total |
$ | (654) | $ | (704) | ||
80
Table of Contents
10. Properties
The following tables list the major categories of property and equipment, as well as the weighted-average composite depreciation rate for each category:
| Millions of Dollars, Except Percentages As of December 31, 2009 |
Cost |
Accumulated |
Net Book Value |
Depreciation Rate for 2009 | |||||||
| Land |
$ | 4,891 | $ | N/A | $ | 4,891 | N/A | ||||
| Road: |
|||||||||||
| Rail and other track material [a] |
11,926 | 4,530 | 7,396 | 3.6% | |||||||
| Ties |
7,254 | 1,767 | 5,487 | 2.7% | |||||||
| Ballast |
3,841 | 869 | 2,972 | 2.9% | |||||||
| Other [b] |
12,988 | 2,237 | 10,751 | 2.4% | |||||||
| Total road |
36,009 | 9,403 | 26,606 | 2.9% | |||||||
| Equipment: |
|||||||||||
| Locomotives |
6,156 | 2,470 | 3,686 | 5.0% | |||||||
| Freight cars |
1,885 | 1,015 | 870 | 4.2% | |||||||
| Work equipment and other |
168 | 32 | 136 | 3.6% | |||||||
| Total equipment |
8,209 | 3,517 | 4,692 | 4.8% | |||||||
| Technology and other |
477 | 204 | 273 | 12.5% | |||||||
| Construction in progress |
966 | - | 966 | N/A | |||||||
| Total |
$ | 50,552 | $ | 13,124 | $ | 37,428 | N/A | ||||
| Millions of Dollars, Except Percentages As of December 31, 2008 |
Cost |
Accumulated |
Net Book Value |
Depreciation Rate for 2008 | |||||||
| Land |
$ | 4,861 | $ | N/A | $ | 4,861 | N/A | ||||
| Road: |
|||||||||||
| Rail and other track material [a] |
11,366 | 4,263 | 7,103 | 4.2% | |||||||
| Ties |
6,827 | 1,626 | 5,201 | 2.7% | |||||||
| Ballast |
3,635 | 789 | 2,846 | 2.9% | |||||||
| Other [b] |
12,520 | 2,044 | 10,476 | 2.3% | |||||||
| Total road |
34,348 | 8,722 | 25,626 | 3.1% | |||||||
| Equipment: |
|||||||||||
| Locomotives |
5,157 | 2,243 | 2,914 | 4.7% | |||||||
| Freight cars |
1,985 | 1,033 | 952 | 4.1% | |||||||
| Work equipment and other |
158 | 29 | 129 | 3.6% | |||||||
| Total equipment |
7,300 | 3,305 | 3,995 | 4.5% | |||||||
| Technology and other |
468 | 187 | 281 | 12.7% | |||||||
| Construction in progress |
938 | - | 938 | N/A | |||||||
| Total |
$ | 47,915 | $ | 12,214 | $ | 35,701 | N/A | ||||
| [a] | Includes a weighted-average composite rate for rail in high-density traffic corridors as discussed below. |
| [b] | Other includes grading, bridges and tunnels, signals, buildings, and other road assets. |
81
Table of Contents
Property and Depreciation – Our railroad operations are highly capital intensive, and our large base of homogeneous, network-type assets turns over on a continuous basis. Each year we develop a capital program for the replacement of assets and for the acquisition or construction of assets that enable us to enhance our operations or provide new service offerings to customers. Assets purchased or constructed throughout the year are capitalized if they meet applicable minimum units of property criteria. Properties and equipment are carried at cost and are depreciated on a straight-line basis over their estimated service lives, which are measured in years, except for rail in high-density traffic corridors (i.e., all rail lines except for those subject to abandonment, yard and switching tracks, and electronic yards), which are measured in millions of gross tons per mile of track. We use the group method of depreciation in which all items with similar characteristics, use, and expected life are grouped together in asset classes, and are depreciated using composite depreciation rates. The group method of depreciation treats each asset class as a pool of resources, not as singular items. We currently have more than 60 depreciable asset classes, and we may increase or decrease the number of asset classes due to changes in technology, asset strategies, or other factors.
We determine the estimated service lives of depreciable railroad assets by means of depreciation studies. We perform depreciation studies at least every three years for equipment and every six years for track assets (i.e., rail and other track material, ties, and ballast) and other road property. Our depreciation studies take into account the following factors:
| • | Statistical analysis of historical patterns of use and retirements of each of our asset classes; |
| • | Evaluation of any expected changes in current operations and the outlook for continued use of the assets; |
| • | Evaluation of technological advances and changes to maintenance practices; and |
| • | Expected salvage to be received upon retirement. |
For rail in high-density traffic corridors, we measure estimated service lives in millions of gross tons per mile of track. It has been our experience that the lives of rail in high-density traffic corridors are closely correlated to usage (i.e., the amount of weight carried over the rail). The service lives also vary based on rail weight, rail condition, (e.g., new or secondhand), and rail type (e.g., straight or curve). Our depreciation studies for rail in high density traffic corridors consider each of these factors in determining the estimated service lives. For rail in high-density traffic corridors, we calculate depreciation rates annually by dividing the number of gross ton-miles carried over the rail (i.e., the weight of loaded and empty freight cars, locomotives and maintenance of way equipment transported over the rail) by the estimated service lives of the rail measured in millions of gross tons per mile. For all other depreciable assets, we compute depreciation based on the estimated service lives of our assets as determined from the analysis of our depreciation studies. Changes in the estimated service lives of our assets and their related depreciation rates are implemented prospectively.
Under group depreciation, the historical cost (net of salvage) of depreciable property that is retired or replaced in the ordinary course of business is charged to accumulated depreciation and no gain or loss is recognized. The historical cost of certain track assets is estimated using (i) inflation indices published by the Bureau of Labor Statistics and (ii) the estimated useful life of the assets as determined by our depreciation studies. The indices were selected because they closely correlate with the major costs of the properties comprising the applicable track asset classes. Because of the number of estimates inherent in the depreciation and retirement processes and because it is impossible to precisely estimate each of these variables until a group of property is completely retired, we continually monitor the estimated service lives of our assets and the accumulated depreciation associated with each asset class to ensure our depreciation rates are appropriate.
For retirements of depreciable railroad properties that do not occur in the normal course of business, a gain or loss may be recognized if the retirement meets each of the following three conditions: (i) is
82
Table of Contents
unusual, (ii) is material in amount, and (iii) varies significantly from the retirement profile identified through our depreciation studies. A gain or loss is recognized in other income when we sell land or dispose of assets that are not part of our railroad operations.
When we purchase an asset, we capitalize all costs necessary to make the asset ready for its intended use. However, many of our assets are self-constructed. A large portion of our capital expenditures is for replacement of existing road infrastructure assets (program projects), which is typically performed by our employees, and for track line expansion (capacity projects). Costs that are directly attributable or overhead costs that relate directly to capital projects are capitalized. Direct costs that are capitalized as part of self-constructed assets include material, labor, and work equipment. Indirect costs are capitalized if they clearly relate to the construction of the asset. These costs are allocated using appropriate statistical bases.
General and administrative expenditures are expensed as incurred. Normal repairs and maintenance are also expensed as incurred, while costs incurred that extend the useful life of an asset, improve the safety of our operations or improve operating efficiency are capitalized.
Assets held under capital leases are recorded at the lower of the net present value of the minimum lease payments or the fair value of the leased asset at the inception of the lease. Amortization expense is computed using the straight-line method over the shorter of the estimated useful lives of the assets or the period of the related lease.
11. Accounts Payable and Other Current Liabilities
| Millions of Dollars |
Dec. 31, |
Dec. 31, 2008 | ||||
| Accounts payable |
$ | 612 | $ | 629 | ||
| Accrued wages and vacation |
339 | 367 | ||||
| Accrued casualty costs |
379 | 390 | ||||
| Income and other taxes |
224 | 207 | ||||
| Dividends and interest |
347 | 328 | ||||
| Equipment rents payable |
89 | 93 | ||||
| Other |
480 | 546 | ||||
| Total accounts payable and other current liabilities |
$ | 2,470 | $ | 2,560 | ||
12. Financial Instruments
Strategy and Risk – We may use derivative financial instruments in limited instances for other than trading purposes to assist in managing our overall exposure to fluctuations in interest rates and fuel prices. We are not a party to leveraged derivatives and, by policy, do not use derivative financial instruments for speculative purposes. Derivative financial instruments qualifying for hedge accounting must maintain a specified level of effectiveness between the hedging instrument and the item being hedged, both at inception and throughout the hedged period. We formally document the nature and relationships between the hedging instruments and hedged items at inception, as well as our risk-management objectives, strategies for undertaking the various hedge transactions, and method of assessing hedge effectiveness. Changes in the fair market value of derivative financial instruments that do not qualify for hedge accounting are charged to earnings. We may use swaps, collars, futures, and/or forward contracts to mitigate the risk of adverse movements in interest rates and fuel prices; however, the use of these derivative financial instruments may limit future benefits from favorable interest rate and fuel price movements.
83
Table of Contents
Market and Credit Risk – We address market risk related to derivative financial instruments by selecting instruments with value fluctuations that highly correlate with the underlying hedged item. We manage credit risk related to derivative financial instruments, which is minimal, by requiring high credit standards for counterparties and periodic settlements. At December 31, 2009 and 2008, we were not required to provide collateral, nor had we received collateral, relating to our hedging activities.
Determination of Fair Value – We determine the fair values of our derivative financial instrument positions based upon current fair values as quoted by recognized dealers or the present value of expected future cash flows.
Interest Rate Fair Value Hedges – We manage our overall exposure to fluctuations in interest rates by adjusting the proportion of fixed and floating rate debt instruments within our debt portfolio over a given period. We generally manage the mix of fixed and floating rate debt through the issuance of targeted amounts of each as debt matures or as we require incremental borrowings. We employ derivatives, primarily swaps, as one of the tools to obtain the targeted mix. In addition, we also obtain flexibility in managing interest costs and the interest rate mix within our debt portfolio by evaluating the issuance of and managing outstanding callable fixed-rate debt securities.
Swaps allow us to convert debt from fixed rates to variable rates and thereby hedge the risk of changes in the debt’s fair value attributable to the changes in interest rates. We account for swaps as fair value hedges using the short-cut method; therefore, we do not record any ineffectiveness within our Consolidated Financial Statements.
The following is a summary of our interest rate derivatives qualifying as fair value hedges:
| Millions of Dollars, Except Percentages |
2009 |
2008 | ||||
| Amount of debt hedged |
$ | 250 | $ | 250 | ||
| Percentage of total debt portfolio |
3% | 3% | ||||
| Gross fair value asset position |
$ | 15 | $ | 19 | ||
We recognized the fair value as a Level 2 valuation. A Level 2 valuation is defined as observable market-based inputs or unobservable inputs that are corroborated by market data.
Interest Rate Cash Flow Hedges – We report changes in the fair value of cash flow hedges in accumulated other comprehensive income/loss until the hedged item affects earnings. At December 31, 2009 and 2008, we had reductions of $3 million and $4 million, respectively, recorded as an accumulated other comprehensive income/loss that is being amortized on a straight-line basis through September 30, 2014. As of December 31, 2009 and 2008, we had no interest rate cash flow hedges outstanding.
Earnings Impact – Our use of derivative financial instruments had the following impact on pre-tax income for the years ended December 31:
| Millions of Dollars |
2009 |
2008 | 2007 | ||||||
| (Increase)/decrease in interest expense from interest rate hedging |
$ | 8 | $ | 1 | $ | (8) | |||
| (Increase)/decrease in fuel expense from fuel derivatives |
- | 1 | (1) | ||||||
| Increase/(decrease) in pre-tax income |
$ | 8 | $ | 2 | $ | (9) | |||
Fair Value of Debt Instruments – The fair value of our short- and long-term debt was estimated using quoted market prices, where available, or current borrowing rates. At December 31, 2009, the fair value
84
Table of Contents
of total debt was $10.8 billion, approximately $945 million more than the carrying value. At December 31, 2008, the fair value of total debt was $8.7 billion, approximately $247 million less than the carrying value. At both December 31, 2009 and 2008, approximately $320 million of fixed-rate debt securities contained call provisions that allowed us to retire the debt instruments prior to final maturity, with the payment of fixed call premiums, or in certain cases, at par.
Sale of Receivables – The Railroad transfers most of its accounts receivable to Union Pacific Receivables, Inc. (UPRI), a bankruptcy-remote subsidiary, as part of a sale of receivables facility. UPRI sells, without recourse on a 364-day revolving basis, an undivided interest in such accounts receivable to investors. The total capacity to sell undivided interests to investors under the facility was $600 million and $700 million at December 31, 2009 and 2008, respectively. The value of the outstanding undivided interest held by investors under the facility was $400 million and $584 million at December 31, 2009 and 2008, respectively. During 2009, UPRI reduced the outstanding undivided interest held by investors due to a decrease in available receivables. The value of the undivided interest held by investors is not included in our Consolidated Financial Statements. The value of the undivided interest held by investors was supported by $817 million and $1,015 million of accounts receivable held by UPRI at December 31, 2009 and 2008, respectively. At December 31, 2009 and 2008, the value of the interest retained by UPRI was $417 million and $431 million, respectively. This retained interest is included in accounts receivable in our Consolidated Financial Statements. The interest sold to investors is sold at carrying value, which approximates fair value, and there is no gain or loss recognized from the transaction.
The value of the outstanding undivided interest held by investors could fluctuate based upon the availability of eligible receivables and is directly affected by changing business volumes and credit risks, including default and dilution. If default or dilution ratios increase one percent, the value of the outstanding undivided interest held by investors would not change as of December 31, 2009. Should our credit rating fall below investment grade, the value of the outstanding undivided interest held by investors would be reduced, and, in certain cases, the investors would have the right to discontinue the facility.
The Railroad services the sold receivables; however, the Railroad does not recognize any servicing asset or liability, as the servicing fees adequately compensate us for these responsibilities. The Railroad collected approximately $13.8 billion and $17.8 billion during the years ended December 31, 2009 and 2008, respectively. UPRI used certain of these proceeds to purchase new receivables under the facility.
The costs of the sale of receivables program are included in other income and were $9 million, $23 million, and $35 million for 2009, 2008, and 2007, respectively. The costs include interest, which will vary based on prevailing commercial paper rates, program fees paid to banks, commercial paper issuing costs, and fees for unused commitment availability. The decrease in the 2009 costs was primarily attributable to lower commercial paper rates and a decrease in the outstanding interest held by investors.
The investors have no recourse to the Railroad’s other assets except for customary warranty and indemnity claims. Creditors of the Railroad do not have recourse to the assets of UPRI.
In August 2009, the sale of receivables facility was renewed for an additional 364-day period at comparable terms and conditions, although the capacity to sell undivided interests was reduced from $700 million to $600 million.
See Note 17 to the Consolidated Financial Statements for information about recent accounting pronouncements that will have an impact on the accounting treatment of our sale of receivables program.
85
Table of Contents
13. Debt
Total debt as of December 31, 2009 and 2008, net of interest rate swaps designated as fair value hedges, is summarized below:
|
Millions of Dollars |
2009 | 2008 | ||||
| Notes and debentures, 3.0% to 7.9% due through 2054 [a] |
$ | 7,277 | $ | 6,934 | ||
| Capitalized leases, 4.7% to 9.5% due through 2028 |
2,061 | 1,270 | ||||
| Equipment obligations, 6.2% to 7.8% due through 2031 |
219 | 255 | ||||
| Tax-exempt financings, 2.5% to 5.7% due through 2026 |
182 | 185 | ||||
| Commercial paper |
- | 100 | ||||
| Floating rate term loan, due through 2013 |
100 | 100 | ||||
| Medium-term notes, 9.2% to 10.0% due through 2020 |
61 | 61 | ||||
| Mortgage bonds, 4.8% due through 2030 |
58 | 58 | ||||
| Other |
- | 76 | ||||
| Unamortized discount |
(110) | (112) | ||||
| Total debt [a] |
9,848 | 8,927 | ||||
| Less current portion |
(212) | (320) | ||||
| Total long-term debt |
$ | 9,636 | $ | 8,607 | ||
| [a] | 2009 and 2008 included a write-up of $15 million and $19 million, respectively, due to market value adjustments for debt with qualifying fair value hedges that are recorded on the Consolidated Statements of Financial Position. |
Debt Maturities – The following table presents aggregate debt maturities as of December 31, 2009, excluding market value adjustments.
|
Millions of Dollars |
|||
| 2010 |
$ | 532 | |
| 2011 |
619 | ||
| 2012 |
824 | ||
| 2013 |
775 | ||
| 2014 |
798 | ||
| Thereafter |
6,300 | ||
| Total debt |
$ | 9,848 | |
As of December 31, 2009, we have reclassified as long-term debt approximately $320 million of debt due within one year that we intend to refinance. This reclassification reflects our ability and intent to refinance any short-term borrowings and certain current maturities of long-term debt on a long-term basis. At December 31, 2008, we reclassified as long-term debt approximately $400 million of debt due within one year that we intended to refinance at that time.
Mortgaged Properties – Equipment with a carrying value of approximately $3.4 billion and $2.7 billion at December 31, 2009 and 2008, respectively, serves as collateral for capital leases and other types of equipment obligations in accordance with the secured financing arrangements utilized to acquire such railroad equipment.
86
Table of Contents
As a result of the merger of Missouri Pacific Railroad Company (MPRR) with and into UPRR on January 1, 1997, and pursuant to the underlying indentures for the MPRR mortgage bonds, UPRR must maintain the same value of assets after the merger in order to comply with the security requirements of the mortgage bonds. As of the merger date, the value of the MPRR assets that secured the mortgage bonds was approximately $6.0 billion. In accordance with the terms of the indentures, this collateral value must be maintained during the entire term of the mortgage bonds irrespective of the outstanding balance of such bonds.
Credit Facilities – On December 31, 2009, we had $1.9 billion of credit available under our revolving credit facility (the facility). The facility is designated for general corporate purposes and supports the issuance of commercial paper. We did not draw on the facility during 2009. Commitment fees and interest rates payable under the facility are similar to fees and rates available to comparably rated, investment-grade borrowers. The facility allows for borrowings at floating rates based on London Interbank Offered Rates, plus a spread, depending upon our senior unsecured debt ratings. The facility requires us to maintain a debt-to-net-worth coverage ratio as a condition to making a borrowing. At December 31, 2009, and December 31, 2008 (and at all times during these periods), we were in compliance with this covenant.
The definition of debt used for purposes of calculating the debt-to-net-worth coverage ratio includes, among other things, certain credit arrangements, capital leases, guarantees and unfunded and vested pension benefits under Title IV of ERISA. At December 31, 2009, the debt-to-net-worth coverage ratio allowed us to carry up to $33.9 billion of debt (as defined in the facility), and we had $10.4 billion of debt (as defined in the facility) outstanding at that date. Under our current capital plans, we expect to continue to satisfy the debt-to-net-worth coverage ratio; however, many factors beyond our reasonable control (including the Risk Factors in Item 1A of this report) could affect our ability to comply with this provision in the future. The facility does not include any other financial restrictions, credit rating triggers (other than rating-dependent pricing), or any other provision that could require us to post collateral. The facility also includes a $75 million cross-default provision and a change-of-control provision. The facility will expire in April 2012 in accordance with its term, and we currently intend to replace the facility with a substantially similar credit agreement on or before the expiration date, which is consistent with our past practices with respect to our credit facilities.
At December 31, 2009, we had no commercial paper outstanding. Outstanding commercial paper balances are supported by our revolving credit facility but do not reduce the amount of borrowings available under the facility. During 2009, we issued $100 million of commercial paper and repaid $200 million.
Dividend Restrictions – Our revolving credit facility includes a debt-to-net worth covenant that, under certain circumstances, restricts the payment of cash dividends to our shareholders. The amount of retained earnings available for dividends was $11.7 billion and $10.5 billion at December 31, 2009 and 2008, respectively.
Shelf Registration Statement and Significant New Borrowings – Under our current shelf registration statement, we may issue, from time to time, any combination of debt securities, preferred stock, common stock, or warrants for debt securities or preferred stock in one or more offerings.
87
Table of Contents
During 2009, we issued the following unsecured, fixed-rate debt securities under our current shelf registration:
| Date |
Description of Securities | |
| February 20, 2009 |
$350 million of 5.125% Notes due February 15, 2014 | |
| February 20, 2009 |
$400 million of 6.125% Notes due February 15, 2020 |
The net proceeds from these offerings were for general corporate purposes, including the repurchase of common stock pursuant to our share repurchase program. These debt securities include change-of-control provisions.
We have no immediate plans to issue equity securities; however, we will continue to explore opportunities to replace existing debt or access capital through issuances of debt securities under our shelf registration, and, therefore, we may issue additional debt securities at any time. At December 31, 2009, we had remaining authority from our Board of Directors to issue up to $2.25 billion of debt securities under our shelf registration.
During the second quarter of 2009, we restructured lease agreements for 813 locomotives resulting in a change in lease classification from operating to capital. As part of the restructuring arrangements, we received $87 million in cash consideration. We recorded capital lease assets of approximately $742 million and related capital lease obligations totaling approximately $843 million. Included in our capital lease obligations is the $87 million in cash consideration and $14 million of accrued operating lease payables that were reclassified as part of our capital lease obligations. Capital lease obligations are reported in our Consolidated Statements of Financial Position as debt.
On October 15, 2009, we entered into a capital lease agreement for 44 locomotives with a total equipment cost of $100 million. The lessor purchased the 44 locomotives from the Corporation and subsequently leased the locomotives back to the Railroad. These capital lease obligations are reported in our Consolidated Statements of Financial Position as debt at December 31, 2009.
88
Table of Contents
14. Leases
We lease certain locomotives, freight cars, and other property. The Consolidated Statement of Financial Position as of December 31, 2009 and 2008 included $2,754 million, net of $927 million of accumulated depreciation, and $2,024 million, net of $869 million of accumulated depreciation, respectively, for properties held under capital leases. A charge to income resulting from the depreciation for assets held under capital leases is included within depreciation expense in our Consolidated Statements of Income. Future minimum lease payments for operating and capital leases with initial or remaining non-cancelable lease terms in excess of one year as of December 31, 2009 were as follows:
| Millions of Dollars | Operating Leases |
Capital |
|||||
| 2010 |
$ | 576 | $ | 290 | |||
| 2011 |
570 | 292 | |||||
| 2012 |
488 | 247 | |||||
| 2013 |
425 | 256 | |||||
| 2014 |
352 | 267 | |||||
| Later years |
2,901 | 1,623 | |||||
| Total minimum lease payments |
$ | 5,312 | $ | 2,975 | |||
| Amount representing interest |
N/A | (914 | ) | ||||
| Present value of minimum lease payments |
N/A | $ | 2,061 | ||||
The majority of capital lease payments relate to locomotives. Rent expense for operating leases with terms exceeding one month was $686 million in 2009, $747 million in 2008, and $810 million in 2007. When cash rental payments are not made on a straight-line basis, we recognize variable rental expense on a straight-line basis over the lease term. Contingent rentals and sub-rentals are not significant.
15. Commitments and Contingencies
Asserted and Unasserted Claims – Various claims and lawsuits are pending against us and certain of our subsidiaries. We cannot fully determine the effect of all asserted and unasserted claims on our consolidated results of operations, financial condition, or liquidity; however, to the extent possible, where asserted and unasserted claims are considered probable and where such claims can be reasonably estimated, we have recorded a liability. We do not expect that any known lawsuits, claims, environmental costs, commitments, contingent liabilities, or guarantees will have a material adverse effect on our consolidated results of operations, financial condition, or liquidity after taking into account liabilities and insurance recoveries previously recorded for these matters.
Personal Injury – The cost of personal injuries to employees and others related to our activities is charged to expense based on estimates of the ultimate cost and number of incidents each year. We use third-party actuaries to assist us in measuring the expense and liability, including unasserted claims. The Federal Employers’ Liability Act (FELA) governs compensation for work-related accidents. Under FELA, damages are assessed based on a finding of fault through litigation or out-of-court settlements. We offer a comprehensive variety of services and rehabilitation programs for employees who are injured at work.
89
Table of Contents
Our personal injury liability is discounted to present value using applicable U.S. Treasury rates. Approximately 13% of the recorded liability related to asserted claims, and approximately 87% related to unasserted claims at December 31, 2009. Because of the uncertainty surrounding the ultimate outcome of personal injury claims, it is reasonably possible that future costs to settle these claims may range from approximately $545 million to $602 million. We record an accrual at the low end of the range as no amount of loss is more probable than any other. Our personal injury liability activity was as follows:
| Millions of Dollars |
2009 |
2008 | 2007 | ||||||
| Beginning balance |
$ | 621 | $ | 593 | $ | 631 | |||
| Accruals |
79 | 201 | 165 | ||||||
| Payments |
(155) | (173) | (203) | ||||||
| Ending balance at December 31 |
$ | 545 | $ | 621 | $ | 593 | |||
| Current portion, ending balance at December 31 |
$ | 158 | $ | 186 | $ | 204 | |||
Asbestos – We are a defendant in a number of lawsuits in which current and former employees and other parties allege exposure to asbestos. We engage a third party with extensive experience in estimating resolution costs for asbestos-related claims to assist us in assessing our potential liability. This liability is updated annually and excludes future defense and processing costs. The liability for resolving both asserted and unasserted claims was based on the following assumptions:
| • | The ratio of future claims by alleged disease would be consistent with historical averages. |
| • | The number of claims filed against us will decline each year. |
| • | The average settlement values for asserted and unasserted claims will be equivalent to historical averages. |
| • | The percentage of claims dismissed in the future will be equivalent to historical averages. |
Our liability for asbestos-related claims is not discounted to present value due to the uncertainty surrounding the timing of future payments. Approximately 21% of the recorded liability related to asserted claims and approximately 79% related to unasserted claims at December 31, 2009. Because of the uncertainty surrounding the ultimate outcome of asbestos-related claims, it is reasonably possible that future costs to settle these claims may range from approximately $174 million to $189 million. We record an accrual at the low end of the range as no amount of loss is more probable than any other. In conjunction with the liability update performed in 2009, we also reassessed estimated insurance recoveries. We have recognized an asset for estimated insurance recoveries at December 31, 2009 and 2008. Our asbestos-related liability activity was as follows:
| Millions of Dollars |
2009 |
2008 | 2007 | ||||||
| Beginning balance |
$ | 213 | $ | 265 | $ | 302 | |||
| Accruals/(credits) |
(25) | (42) | (20) | ||||||
| Payments |
(14) | (10) | (17) | ||||||
| Ending balance at December 31 |
$ | 174 | $ | 213 | $ | 265 | |||
| Current portion, ending balance at December 31 |
$ | 13 | $ | 12 | $ | 11 | |||
We believe that our estimates of liability for asbestos-related claims and insurance recoveries are reasonable and probable. The amounts recorded for asbestos-related liabilities and related insurance recoveries were based on currently known facts. However, future events, such as the number of new
90
Table of Contents
claims to be filed each year, average settlement costs, and insurance coverage issues, could cause the actual costs and insurance recoveries to be higher or lower than the projected amounts. Estimates also may vary in the future if strategies, activities, and outcomes of asbestos litigation materially change; federal and state laws governing asbestos litigation increase or decrease the probability or amount of compensation of claimants; and there are material changes with respect to payments made to claimants by other defendants.
Environmental – We are subject to federal, state, and local environmental laws and regulations. We identified 307 sites at which we are or may be liable for remediation costs associated with alleged contamination or for violations of environmental requirements. This includes 32 sites that are the subject of actions taken by the U.S. government, 17 of which are currently on the Superfund National Priorities List. Certain federal legislation imposes joint and several liability for the remediation of identified sites; consequently, our ultimate environmental liability may include costs relating to activities of other parties, in addition to costs relating to our own activities at each site.
When we identify an environmental issue with respect to property owned, leased, or otherwise used in our business, we and our consultants perform environmental assessments on the property. We expense the cost of the assessments as incurred. We accrue the cost of remediation where our obligation is probable and we can reasonably estimate such costs. We do not discount our environmental liabilities when the timing of the anticipated cash payments is not fixed or readily determinable. At December 31, 2009, approximately 12% of our environmental liability was discounted at 3.4%, while approximately 13% of our environmental liability was discounted at 3.5% at December 31, 2008. Our environmental liability activity was as follows:
| Millions of Dollars |
2009 |
2008 | 2007 | ||||||
| Beginning balance |
$ | 209 | $ | 209 | $ | 210 | |||
| Accruals |
49 | 46 | 41 | ||||||
| Payments |
(41) | (46) | (42) | ||||||
| Ending balance at December 31 |
$ | 217 | $ | 209 | $ | 209 | |||
| Current portion, ending balance at December 31 |
$ | 82 | $ | 58 | $ | 63 | |||
The liability includes future costs for remediation and restoration of sites, as well as ongoing monitoring costs, but excludes any anticipated recoveries from third parties. Cost estimates are based on information available for each site, financial viability of other potentially responsible parties, and existing technology, laws, and regulations. The ultimate liability for remediation is difficult to determine because of the number of potentially responsible parties, site-specific cost sharing arrangements with other potentially responsible parties, the degree of contamination by various wastes, the scarcity and quality of volumetric data related to many of the sites, and the speculative nature of remediation costs. Estimates of liability may vary over time due to changes in federal, state, and local laws governing environmental remediation. Current obligations are not expected to have a material adverse effect on our consolidated results of operations, financial condition, or liquidity.
Guarantees – At December 31, 2009, we were contingently liable for $416 million in guarantees. We have recorded a liability of $3 million and $4 million for the fair value of these obligations as of December 31, 2009 and 2008, respectively. We entered into these contingent guarantees in the normal course of business, and they include guaranteed obligations related to our headquarters building, equipment financings, and affiliated operations. The final guarantee expires in 2022. We are not aware of any existing event of default that would require us to satisfy these guarantees. We do not expect that these guarantees will have a material adverse effect on our consolidated financial condition, results of operations, or liquidity.
91
Table of Contents
Indemnities – Our maximum potential exposure under indemnification arrangements, including certain tax indemnifications, can range from a specified dollar amount to an unlimited amount, depending on the nature of the transactions and the agreements. Due to uncertainty as to whether claims will be made or how they will be resolved, we cannot reasonably determine the probability of an adverse claim or reasonably estimate any adverse liability or the total maximum exposure under these indemnification arrangements. We do not have any reason to believe that we will be required to make any material payments under these indemnity provisions.
16. Share Repurchase Program
On January 30, 2007, our Board of Directors authorized the repurchase of up to 40 million shares of Union Pacific Corporation common stock through the end of 2009. On May 1, 2008, our Board of Directors authorized the repurchase of an additional 40 million common shares by March 31, 2011. As of December 31, 2009, we have repurchased a total of $3 billion of Union Pacific Corporation common stock since the original repurchase plan was authorized. Management’s assessments of market conditions and other pertinent facts guide the timing and volume of all repurchases. If we elect to make repurchases of our common stock under this program in 2010, we expect to fund such repurchases through cash generated from operations, the sale or lease of various operating and non-operating properties, debt issuances, and cash on hand.
|
Number of Shares Purchased [a] |
Average Price Paid [a] | ||||||||
| 2009 | 2008 | 2009 | 2008 | ||||||
| First quarter |
- | 6,512,278 | $ | - | $ 61.83 | ||||
| Second quarter |
- | 6,337,197 | - | 75.83 | |||||
| Third quarter |
- | 5,943,111 | - | 74.85 | |||||
| Fourth quarter |
- | 3,383,282 | - | 58.72 | |||||
| Total |
- | 22,175,868 | $ | - | $ 68.84 | ||||
| Remaining number of shares that may yet be repurchased [a] |
32,577,090 | ||||||||
| [a] | All share numbers and prices have been restated to reflect the stock split completed on May 28, 2008 (see Note 3). |
17. Accounting Pronouncements
In January 2010, the FASB issued Accounting Standards Update No. 2010-06, Improving Disclosures about Fair Value Measurements. The Update provides amendments to FASB ASC 820-10 that require entities to disclose separately the amounts of significant transfers in and out of Level 1 and Level 2 fair value measurements and describe the reasons for the transfers. In addition the Update requires entities to present separately information about purchases, sales, issuances, and settlements in the reconciliation for fair value measurements using significant unobservable inputs (Level 3). The disclosures related to Level 1 and Level 2 fair value measurements are effective for us in 2010 and the disclosures related to Level 3 fair value measurements are effective for us in 2011. The Update requires new disclosures only, and will have no impact on our consolidated financial position, results of operations, or cash flows.
In June 2009, the FASB issued Statement No. 166, Accounting for Transfers of Financial Assets—an amendment of FASB Statement No. 140 (FAS 166). FAS 166 limits the circumstances in which transferred financial assets can be derecognized and requires enhanced disclosures regarding transfers of financial assets and a transferor’s continuing involvement with transferred financial assets. In addition, the concept of a qualifying special-purpose entity is no longer relevant for accounting purposes. Therefore, formerly qualifying special-purpose entities (as defined under previous accounting standards) should be evaluated for consolidation by reporting entities on and after the effective date in accordance
92
Table of Contents
with the applicable consolidation guidance. FAS 166 will be effective for us beginning in 2010. After adoption, transfers of undivided interests in accounts receivable to investors under our sale of receivables program will no longer qualify for sale treatment, but rather will be accounted for as secured borrowings in our Consolidated Statements of Financial Position. We are still evaluating the impact on our Consolidated Statements of Cash Flows related to the adoption of this standard. The value of the outstanding undivided interest held by investors under our sale of receivables program at December 31, 2009 was $400 million.
In June 2009, the FASB issued Statement No. 167, Amendments to FASB Interpretation No. 46(R) (FAS 167). FAS 167 retains the scope of Interpretation 46(R), Consolidation of Variable Interest Entities, with the addition of entities previously considered qualifying special-purpose entities, as the concept of these entities was eliminated in FASB Statement No. 166, Accounting for Transfers of Financial Assets—an amendment of FASB Statement No. 140. FAS 167 will be effective for us beginning in 2010. The adoption of FAS 167 will not affect our consolidated financial position, results of operations, or cash flows.
In June 2009, the FASB issued Statement No. 168, The FASB Accounting Standards CodificationTM and the Hierarchy of Generally Accepted Accounting Principles—a replacement of FASB Statement No. 162 (FAS 168). The Codification became the source of authoritative GAAP recognized by the FASB to be applied by nongovernmental entities. Rules and interpretive releases of the SEC under authority of federal securities laws are also sources of authoritative GAAP for SEC registrants. On the effective date of FAS 168, the Codification superseded all then-existing non-SEC accounting and reporting standards. All other nongrandfathered non-SEC accounting literature not included in the Codification became nonauthoritative. FAS 168 was effective for financial statements issued for interim and annual periods ending after September 15, 2009. The adoption of FAS 168 did not affect our consolidated financial position, results of operations, or cash flows.
In May 2009, the FASB issued Statement No. 165, Subsequent Events (FAS 165) (codified as FASB ASC 855-10-50). FAS 165 establishes general standards of accounting for and disclosures of events that occur after the balance sheet date but before financial statements are issued or are available to be issued. It requires the disclosure of the date through which an entity has evaluated subsequent events and the basis for that date. FAS 165 was effective for interim or annual financial periods ending after June 15, 2009. The adoption of FAS 165 did not affect our consolidated financial position, results of operations, or cash flows.
In April 2009, the FASB issued FSP No. FAS 107-1 and APB 28-1, Interim Disclosures about Fair Value of Financial Instruments (codified as FASB ASC 820-10-50). This FSP amends FASB Statement No. 107, to require disclosures about fair values of financial instruments for interim reporting periods as well as in annual financial statements. The FSP also amends APB Opinion No. 28 to require those disclosures in summarized financial information at interim reporting periods. This FSP was effective for interim reporting periods ending after June 15, 2009. The adoption of this FSP did not affect our consolidated financial position, results of operations, or cash flows.
In December 2008, the FASB issued FSP FAS 132(R)-1, Employers’ Disclosure about Postretirement Benefit Plan Assets (codified as FASB ASC 715-20-50), which amended Statement 132(R) to require more detailed disclosures about employers’ pension plan assets. New disclosures include more information on investment strategies, major categories of plan assets, concentrations of risk within plan assets and valuation techniques used to measure the fair value of plan assets. This new standard required new disclosures only, and had no impact on our consolidated financial position, results of operations or cash flows. These new disclosures are included in Note 5 to the Consolidated Financial Statements.
93
Table of Contents
18. Selected Quarterly Data (Unaudited)
|
Millions of Dollars, Except Per Share Amounts |
||||||||||||
| 2009 | Mar. 31 | Jun. 30 | Sep. 30 | Dec. 31 | ||||||||
| Operating revenues |
$ | 3,415 | $ | 3,303 | $ | 3,671 | $ | 3,754 | ||||
| Operating income |
672 | 751 | 967 | 1,002 | ||||||||
| Net income |
362 | 468 | 517 | 551 | ||||||||
| Net income per share |
||||||||||||
| Basic |
0.72 | 0.93 | 1.03 | 1.09 | ||||||||
| Diluted |
0.72 | 0.92 | 1.02 | 1.08 | ||||||||
| 2008 | Mar. 31 | Jun. 30 | Sep. 30 | Dec. 31 | ||||||||
| Operating revenues |
$ | 4,270 | $ | 4,568 | $ | 4,846 | $ | 4,286 | ||||
| Operating income |
788 | 931 | 1,215 | 1,141 | ||||||||
| Net income |
443 | 531 | 703 | 661 | ||||||||
| Net income per share |
||||||||||||
| Basic |
0.86 | 1.03 | 1.39 | 1.31 | ||||||||
| Diluted |
0.85 | 1.02 | 1.38 | 1.31 | ||||||||
94
Table of Contents
Item 9. Changes in and Disagreements with Accountants on Accounting and Financial Disclosure
None.
Item 9A. Controls and Procedures
As of the end of the period covered by this report, the Corporation carried out an evaluation, under the supervision and with the participation of the Corporation’s management, including the Corporation’s Chief Executive Officer (CEO) and Executive Vice President – Finance and Chief Financial Officer (CFO), of the effectiveness of the design and operation of the Corporation’s disclosure controls and procedures pursuant to Exchange Act Rules 13a-15 and 15d-15. In designing and evaluating the disclosure controls and procedures, management recognized that any controls and procedures, no matter how well designed and operated, can provide only reasonable assurance of achieving the desired control objectives. Based upon that evaluation, the CEO and the CFO concluded that, as of the end of the period covered by this report, the Corporation’s disclosure controls and procedures were effective to provide reasonable assurance that information required to be disclosed in our Exchange Act reports is recorded, processed, summarized and reported within the time periods specified by the SEC, and that such information is accumulated and communicated to management, including the CEO and CFO, as appropriate, to allow timely decisions regarding required disclosure.
Additionally, the CEO and CFO determined that there have been no changes to the Corporation’s internal control over financial reporting (as defined in Exchange Act Rules 13a-15(f) and 15d-15(f)) during the last fiscal quarter that have materially affected, or are reasonably likely to materially affect, the Corporation’s internal control over financial reporting.
95
Table of Contents
MANAGEMENT’S ANNUAL REPORT ON INTERNAL CONTROL OVER FINANCIAL REPORTING
The management of Union Pacific Corporation and Subsidiary Companies (the Corporation) is responsible for establishing and maintaining adequate internal control over financial reporting (as defined in Exchange Act Rules 13a-15(f) and 15d-15(f)). The Corporation’s internal control system was designed to provide reasonable assurance to the Corporation’s management and Board of Directors regarding the preparation and fair presentation of published financial statements.
All internal control systems, no matter how well designed, have inherent limitations. Therefore, even those systems determined to be effective can provide only reasonable assurance with respect to financial statement preparation and presentation.
The Corporation’s management assessed the effectiveness of the Corporation’s internal control over financial reporting as of December 31, 2009. In making this assessment, it used the criteria set forth by the Committee of Sponsoring Organizations of the Treadway Commission (COSO) in Internal Control – Integrated Framework. Based on our assessment, management believes that, as of December 31, 2009, the Corporation’s internal control over financial reporting is effective based on those criteria.
The Corporation’s independent registered public accounting firm has issued an attestation report on the effectiveness of the Corporation’s internal control over financial reporting. This report appears on the next page.
February 3, 2010
96
Table of Contents
REPORT OF INDEPENDENT REGISTERED PUBLIC ACCOUNTING FIRM
Union Pacific Corporation, its Directors, and Shareholders:
We have audited the internal control over financial reporting of Union Pacific Corporation and Subsidiary Companies (the Corporation) as of December 31, 2009, based on criteria established in Internal Control — Integrated Framework issued by the Committee of Sponsoring Organizations of the Treadway Commission. The Corporation’s management is responsible for maintaining effective internal control over financial reporting and for its assessment of the effectiveness of internal control over financial reporting, included in the accompanying Management’s Annual Report on Internal Control Over Financial Reporting. Our responsibility is to express an opinion on the Corporation’s internal control over financial reporting based on our audit.
We conducted our audit in accordance with the standards of the Public Company Accounting Oversight Board (United States). Those standards require that we plan and perform the audit to obtain reasonable assurance about whether effective internal control over financial reporting was maintained in all material respects. Our audit included obtaining an understanding of internal control over financial reporting, assessing the risk that a material weakness exists, testing and evaluating the design and operating effectiveness of internal control based on the assessed risk, and performing such other procedures as we considered necessary in the circumstances. We believe that our audit provides a reasonable basis for our opinion.
A company’s internal control over financial reporting is a process designed by, or under the supervision of, the company’s principal executive and principal financial officers, or persons performing similar functions, and effected by the company’s board of directors, management, and other personnel to provide reasonable assurance regarding the reliability of financial reporting and the preparation of financial statements for external purposes in accordance with generally accepted accounting principles. A company’s internal control over financial reporting includes those policies and procedures that (1) pertain to the maintenance of records that, in reasonable detail, accurately and fairly reflect the transactions and dispositions of the assets of the company; (2) provide reasonable assurance that transactions are recorded as necessary to permit preparation of financial statements in accordance with generally accepted accounting principles, and that receipts and expenditures of the company are being made only in accordance with authorizations of management and directors of the company; and (3) provide reasonable assurance regarding prevention or timely detection of unauthorized acquisition, use, or disposition of the company’s assets that could have a material effect on the financial statements.
Because of the inherent limitations of internal control over financial reporting, including the possibility of collusion or improper management override of controls, material misstatements due to error or fraud may not be prevented or detected on a timely basis. Also, projections of any evaluation of the effectiveness of the internal control over financial reporting to future periods are subject to the risk that the controls may become inadequate because of changes in conditions, or that the degree of compliance with the policies or procedures may deteriorate.
In our opinion, the Corporation maintained, in all material respects, effective internal control over financial reporting as of December 31, 2009, based on the criteria established in Internal Control — Integrated Framework issued by the Committee of Sponsoring Organizations of the Treadway Commission.
We have also audited, in accordance with the standards of the Public Company Accounting Oversight Board (United States), the consolidated financial statements and financial statement schedule as of and for the year ended December 31, 2009 of the Corporation and our report dated February 5, 2010 expressed an unqualified opinion on those financial statements and financial statement schedule.
|
|
| Omaha, Nebraska |
| February 5, 2010 |
97
Table of Contents
None.
PART III
Item 10. Directors, Executive Officers, and Corporate Governance
| (a) | Directors of Registrant. |
Information as to the names, ages, positions and offices with UPC, terms of office, periods of service, business experience during the past five years and certain other directorships held by each director or person nominated to become a director of UPC is set forth in the Election of Directors segment of the Proxy Statement and is incorporated herein by reference.
Information concerning our Audit Committee and the independence of its members, along with information about the audit committee financial expert(s) serving on the Audit Committee, is set forth in the Audit Committee segment of the Proxy Statement and is incorporated herein by reference.
| (b) | Executive Officers of Registrant. |
Information concerning the executive officers of UPC and its subsidiaries is presented in Part I of this report under Executive Officers of the Registrant and Principal Executive Officers of Subsidiaries.
| (c) | Section 16(a) Compliance. |
Information concerning compliance with Section 16(a) of the Securities Exchange Act of 1934 is set forth in the Section 16(a) Beneficial Ownership Reporting Compliance segment of the Proxy Statement and is incorporated herein by reference.
| (d) | Code of Ethics for Chief Executive Officer and Senior Financial Officers of Registrant. |
The Board of Directors of UPC has adopted the UPC Code of Ethics for the Chief Executive Officer and Senior Financial Officers (the Code). A copy of the Code may be found on the Internet at our website www.up.com/investors/governance. We intend to disclose any amendments to the Code or any waiver from a provision of the Code on our website.
Item 11. Executive Compensation
Information concerning compensation received by our directors and our named executive officers is presented in the Compensation Discussion and Analysis, Summary Compensation Table, Grants of Plan-Based Awards in Fiscal Year 2009, Outstanding Equity Awards at 2009 Fiscal Year-End, Option Exercises and Stock Vested in Fiscal Year 2009, Pension Benefits at 2009 Fiscal Year-End, Nonqualified Deferred Compensation at 2009 Fiscal Year-End, Potential Payments Upon Termination or Change in Control and Director Compensation in Fiscal Year 2009 segments of the Proxy Statement and is incorporated herein by reference. Additional information regarding compensation of directors, including Board committee members, is set forth in the By-Laws of UPC and the Stock Unit Grant and Deferred Compensation Plan for the Board of Directors, both of which are included as exhibits to this report. Information regarding the Compensation Committee is set forth in the Compensation Committee Interlocks and Insider Participation and Compensation Committee Report segments of the Proxy Statement and is incorporated herein by reference.
98
Table of Contents
Item 12. Security Ownership of Certain Beneficial Owners and Management and Related Stockholder Matters
Information as to the number of shares of our equity securities beneficially owned by each of our directors and nominees for director, our named executive officers, our directors and executive officers as a group, and certain beneficial owners is set forth in the Security Ownership of Certain Beneficial Owners and Management segment of the Proxy Statement and is incorporated herein by reference.
The following table summarizes the equity compensation plans under which Union Pacific Corporation common stock may be issued as of December 31, 2009.
| Plan Category | Number of securities to be issued upon exercise of outstanding options, warrants and rights (a) |
Weighted-average (b) |
Number of securities (c) | |||
| Equity compensation plans approved by security holders |
14,571,145 [1] | $ 42.26 [2] | 33,559,150 | |||
| Total |
14,571,145 | $ 42.26 | 33,559,150 |
| [1] | Includes 1,872,243 retention units that do not have an exercise price. Does not include 1,931,894 retention shares that have been issued and are outstanding. |
| [2] | Does not include the retention units or retention shares described above in footnote [1]. |
Item 13. Certain Relationships and Related Transactions and Director Independence
Information on related transactions is set forth in the Certain Relationships and Related Transactions and Compensation Committee Interlocks and Insider Participation segments of the Proxy Statement and is incorporated herein by reference. We do not have any relationship with any outside third party that would enable such a party to negotiate terms of a material transaction that may not be available to, or available from, other parties on an arm’s-length basis.
Information regarding the independence of our directors is set forth in the Director Independence segment of the Proxy Statement and is incorporated herein by reference.
Item 14. Principal Accountant Fees and Services
Information concerning the fees billed by our independent registered public accounting firm and the nature of services comprising the fees for each of the two most recent fiscal years in each of the following categories: (i) audit fees, (ii) audit-related fees, (iii) tax fees, and (iv) all other fees, is set forth in the Independent Registered Public Accounting Firm’s Fees and Services segment of the Proxy Statement and is incorporated herein by reference.
Information concerning our Audit Committee’s policies and procedures pertaining to pre-approval of audit and non-audit services rendered by our independent registered public accounting firm is set forth in the Audit Committee segment of the Proxy Statement and is incorporated herein by reference.
99
Table of Contents
PART IV
Item 15. Exhibits, Financial Statement Schedules
| (a) | Financial Statements, Financial Statement Schedules, and Exhibits: |
| (1) | Financial Statements |
The financial statements filed as part of this filing are listed on the index to the Financial Statements and Supplementary Data, Item 8, on page 55.
| (2) | Financial Statement Schedules |
Schedule II - Valuation and Qualifying Accounts
Schedules not listed above have been omitted because they are not applicable or not required or the information required to be set forth therein is included in the Financial Statements and Supplementary Data, Item 8, or notes thereto.
| (3) | Exhibits |
Exhibits are listed in the exhibit index beginning on page 103. The exhibits include management contracts, compensatory plans and arrangements required to be filed as exhibits to the Form 10-K by Item 601 (10) (iii) of Regulation S-K.
100
Table of Contents
Pursuant to the requirements of Section 13 or 15(d) of the Securities Exchange Act of 1934, the registrant has duly caused this report to be signed on its behalf by the undersigned, thereunto duly authorized, on this 5th day of February, 2010.
| UNION PACIFIC CORPORATION | ||
| By |
/s/ James R. Young | |
| James R. Young, | ||
| Chairman, President, Chief | ||
| Executive Officer, and Director | ||
Pursuant to the requirements of the Securities Exchange Act of 1934, this report has been signed below, on this 5th day of February, 2010, by the following persons on behalf of the registrant and in the capacities indicated.
PRINCIPAL EXECUTIVE OFFICER
AND DIRECTOR:
| /s/ James R. Young | ||
| James R. Young, | ||
| Chairman, President, Chief | ||
| Executive Officer, and Director |
PRINCIPAL FINANCIAL OFFICER:
| /s/ Robert M. Knight, Jr. | ||
| Robert M. Knight, Jr., | ||
| Executive Vice President - Finance | ||
| and Chief Financial Officer |
PRINCIPAL ACCOUNTING OFFICER:
| /s/ Jeffrey P. Totusek | ||
| Jeffrey P. Totusek, | ||
| Vice President and Controller | ||
DIRECTORS:
| Andrew H. Card, Jr.* |
Michael R. McCarthy* | |
| Erroll B. Davis, Jr.* |
Michael W. McConnell* | |
| Thomas J. Donohue* |
Thomas F. McLarty III* | |
| Archie W. Dunham* |
Steven R. Rogel* | |
| Judith Richards Hope* |
Jose H. Villarreal* | |
| Charles C. Krulak* |
||
| * By /s/ Thomas E. Whitaker |
||
Thomas E. Whitaker, Attorney-in-fact
101
Table of Contents
SCHEDULE II – VALUATION AND QUALIFYING ACCOUNTS
Union Pacific Corporation and Subsidiary Companies
|
Millions of Dollars, for the Years Ended December 31, |
2009 | 2008 | 2007 | ||||||
| Allowance for doubtful accounts: |
|||||||||
| Balance, beginning of period |
$ | 105 | $ | 75 | $ | 99 | |||
| Charges/(reduction) to expense |
2 | 23 | (7) | ||||||
| Net recoveries/(write-offs) |
(37) | 7 | (17) | ||||||
| Balance, end of period |
$ | 70 | $ | 105 | $ | 75 | |||
| Allowance for doubtful accounts are presented in the Consolidated Statements of Financial Position as follows: |
|||||||||
| Current |
$ | 3 | $ | 10 | $ | 3 | |||
| Long-term |
67 | 95 | 72 | ||||||
| Balance, end of period |
$ | 70 | $ | 105 | $ | 75 | |||
| Accrued casualty costs: |
|||||||||
| Balance, beginning of period |
$ | 1,206 | $ | 1,170 | $ | 1,277 | |||
| Charges to expense |
199 | 322 | 328 | ||||||
| Cash payments and other reductions |
(319) | (286) | (435) | ||||||
| Balance, end of period |
$ | 1,086 | $ | 1,206 | $ | 1,170 | |||
| Accrued casualty costs are presented in the Consolidated |
|||||||||
| Current |
$ | 379 | $ | 390 | $ | 371 | |||
| Long-term |
707 | 816 | 799 | ||||||
| Balance, end of period |
$ | 1,086 | $ | 1,206 | $ | 1,170 | |||
102
Table of Contents
UNION PACIFIC CORPORATION
Exhibit Index
| Exhibit No. |
Description | |
| Filed with this Statement | ||
| 10(a) |
Form of 2010 Long Term Plan Stock Unit Agreement. | |
| 12 |
Ratio of Earnings to Fixed Charges. | |
| 21 |
List of the Corporation’s significant subsidiaries and their respective states of incorporation. | |
| 23 |
Independent Registered Public Accounting Firm’s Consent. | |
| 24 |
Powers of attorney executed by the directors of UPC. | |
| 31(a) |
Certifications Pursuant to Rule 13a-14(a), of the Exchange Act, as Adopted pursuant to Section 302 of the Sarbanes-Oxley Act of 2002 - James R. Young. | |
| 31(b) |
Certifications Pursuant to Rule 13a-14(a), of the Exchange Act, as Adopted pursuant to Section 302 of the Sarbanes-Oxley Act of 2002 - Robert M. Knight, Jr. | |
| 32 |
Certifications Pursuant to 18 U.S.C. Section 1350, as Adopted pursuant to Section 906 of the Sarbanes-Oxley Act of 2002 - James R. Young and Robert M. Knight, Jr. | |
| 101 |
eXtensible Business Reporting Language (XBRL) documents submitted electronically: 101.INS (XBRL Instance Document), 101.SCH (XBRL Taxonomy Extension Schema Document), 101.CAL (XBRL Calculation Linkbase Document), 101.LAB (XBRL Taxonomy Label Linkbase Document), 101.DEF (XBRL Taxonomy Definition Linkbase Document) and 101.PRE (XBRL Taxonomy Presentation Linkbase Document). The following financial and related information from Union Pacific Corporation’s Annual Report on Form 10-K for the year ended December 31, 2009 (filed with the SEC on February 5, 2010), is formatted in XBRL and submitted electronically herewith: (i) Consolidated Statements of Income for the years ended December 31, 2009, 2008 and 2007, (ii) Consolidated Statements of Financial Position at December 31, 2009 and December 31, 2008, (iii) Consolidated Statements of Cash Flows for the years ended December 31, 2009, 2008 and 2007, (iv) Consolidated Statements of Changes in Common Shareholders’ Equity for the years ended December 31, 2009, 2008 and 2007, and (v) the Notes to the Consolidated Financial Statements, tagged as blocks of text. | |
| Incorporated by Reference | ||
| 3(a) |
By-Laws of UPC, as amended, effective May 14, 2009, are incorporated herein by reference to Exhibit 3.2 to the Corporation’s Current Report on Form 8-K dated May 15, 2009. | |
103
Table of Contents
| 3(b) |
Revised Articles of Incorporation of UPC, as amended through May 1, 2008, are incorporated herein by reference to Exhibit 3(a) to the Corporation’s Quarterly Report on Form 10-Q for the quarter ended September 30, 2008. | |
| 4(a) |
Indenture, dated as of December 20, 1996, between UPC and Wells Fargo Bank, National Association, as successor to Citibank, N.A., as Trustee, is incorporated herein by reference to Exhibit 4.1 to UPC’s Registration Statement on Form S-3 (No. 333-18345). | |
| 4(b) |
Indenture, dated as of April 1, 1999, between UPC and The Bank of New York, as successor to JP Morgan Chase Bank, formerly The Chase Manhattan Bank, as Trustee, is incorporated herein by reference to Exhibit 4.2 to UPC’s Registration Statement on Form S-3 (No. 333-75989). | |
| 4(c) |
Form of Debt Security (Note) is incorporated herein by reference to Exhibit 4.1 to the Corporation’s Current Report on Form 8-K, dated February 20, 2009. | |
| 4(d) |
Form of Debt Security (Note) is incorporated herein by reference to Exhibit 4.2 to the Corporation’s Current Report on Form 8-K, dated February 20, 2009.
Certain instruments evidencing long-term indebtedness of UPC are not filed as exhibits because the total amount of securities authorized under any single such instrument does not exceed 10% of the Corporation’s total consolidated assets. UPC agrees to furnish the Commission with a copy of any such instrument upon request by the Commission. | |
| 10(b) |
Form of Stock Unit Agreement for Executives dated February 5, 2009 is incorporated herein by reference to Exhibit 10(b) to the Corporation’s Annual Report on Form 10-K for the year ended December 31, 2008. | |
| 10(c) |
Supplemental Thrift Plan (409A Non-Grandfathered Component) of Union Pacific Corporation, effective as of January 1, 2009 is incorporated herein by reference to Exhibit 10(c) to the Corporation’s Annual Report on Form 10-K for the year ended December 31, 2008. | |
| 10(d) |
Supplemental Thrift Plan (409A Grandfathered Component) of Union Pacific Corporation, as amended and restated in its entirety, effective as of January 1, 2009 is incorporated herein by reference to Exhibit 10(d) to the Corporation’s Annual Report on Form 10-K for the year ended December 31, 2008. | |
| 10(e) |
Supplemental Pension Plan for Officers and Managers (409A Non-Grandfathered Component) of Union Pacific Corporation and Affiliates, as amended and restated in its entirety effective as of January 1, 1989, including all amendments adopted through January 1, 2009 is incorporated herein by reference to Exhibit 10(e) to the Corporation’s Annual Report on Form 10-K for the year ended December 31, 2008. | |
| 10(f) |
Supplemental Pension Plan for Officers and Managers (409A Grandfathered Component) of Union Pacific Corporation and Affiliates, as amended and restated in its entirety effective as of January 1, 1989, including all amendments adopted through January 1, 2009 is incorporated herein by reference to Exhibit 10(f) to the Corporation’s Annual Report on Form 10-K for the year ended December 31, 2008. | |
104
Table of Contents
| 10(g) |
Union Pacific Corporation Executive Incentive Plan, effective May 5, 2005, amended and restated effective January 1, 2009 is incorporated herein by reference to Exhibit 10(g) to the Corporation’s Annual Report on Form 10-K for the year ended December 31, 2008. | |
| 10(h) |
Deferred Compensation Plan (409A Non-Grandfathered Component) of Union Pacific Corporation, effective as January 1, 2009 is incorporated herein by reference to Exhibit 10(h) to the Corporation’s Annual Report on Form 10-K for the year ended December 31, 2008. | |
| 10 (i) |
Deferred Compensation Plan (409A Grandfathered Component) of Union Pacific Corporation, as amended and restated in its entirety, effective as January 1, 2009 is incorporated herein by reference to Exhibit 10(i) to the Corporation’s Annual Report on Form 10-K for the year ended December 31, 2008. | |
| 10(j) |
Union Pacific Corporation 2000 Directors Plan, effective as of April 21, 2000, as amended November 16, 2006, January 30, 2007 and January 1, 2009 is incorporated herein by reference to Exhibit 10(j) to the Corporation’s Annual Report on Form 10-K for the year ended December 31, 2008. | |
| 10(k) |
Union Pacific Corporation Stock Unit Grant and Deferred Compensation Plan for the Board of Directors (409A Non-Grandfathered Component), effective as of January 1, 2009 is incorporated herein by reference to Exhibit 10(k) to the Corporation’s Annual Report on Form 10-K for the year ended December 31, 2008. | |
| 10(l) |
Union Pacific Corporation Stock Unit Grant and Deferred Compensation Plan for the Board of Directors (409A Grandfathered Component), as amended and restated in its entirety, effective as of January 1, 2009 is incorporated herein by reference to Exhibit 10(l) to the Corporation’s Annual Report on Form 10-K for the year ended December 31, 2008. | |
| 10(m) |
Union Pacific Corporation 2004 Stock Incentive Plan, originally effective as of April 16, 2004 and amended and restated effective September 23, 2009 is incorporated herein by reference to Exhibit 10 to the Corporation’s Quarterly Report on Form 10-Q for the quarter ended September 30, 2009. | |
| 10(n) |
Union Pacific Corporation Key Employee Continuity Plan, dated as of November 16, 2000, as amended and restated effective as of January 1, 2009 is incorporated herein by reference to Exhibit 10(n) to the Corporation’s Annual Report on Form 10-K for the year ended December 31, 2008. | |
| 10(o) |
2006 Long Term Plan Amended and Restated Stock Unit Agreement is incorporated herein by reference to Exhibit 10(o) to the Corporation’s Annual Report on Form 10-K for the year ended December 31, 2008. | |
| 10(p) |
2007 Long Term Plan Amended and Restated Stock Unit Agreement is incorporated herein by reference to Exhibit 10(p) to the Corporation’s Annual Report on Form 10-K for the year ended December 31, 2008. | |
105
Table of Contents
| 10(q) |
2008 Long Term Plan Amended and Restated Stock Unit Agreement is incorporated herein by reference to Exhibit 10(q) to the Corporation’s Annual Report on Form 10-K for the year ended December 31, 2008. | |
| 10(r) |
The 1993 Stock Option and Retention Stock Plan of UPC, as amended November 16, 2006, is incorporated herein by reference to Exhibit 10 to the Corporation’s Quarterly Report on Form 10-Q for the quarter ended March 31, 2007. | |
| 10(s) |
UPC 2001 Stock Incentive Plan, as amended November 16, 2006, is incorporated herein by reference to Exhibit 10(e) to the Corporation’s Annual Report on Form 10-K for the year ended December 31, 2006. | |
| 10(t) |
Amended and Restated Registration Rights Agreement, dated as of July 12, 1996, among UPC, UP Holding Company, Inc., Union Pacific Merger Co. and Southern Pacific Rail Corporation (SP) is incorporated herein by reference to Annex J to the Joint Proxy Statement/Prospectus included in Post-Effective Amendment No. 2 to UPC’s Registration Statement on Form S-4 (No. 33-64707). | |
| 10(u) |
Agreement, dated September 25, 1995, among UPC, UPRR, Missouri Pacific Railroad Company (MPRR), SP, Southern Pacific Transportation Company (SPT), The Denver & Rio Grande Western Railroad Company (D&RGW), St. Louis Southwestern Railway Company (SLSRC) and SPCSL Corp. (SPCSL), on the one hand, and Burlington Northern Railroad Company (BN) and The Atchison, Topeka and Santa Fe Railway Company (Santa Fe), on the other hand, is incorporated by reference to Exhibit 10.11 to UPC’s Registration Statement on Form S-4 (No. 33-64707). | |
| 10(v) |
Supplemental Agreement, dated November 18, 1995, between UPC, UPRR, MPRR, SP, SPT, D&RGW, SLSRC and SPCSL, on the one hand, and BN and Santa Fe, on the other hand, is incorporated herein by reference to Exhibit 10.12 to UPC’s Registration Statement on Form S-4 (No. 33-64707). | |
| 10(w) |
The Pension Plan for Non-Employee Directors of UPC, as amended January 25, 1996, is incorporated herein by reference to Exhibit 10(w) to the Corporation’s Annual Report on Form 10-K for the year ended December 31, 1995. | |
| 10(x) |
The Executive Life Insurance Plan of UPC, as amended October 1997, is incorporated herein by reference to Exhibit 10(t) to the Corporation’s Annual Report on Form 10-K for the year ended December 31, 1997. | |
| 10(y) |
Charitable Contribution Plan for Non-Employee Directors of Union Pacific Corporation is incorporated herein by reference to Exhibit 10(z) to the Corporation’s Annual Report on Form 10-K for the year ended December 31, 1995. | |
| 10(z) |
Form of Non-Qualified Stock Option Agreement for Executives is incorporated herein by reference to Exhibit 10(a) to the Corporation’s Quarterly Report on Form 10-Q for the quarter ended September 30, 2004. | |
| 10(aa) |
Form of 2009 Long Term Plan Stock Unit Agreement is incorporated herein by reference to Exhibit 10(a) to the Corporation’s Annual Report on Form 10-K for the year ended December 31, 2008. | |
106
Table of Contents
| 10(bb) |
Form of Stock Unit Agreement for Executives is incorporated herein by reference to Exhibit 10(b) to the Corporation’s Quarterly Report on Form 10-Q for the quarter ended September 30, 2004. | |
| 10(cc) |
Form of Non-Qualified Stock Option Agreement for Directors is incorporated herein by reference to Exhibit 10(d) to the Corporation’s Quarterly Report on Form 10-Q for the quarter ended September 30, 2004. | |
| 10(dd) |
Form of Stock Unit Agreement for Executives is incorporated herein by reference to Exhibit 10(b) to the Corporation’s Annual Report on Form 10-K for the year ended December 31, 2005. | |
| 10(ee) |
Form of Non-Qualified Stock Option Agreement for Executives is incorporated herein by reference to Exhibit 10(c) to the Corporation’s Annual Report on Form 10-K for the year ended December 31, 2005. | |
| 10(ff) |
Executive Incentive Plan (2005) – Deferred Compensation Program, dated December 21, 2005 is incorporated herein by reference to Exhibit 10(g) to the Corporation’s Annual Report on Form 10-K for the year ended December 31, 2005. | |
| 99 |
U.S. $1,900,000,000 5-year revolving credit agreement, dated as of April 20, 2007, is incorporated herein by reference to Exhibit 99 to the Corporation’s Quarterly Report on Form 10-Q for the quarter ended June 30, 2007. | |
107