Attached files
| file | filename |
|---|---|
| EX-99.1 - PRESS RELEASE - SUNOCO INC | dex991.htm |
| 8-K - SUNOCO INC--FORM 8-K - SUNOCO INC | d8k.htm |
 4Q09 Earnings
Conference Call February 4, 2010 Exhibit 99.2 |
 2 Safe Harbor Statement This slide presentation should be reviewed in conjunction with Sunoco’s Fourth Quarter 2009
earnings conference call held on February 4, 2010 at 5:30 p.m. ET. You may listen to the audio portion of the conference call on the website or an audio recording will be available after the call’s completion by calling 1-800-642-1687 and entering conference ID #50643234. Statements in this presentation that are not historical facts are forward-looking statements
intended to be covered by the safe harbor provisions of Section 27A of the Securities
Act of 1933 and Section 21E of the Securities Exchange Act of 1934. These forward-looking statements are based upon assumptions by Sunoco concerning future conditions, any or all of which ultimately may prove to be inaccurate, and upon the current
knowledge, beliefs and expectations of Sunoco management. These forward-looking
statements are not guarantees of future performance. Forward-looking statements are
inherently uncertain and involve significant risks and uncertainties that could cause actual results to differ materially from those described during this presentation. Such risks and uncertainties include economic, business, competitive and/or regulatory factors affecting Sunoco's business, as well as
uncertainties related to the outcomes of pending or future litigation. In accordance with the safe harbor provisions of the Private Securities Litigation Reform Act of 1995, Sunoco has included in its Annual Report on Form 10-K for the year ended December 31, 2008, and in its subsequent Form 10-Q and Form 8-K filings, cautionary
language identifying important factors (though not necessarily all such factors) that
could cause future outcomes to differ materially from those set forth in the
forward-looking statements. For more information concerning these factors, see
Sunoco's Securities and Exchange Commission filings, available on Sunoco's website at
www.SunocoInc.com. Sunoco expressly disclaims any obligation to update or alter
its forward-looking statements, whether as a result of new information, future events or otherwise. This presentation includes certain non-GAAP financial measures intended to supplement, not
substitute for, comparable GAAP measures. Reconciliations of non-GAAP financial
measures to GAAP financial measures are provided in the Appendix at the end of the presentation. Investors are urged to consider carefully the comparable GAAP measures and the reconciliations to those measures provided in the Appendix, or on our website at www.SunocoInc.com. |
 3 Summary 2009 Results 2009 loss before special items* of $37MM ($0.32/share) Refining and Supply challenged by weak demand and rising crude prices Non-refining businesses earned $364MM in 2009 with strong contributions from Retail
Marketing, Logistics and Coke; however substantially offset by $313MM Refining & Supply loss Strategic Actions Shutdown of the Eagle Point refinery; Sale
of Chemicals’ polypropylene business; Tulsa refinery & Retail Heating
Oil business Successfully achieved more than $300MM cost savings through our business improvement initiative Modified pension and post-retirement healthcare plans Continued focus on maintaining financial flexibility - several recent actions to strengthen balance sheet &
liquidity * For reconciliation to Total Income (Loss), see Slide 18.
|
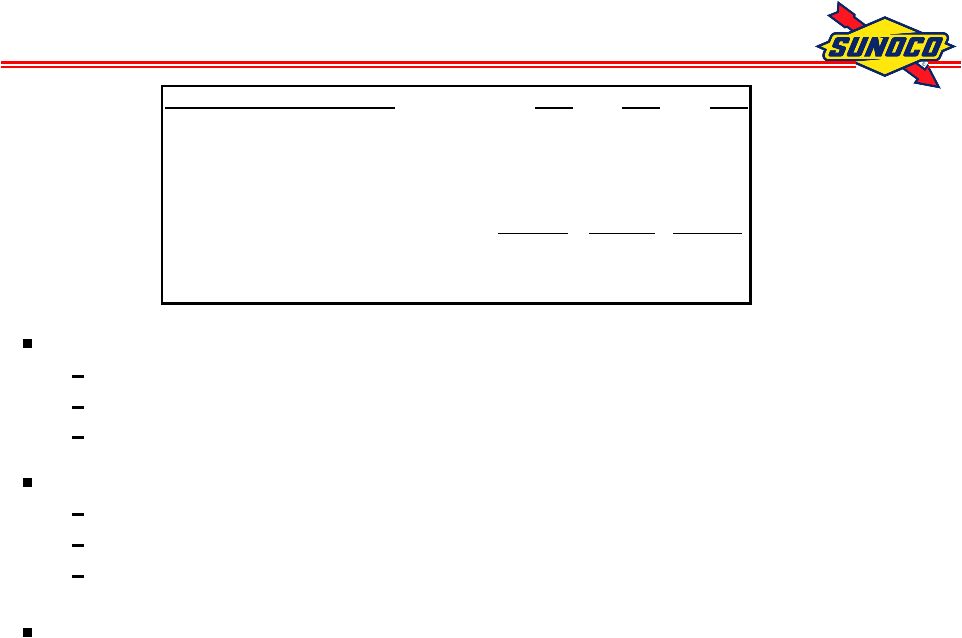
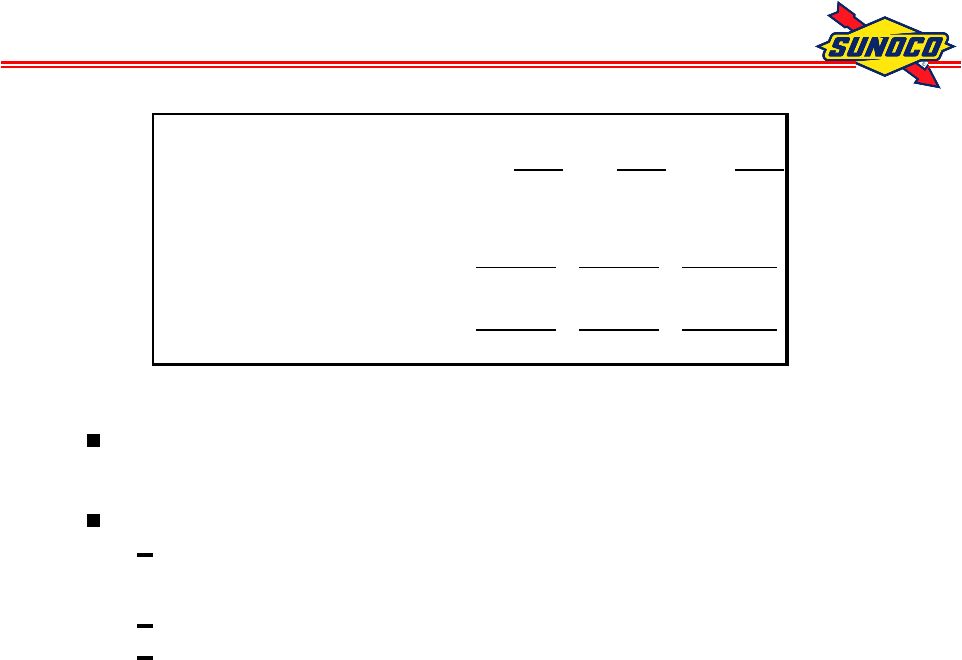
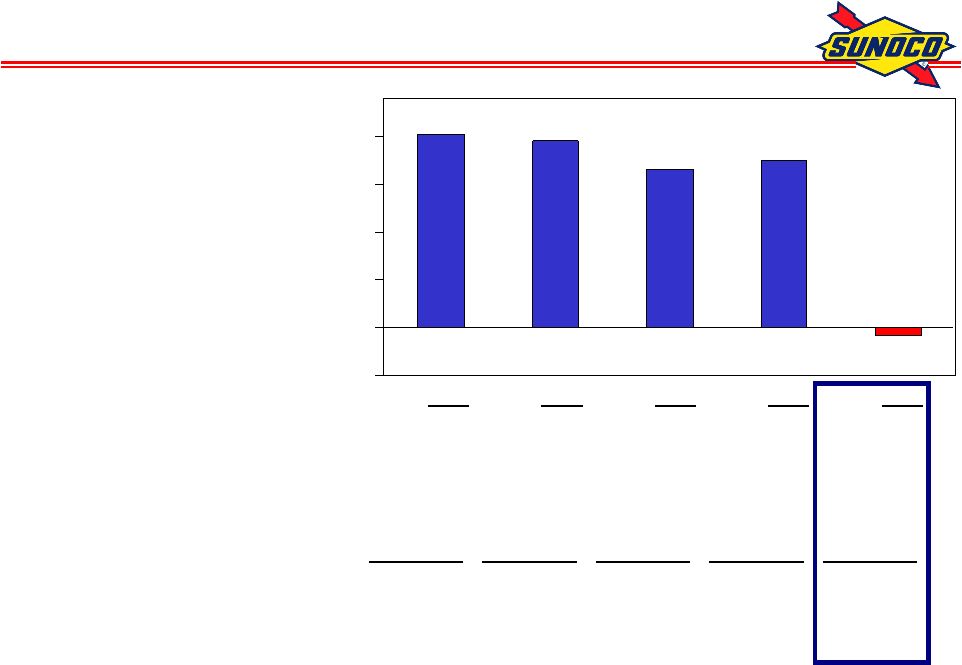 4 Income (Loss) Before Special Items*, MM$ 1,012 979 833 874 (37) ($250) $0 $250 $500 $750 $1,000 * For reconciliation to Total Income (Loss), see Slide 18. 2005 2006 2007 2008 2009 Refining & Supply: Continuing Operations 894 751 673 448 (316) Discontinued Tulsa Operations 53 130 99 67 3 Non-Refining 194 205 169 427 364 Corp. & Net Fin. (129) (107) (108) (68) (88) Income (Loss), Before Special Items 1,012 979 833 874 (37) EPS (Diluted), Before Special Items 7.36 7.59 6.94 7.46 (0.32) |
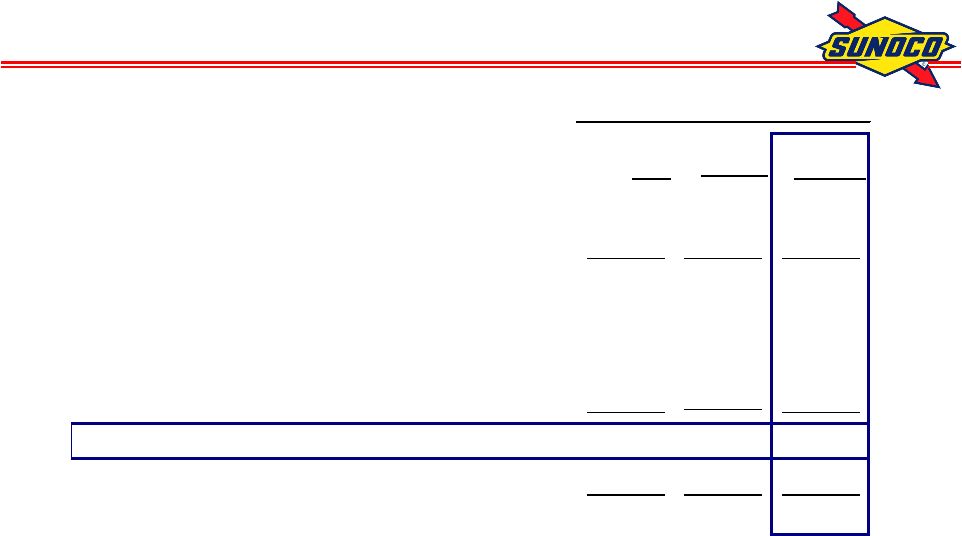
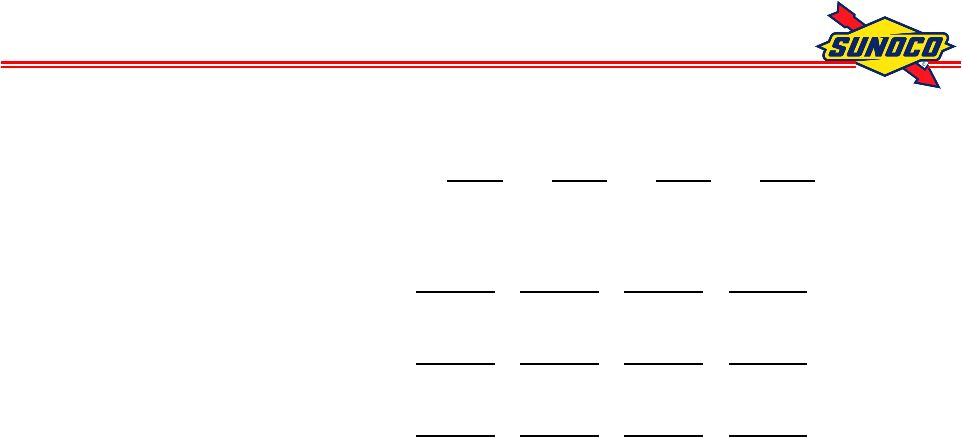
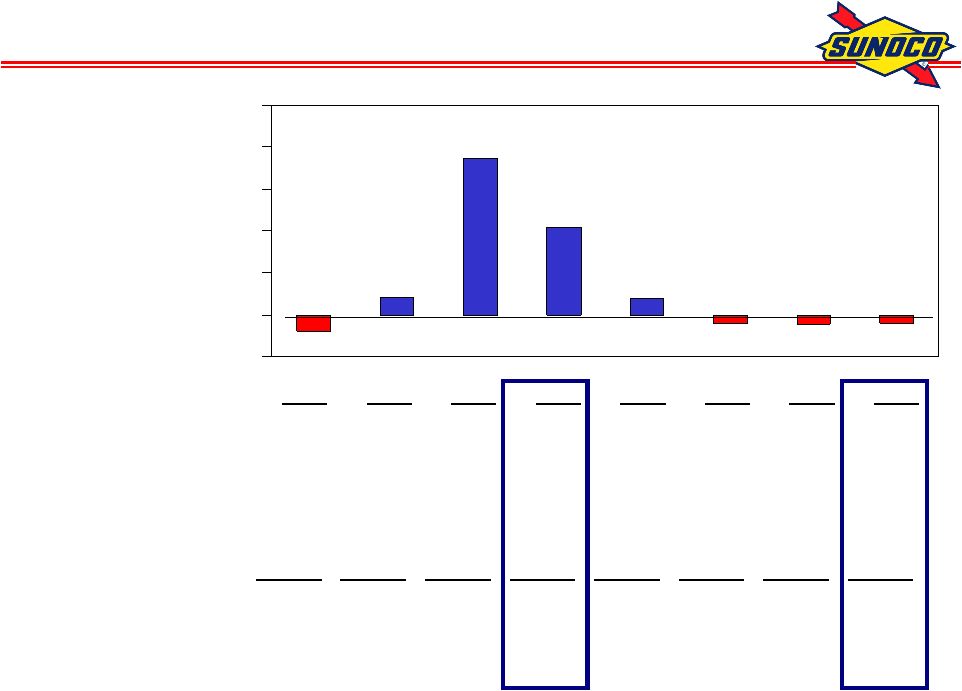 5 Income (Loss) Before Special Items*, MM$ (31) (59) 61 559 313 59 (31) (34) ($150) $0 $150 $300 $450 $600 $750 * For reconciliation to Total Income (Loss), see Slide 19. 1Q08 2Q08 3Q08 4Q08 1Q09 2Q09 3Q09 4Q09 Refining & Supply: Continuing operations (123) 27 398 146 14 (77) (118) (135) Discontinued Tulsa operations - 5 26 36 9 (6) - - Non-Refining 84 47 140 156 57 78 102 127 Corp. & Net Fin. (20) (18) (5) (25) (21) (26) (18) (23) Income (Loss), Before Special Items (59) 61 559 313 59 (31) (34) (31) EPS (Diluted), Before Special Items (0.50) 0.52 4.78 2.68 0.50 (0.27) (0.29) (0.27) |
 6 4Q09 Special Items, MM$ after tax $21 – Favorable adjustment to the gain related to the divestment of the discontinued Tulsa operations $55 – Gain from the liquidation of LIFO inventories in connection with the shutdown of the Eagle Point refinery ($19) – Provision reflecting costs associated with MTBE litigation as well as additional charges associated with the business improvement initiative and the Eagle Point shutdown $57 |
 7 Refining & Supply Summary* – 4Q09 4Q09 Loss from Continuing Operations of $135MM Margins deteriorated from the third quarter due to weak market conditions, particularly in Mid-Continent Utilization increased as Toledo returned to normal operations post-turnaround and we focused on optimization of Northeast system with Eagle Point idling in early November Outlook Market is expected to remain challenging with continued economic weakness and excess global supply Remain focused on optimizing our refining system through the Eagle Point shutdown and running our other assets in the Northeast reliably at higher operating rates Expect to begin to see benefits in 1Q10 of Eagle Point closure * Business Unit Income after tax. For reconciliation to Total Income (Loss), see Slide
19. |
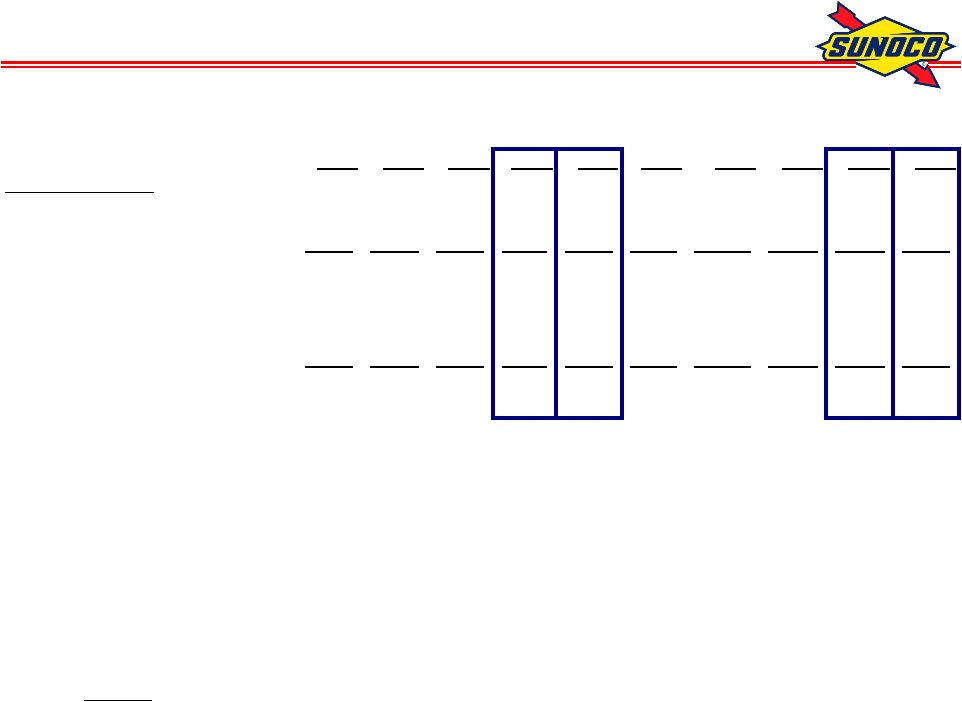 8 Realized Refining Margin vs. Benchmark, $/B * Excludes discontinued Tulsa refining operations. ** R&S Weighted Benchmark. For calculation, see Slide 31. 1Q08 2Q08 3Q08 4Q08 FY08 1Q09 2Q09 3Q09 4Q09 FY09 Refining & Supply Realized Margin * 3.16 6.98 14.87 8.98 8.60 6.33 3.65 2.72 1.96 3.66 Weighted Benchmark ** 5.61 10.74 12.58 6.60 8.88 6.71 7.05 5.57 4.59 5.98 Differential (2.45) (3.76) 2.29 2.38 (0.28) (0.38) (3.40) (2.85) (2.63) (2.32) Actual vs. Weighted Benchmark: Crude (2.73) (5.45) 0.35 0.25 (1.60) 0.40 (0.82) (0.90) (1.61) (0.73) Product 0.28 1.69 1.94 2.13 1.32 (0.78) (2.58) (1.95) (1.02) (1.59) Differential (2.45) (3.76) 2.29 2.38 (0.28) (0.38) (3.40) (2.85) (2.63) (2.32) |
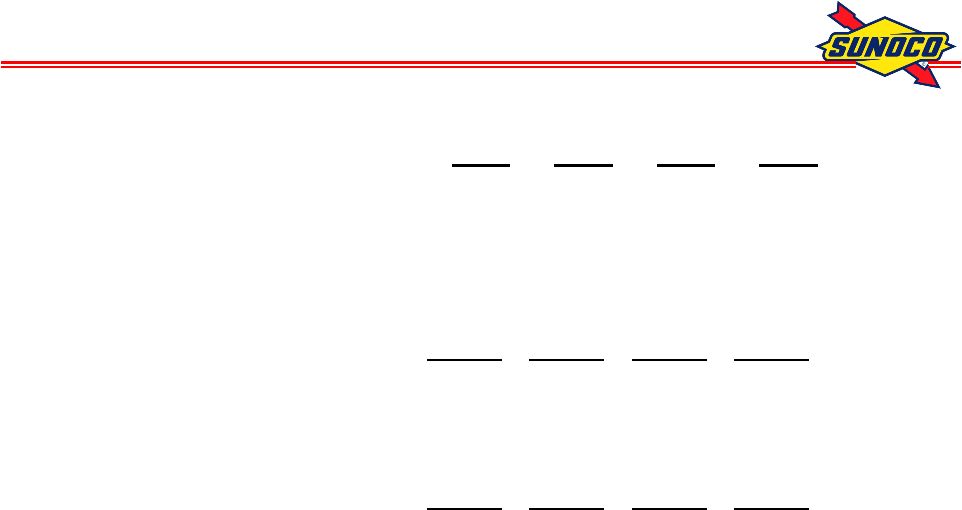
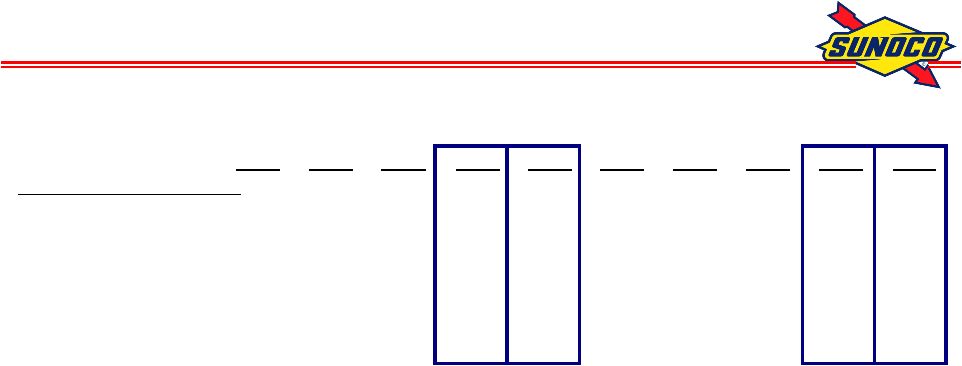
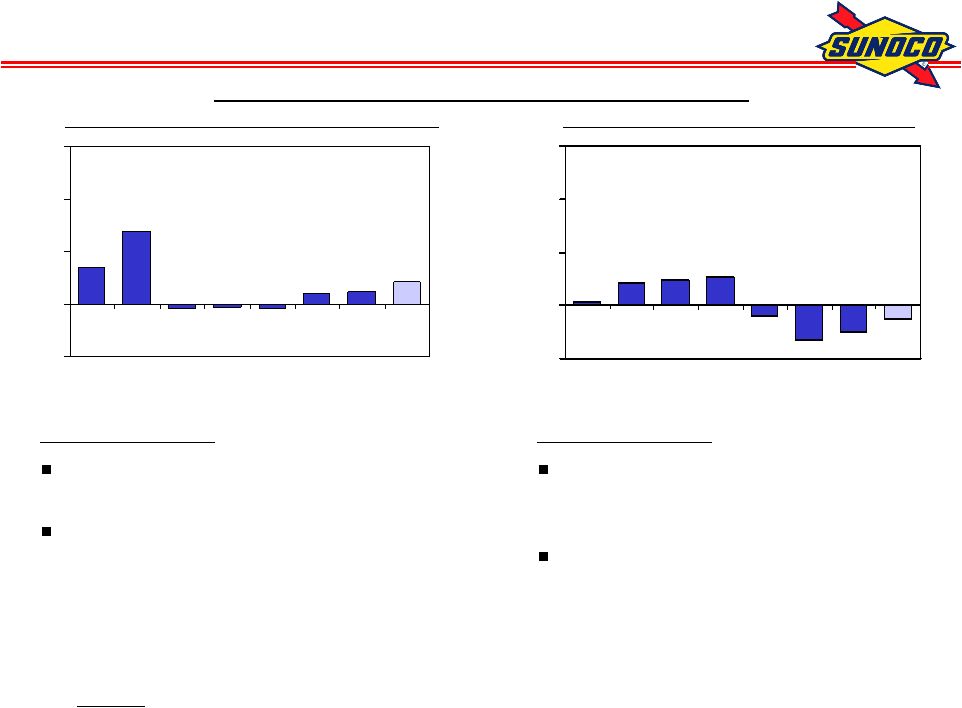 9 1.61 0.90 0.82 (0.25) (0.40) (0.35) 5.45 2.73 -4.00 0.00 4.00 8.00 12.00 1Q08 2Q08 3Q08 4Q08 1Q09 2Q09 3Q09 4Q09 Crude Cost vs. Weighted Benchmark
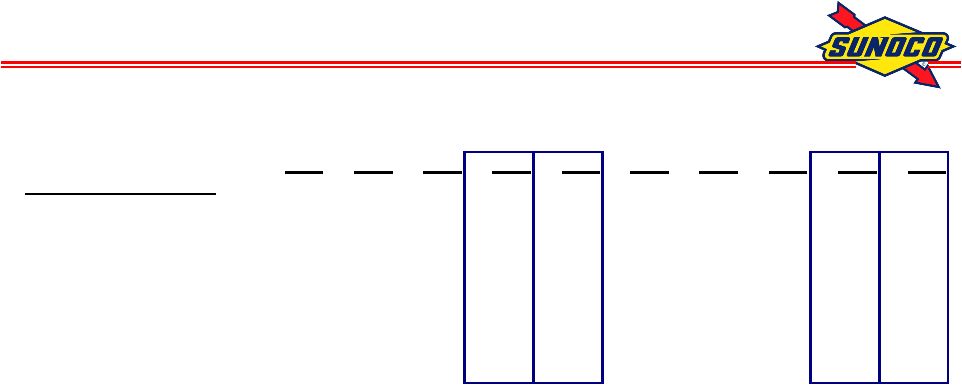
(1.02) (1.95) (2.58) (0.78) 2.13 1.94 1.69 0.28 -4.00 0.00 4.00 8.00 12.00 1Q08 2Q08 3Q08 4Q08 1Q09 2Q09 3Q09 4Q09 Products vs. Weighted Benchmark Refining Margin vs. Benchmark*, $/B Total Refining & Supply (excluding Tulsa) * R&S Weighted Benchmark. For calculation, see Slide 31. 4Q09 Comments: Timing impact due to crude price increase (~ $15/B increase during 4Q) Higher transportation costs 4Q09 Comments: Some improvement from 3Q09, but non-benchmark products challenged
with rise in crude prices Improved yield gains in Q4 due to
better operations in Northeast & Toledo |
 10 Non-Refining Businesses Income* - 4Q09 Retail Marketing – Earnings of $21MM Margins fell from 3Q09 due to rising wholesale prices; normal seasonal drop in volumes Chemicals – Earnings of $6MM Continued demand weakness due to economic conditions… Logistics – Earnings of $22MM Solid contributions continue from Sunoco Logistics Partners L.P. (NYSE: SXL) Coke – Earnings of $78MM Steady underlying earnings Includes a $41MM tax credit associated with the start up of Granite City Full year 2009 at $180 MM Difficult December operating environment due to severe weather conditions * Business Unit Income after tax. For reconciliation to Total Income (Loss), see Slide
19. |
 11 SunCoke Financial Summary *Represents Operating Cash Flow less Capital Spend; 2010 estimate assumes no changes to
capital plan & no major working capital changes 2010 Guidance EBITDA: $215MM - $235MM Net Income: $125MM - $140MM Free Cash Flow*: approximately breakeven 2010 Guidance Includes: Full Year of Granite City Operations Lower revenue from Jewell Coke due to lower contracted coal prices Higher spending on technology and business development for next phase of growth
Middletown Project Completion estimated for second half of 2011 Total SunCoke Energy, $MM 2007 2008 2009 EBITDA 34 160 226 Less: Depreciation 20 25 33 Less: Income Tax 3 46 73 Plus: Tax Credits 18 16 19 Plus: Granite City one-time tax credit - - 41 Net Income 29 105 180 Capital Spending (221) (312) (229) |
 12 SUN SXL (ex SXL) Sunoco Cash flow from Operations 134 421 555 (67) (139) (206) Free Cash Flow 67 282 349 Divestments - 47 47 Dividends - (35) (35) Distributions & Other (20) (3) (23) SXL Dividends to Sunoco (26) 26 - Net Cash Flow before Net Debt Activity 21 317 338 Net Debt Activity (21) (118) (139) Net Increase in Cash & Cash Equivalents - 199 199 4Q09 4Q09 Cash Flow, MM$ Capital Program
|
 13 Net Debt-to-Capital Ratio, % 37% 45% 41% * Proforma. ** Sunoco Revolver Covenant basis. For calculation, see Slides 24 and 25. 12/31/08 Sunoco (ex-SXL)* 29% 39% 32% SXL 53% 51% 50% Consolidated** 37% 45% 41% Sunoco Net Debt 1,179 1,539 1,223 SXL Net Debt 746 887 866 Total Net Debt, MM$ 1,925 2,426 2,089 9/30/09 12/31/09 |
 14 Capital Program by Business Unit, MM$
* Logistics Growth represents estimate of committed capital only Proj 2007 2008 2009 2010 Refining & Supply 700 652 380 320 Retail Marketing 111 128 80 124 Chemicals 66 49 35 31 Logistics 26 27 32 32 Coke 17 16 30 52 920 872 557 559 Growth:* Logistics 94 303 193 115 Coke 204 296 199 163 1,218 1,471 949 837 |
 15 Actions to Improve Balance Sheet & Liquidity Modification of Incentive Distribution Rights from SXL Provides Sunoco with
approximately $200 MM of cash in exchange for a portion of future cash
flows from the IDRs Improves cost of capital of SXL, enhancing its
long-term growth potential Demonstrates significant value of SUN’s
General Partner (GP) interest Sale of LP units in SXL will improve
liquidity Provides additional liquidity to Sunoco with net cash proceeds of
approximately $145 MM, excluding the underwriter option Demonstrates underlying value of Sunoco’s position in SXL Pension Plan Contributions will bolster funded status Sunoco plans to contribute approximately $200MM, about evenly split between cash and Sunoco common stock Expect to eliminate the need for any legally required minimum pension contributions until 2012 Generates positive cash tax benefit with minimal dilutive impact to existing shareholders |
 16 Key Takeaways Refining market will remain challenging, but we are taking prudent and appropriate steps to position the Company for the future: Eagle Point shutdown & Northeast system optimization Cost improvement initiative Scale back pension and postretirement plans Actions to improve balance sheet and liquidity Continued focus on cost reduction and capital discipline Sunoco’s diverse business portfolio and efficient cost structure will position the Company to capitalize on an eventual market recovery and take advantage
of attractive growth opportunities |
 Appendix |
 18 Earnings Profile, MM$ after tax 2005 2006 2007 2008 2009 Refining & Supply Continuting Operations 894 751 673 448 (316) Discontinued Tulsa Operations 53 130 99 67 3 Retail Marketing 30 76 69 201 86 Chemicals 94 43 26 36 1 Logistics 22 36 45 85 97 Coke 48 50 29 105 180 Corporate Expenses (84) (58) (67) (46) (38) Net Financing Expenses & Other (45) (49) (41) (22) (50) Income(Loss) Before Special Items 1,012 979 833 874 (37) Special Items (38) - 58 (98) (292) Total Income (Loss) 974 979 891 776 (329) EPS (Diluted), Income (Loss) Before Special Items 7.36 7.59 6.94 7.46 (0.32) EPS (Diluted), Income (Loss) 7.08 7.59 7.43 6.63 (2.81) |
 19 Earnings Profile, MM$ after tax 1Q08 2Q08 3Q08 4Q08 FY08 1Q09 2Q09 3Q09 4Q09 FY09 Refining & Supply Continuting Operations (123) 27 398 146 448 14 (77) (118) (135) (316) Discontinued Tulsa Operations - 5 26 36 67 9 (6) - - 3 Retail Marketing 26 - 72 103 201 6 10 49 21 86 Chemicals 18 3 19 (4) 36 (4) - (1) 6 1 Logistics 15 21 20 29 85 30 26 19 22 97 Coke 25 23 29 28 105 25 42 35 78 180 Corporate Expenses (17) (11) 2 (20) (46) (11) (15) (6) (6) (38) Net Financing Expenses & Other (3) (7) (7) (5) (22) (10) (11) (12) (17) (50) Income(Loss) Before Special Items (59) 61 559 313 874 59 (31) (34) (31) (37) Special Items - 21 (10) (109) (98) (47) (24) (278) 57 (292) Total Income (Loss) (59) 82 549 204 776 12 (55) (312) 26 (329) EPS (Diluted), Income (Loss) Before Special Items (0.50) 0.52 4.78 2.68 7.46 0.50 (0.27) (0.29) (0.27) (0.32) EPS (Diluted), Income (Loss) (0.50) 0.70 4.70 1.74 6.63 0.10 (0.47) (2.67) 0.22 (2.81) |
 20 Key Margin Indicators * Excludes discontinued Tulsa refining operations. 1Q08 2Q08 3Q08 4Q08 FY08 1Q09 2Q09 3Q09 4Q09 FY09 Refining & Supply, $/B Realized Total R&S * 3.16 6.98 14.87 8.98 8.60 6.33 3.65 2.72 1.96 3.66 Retail Marketing, cpg Gasoline 11.1 7.4 18.7 22.9 15.0 6.4 7.0 13.0 8.8 8.9 Distillate 17.0 11.3 14.1 25.8 17.1 24.5 12.0 11.7 7.9 14.8 Chemicals, cpp Phenol and Related 9.2 7.5 10.6 11.7 9.6 6.6 8.2 7.3 9.7 8.0 Polypropylene 12.5 11.2 14.0 10.9 12.1 8.6 9.3 10.7 9.6 9.5 Total Chemicals 10.6 9.1 12.0 11.2 10.7 7.7 8.7 8.9 9.6 8.7 Dated Brent Crude Oil, $/B 96.90 121.38 114.78 54.91 96.99 44.40 58.79 68.27 74.56 61.51 Natural Gas, $/MMBTU 8.75 11.48 8.95 6.41 8.90 4.48 3.81 3.44 4.92 4.16 |
 21 Key Volume Indicators - Refining & Supply * Excludes discontinued Tulsa refining operations. 1Q08 2Q08 3Q08 4Q08 FY08 1Q09 2Q09 3Q09 4Q09 FY09 Total Refining & Supply* Crude Throughputs, MB/D 699 687 726 715 707 627 644 613 617 625 % Capacity 85 83 88 87 86 76 78 74 85 78 Net Prod. Available for Sale, MB/D 771 764 808 799 786 689 720 669 682 690 Net Prod. Available for Sale, MMB 70 70 74 74 288 62 66 62 62 252 |
 22 Key Volume Indicators – Non-Refining 1Q08 2Q08 3Q08 4Q08 FY08 1Q09 2Q09 3Q09 4Q09 FY09 Retail Marketing Gasoline Sales, MM gal 1,070 1,140 1,109 1,098 4,417 1,066 1,147 1,140 1,108 4,461 Middle Distillate Sales, MM gal 145 143 144 148 580 138 116 114 95 463 Total Sales, MM gal 1,215 1,283 1,253 1,246 4,997 1,204 1,263 1,254 1,203 4,924 Gasoline and Diesel Throughput 143 152 150 143 147 143 153 156 153 151 (Company-owned or leased outlets) (M gal/Site/Month) Merchandise Sales (M$/Store/Month) 77 86 90 81 83 78 92 104 91 91 Chemicals Phenol and Related Sales, MM# 599 591 607 477 2,274 407 427 483 457 1,774 Polypropylene Sales, MM# 569 562 531 542 2,204 514 492 432 487 1,925 Other Sales, MM# 24 19 14 8 65 5 3 6 7 21 Total, MM# 1,192 1,172 1,152 1,027 4,543 926 922 921 951 3,720 Coke Production, M tons: United States 613 614 693 706 2,626 682 694 715 778 2,868 Brazil 388 404 408 381 1,581 280 282 321 383 1,266 |
 23 2009 Cash Flow, MM$ SUN SXL (ex SXL) Sunoco Cash flow from Operations 167 381 548 Capital Program (225) (724) (949) Free Cash Flow (58) (343) (401) SXL Equity Issuance 110 - 110 Divestments - 364 364 Dividends - (140) (140) Distributions & Other (75) (19) (94) SXL Dividends to Sunoco (96) 96 - Net Cash flow before Net Debt Activity (119) (42) (161) Net Debt Activity 119 179 298 Net Increase in Cash & Cash Equivalents - 137 137 2009 |
 24 Financial Ratios, MM$ except ratios * Represents Partners’ Capital for SXL and Shareholders’ Equity for Sunoco. ** The Net Debt / Capital ratio is used by Sunoco management in its internal financial analysis and by investors and creditors in the assessment of Sunoco’s financial position. *** Capital excludes noncontrolling interests. Proforma Proforma SUN SUN SXL (ex SXL) Sunoco SXL (ex SXL) Sunoco Debt 889 1,713 2,602 868 1,596 2,464 Plus: Debt Guarantees - 2 2 - 2 2 Less: Cash (2) (176) (178) (2) (375) (377) Net Debt 887 1,539 2,426 866 1,223 2,089 Equity* 852 2,443 2,443 862 2,557 2,557 SXL Noncontrolling Interest - - 485 - - 488 Capital 1,739 3,982 5,354 1,728 3,780 5,134 Net Debt / Capital (Sunoco Revolver Covenant Basis)** 51% 39% 45% 50% 32% 41% Debt / Capital (GAAP Basis) *** 52% 49% 12/31/2009 9/30/2009 |
 25 Financial Ratios, MM$ except ratios * Represents Partners’ Capital for SXL and Shareholders’ Equity for Sunoco. ** The Net Debt / Capital ratio is used by Sunoco management in its internal financial analysis and by investors and creditors in the assessment of Sunoco’s financial position. *** Capital excludes noncontrolling interests. Proforma SUN SXL (ex SXL) Sunoco Debt 748 1,415 2,163 Plus: Debt Guarantees - 2 2 Less: Cash (2) (238) (240) Net Debt 746 1,179 1,925 Equity* 670 2,842 2,842 SXL Noncontrolling Interest - - 367 Capital 1,416 4,021 5,134 Net Debt / Capital (Sunoco Revolver Covenant Basis)** 53% 29% 37% Debt / Capital (GAAP Basis) *** 43% 12/31/2008 |
 26 Refining & Supply Capital Program, MM$
Proj 2008 2009 2010 Infrastructure 199 109 102 Regulatory / Required 258 111 56 Turnarounds 90 76 133 Sub-Total 547 296 291 Income Improvement 105 84 29 Total 652 380 320 Focus on infrastructure and completion of major compliance projects in 2009 and 2010 Minimal Income Improvement spending committed Completed Philadelphia Distillate Hydrotreater conversion in 2009 2010 includes $25MM for Northeast Biofuels Other projects prioritized if economic conditions warrant |
 27 Capital Program by Category, MM$ Proj 2007 2008 2009 2010 Infrastructure / Turnaround 455 390 284 389 Regulatory / Required 230 356 176 118 685 746 460 507 Income Improvement 235 126 97 52 920 872 557 559 Logistics & Coke Growth* 298 599 392 278 1,218 1,471 949 837 * Logistics Growth represents estimate of committed capital only |
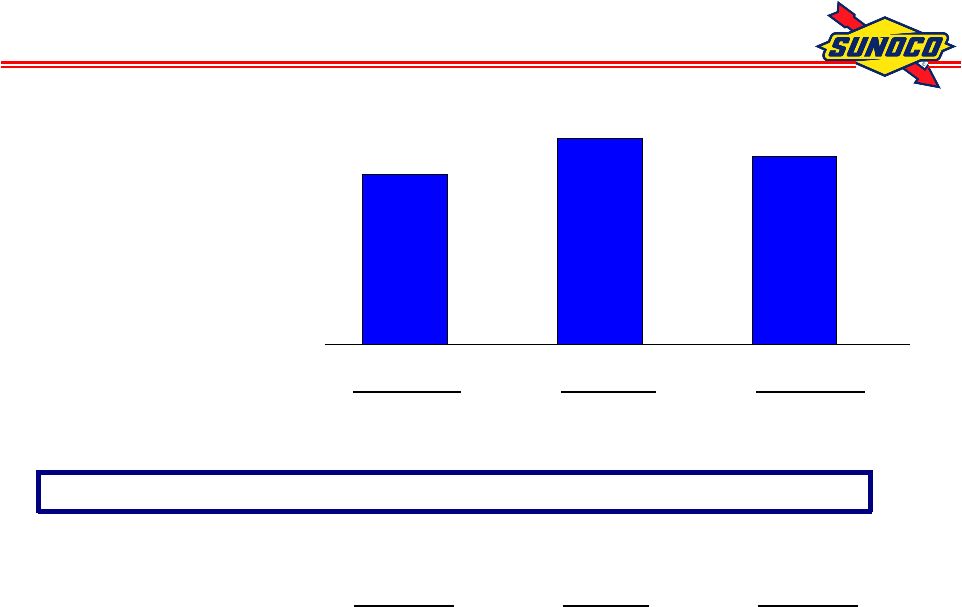
 28 0.0 0.5 1.0 1.5 2.0 2.5 12/31/2008 9/30/2009 12/31/2009 SXL Sunoco 1.6 Liquidity*, B$ * Includes $0.2B, $0.2B and $0.4B at 12/31/08, 9/30/09 and 12/31/09 of cash
and cash equivalents. 1.4 1.7 |
 29 Refining & Supply – Products Manufactured * Excludes discontinued Tulsa refining operations. 1Q08 2Q08 3Q08 4Q08 FY08 1Q09 2Q09 3Q09 4Q09 FY09 Total Refining & Supply * Net Production, MB/D 771.4 763.7 808.3 798.6 785.6 689.1 720.2 669.2 681.7 689.9 Gasoline 49% 49% 48% 49% 49% 51% 51% 52% 53% 52% Middle Distillates 35% 38% 37% 36% 36% 34% 32% 33% 32% 32% Residual Fuel 7% 7% 7% 7% 7% 9% 9% 9% 8% 9% Petrochemicals 4% 5% 5% 4% 5% 3% 4% 4% 4% 4% Other 10% 6% 8% 9% 8% 8% 9% 7% 8% 8% Less Refinery Fuel -5% -5% -5% -5% -5% -5% -5% -5% -5% -5% |
 30 Refining & Supply - Gasoline and Distillate Production 1Q08 2Q08 3Q08 4Q08 FY08 1Q09 2Q09 3Q09 4Q09 FY09 Total Refining & Supply * Gasoline Production, MB/D 375.8 376.6 387.3 391.9 382.9 350.0 370.3 346.0 365.5 357.9 RFG 44% 45% 48% 47% 46% 46% 46% 55% 45% 48% Conventional 56% 55% 52% 53% 54% 54% 54% 45% 55% 52% Distillate Production, MB/D 266.7 288.2 300.4 286.0 285.4 233.4 229.5 219.3 219.3 225.3 On-Road Diesel Fuel 49% 55% 58% 53% 54% 47% 53% 56% 52% 52% Heating Oil / Off-Road Diesel 27% 21% 19% 25% 23% 30% 22% 23% 25% 25% Jet Fuel 21% 23% 21% 19% 21% 20% 23% 19% 21% 21% Kerosene/Other 3% 1% 2% 3% 2% 3% 2% 2% 2% 2% * Excludes discontinued Tulsa refining operations. |
 31 Sunoco Refining Weighted Benchmark Margin, $/B 4 WTI Crude: NYMEX Futures Close + $1.00 for transportation 3 Unleaded Gasoline: Chicago Pipeline Platt’s Low 1 ULSD: Chicago Pipeline Platt’s Low 6 Dated Brent Crude: Platt’s Mid + $1.25 for transportation 3 Gasoline: 50% Unleaded RBOB NY Harbor Barge Platt's Low 50% Unleaded Regular Gasoline NY Harbor Barge Platt's Low 2 Distillate: 55% ULSD/LSD NY Harbor Barge Platt's Low 20% Jet/Kero NY Harbor Barge Platt's Low 25% No.2 Fuel Oil NY Harbor Barge Platt's Low 1 No. 6 0.3% Sulfur High Pour Resid: NY Harbor Barge Platt’s Low 1Q08 2Q08 3Q08 4Q08 FY08 1Q09 2Q09 3Q09 4Q09 FY09 Northeast 6-3-2-1 Value-Added Benchmark 5.78 10.78 11.98 7.52 9.01 6.32 6.23 5.10 4.85 5.62 Toledo 4-3-1 Benchmark 4.91 10.61 14.98 2.94 8.36 8.28 10.36 7.41 3.56 7.40 1Q08 2Q08 3Q08 4Q08 FY08 1Q09 2Q09 3Q09 4Q09 FY09 Northeast 6-3-2-1 at 80% weight 4.63 8.62 9.58 6.01 7.21 5.05 4.98 4.08 3.88 4.50 Toledo 4-3-1 at 20% weight 0.98 2.12 3.00 0.59 1.67 1.66 2.07 1.49 0.71 1.48 R&S Weighted Benchmark 5.61 10.74 12.58 6.60 8.88 6.71 7.05 5.57 4.59 5.98 Northeast 6-3-2-1 Value-Added Benchmark Toledo 4-3-1 Benchmark |
 32 For More Information Media releases and SEC filings are available on our website at Contact for more information: Clare McGrory (215) 977-6764 www.SunocoInc.com |