Attached files
| file | filename |
|---|---|
| 8-K - FORM 8-K - OCCIDENTAL PETROLEUM CORP /DE/ | form8k-20100204.htm |
EXHIBIT
99.1

February
4, 2010
February
4, 2010
Stephen
I. Chazen
Stephen
I. Chazen
President
and
President
and
Chief
Financial Officer
Chief
Financial Officer
Credit
Suisse
Credit
Suisse
2010
Energy Summit
2010
Energy Summit
1

2
($
in millions, except EPS data)
($
in millions, except EPS data)
Full
Year 2009 Results - Summary
Full
Year 2009 Results - Summary
2009 2008
• Core Results 1 $3,083 $7,348
• Core
EPS (diluted) $3.78 $8.94
• Net Income $2,915 $6,857
• Reported EPS
(diluted) $3.58 $8.34
• Oil
and Gas sales volumes (mboe/day) 714 675
• +5.8%
year-over-year
• Capital
Spending $3,581 $4,664
• Cash
Flow from Operations $5,800 $10,700
• ROE 10.3% 27%
• ROCE 9.6% 25%
1See attached for GAAP
reconciliation.
2

3
Corporate
Strategy/Philosophy
• Focus on core areas
- long-term production growth
of 5 - 8% CAGR
of 5 - 8% CAGR
• US - Permian
Basin, California, and Midcontinent Gas
• Middle East/North
Africa
• Latin
America
• Maintain strong
balance sheet
– Maintain “A” credit
rating
– Maintain investment
discipline
– Create
value
– Capture EOR projects
with large volumes of oil in place
– Acquire assets with
upside potential
– Maintain top
quartile financial returns
• Maximize free cash
flow from chemicals
• Continue to increase
the dividend regularly
3

4
*Assumes Moderate
Product Prices
What
Are Our Goals & Current Objectives?
• Allocate and deploy
capital with a focus on achieving strong
financial returns.
financial returns.
• Pursue only those
opportunities which meet our standards
for ROCE and complement our existing assets.
for ROCE and complement our existing assets.
– Return
Targets*
• Domestic -
15+%
• International -
20+%
• Focus on further
delineating and developing our significant
oil and gas discovery in CA, while continuing our exploration
program in the state.
oil and gas discovery in CA, while continuing our exploration
program in the state.
• Focus on our large
inventory of oil and gas properties and
projects in order to achieve profitable growth.
projects in order to achieve profitable growth.
• Continue to make
decisions based on creating long-term
value for shareholders.
value for shareholders.
4

5
Worldwide Oil &
Gas Operations
Worldwide Oil &
Gas Operations
5

6
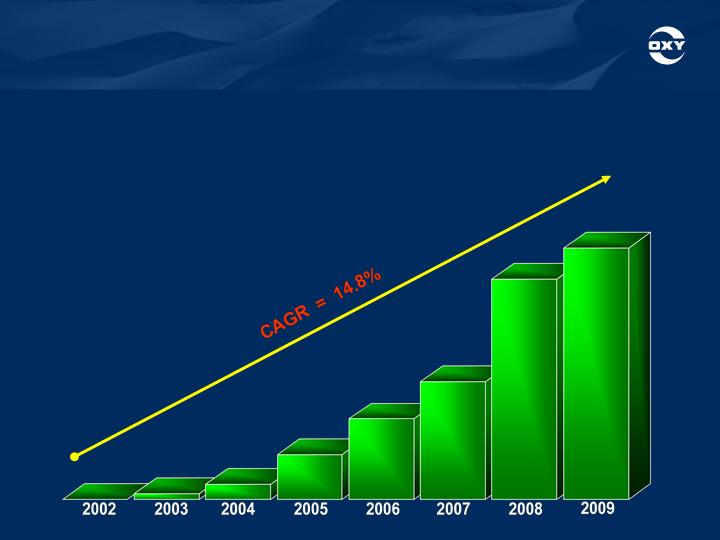
Thousand
BOE/Day
Thousand
BOE/Day
519
601
633
675
2005
2006
2007
2008
Note: This
schedule reflects what production volumes would have been for the past 5 years
if all production had been represented on a pre
-tax basis. Importantly this forecast is based only on existing projects and does not contemplate any new projects or future acquisitions.
-tax basis. Importantly this forecast is based only on existing projects and does not contemplate any new projects or future acquisitions.
2009
750
2010E
770
714
CAGR
= 7.9%
= 7.9%
CAGR
= 7.9%
= 7.9%
Worldwide Production
Outlook
6

7
ü
ü
Low
ü
ü
Middle
Risk
Factor
Exploratory
Commodity
Political
Engineering
Reinvestment
Financial
High
Level
of Risk Acceptable to Occidental
Level
of Risk Acceptable to Occidental
ü
ü
Business Risk
Factors
7

8
2009
Reserve Replacement
• We estimate that we
replaced approximately 206% of our oil
and gas production in 2009.
and gas production in 2009.
• We estimate that we
replaced approximately 206% of our oil
and gas production in 2009.
and gas production in 2009.
• 2009 year-end proved
reserves were 3.23 billion BOE, an
increase of 8%.
increase of 8%.
• 2009 year-end proved
reserves were 3.23 billion BOE, an
increase of 8%.
increase of 8%.
• Oxy had a three-year
reserve replacement ratio of 160%.
• Oxy had a three-year
reserve replacement ratio of 160%.
• Our finding and
development costs in 2009 were $7.90 per
BOE.
BOE.
• Our finding and
development costs in 2009 were $7.90 per
BOE.
BOE.
• Three-year finding
and development costs averaged about
$15.10 per BOE.
$15.10 per BOE.
• Three-year finding
and development costs averaged about
$15.10 per BOE.
$15.10 per BOE.
• At 12/31/09, Oxy’s
proved reserves consisted of 73% oil and
27% gas, with 64% located in the US and 36% internationally.
27% gas, with 64% located in the US and 36% internationally.
• At 12/31/09, Oxy’s
proved reserves consisted of 73% oil and
27% gas, with 64% located in the US and 36% internationally.
27% gas, with 64% located in the US and 36% internationally.
• Approximately 23% of
the proved reserves were proved
undeveloped and 77% were proved developed.
undeveloped and 77% were proved developed.
• Approximately 23% of
the proved reserves were proved
undeveloped and 77% were proved developed.
undeveloped and 77% were proved developed.
8

9
2009
2009
2008
2008
2007
2007
2006
2006
2005
2005
3-Year
Average
3-Year
Average
5-Year
Average
5-Year
Average
323
323
126
126
182
182
180
180
241
241
210
210
210
210
160
160
210
210
60
60
326
326
139
139
143
143
179
179
483
483
336
336
242
242
506
506
380
380
353
353
389
389
206
206
153
153
116
116
243
243
212
212
160
160
185
185
Organic
Organic
Growth
Growth
Acquisitions
Acquisitions
Total
Total
Reserve
Reserve
Replace
%
Replace
%
Million
BOE
Million
BOE
235
235
220
220
208
208
208
208
179
179
221
221
210
210
Worldwide
Worldwide
Production
Production
(million
boe)
(million
boe)
Reserve
Replacement
Reserve
Replacement
9

10
Growth
Capital
Base
Capital
Total
Oil & Gas, and Midstream Capital
1,030
2,310
3,340
1,570
2,485
4,055
2009
2010E
($
in millions)
($
in millions)
• We
currently anticipate total year 2010 capex to be about
$4.3 billion compared to $3.6 billion spent in 2009.
$4.3 billion compared to $3.6 billion spent in 2009.
• We
currently anticipate total year 2010 capex to be about
$4.3 billion compared to $3.6 billion spent in 2009.
$4.3 billion compared to $3.6 billion spent in 2009.
– Our capital
program will continue to focus on ensuring that our returns remain
well above our cost of capital.
well above our cost of capital.
– Our capital
program will continue to focus on ensuring that our returns remain
well above our cost of capital.
well above our cost of capital.
– The increase in
capital vs. 2009 will be allocated to the Oil & Gas segment.
Of this:
Of this:
– The increase in
capital vs. 2009 will be allocated to the Oil & Gas segment.
Of this:
Of this:
• about a quarter each
will go to California and Iraq, and;
• about a quarter each
will go to California and Iraq, and;
• about 15% to Bahrain
and 10% to Midcontinent Gas.
• about 15% to Bahrain
and 10% to Midcontinent Gas.
– As a result, the
capital allocation will be approximately 82% in Oil & Gas with
the remainder being spent in Midstream and Chemical.
the remainder being spent in Midstream and Chemical.
– As a result, the
capital allocation will be approximately 82% in Oil & Gas with
the remainder being spent in Midstream and Chemical.
the remainder being spent in Midstream and Chemical.
Oil
& Gas, and Midstream Capital
Oil
& Gas, and Midstream Capital
Capital
Spending Program
Capital
Spending Program
10

11
Pipeline of Future
Growth Projects
• California - Oxy is the
largest acreage holder in the state, and is
continuing to pursue recent exploration successes.
continuing to pursue recent exploration successes.
• Permian
Basin
- opportunity to deploy additional sources of CO2
to improve recovery and boost oil production.
to improve recovery and boost oil production.
• Midcontinent
Gas -
most of our gas production in the Piceance
Basin, non-associated gas in the Permian Basin, and the
Hugoton field has been combined into a single business unit.
Basin, non-associated gas in the Permian Basin, and the
Hugoton field has been combined into a single business unit.
• Oman - recently
awarded new gas and condensate development
opportunities and have initiated drilling.
opportunities and have initiated drilling.
• Bahrain - have created a
new joint operating company and
signed a Development and Production Sharing Agreement for
the further development of the Bahrain Field.
signed a Development and Production Sharing Agreement for
the further development of the Bahrain Field.
• Iraq - Oxy is part of
an Eni-led consortium that has been
awarded the license for development of the giant Zubair oil field.
awarded the license for development of the giant Zubair oil field.
11

12
2009
net production
• 377
mboe/day
• 58% of worldwide
total
2009
reserves
• 2.07 billion
boe
• 64% of worldwide
total
US Oil
& Gas Operations
12

13
331
354
359
2005
2006
2007
Thousand
BOE/Day
Thousand
BOE/Day
US
Oil and Gas Production
US
Oil and Gas Production
**ROANCC = Return
On Average Net Capitalized Costs.
361
377
2008
2009
A-T
Cash = Income from continuing operations after US income
taxes, plus DD&A, and minus exploration and development costs
incurred.
taxes, plus DD&A, and minus exploration and development costs
incurred.
1See attached for GAAP
reconciliation.
1See attached for GAAP
reconciliation.
US Oil
& Gas Operations
Key
Operations/Assets:
– California/Elk Hills
Field
– Permian
Basin
– Midcontinent
Gas
2009
Financial Data1
Pre-tax
Income $2.2
Billion
After-tax Cash $1.6
Billion
Capital $1.2
Billion
ROANCC** 9%
13

14
New
Mexico
New
Mexico
Colorado
Colorado
Bravo
Dome
Bravo
Dome
Salt
Creek
Salt
Creek
Hugoton
Hugoton
Sheep
Mountain
Sheep
Mountain
Kansas
Kansas
• Large resource
inventory — Oxy
holds 2.2 mm net acres
holds 2.2 mm net acres
• Large resource
inventory — Oxy
holds 2.2 mm net acres
holds 2.2 mm net acres
• 2009 production of
185 mboe/day
• 2009 production of
185 mboe/day
• 1.1 billion boe of
net proved
reserves (34% of Oxy total)
reserves (34% of Oxy total)
• 1.1 billion boe of
net proved
reserves (34% of Oxy total)
reserves (34% of Oxy total)
• Low decline rate
& long-lived
properties
properties
• Low decline rate
& long-lived
properties
properties
• Generates
significant free cash flow
• Generates
significant free cash flow
• Significant
investment in long-lead
CO2 projects (Century plant)
CO2 projects (Century plant)
• Significant
investment in long-lead
CO2 projects (Century plant)
CO2 projects (Century plant)
• Operating
efficiency
• Operating
efficiency
– 6 rig drilling
program focused on
exploitation of recent "bolt-on"
acquisitions
exploitation of recent "bolt-on"
acquisitions
– 6 rig drilling
program focused on
exploitation of recent "bolt-on"
acquisitions
exploitation of recent "bolt-on"
acquisitions
– Running 65
workover rigs focused
on highest productivity wells
on highest productivity wells
– Running 65
workover rigs focused
on highest productivity wells
on highest productivity wells
• Natural area for
consolidation
• Natural area for
consolidation
Texas
Texas
Midland
Midland
Hobbs
Hobbs
Indian
Basin
Indian
Basin
Area
Area
Sharon
Ridge
Sharon
Ridge
Cogdell
Cogdell
Seminole
Seminole
Oxy
Acreage
Oxy
Acreage
CO2 Pipelines
CO2 Pipelines
New
Centurion Pipelines
New
Centurion Pipelines
Old
Centurion Pipelines
Old
Centurion Pipelines
To
Cushing, OK
To
Cushing, OK
Permian
Basin Operations
14

15
SandRidge
Acreage
1,300
mi2 3D
5
phases
Oxy
Pakenham
Oxy
JM
- Brown Bassett
Oil
Pipelines
CO2
Pipelines
County
County
NGL
Pipelines
Terrell
(Oxy)
Mitchell
Gray
Ranch
New
Plant
“Century”
Pikes
Peak
Pinon
Field
SD
Plant
Gas
Plants
McCamey
Hub
Hub
CO2 Pipelines
TX
Permian
- Century CO2 Plant
Project
• Oxy to invest $850
mm
in CO2 plant and
pipeline facilities.
in CO2 plant and
pipeline facilities.
• Oxy to invest $850
mm
in CO2 plant and
pipeline facilities.
in CO2 plant and
pipeline facilities.
• CO2 to be used in
Oxy’s
Permian EOR projects.
Permian EOR projects.
• CO2 to be used in
Oxy’s
Permian EOR projects.
Permian EOR projects.
• New CO2 resources
expected to expand
Oxy’s Permian
production by at least 50
mb/day within 5 years.
expected to expand
Oxy’s Permian
production by at least 50
mb/day within 5 years.
• New CO2 resources
expected to expand
Oxy’s Permian
production by at least 50
mb/day within 5 years.
expected to expand
Oxy’s Permian
production by at least 50
mb/day within 5 years.
• Allows Oxy to
exploit at
least 3.5 tcf of CO2 for
EOR use.
least 3.5 tcf of CO2 for
EOR use.
• Allows Oxy to
exploit at
least 3.5 tcf of CO2 for
EOR use.
least 3.5 tcf of CO2 for
EOR use.
• Enables Oxy
to
accelerate and enhance
development of existing
assets.
accelerate and enhance
development of existing
assets.
• Enables Oxy
to
accelerate and enhance
development of existing
assets.
accelerate and enhance
development of existing
assets.
15

16
Qatar
UAE
Oman
Yemen
Libya
2009
net production
• 254
mboe/day
• 35% of worldwide
total
2009
reserves
• 924 million
boe
• 29% of worldwide
total
Bahrain
Middle
East/North Africa Oil & Gas
16

17
157
175
198
2005
2006
2007
Thousand
BOE/Day
Thousand
BOE/Day
Middle East/North
Africa
Middle East/North
Africa
Oil
and Gas Production
Oil
and Gas Production
**ROANCC = Return
On Average Net Capitalized Costs.
238
254
2008
2009
A-T
Cash = Income from continuing operations after foreign income
taxes,
plus
DD&A minus exploration and development costs incurred.
1See attached for GAAP
reconciliation.
1See attached for GAAP
reconciliation.
Middle
East/North Africa Oil & Gas
Key
Operations/Assets:
– Dolphin
Project
– Qatar
ISND
– Oman/Mukhaizna
– Bahrain
2009
Financial Data1
Pre-tax
Income $2.5
Billion
After-tax Cash $1.2
Billion
Capital $1.0
Billion
ROANCC** 22%
17

18
Oxy
Blocks
Oxy
Blocks
Oman -
Mukhaizna Project
• Continuing large
scale steam flood
EOR project - drilled 665+ wells
thru 2009
EOR project - drilled 665+ wells
thru 2009
• Gross production at
year-end 2009
was more than 10x higher vs. Sept.
2005
was more than 10x higher vs. Sept.
2005
• Expect to drill
approximately 320
new wells in 2010
new wells in 2010
• Exceeded target 2009
production
exit rate of 80 mb/d (gross)
exit rate of 80 mb/d (gross)
• Completing all
multiple water
treatment facilities to supply the
steam generators in order to:
treatment facilities to supply the
steam generators in order to:
– Increase gross
production to year-
end 2010 exit rate of 100 mb/d;
end 2010 exit rate of 100 mb/d;
– Expect to increase
gross
production to 150 mb/d.
production to 150 mb/d.
18

19
• PSA signed on
11/24/08
– Newly formed
contract area -
“Habiba” - Block 62
“Habiba” - Block 62
– 20-year agreement
covers 2,269
km2
km2
– Development of
four gas fields
– Exploration
potential
• Partners
– Oxy (operator)
48%, Mubadala
32%, Oman 20%
32%, Oman 20%
• Development
Plan
– First production
in 2010
– Gross production
approximately
27 to 28 mboe/d by year-end 2011
27 to 28 mboe/d by year-end 2011
Oxy
Blocks
Oxy
Blocks
Oman -
Gas Project
19

20
• Oxy, Mubadala, and
NOGA announced
the creation of a new joint operating
company, Tatweer Petroleum, which will
serve as operator for the Bahrain Field.
the creation of a new joint operating
company, Tatweer Petroleum, which will
serve as operator for the Bahrain Field.
• The company will
operate under a
Development and Production Sharing
Agreement (DPSA) signed and approved
in late 2009.
Development and Production Sharing
Agreement (DPSA) signed and approved
in late 2009.
• Oxy will hold a
48% interest, with
Mubadala holding 32%, and NOGA 20%.
Mubadala holding 32%, and NOGA 20%.
• We expect to
increase oil production to
about 3x the current level to reach 100
mb/d within 7 years, and increase gas
production by more than 65% to
approximately 2.5 bcf/d.
about 3x the current level to reach 100
mb/d within 7 years, and increase gas
production by more than 65% to
approximately 2.5 bcf/d.
• Gross capital
investment is expected to
be approximately $1.5 billion over the
initial 5 years of the DPSA.
be approximately $1.5 billion over the
initial 5 years of the DPSA.
Bahrain
Field Development Project
20
21
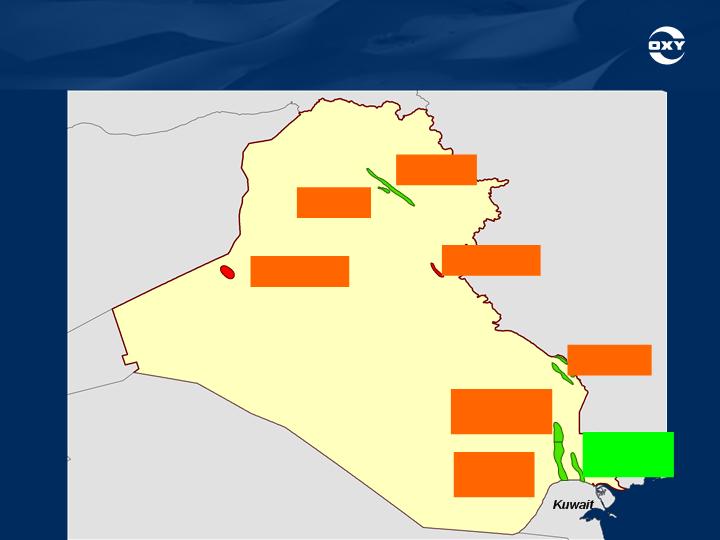
Iran
Saudi
Arabia
Syria
Kirkuk
Reserves
17B
Bai
Hassan
Reserves
5B
Mansuriya
Reserves
1.6TCF
West
Qurna 1
ExxonMobil/Shell
Reserves
6B
Rumaila
BP/CNPC
Reserves
21B
Akkas
Reserves
2.5TCF
Iraq
Zubair
Eni/Oxy/Kogas
Reserves
4.2B+
Missan
Reserves
2.2B
Iraq -
Zubair Field
21

22
Iraq -
Zubair Field
• Oxy is part of an
Eni-led consortium that has been awarded the license
for development of the giant Zubair oil field in Iraq.
for development of the giant Zubair oil field in Iraq.
• Iraq holds the
world’s second-largest reserves of oil with about 115
billion barrels estimated - second only to Saudi Arabia.
billion barrels estimated - second only to Saudi Arabia.
• We are now one of
the few companies on the ground floor of this world-
class opportunity.
class opportunity.
• Zubair has
significant proved reserves estimated at more than 4.2
billion bbls and current production of 195 mb/d.
billion bbls and current production of 195 mb/d.
• Development of
Zubair will be a multi-year, multi-phased project with
production expected to reach approx. 1.2 mm b/d in the next 6 years.
production expected to reach approx. 1.2 mm b/d in the next 6 years.
• We expect Oxy’s net
share of peak production from the field to be
approximately 90 mb/d.
approximately 90 mb/d.
• Zubair will give us
the opportunity to learn, and give us the insight to
effectively evaluate future developments in Iraq.
effectively evaluate future developments in Iraq.
• We hope to expand
our position and continue our involvement in Iraq
while meeting our standards for security and rate of return.
while meeting our standards for security and rate of return.
22

23
*Production and
producing wells as of each of the quarterly earnings disclosure
dates.
California - Kern
County Discovery
California - Kern
County Discovery
KERN
COUNTY DISCOVERY AREA
KERN
COUNTY DISCOVERY AREA
4Q09 3Q09 2Q09 1Q09
4Q09 3Q09 2Q09 1Q09
Gross
Production*
Gross
Production*
– Natural Gas
(mmcf/d) 145 105 74 28
– Natural Gas
(mmcf/d) 145 105 74 28
– Liquids (mb/d) 7.5 8.5 5 3
– Liquids (mb/d) 7.5 8.5 5 3
– Total mboe/d 31.7 26.0 17.3 7.7
– Total mboe/d 31.7 26.0 17.3 7.7
Number
of producing wells* 15 10 6 4
Number
of producing wells* 15 10 6 4
• We believe there are
150 mm to 250 mm gross boe of reserves within the
small producing area.
small producing area.
• We believe there are
150 mm to 250 mm gross boe of reserves within the
small producing area.
small producing area.
• Approximately
two-thirds of the discovery is believed to be natural gas.
• Approximately
two-thirds of the discovery is believed to be natural gas.
• The discovery, which
is near Elk Hills, is not below any producing zones.
• The discovery, which
is near Elk Hills, is not below any producing zones.
• Oxy’s interest in
the discovery area is approximately 80%.
• Oxy’s interest in
the discovery area is approximately 80%.
23

24
San
Joaquin
Valley
OXY
Producing Properties
Exploration
Acreage
Elk
Hills
Long
Beach
&
Tidelands
San
Francisco
Sacramento
Bakersfield
Los
Angeles
Sacramento
Valley
California - Kern
County Discovery
California - Kern
County Discovery
• Cumulative gross
production
since the start of production
through 12/31/09 has been 19.4
bcf of gas and 1.5 mm barrels of
liquids;
since the start of production
through 12/31/09 has been 19.4
bcf of gas and 1.5 mm barrels of
liquids;
• Cumulative gross
production
since the start of production
through 12/31/09 has been 19.4
bcf of gas and 1.5 mm barrels of
liquids;
since the start of production
through 12/31/09 has been 19.4
bcf of gas and 1.5 mm barrels of
liquids;
• We expect to drill 8
wells in the
first half of 2010 focusing on oil
drilling and exploring the limits of
the field;
first half of 2010 focusing on oil
drilling and exploring the limits of
the field;
• We expect to drill 8
wells in the
first half of 2010 focusing on oil
drilling and exploring the limits of
the field;
first half of 2010 focusing on oil
drilling and exploring the limits of
the field;
• We also expect to
add skid
mounted gas processing facilities
by 2Q-10;
mounted gas processing facilities
by 2Q-10;
• We also expect to
add skid
mounted gas processing facilities
by 2Q-10;
mounted gas processing facilities
by 2Q-10;
• We expect to add to
our gas
production once these facilities
are installed.
production once these facilities
are installed.
• We expect to add to
our gas
production once these facilities
are installed.
production once these facilities
are installed.
24

25
California
Exploration
California
Exploration
• Excluding
the Kern County
discovery:
discovery:
• Excluding
the Kern County
discovery:
discovery:
– Over the course of
a couple of years,
we have drilled 39 exploration wells
seeking non-traditional hydrocarbon
bearing zones in California.
we have drilled 39 exploration wells
seeking non-traditional hydrocarbon
bearing zones in California.
– Over the course of
a couple of years,
we have drilled 39 exploration wells
seeking non-traditional hydrocarbon
bearing zones in California.
we have drilled 39 exploration wells
seeking non-traditional hydrocarbon
bearing zones in California.
– Of these wells, 12
are commercial
and 10 are currently being evaluated;
and 10 are currently being evaluated;
– Of these wells, 12
are commercial
and 10 are currently being evaluated;
and 10 are currently being evaluated;
– Oxy holds 1.3 mm
acres of net fee
minerals and leasehold in CA, which
have been acquired in the last few
years to exploit these opportunities.
Discoveries similar to the Kern
County discovery are possible in this
net acre position.
minerals and leasehold in CA, which
have been acquired in the last few
years to exploit these opportunities.
Discoveries similar to the Kern
County discovery are possible in this
net acre position.
– Additionally, we
continue to pursue
shale production which is expected to
produce oil on this acreage.
shale production which is expected to
produce oil on this acreage.
– Additionally, we
continue to pursue
shale production which is expected to
produce oil on this acreage.
shale production which is expected to
produce oil on this acreage.
25

26
Other
Value Enhancing Initiatives
• Chemicals
Operations
– consistent free cash
generator
• Midstream Assets -
Marketing and Pipelines
– adds value and is
complimentary to Oil & Gas operations
• Dividend
Growth
– consistent track
record of dividend increases
26

27
3-Year* 5-Year*
Average Average
2009
Period
ending 12/31/09*
($
millions)
1 See attached for GAAP
reconciliation.
1 See attached for GAAP
reconciliation.
Chemicals
Operations
Pre-tax
Earnings $583 $688 $389
Free
Cash Flow1 $657 $758 $480
Capital
Spending $230 $221 $205
27

28
The
assets are comprised of the following businesses:
Marketing; Gas processing plants; Pipelines; Power
generation, and; CO2 source fields and facilities.
Marketing; Gas processing plants; Pipelines; Power
generation, and; CO2 source fields and facilities.
The
assets are comprised of the following businesses:
Marketing; Gas processing plants; Pipelines; Power
generation, and; CO2 source fields and facilities.
Marketing; Gas processing plants; Pipelines; Power
generation, and; CO2 source fields and facilities.
Midstream
Data 2009 2008 2007
Midstream
Data 2009 2008 2007
Pre-tax
earnings $235 $520 $367
Pre-tax
earnings $235 $520 $367
Net
Book Value $3,840 $2,930 $1,935
Net
Book Value $3,840 $2,930 $1,935
Capex
& Acquisition costs $885 $880 $430
Capex
& Acquisition costs $885 $880 $430
• Funds will be
spent enhancing our CO2
production, investing in construction of the
W. Texas gas processing plant, and expanding our pipeline capacity.
W. Texas gas processing plant, and expanding our pipeline capacity.
• Funds will be
spent enhancing our CO2
production, investing in construction of the
W. Texas gas processing plant, and expanding our pipeline capacity.
W. Texas gas processing plant, and expanding our pipeline capacity.
($
in millions)
Midstream, Marketing
and Other
28

29
$7,600
$40
$1,065
$1,750
$1,230
Available
Cash
Capex
Net
Debt
Issuance
Dividends
Acquisitions
&
Foreign
Bonuses
Ending
Cash
Balance
12/31/09
Cash
Flow
From
Operations
$5,800
($
in millions)
Beginning
Cash
$1,800
12/31/08
$3,600
Other
$5
Debt
Issuance
$740
Debt
Reduction
$700
Full
Year 2009 Cash Flow
Full
Year 2009 Cash Flow
29

30
2009
($
in millions)
Uses of
Capital - (In Order of Priority)
1. Base/Maintenance
Capital -
$2,550
2. Dividends - $1,065
3. Growth
Capital - $1,030
4. Acquisitions
- $1,750
5. Share
Repurchase - $ -
30
31
$0.52
$0.52
$0.55
$0.55
$0.645
$0.645
$0.80
$0.80
Annual
Dividend Payout per share
$0.50
$0.50
$0.94
$0.94
An
established track record of consistent dividend increases
An
established track record of consistent dividend increases
$1.21
$1.21
$1.31
$1.31
Creating Shareholder
Value - Dividends
31

32
Change
In
Change
In
Equity
Market Value
Equity
Market Value
Change
In
Change
In
Shareholders’
Equity
Shareholders’
Equity
9.5
9.5
2.6
2.6
2.3
2.3
2.3
2.3
Oxy’s
Shareholder Equity versus Equity Market Value
1 -
Year
1 -
Year
3 -
Year
3 -
Year
5 -
Year
5 -
Year
10 -
Year
10 -
Year
• Building a History
of Generating Shareholder Value
• Building a History
of Generating Shareholder Value
($
in millions)
($
in millions)
Market
Value per $ of Equity Retained
Market
Value per $ of Equity Retained
$17,443
$17,443
$1,834
$1,834
$25,037
$25,037
$9,555
$9,555
$42,897
$42,897
$18,562
$18,562
Financial Data for
period ending December 31, 2009.
Financial Data for
period ending December 31, 2009.
$58,096
$58,096
$25,636
$25,636
Creating Shareholder
Value
32

33
Future
Growth Areas to Watch
• Bahrain
-
• Oman/Mukhaizna
-
• Middle
East -
• California
-
• Permian
Basin -
• Midcontinent
Gas -
33

34
Occidental Petroleum
Corporation
Statements in this
presentation that contain words such as “will,” “expect” or “estimate,”
or
otherwise relate to the future, are forward-looking and involve risks and uncertainties that could
significantly affect expected results. Factors that could cause actual results to differ materially
include, but are not limited to: global commodity price fluctuations and supply/demand
considerations for oil, gas and chemicals; not successfully completing (or any material delay in)
any expansions, field development, capital projects, acquisitions, or dispositions; higher-than-
expected costs; political risk; operational interruptions; changes in tax rates; exploration risks,
such as drilling of unsuccessful wells; and commodity trading risks. You should not place undue
reliance on these forward-looking statements which speak only as of the date of this
presentation. Unless legally required, Occidental does not undertake any obligation to update
any forward-looking statements as a result of new information, future events or otherwise.
Finding and Development cost calculations inherently compare costs and reserves additions
from separate periods. You can see the elements of our calculation of such costs in our
reserves release on our website. The United States Securities and Exchange Commission
(SEC) permits oil and natural gas companies, in their filings with the SEC, to disclose only
reserves anticipated to be economically producible, as of a given date, by application of
development projects to known accumulations. We use certain terms in this presentation, such
as estimated reserves, recoverable reserves and oil in place, that the SEC’s guidelines strictly
prohibit us from using in filings with the SEC. U.S. investors are urged to consider carefully the
disclosures in our Form 10-K, available through the following toll-free telephone number, 1-888-
OXYPETE (1-888-699-7383) or on the Internet at http://www.oxy.com.
You
also can obtain a copy from the SEC by calling 1-800-SEC-0330. Oxy posts or
provides
links to important information on its website including investor and analyst presentations, certain
board committee charters and information the SEC requires companies and certain of its
officers and directors to file or furnish. Such information may be found in the “Investor
Relations” and “Social Responsibility” portions of the website.
34

35
35

36
Appendix
36

37
40
5
—
44
11
100
2004
34
31
—
27
8
100
2005
Capital
Acquisitions
Share
Repurchase
Debt
Reduction & Cash
Dividends
2006
Percentage
of Total
Percentage
of Total
41
26
21
3
9
100
2007
40
16
14
21
9
100
2008
39
40
13
—
8
100
2009
54
27
—
3
16
100
Gross
Cash Flow Uses
37

38
California - Kern
County Discovery
California - Kern
County Discovery
Conventional
vs. Non-conventional - What does this mean?
Conventional
vs. Non-conventional - What does this mean?
• Oxy’s discovery is
Conventional, which means it is non-shale, is analogous
to a deep water discovery, and bears no relationship at all to so called
resource plays.
to a deep water discovery, and bears no relationship at all to so called
resource plays.
• Oxy’s discovery is
Conventional, which means it is non-shale, is analogous
to a deep water discovery, and bears no relationship at all to so called
resource plays.
to a deep water discovery, and bears no relationship at all to so called
resource plays.
• This is a classic
oil and gas field with large pay
zones and with high
permeability.
permeability.
• This is a classic
oil and gas field with large pay
zones and with high
permeability.
permeability.
• Flow rates are high
without stimulation because of the high permeability of
the reservoir.
the reservoir.
• Flow rates are high
without stimulation because of the high permeability of
the reservoir.
the reservoir.
• Decline rates are
relatively low (compared with frac’d wells) because each
well can drain a large area.
well can drain a large area.
• Decline rates are
relatively low (compared with frac’d wells) because each
well can drain a large area.
well can drain a large area.
• In a
Non-conventional field the source rock and the producing zone are
often the same. In a Conventional field a trapping mechanism is needed to
contain the migrated oil and/or gas, which reduces the statistical nature of
the drilling results.
often the same. In a Conventional field a trapping mechanism is needed to
contain the migrated oil and/or gas, which reduces the statistical nature of
the drilling results.
38

39
California - Kern
County Discovery
California - Kern
County Discovery
Conventional
vs. Non-conventional - What does this mean?
Conventional
vs. Non-conventional - What does this mean?
• In a
Non-conventional play drilling efficiencies and cost burden determines
the outcome. In a Conventional discovery the value is created by the
discovery process.
the outcome. In a Conventional discovery the value is created by the
discovery process.
• In a
Non-conventional play drilling efficiencies and cost burden determines
the outcome. In a Conventional discovery the value is created by the
discovery process.
the outcome. In a Conventional discovery the value is created by the
discovery process.
• In a
Non-conventional field, reserves for the play are determined by
statistical inference. In the Non-conventional wells, decline curves tend to
be steep, making ultimate reserves difficult to estimate early in the play's
history. Conventional fields can often be determined volumetrically with
the area and pay thickness being relatively easy to determine while the
recovery factor can usually be bracketed by analogy.
• As a result of the
large drainage areas and the lack of need for high cost
completions, Conventional fields can have dramatically lower F&D costs
than Non-conventional fields.
completions, Conventional fields can have dramatically lower F&D costs
than Non-conventional fields.
• As a result of the
large drainage areas and the lack of need for high cost
completions, Conventional fields can have dramatically lower F&D costs
than Non-conventional fields.
completions, Conventional fields can have dramatically lower F&D costs
than Non-conventional fields.
39

40
40
|
Occidental
Petroleum Corporation
|
|||||||||||||||
|
Reconciliation
to Generally Accepted Accounting Principles (GAAP)
|
|||||||||||||||
|
For
the Twelve Months Ended December 31,
|
|||||||||||||||
|
($
Millions)
|
|||||||||||||||
|
2009
|
2008
|
||||||||||||||
|
Diluted
|
Diluted
|
||||||||||||||
|
EPS
|
EPS
|
||||||||||||||
|
Reported
Income
|
$
|
2,915
|
$
|
3.58
|
$
|
6,857
|
$
|
8.34
|
|||||||
|
Add:
significant items affecting earnings
|
|||||||||||||||
|
Asset
impairments
|
170
|
599
|
|||||||||||||
|
Rig
contract terminations
|
8
|
58
|
|||||||||||||
|
Plant
closure and impairment
|
-
|
90
|
|||||||||||||
|
Railcar
leases
|
15
|
-
|
|||||||||||||
|
Severance
accrual
|
40
|
-
|
|||||||||||||
|
Tax
effect of pre-tax adjustments
|
(77
|
)
|
(238
|
)
|
|||||||||||
|
Discontinued
operations, net *
|
12
|
(18
|
)
|
||||||||||||
|
Core
Results
|
$
|
3,083
|
$
|
3.78
|
$
|
7,348
|
$
|
8.94
|
|||||||
|
*
Amount shown after-tax
|
|||||||||||||||
|
Average
Diluted Common Shares Outstanding
|
813.8
|
820.5
|
|||||||||||||
|
Chemicals
Free Cash Flow
|
||||||||||
|
Reconciliation
to Generally Accepted Accounting Principles (GAAP)
|
||||||||||
|
($
Millions)
|
||||||||||
|
2005
|
2006
|
2007
|
2008
|
2009
|
||||||
|
Occidental
Petroleum Consolidated Statement of Cash Flows
|
||||||||||
|
Cash
flow from operating activities
|
5,337
|
6,353
|
6,798
|
10,652
|
5,813
|
|||||
|
Cash
flow from investing activities
|
(3,161
|
)
|
(4,383
|
)
|
(3,128
|
)
|
(9,457
|
)
|
(5,327
|
)
|
|
Cash
flow from financing activities
|
(1,187
|
)
|
(2,819
|
)
|
(3,045
|
)
|
(1,382
|
)
|
(1,033
|
)
|
|
Change
in cash
|
989
|
(849
|
)
|
625
|
(187
|
)
|
(547
|
)
|
||
|
Chemicals
Free Cash Flow
|
||||||||||
|
Core
results (see reconciliation below)
|
784
|
906
|
601
|
759
|
389
|
|||||
|
Depreciation
& amortization expense
|
268
|
279
|
304
|
311
|
298
|
|||||
|
Roundings
|
1
|
(2
|
)
|
-
|
-
|
(2
|
)
|
|||
|
Capital
expenditures (excluding acquisitions)
|
(168
|
)
|
(248
|
)
|
(245
|
)
|
(240
|
)
|
(205
|
)
|
|
Free
cash flow
|
885
|
935
|
660
|
830
|
480
|
|||||
|
Core
|
Cash
|
Capital
|
||||||||
|
Results
|
Flow
|
Spending
|
||||||||
|
3-Year
Average (2007-2009)
|
583
|
657
|
230
|
|||||||
|
5-Year
Average (2005-2009)
|
688
|
758
|
221
|
|||||||
|
Segment
income
|
614
|
906
|
601
|
669
|
389
|
|||||
|
Add:
significant items affecting earnings
|
||||||||||
|
Plant
closure and impairments
|
-
|
-
|
-
|
90
|
-
|
|||||
|
Hurricane
insurance charges
|
11
|
-
|
-
|
-
|
-
|
|||||
|
Write-off
of plants
|
159
|
-
|
-
|
-
|
-
|
|||||
|
Core
results
|
784
|
906
|
601
|
759
|
389
|
|||||
|
Occidental
Petroleum Corporation
|
||||||||||||
|
Reconciliation
to Generally Accepted Accounting Principles (GAAP)
|
||||||||||||
|
For
the Year Ended December 31, 2009
|
||||||||||||
|
United
|
Latin
|
Middle
East
|
||||||||||
|
States
|
America
|
North
Africa
|
TOTAL
|
|||||||||
|
Capitalized
Costs
|
||||||||||||
|
Proved
properties
|
24,488
|
5,743
|
10,909
|
41,140
|
||||||||
|
Unproved
properties
|
1,709
|
-
|
158
|
1,867
|
||||||||
|
26,197
|
5,743
|
11,067
|
43,007
|
|||||||||
|
Accumulated
DD&A
|
(7,956
|
)
|
(2,490
|
)
|
(4,826
|
)
|
(15,272
|
)
|
||||
|
Capitalized
cost
|
18,241
|
3,253
|
6,241
|
27,735
|
||||||||
|
Costs
Incurred
|
||||||||||||
|
Property
Acquisition Costs
|
||||||||||||
|
Proved
Properties
|
569
|
-
|
158
|
727
|
||||||||
|
Unproved
Properties
|
100
|
-
|
3
|
103
|
||||||||
|
Exploration
Costs
|
131
|
26
|
50
|
207
|
||||||||
|
Development
Costs
|
1,223
|
560
|
996
|
2,779
|
||||||||
|
Cost
Incurred
|
2,023
|
586
|
1,207
|
3,816
|
||||||||
|
Results
of Operations
|
||||||||||||
|
Revenues
|
5,832
|
1,538
|
4,195
|
11,565
|
||||||||
|
Production
costs
|
1,452
|
409
|
601
|
2,462
|
||||||||
|
Taxes
other than on income
|
399
|
22
|
-
|
421
|
||||||||
|
Exploration
expenses
|
156
|
28
|
83
|
267
|
||||||||
|
Other
operating expenses
|
389
|
116
|
208
|
713
|
||||||||
|
Impairment
of suspended costs
|
-
|
170
|
-
|
170
|
||||||||
|
DD&A
|
1,237
|
628
|
823
|
2,688
|
||||||||
|
Pretax
income
|
2,199
|
165
|
2,480
|
4,844
|
||||||||
|
Income
taxes
|
670
|
6
|
1,151
|
1,827
|
||||||||
|
Results
of operations
|
1,529
|
159
|
1,329
|
3,017
|
||||||||
|
After-tax
Cash
|
||||||||||||
|
After-tax
income
|
1,529
|
159
|
1,329
|
3,017
|
||||||||
|
+
DD&A
|
1,237
|
628
|
823
|
2,688
|
||||||||
|
+
Impairment of suspended costs
|
-
|
170
|
-
|
170
|
||||||||
|
+
Exploration expense
|
156
|
28
|
83
|
267
|
||||||||
|
-
Costs incurred (development)
|
(1,223
|
)
|
(560
|
)
|
(996
|
)
|
(2,779
|
)
|
||||
|
-
Costs incurred (exploration)
|
(131
|
)
|
(26
|
)
|
(50
|
)
|
(207
|
)
|
||||
|
After-tax
cash
|
1,568
|
399
|
1,189
|
3,156
|
||||||||
|
Return
on Average Net Capitalized Costs
|
||||||||||||
|
Capitalized
costs
|
||||||||||||
|
2009
|
18,241
|
3,253
|
6,241
|
27,735
|
||||||||
|
2008
|
17,611
|
3,484
|
5,886
|
26,981
|
||||||||
|
Average
|
17,926
|
3,369
|
6,064
|
27,358
|
||||||||
|
After-tax
income
|
1,529
|
159
|
1,329
|
3,017
|
||||||||
|
Return
%
|
9%
|
5%
|
22%
|
11%
|
||||||||