Attached files
| file | filename |
|---|---|
| EX-99.1 - PRESS RELEASE - SUNEDISON, INC. | dex991.htm |
| 8-K - FORM 8-K - SUNEDISON, INC. | d8k.htm |
 Capital Markets Day February 4, 2010 Exhibit 99.2 |
 Safe
Harbor Capital Markets Day | P. 2 With the exception of historical information, the matters disclosed in this presentation are forward-looking statements. Such statements involve certain risks and uncertainties that could cause actual results to differ materially from those in the forward-looking statements. Potential risks and uncertainties are described in the Company’s filings with the Securities and Exchange Commission, including its 2008 Form 10-K and 2009 Form 10-Qs. These forward-looking statements represent the Company’s judgment as of the date of this presentation. The Company disclaims, however, any intent or obligation to update these forward-looking statements.
|
 Agenda Capital Markets Day | P. 3 The MEMC of Today and Tomorrow – Ahmad Chatila MEMC Semiconductor Materials – Shaker Sadasivam MEMC Solar Materials – Ken Hannah SunEdison – Carlos Domenech Closing & Divisional Remarks - Ahmad Chatila 2010 Outlook – Tim Oliver Q & A |
 The
MEMC of Today & Tomorrow Ahmad Chatila, Chief Executive Officer February 4, 2010 |
 Capital Markets Day | P. 5 Dynamics and Challenges Rebuilding and Repositioning MEMC…Today and Tomorrow 2009 in Review 2010 Priorities Semiconductors Solar |
 Dynamics and Challenges Capital Markets Day | P. 6 Pricing Declines Polysilicon Solar Wafers Semiconductor Wafers Unit Drop in Semiconductors Flat Solar Units (while capacities increased by ~50%) Spain, Credit Crunch Pasadena Operational Challenges Low Gross Margin and Inconsistent Results Opaqueness to Investors Customer Relationships Market Related Challenges MEMC Specific Challenges Tough Year…Weathered the Storm |
 Capital Markets Day | P. 7 Rebuilding & Repositioning Reduce Costs Improve Capability Catalyze Growth Mitigate Risk |
 Rebuilding & Repositioning: Reduce Costs Capital Markets Day | P. 8 Best-in-class Cost Position Will Drive Our Success…Broad-based
Productivity Effort Wave 1 & 2 Base Spend Confirmed Savings Additional Target Adjusted Spend -14% -3% Polysilicon Costs Procurement Savings Pasadena Cost per KG |
 Rebuilding & Repositioning: Catalyze Growth Capital Markets Day | P. 9 *Source: SEMI, MEMC estimates **Source: Photon, SEMI, Gartner, MEMC estimates Simultaneously growing share and expanding our reach 2005 2006 2007 2008 2009 Semiconductor Market Share * Expanded Addressable Market * * 2009 Semiconductor Wafer Solar Polysilicon Solar Wafer Solar Project 2009 |
 Rebuilding and Repositioning: Diverse, Synergistic Business Portfolio Capital Markets Day | P. 10 50 years of innovation Direct global presence Established (semiconductor stringent) quality systems Price and demand visibility Better planning Additional wafer demand Accelerate poly/wafer innovations “10,000 customers” Polysilicon scale SG&A cost amortization Strong ties with cell/module customers High quality material at predictable cost Semiconductor Materials Solar Materials SunEdison synergy synergy Vertically Integrated Portfolio is a Competitive Advantage Strong balance sheet, low financing costs |
 Rebuilding and Repositioning: Diverse, Synergistic Business Portfolio Capital Markets Day | P. 11 50 years of innovation Direct global presence Established (semiconductor stringent) quality systems Price and demand visibility Better planning Additional wafer demand Accelerate poly/wafer innovations “10,000 customers” Polysilicon scale SG&A cost amortization Strong ties with cell/module customers High quality material at predictable cost Semiconductor Materials Solar Materials SunEdison Vertically Integrated Portfolio is a Competitive Advantage Strong balance sheet, low financing costs synergy |
 Rebuilding and Repositioning: Diverse, Synergistic Business Portfolio Capital Markets Day | P. 12 50 years of innovation Direct global presence Established (semiconductor stringent) quality systems Price and demand visibility Better planning Additional wafer demand Accelerate poly/wafer innovations “10,000 customers” Polysilicon scale SG&A cost amortization Strong ties with cell/module customers High quality material at predictable cost Semiconductor Materials Solar Materials SunEdison Vertically Integrated Portfolio is a Competitive Advantage Strong balance sheet, low financing costs synergy |
   Rebuilding and Repositioning: Diverse, Synergistic Business Portfolio Capital Markets Day | P. 13 50 years of innovation Direct global presence Established (semiconductor stringent) quality systems Price and demand visibility Better planning Additional wafer demand Accelerate poly/wafer innovations “10,000 customers” Polysilicon scale SG&A cost amortization Strong ties with cell/module customers High quality material at predictable cost Semiconductor Materials Solar Materials SunEdison Vertically Integrated Portfolio is a Competitive Advantage Strong balance sheet, low financing costs synergy |
   Rebuilding and Repositioning: Diverse, Synergistic Business Portfolio Capital Markets Day | P. 14 50 years of innovation Direct global presence Established (semiconductor stringent) quality systems Price and demand visibility Better planning Additional wafer demand Accelerate poly/wafer innovations “10,000 customers” Polysilicon scale SG&A cost amortization Strong ties with cell/module customers High quality material at predictable cost Semiconductor Materials Solar Materials SunEdison Vertically Integrated Portfolio is a Competitive Advantage Strong balance sheet, low financing costs synergy |
 Rebuilding & Repositioning: Improving Capability Capital Markets Day | P. 15 Equipping the best people with the best processes and the right metrics Experienced Team Robust Processes Diverse Backgrounds Deep Experience Optimal Mix Internal Promotions New Additions Returning Experts Strong, Engaged Board of Directors Applicable expertise Historical perspective New Processes Account management Semi pricing Semi cost roadmap Customer base “LCOE” roadmap Pasadena operations Procurement Free Cash Flow forecasting Improved corporate planning More to come |
 Rebuilding & Repositioning: Mitigate Risk Capital Markets Day | P. 16 Changing the risk profile of the company Lower Costs Faster Growth More Capable Captured significant purchasing savings Launched Asia centric manufacturing strategy Launched internal solar wafering plant Implemented LCOE roadmap Implemented Semi wafer roadmap Reduced Pasadena variability Expanded addressable market Expanded product offering Broadened customer sets Acquired Sun Edison Increasing polysilicon capacity Assembled the right team Implemented robust processes in the right places Implementing business unit structure Cross-qualified plants |
 Priorities for 2010 and Beyond Capital Markets Day | P. 17 Continued customer momentum Improve Service Optimal pricing Cost roadmap execution Best-in-class costs Expand pipeline…Grow backlog Deliver competitive LCOE roadmap Capture sufficient and efficient project financing capacity Systematize operational improvements Semiconductor Materials Solar Businesses Good Momentum…a lot left to do Total Company Attract and retain the best people More transparent and consistent |
 Semiconductor Materials Dr. Shaker Sadasivam, President, MEMC Semiconductor Materials February 4, 2010 |
 Capital Markets Day | P. 19 Semiconductor Materials Overview Broad Product & IP Portfolio Hundreds of high quality silicon patents worldwide Complete offering of innovative products SOI, PerfectSilicon, MDZ, Optia, Clear Epi World-class Research & Development organization Available to support customers – competitive advantage 50 years of silicon research and experience Driving innovation & cost-reduction efforts Worldwide customer service, support & logistics 21 locations – manufacturing, sales, service & support Local, responsive & flexible Worldwide quality assurance Strongest financial position & longevity Strong balance sheet and low cost manufacturing global infrastructure Leading Position |
 Market Dynamics: Long-Term Capital Markets Day | P. 20 TODAY 1993 Pre-1990 Consolidated Market High Barriers to Entry – (thousands of specs, global presence, capability, patents & IP, capex, profitable performance) Generally consistent unit growth Consolidated Market, High Barriers >20 producers of 150mm or smaller 10 producers of 200mm 6 producers of 300mm Long-term Unit Growth Mature market with Good Long-Term Growth Trend |
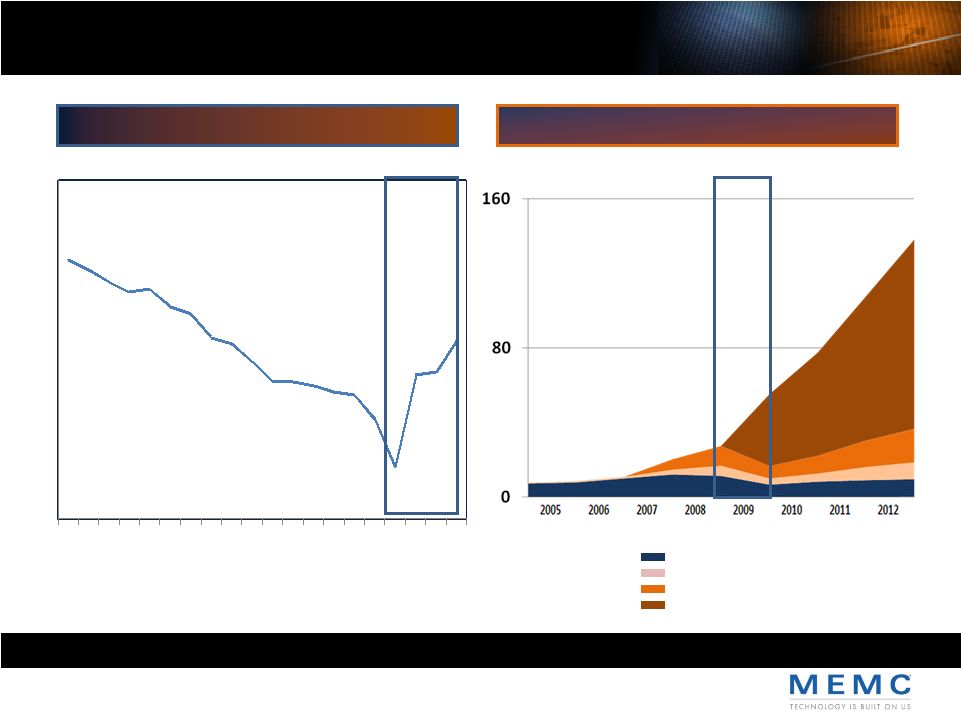
 Capital Markets Day | P. 21 Market Dynamics: 2009 ‘09 Unprecedented Decline in both Price and Volume |
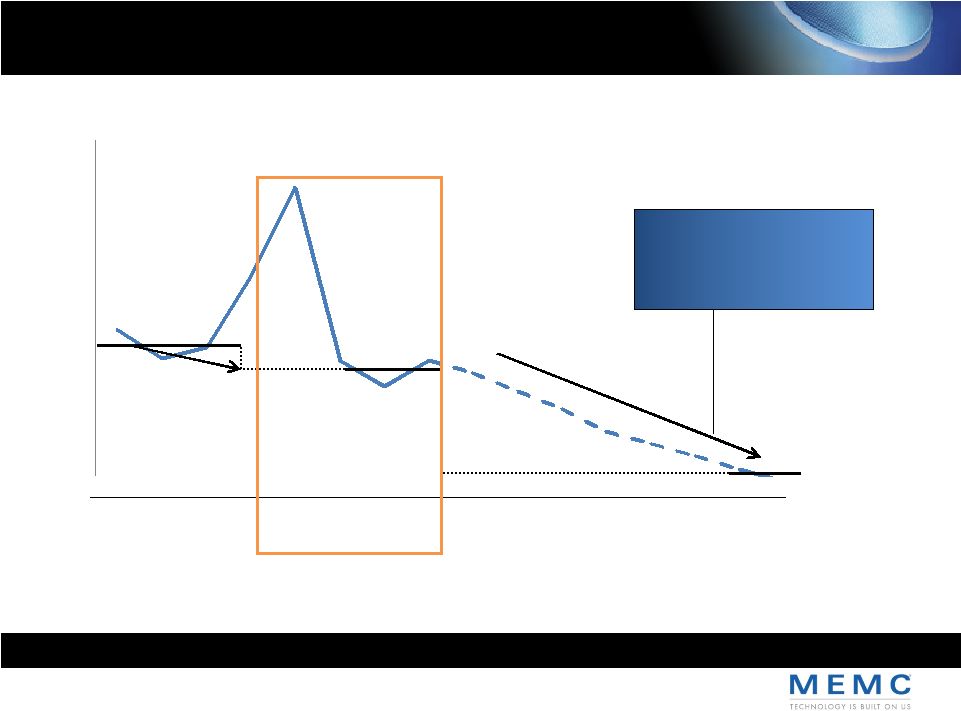
 Capital Markets Day | P. 22 Market Dynamics: 2009 ‘09 ‘10 Price and Volume Recovery |
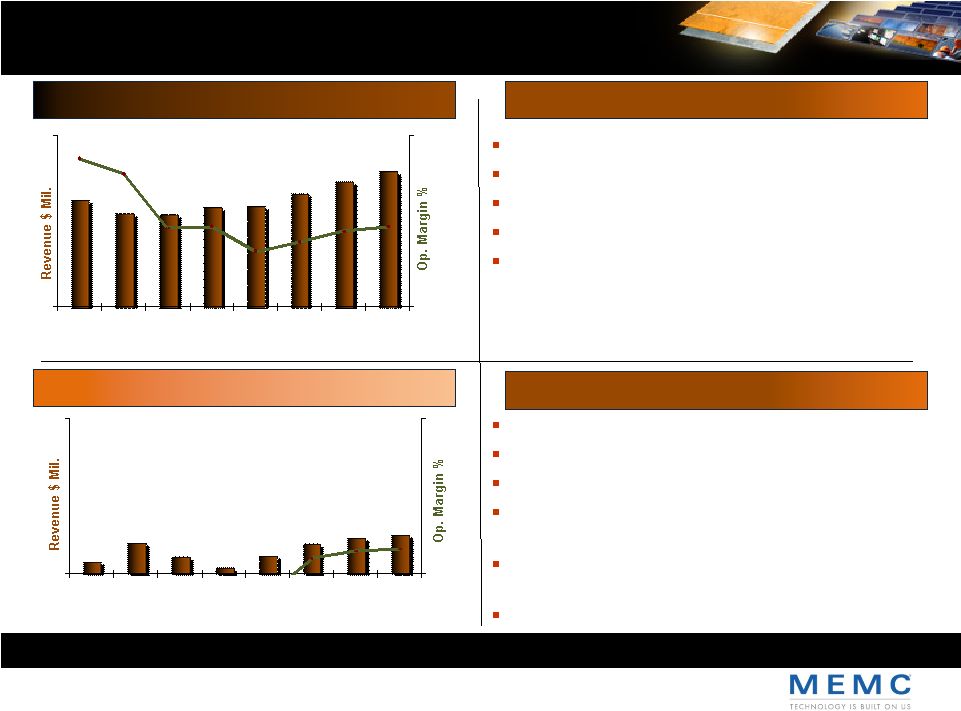
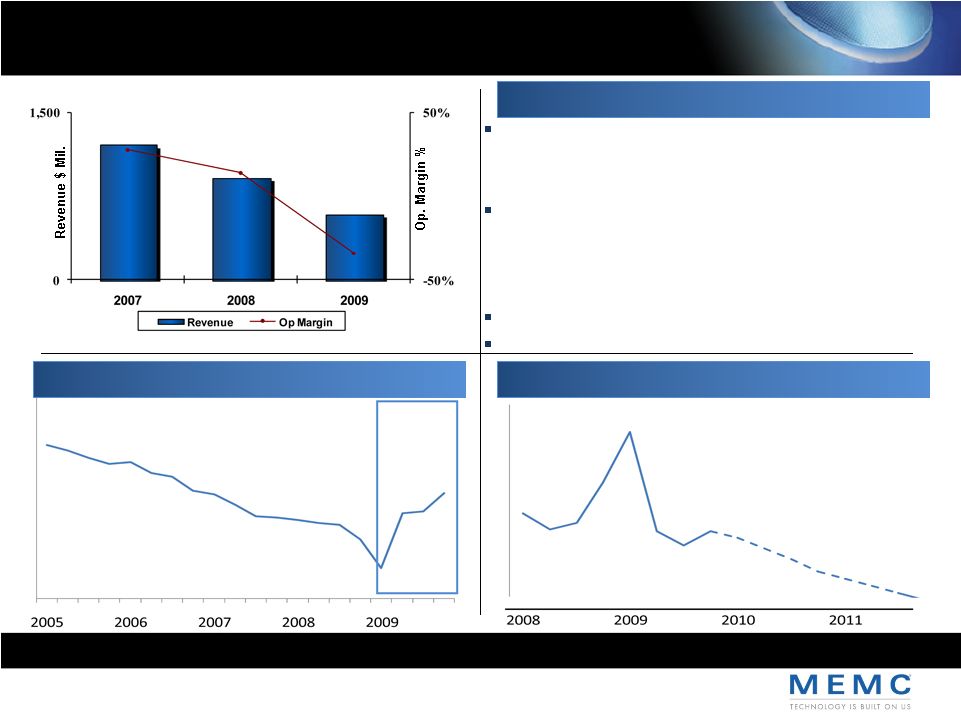 Capital Markets Day | P. 23 Historical Performance Source: SEMI, MEMC estimates. Revenue & Operating Margin Structural Changes Stem Market Share Losses. We Now Have Positive Momentum.
Reversed Share Losses, Now Have Momentum • Complete Customer Focus • New Qualifications Lower Wafer Cost • Improved Process • Asia Manufacturing • Closing High Cost Capacity SOI R&D 2009 2009 Accomplishments …Costs coming Down Strong Customer Momentum… |
 Strong Customer Momentum Capital Markets Day | P. 24 0% 20% 2005 2006 2007 2008 2009 Semiconductor Market Share Successful Turn-Around…Near Double from Bottom 2009 |
 2008
2009 2010 2011 Semiconductor Wafer Cost (Example: 200mm) Costs Coming Down Capital Markets Day | P. 25 Capital Markets Day | P. 25 Best Known Method -Utilization - - reductions -7% -20% Reversing Upward Cost Trend Procurement Tactical cost |
 2010 Outlook Capital Markets Day | P. 26 World-class costs generating high gross margins • Consolidation projects and capability improvements Best-in-class service and customer momentum New products to fuel above-market growth • 300mm & SOI capacity expansion -50% 50% 0 350 1Q'09 2Q'09 3Q'09 4Q'09 1Q'10 2Q'10 3Q'10 4Q'10 2010 Priorities Customer Momentum: Capacity Development Revenue & Margin 2009-2010 Significant Volume Rebound…Aggressive Cost Actions Taiwan Expand crystal making Korea 300mm qualification & ramp Malaysia 200mm hard ramp Source: Gartner New Products: SOI TAM * – A great opportunity |
 2010 Outlook: Priorities Capital Markets Day | P. 27 Planned phased closure of U.S. sites by early 2011 and continuous cost reduction activities We will also continue with high asset turnover model on capacity expansions World-class costs generating higher gross margins Significant Volume Rebound…Aggressive Cost Actions Best-in-class service and sustained customer momentum New products to fuel above-market growth rates Ranked #1 in service at 3 of the 6 largest device companies across 3 continents Expanded Sales, Engineering and Service organizations to create more focus and responsiveness 2010 will be first year of strong revenue growth on 300mm SOI Development of 32nm substrate solutions for advanced applications and tailored epitaxy solutions for CIS |
 SunEdison Carlos Domenech, President, SunEdison February 4, 2010 Solar Materials Ken Hannah, President, MEMC Solar Materials February 4, 2010 |
   Capital Markets Day | P. 29 Solar Business Model Synergy Rich Combination Cell & Module Vendor / Customer Partners “First mover” advantage in highest growth, most complex, fragmented markets Revenue and margin created per watt is 4x wafer; margin stacking Diversify customer base by 100x High barriers to entry Cost off-take Pull through Solar Materials SunEdison Match forward pricing curve with internal cost projections Accelerate cost reductions and product innovation at module level Leverage strategic partners to increase revenue with wafer “pull- through” Improve revenue quality by aligning with future industry leaders Reduce risk on long-cycle CAPEX Leverage solar materials international presence to expand SunEdison worldwide |
 Capital Markets Day | P. 30 #1 Solar Energy Services Provider in U.S. Pioneer provider of solar systems and services Commercial turn key solar power plants Leading PPA developer Developed distributed generation market The largest solar energy service provider in North America ~100+ Mws installed, financed and under O&M 700 Mws backlog and pipeline Demonstrated track record with financial institutions Over $700M in project financing Systems operating at >100% of underwritten investment Three Value Streams Development Fee (up-front income upon sale of systems) Contracted Residual (value of production beyond obligations) Service Revenue (O&M, environment attributes) Key Advantages Internal R&D to optimize system design and production Leading monitoring technology to maximize uptime and production Best in class cost of capital SunEdison Overview |
 Capital Markets Day | P. 31 Strong & Established Company Competing in an Immature Market Solar Materials Overview Vertical integration in polysilicon and wafers Capacity expansion in both areas Internal wafering site on-line in 2010 Polysilicon capacity to support internal growth Significant synergies with other MEMC segments High Quality Materials 2 world-class polysilicon facilities Semiconductor capable material Recognized quality leader World-class Research & Development organization FAE’s available to support customers – competitive advantage 50 years of silicon research, IP & patents Driving innovation & cost-reduction efforts Semiconductor quality systems, supporting solar Worldwide customer service, support & logistics 21 worldwide locations – manufacturing, sales, service & support Worldwide quality assurance Relationships with all major cell & module providers Strongest financial position & longevity Customers know we will be here to support them for the long-term Viability to invest in capital intensive business |
 Market Dynamics – PV solar capacity Capital Markets Day | P. 32 Annual Installations (Gw) 1.4 2005 2.7 2007 5-6 2009e 8.2 6.0 6.6 2011e 2008 2012e 5.5 10.0 7.8 8.6 2006 2010e 1.8 7.0 5.5 6.0 Low: High: View: ROW (MENA) 62% Italy 39% Germany -21% Spain 29% Europe (France) 36% Canada 127% US 51% India 60% China 137% Global 37% Japan 25% 3Year CAGR Source: Greentech Media, Solarbuzz, SunEdison estimates. Enormous potential market – solar <0.5% of world energy supply |
 • State RPS requirements and other solar incentive programs • U.S Stimulus; DOE, ITC, Bonus depreciation • U.S. Federal climate legislation and EPA regulation • New FIT markets Market Dynamics – Global PV Market Trends Capital Markets Day | P. 33 Key drivers Competitive trends (2010 – 2014) • ST: Consolidation of existing players, local competition (China) • Large debt loads, outdated equipment, varied cost structures • MT: Differentiated by ability to scale project financing • LT: Large cap new entrants as economics and markets mature • Willing to accept lower margins to compete Competition (fewer and bigger players) • Need based economies (China, India, North Africa) • Regulatory requirements and policy (net metering) • Competitive $/Mwh versus increasing conventional energy rates Demand (net global increase) • New technologies emerge, challenge to finance • Additional capacity coming on-line, overcapacity • Few successful new polysilicon entrants, more to follow • Pressure on margins, forward integration; lowest cost wins • Inefficient and opaque global supply chain Supply (increased volumes) Regulatory environment (increased involvement) Enormous potential market – solar <0.5% of world energy supply |
 2008
2009 Pasadena Cost/KG Capital Markets Day | P. 34 Considerable Progress on Several Important Issues Revenue & Operating Margin (Solar Materials) 0% 100% 0 1,200 2007 2008 2009 Historical Performance Improved existing customer relationships…sales to all 4 LTA customers Added over 25 new customers Completed 50Mw German solar plant …IRR>20% Stabilized polysilicon manufacturing in Q4…increased throughput and reduced variability 2009 Accomplishments …and Predictability is Up Poly Costs are Down… |
 Capital Markets Day | P. 35 Historical Performance 2008 2009 Pasadena Cost/KG Operational Improvements Showing Early Results – Increased & More Consistent Output |
 Capital Markets Day | P. 36 Operational Improvements Showing Early Results – Increased & More Consistent Output. Historical Performance |
 Capital Markets Day | P. 37 Historical Performance Greatly Expanded Customer Base, Reduced Customer Concentration Rank Customer 2009 MW Q109 Status Q409 Status 1 THIN-FILM 1,200 N/A N/A 2 SILICON 1,130 N/A ACTIVE 3 SILICON 1,000 ACTIVE ACTIVE 4 THIN-FILM & SILICON 600 N/A DEVELOPING 5 SILICON 600 N/A N/A 6 SILICON 500 N/A ACTIVE 7 SILICON 450 N/A DEVELOPING 8 SILICON 450 N/A N/A 9 SILICON 400 N/A N/A 10 SILICON 360 ACTIVE ACTIVE 11 SILICON 360 N/A ACTIVE 12 SILICON 300 N/A N/A 13 SILICON 300 N/A DEVELOPING 14 SILICON 295 N/A N/A 15 SILICON 290 N/A N/A 16 SILICON 280 N/A DEVELOPING 17 SILICON 225 N/A N/A 18 SILICON 200 N/A DEVELOPING 19 SILICON 200 N/A ACTIVE 20 THIN-FILM & SILICON 190 N/A ACTIVE 21 SILICON 185 N/A ACTIVE 22 SILICON 160 N/A ACTIVE 23 SILICON 150 N/A ACTIVE 24 SILICON 130 N/A DEVELOPING 25 SILICON 120 N/A ACTIVE Other Other 2,000 N/A ACTIVE EMERGING THIN-FILM 1,000 N/A ACTIVE Total Total 13,000 |
 Historical Performance Capital Markets Day | P. 38 Description: • Technology agnostic • Leading owner/operator of PV assets • Highest efficiency crystalline module manufacturer • Historically strong in residential segment Capacity share: 14% 5% 4% 8% 4% • Thin film manufacturer • Strong in utility segment 85 31 49 Operational PPA-financed capacity in United States (Mw) 25 25 • Technology agnostic ESCO service provider • Bundles solar with energy efficiency • FL’s largest Investor Owned utility Company B Company C Company D Company E Source: Energy Acuity as of 1/21/09. Data shows developer of record.
2009 Accomplishments - SunEdison Systems >100% production Channel partner program with largest regional players 100+ Mws under management 3 Bil kw/hrs contracted for 20 yrs Successfully penetrated international markets (Canada, Italy, Spain) 40 Mw, 135 systems installed and financed (est. 12% of US non-resi market) • Strong position with national customers • MEMC parent company • Early focus on Europe, emerging player in NA |
 2010 Outlook Capital Markets Day | P. 39 2010 Priorities Materials Revenue & Margin 2009-2010 Leading Provider of Solar Energy Products & Services, Enabling Grid Parity &
Profitable Growth Reduce product cost…OEE improvements Expand customer base…wafer pull through Expand capacity in poly, wafers and installation Leverage backlog and pipeline…1Gw by 2010 Turn cell-module suppliers/customers into strategic partners SunEdison Revenue & Margin 2009-2010 Investments and Initiatives 0% 50% 0 250 1Q'09 2Q'09 3Q'09 4Q'09 1Q'10 2Q'10 3Q'10 4Q'10 0% 50% 0 250 1Q'09 2Q'09 3Q'09 4Q'09 1Q'10 2Q'10 3Q'10 4Q'10 Internal solar wafer plant in Malaysia...sales in Q4 Develop > 100Mw in ‘10 vs. 40Mw in ’09 Channel partners penetration globally Leverage platform in SunEdison; Italy, Spain, Canada Poly production up with OEE improvements and Merano expansion (double capacity) Diversified sources of capital |
 Closing Business Unit Remarks Ahmad Chatila, Chief Executive Officer February 4, 2010 |
 2009, 2010 & Beyond Capital Markets Day | P. 41 Capitalized on Tough Times to Rebuild and Refocus…Poised for Success Semiconductor Continue customer momentum Best-in-class costs Solar Expand pipeline…grow backlog Deliver on LCOE roadmap Secure sufficient and efficient financing capacity Institutionalize operational improvements Built customer momentum Implemented business processes to improve operations Closed strategic investment in SunEdison 2009 Highlights Priorities for 2010 and Beyond |
 2010 Outlook Tim Oliver, Chief Financial Officer February 4, 2010 |
 First 96 Days: Perspective Restructuring Operational issues in Pasadena Tight credit markets Unprecedented correction in semiconductor and solar Significant acquisition 2009 Realities Transparency & Accessibility Credibility & Predictability Steady sequential improvement Fund investment in future period growth with current period efficiency 2010 Objectives Joined at Just the Right Time Capital Markets Day | P. 43 |
 2010 Outlook: Revenue Walk ($ millions) Tailwinds Headwinds Share gain in 2009 augmented by further gains in 2010 Semiconductor volume and price recovery Solar wafer volume SunEdison Mw ramp Persistent and expected decline in Solar wafer prices – Supply chain discontinuity $1.16B $1.75-1.85B Semi Materials Solar Materials SunEdison 2009 Market MEMC Price SunEdison Other 2010 Growth Specific Growth Capital Markets Day | P. 44 |
 2010 Outlook: Segment Operating Margin Walk ($ millions) Tailwinds Headwinds Volume and the accompanying leverage Supply chain and purchasing savings Restructuring benefits Other cost productivity Solar price declines only partially offset by semiconductor increases 2009 Volume Price Mix Productivity 2010 (3%) 16-17% Capital Markets Day | P. 45 |
 2010 Outlook: Free Cash Flow Re-Definition Past Definition Current Definition Proceeds from financing and capital lease obligations Repayments of financing and capital lease obligations SunEdison Business Model Necessitates the Change plus Construction of Solar Energy Systems Cash flows from operating activities Capital expenditures Free Cash Flow less Cash flows from operating activities Capital expenditures less Free Cash Flow less less Capital Markets Day | P. 46 |
 2010 Outlook: Cash Flow Walk Tailwinds Headwinds Swing to a profit Working capital opportunities Strategically imperative capacity investments SunEdison project timing $1,075M Capital Markets Day | P. 47 ~$350M Beg Net Inc Op Cash Semi Poly Solar SunEd SunEd End Cash & Capex Capex Capex Projects Net Fin. Cash & Investments Investments |
 2010 Outlook: SunEdison Impact to Reported Results Sale/Leaseback Debt Finance Direct Sale Energy revenue over life of project Deferred gain on sale over life of project as credit to depreciation Interest expense Energy revenue over life of project ITC and energy credits Interest expense Immediate revenue and margin, just like a product sale O&M contract only impact after sale Capital lease asset Capital lease liability (non-recourse project debt) Energy system asset Debt (non-recourse project debt) Nothing on balance sheet post sale and receivable collection Capex to build system Immediate cash inflow - Proceeds from financing and capital lease obligations in Financing cash flow Cash outflow for lease repayments Cash inflow over life of project for energy rev. Capex to build system Immediate cash inflow - Proceeds from financing and capital lease obligations in Financing cash flow Cash outflow for debt repayments Cash inflow over life of project for energy rev. Operating cash (inventory) to build system Operating cash upon receipt of cash from customer on system sale Capital Markets Day | P. 48 |
 SunEdison: Typical Sale/Leaseback Project Construction Phase Project LLC MEMC Construction System Sale Cash Purchase Const. Funding Capital Markets Day | P. 49 |
 SunEdison: Typical Sale/Leaseback Project Financial Institution Cash Purchase System Sale Project LLC MEMC Construction Closing Phase Capital Markets Day | P. 50 |
 SunEdison: Typical Sale/Leaseback Project Financial Institution Host / Customer Energy from System $/kWh Billing Free Cash Flow Lease Payments System Lease Project LLC MEMC Construction Operations Phase Capital Markets Day | P. 51 |
 2010 Outlook: New Reported Segments Semiconductor Materials Solar Materials SunEdison Risks •Operational execution •Global economic regression Opportunities •Pricing retention Risks •2 nd half uncertainty Opportunities •SunEdison pull through Risks •Ramp execution risk •Subsidies environment •Financing capacity Opportunities •Materials cross-sell •Large Intl. projects -50% 50% 0 1,500 2009 2010 -50% 50% 0 1,500 2009 2010 -50% 50% 0 250 2009 2010 Cautiously Optimistic Dynamic Environment Rapid Ramp Capital Markets Day | P. 52 |
 2010 Outlook: Guidance Overview Revenue ($ million) - Semiconductor Materials - Solar Materials - SunEdison Segment Operating Margin - Semiconductor Materials - Solar Materials - SunEdison Tax Rate EPS from Continuing Ops Free Cash Flow Capital Expenditure 2009 Actual $1,164 586 573 4 (2%) ($0.30) ($158) $225 2010 Guidance $1,750–1,850 $0.70-0.80 Positive Modeling Support 60-70% Growth 5-15% Growth ~$200M 16-17% Higher than avg. Higher than avg. Lower than avg. ~15% ~$350M for core Capital Markets Day | P. 53 |
 2010 Outlook: Revenue & EPS Calendarization 0.00 0.50 0 500 Q110 Q210 Q310 Q410 Consensus Revenue Consensus EPS MEMC Revenue Outlook MEMC EPS Outlook EPS Ramps with Volume and Productivity Capital Markets Day | P. 54 |
 Business Model: Longer-Range Targets Capital Markets Day | P. 55 We Will Make Significant Progress in 2010 Long Range Target 2010 Outlook Revenue Growth Gross Margins Opex as % of Revenue Operating Income as % Revenue Capex as % of Revenue (Materials Businesses) IRR of Projects in Solar Systems FCF as % of Net Income >Market 30% 10% 20% 15% 20% 85% Closing Gap Work to do Closing Gap ~20% Work to do |
 Q&A Ahmad Chatila, Chief Executive Officer Tim Oliver, Chief Financial Officer Dr. Shaker Sadasivam, President, MEMC Semiconductor Materials Ken Hannah, President, MEMC Solar Materials Carlos Domenech, President, SunEdison * * * * |
 Capital Markets Day February 4, 2010 * * * * |