Attached files
Table of Contents
UNITED STATES
SECURITIES AND EXCHANGE COMMISSION
Washington, D.C. 20549
Form 10-K
(Mark One)
| x | ANNUAL REPORT PURSUANT TO SECTION 13 OR 15(d) OF THE SECURITIES EXCHANGE ACT OF 1934 |
For the fiscal year ended December 31, 2009
or
| ¨ | TRANSITION REPORT PURSUANT TO SECTION 13 OR 15(d) OF THE SECURITIES EXCHANGE ACT OF 1934 |
For the transition period from to .
Commission file number: 001-33844
Entropic Communications, Inc.
(Exact Name of Registrant as Specified in Its Charter)
| Delaware | 33-0947630 | |
| (State or Other Jurisdiction of Incorporation or Organization) |
(I.R.S. Employer Identification No.) |
6290 Sequence Drive
San Diego, CA 92121
(Address of Principal Executive Offices, Including Zip Code)
Registrant’s telephone number, including area code: (858) 768-3600
Securities registered pursuant to Section 12(b) of the Act:
| Title of Each Class |
Name of Each Exchange on Which Registered | |
| Common Stock, par value $0.001 per share | The NASDAQ Stock Market |
Securities registered pursuant to Section 12(g) of the Act: None
Indicate by check mark if the registrant is a well-known seasoned issuer, as defined in Rule 405 of the Securities Act. Yes ¨ No x
Indicate by check mark if the registrant is not required to file reports pursuant to Section 13 or Section 15(d) of the Act. Yes ¨ No x
Indicate by check mark whether the registrant (1) has filed all reports required to be filed by Section 13 or 15(d) of the Securities Exchange Act of 1934 during the preceding 12 months (or for such shorter period that the registrant was required to file such reports), and (2) has been subject to such filing requirements for the past 90 days. Yes x No ¨
Indicate by check mark whether the registrant has submitted electronically and posted on its corporate Web site, if any, every Interactive Data File required to be submitted and posted pursuant to Rule 405 of Regulation S-T (§232.405 of this chapter) during the preceding 12 months (or for such shorter period that the registrant was required to submit and post such files). Yes ¨ No ¨
Indicate by check mark if disclosure of delinquent filers pursuant to Item 405 of Regulation S-K (§ 229.405 of this chapter) is not contained herein, and will not be contained, to the best of registrant’s knowledge, in definitive proxy or information statements incorporated by reference in Part III of this Form 10-K or any amendment to this Form 10-K. ¨
Indicate by check mark whether the registrant is a large accelerated filer, an accelerated filer, a non-accelerated filer or a smaller reporting company. See the definitions of “large accelerated filer,” “accelerated filer” and “smaller reporting company” in Rule 12b-2 of the Exchange Act.
| Large accelerated filer ¨ |
Accelerated filer x | |||
| Non-accelerated filer ¨ (Do not check if a smaller reporting company) |
Smaller reporting company ¨ | |||
Indicate by check mark whether the registrant is a shell company (as defined in Rule 12b-2 of the Act). Yes ¨ No x
As of June 30, 2009, the last business day of the registrant’s most recently completed second fiscal quarter, the aggregate market value of the registrant’s common stock held by non-affiliates of the registrant was $110.6 million based on the closing price of the registrant’s common stock on The NASDAQ Global Market of $2.25 per share on June 30, 2009.
There were 71,501,575 shares of the registrant’s common stock issued and outstanding as of February 1, 2010.
DOCUMENTS INCORPORATED BY REFERENCE
Part III of this Annual Report on Form 10-K incorporates by reference certain information from the registrant’s definitive proxy statement for the registrant’s 2010 Annual Meeting of Stockholders to be filed within 120 days after the end of the registrant’s fiscal year ended December 31, 2009.
Table of Contents
ENTROPIC COMMUNICATIONS, INC.
ANNUAL REPORT ON FORM 10-K
FOR THE FISCAL YEAR ENDED DECEMBER 31, 2009
| Page | ||||
| PART I | ||||
| Item 1. |
2 | |||
| 18 | ||||
| Item 1A. |
24 | |||
| Item 1B. |
52 | |||
| Item 2. |
52 | |||
| Item 3. |
52 | |||
| Item 4. |
52 | |||
| PART II | ||||
| Item 5. |
53 | |||
| Item 6. |
57 | |||
| Item 7. |
Management’s Discussion and Analysis of Financial Condition and Results of Operations |
59 | ||
| Item 7A. |
79 | |||
| Item 8. |
81 | |||
| Item 9. |
Changes in and Disagreements with Accountants on Accounting and Financial Disclosure |
81 | ||
| Item 9A. |
81 | |||
| Item 9B. |
84 | |||
| PART III | ||||
| Item 10. |
85 | |||
| Item 11. |
85 | |||
| Item 12. |
Security Ownership of Certain Beneficial Owners and Management and Related Stockholder Matters |
85 | ||
| Item 13. |
Certain Relationships and Related Transactions, and Director Independence |
85 | ||
| Item 14. |
86 | |||
| PART IV | ||||
| Item 15. |
87 | |||
Entropic, Entropic Communications, c.LINK®, RF Magic and our logo are among the trademarks of Entropic Communications, Inc. and/or its affiliates in the United States and certain foreign countries. Any other trademarks or trade names mentioned are the property of their respective owners.
i
Table of Contents
FORWARD-LOOKING STATEMENTS
All statements included or incorporated by reference in this Annual Report on Form 10-K, or Annual Report, other than statements or characterizations of historical fact, are forward-looking statements. Examples of forward-looking statements include, but are not limited to, statements concerning our ability to achieve or sustain profitability; the competitive nature of the markets in which we compete and the effect of competing products and technologies; the demand for our products; the adoption of our technologies and the Multimedia over Coax Alliance standard; the competitive nature of service providers; our dependence on manufacturers, sales representatives, distributors and other third parties; our ability to create and introduce new products and technologies; our ability to effectively manage growth; our ability to successfully acquire companies or technologies that would complement our business and successfully integrate those companies or technologies with ours; the ability of our contract manufacturers to produce and deliver products in a timely manner and at satisfactory prices; the transitioning of our silicon products to improved manufacturing process technologies; our ability to protect our intellectual property and avoid infringement of the intellectual property of others; our reliance on our key personnel; the effects of government regulation; our ability to obtain sufficient capital to expand our business; our ability to manage our business in the midst of a downturn in the economy; the cyclical nature of our industry; our ability to effectively transact business in foreign countries; and our ability to achieve and maintain effective internal control over financial reporting in accordance with Section 404 of the Sarbanes-Oxley Act of 2002.
The following discussion contains forward-looking statements, which involve risks and uncertainties. These forward-looking statements are based on our current expectations, estimates, approximations and projections about our industry and business, management’s beliefs, and certain assumptions made by us, all of which are subject to change. Forward-looking statements can often be identified by words such as “anticipates,” “expects,” “intends,” “plans,” “predicts,” “believes,” “seeks,” “estimates,” “may,” “will,” “should,” “would,” “could,” “potential,” “continue,” “ongoing” and similar expressions, and variations or negatives of these words. Forward-looking statements are not guarantees of future performance and are subject to risks, uncertainties and assumptions that are difficult to predict. Therefore, our actual results could differ materially and adversely from those expressed in any forward-looking statements as a result of various factors, some of which are listed under Part I, Item 1A, Risk Factors of this Annual Report and in our other filings with the Securities and Exchange Commission, or SEC. These forward-looking statements reflect our management’s belief and views with respect to future events and are based on estimates and assumptions as of the date of this Annual Report and are subject to risks and uncertainties. We operate in a very competitive and rapidly changing environment. New risks emerge from time to time. It is not possible for our management to predict all risks, nor can we assess the impact of all factors on our business or the extent to which any factor, or combination of factors, may cause actual results to differ materially from those contained in any forward-looking statements in this Annual Report or in our other filings with the SEC.
Except as required by law, we assume no obligation to update these forward-looking statements publicly, or to update the reasons actual results could differ materially from those anticipated in these forward-looking statements, even if new information becomes available in the future. Thus, you should not assume that our silence over time means that actual events are bearing out as expressed or implied in these forward-looking statements.
In this Annual Report, “Entropic Communications, Inc.”, “Entropic Communications”, “Entropic”, the “Company”, “we”, “us” and “our” refer to Entropic Communications, Inc. and its subsidiaries, taken as a whole, unless otherwise noted.
1
Table of Contents
PART I
| Item 1. | Business |
Overview
Entropic Communications is a leading fabless semiconductor company that designs, develops and markets systems solutions to enable connected home entertainment. Our technologies significantly change the way high-definition and standard-definition television-quality video, or HD video and SD video, respectively, and other multimedia content such as movies, music, games and photos are brought into and delivered throughout the home.
We are a pioneer of key technologies that enable connected home networking of digital entertainment over existing coaxial cable. We are a founding member of the Multimedia over Coax Alliance, or MoCA, a global home networking consortium that sets standards for the distribution of video and other multimedia entertainment over coaxial cable. Our products include:
| • | home networking chipsets based on the MoCA standard; |
| • | high-speed broadband access chipsets; |
| • | integrated circuits that simplify and enhance digital broadcast satellite, or DBS services; and |
| • | silicon tuner integrated circuits. |
Our products allow telecommunications carriers, cable multiple service operators, or MSOs, and DBS service providers, which we collectively refer to as service providers, to enhance and expand their service offerings and reduce deployment costs in an increasingly competitive environment.
Our home networking solutions capitalize on the worldwide conversion of multimedia content, including video, from analog to digital. Multimedia content is now easy to store on digital video recorders, or DVRs, gaming consoles, digital versatile disk, or DVD, recorders and personal computers. The ability to store this content on various devices has created “islands” of digital entertainment within the home. Our products bridge these islands and allow consumers to access their multimedia content throughout the home. Today, we are the only high-volume supplier of MoCA-compliant chipsets, which can be embedded in a wide variety of consumer electronic devices. Service providers can employ our solutions to offer consumer applications such as multi-room DVR, multi-room and online gaming, personal computer-to-television content sharing and streaming of downloaded movies stored on a personal computer to a television. Our products also enable a new generation of consumer devices, including gaming consoles, high-definition televisions, or HDTVs, Blu-ray players and over-the-top, or OTT, set-top boxes to stream high-quality content directly and reliably from the internet.
We have extensive core competencies in video communications, networking algorithms and protocols, system-on-a-chip design, embedded software, mixed signal and radio frequency integrated circuit design, and communications and radio frequency systems. We use our considerable experience with service provider-based deployments to create solutions that address the complex requirements associated with delivering multiple streams of HD video into and throughout the home while seamlessly coexisting with video, voice and data services that are using the same coaxial cable infrastructure.
We were incorporated in Delaware in January 2001. Our principal executive offices are located at 6290 Sequence Drive, San Diego, California 92121, and our telephone number is (858) 768-3600. Our corporate website address is www.entropic.com. Our current and future annual reports on Form 10-K, future quarterly reports on Form 10-Q, current reports on Form 8-K and other filings with
2
Table of Contents
the SEC are available, free of charge, through the investor relations section of our website as soon as reasonably practicable after we electronically file such material with, or furnish them to, the SEC. The information contained on, or accessible through, our website is not intended to be part of this or any other report we file with, or furnish to, the SEC. Our common stock trades on The NASDAQ Global Market under the symbol ENTR.
Industry Background
Intense competition among service providers seeking to maximize revenues is driving a revolution in the delivery of video and other multimedia content into and throughout the home. These service providers are making significant infrastructure investments to differentiate their offerings by adding new video services such as HDTV, DVR and video on demand as well as bundled video, voice and broadband data, also referred to as “triple-play”, services. In fact, consumers typically pay a higher price for video services than for traditional voice and broadband services. A successful video offering is critical for service providers to increase average revenue per user, drive subscriber growth and reduce subscriber turnover.
Several favorable consumer entertainment trends are contributing to the increasing video and multimedia revenue opportunity for service providers. These trends include:
| • | Increasing availability of digital multimedia content. The conversion of multimedia content from an analog to a digital format, the increasing number of broadcast content providers who make their video content available for online video streaming, and the introduction of three dimensional, or 3D, video content, are significantly increasing the amount and variety of video, music, photos and other multimedia content that consumers buy, receive and store. |
| • | Proliferation of connected digital multimedia devices within the home. As a result of the increasing availability of multimedia content from sources inside the home and from the internet, connected digital multimedia devices such as HDTVs, desktop and laptop personal computers, DVD players, Blu-ray players, CD players, MP3 players, gaming consoles, DVRs and OTT set-top boxes can now be found in U.S. households in increasing numbers. |
| • | Introduction of new multimedia applications. An increasing number of multimedia applications utilize digital video and other multimedia content for consumer home entertainment. Some examples of these applications include video “time shifting”, or the ability to pause, fast forward and rewind live or stored video, the ability to watch and record multiple television shows at once, video or movie on demand, personal computer-to-television content sharing, multi-room and online gaming, streaming of downloaded movies stored on a personal computer to a television, and OTT services that directly deliver internet video content into the home. |
These trends have resulted in a growing number of “islands” of stored multimedia content within the home, including SD and HD video, movies and broadcast television programs. Service providers and original equipment manufacturers, or OEMs, have identified a tremendous opportunity to seamlessly bridge these “islands” and enable the sharing of such content across devices and between rooms throughout the home. At the same time, as the popularity of online video streaming continues to grow, broadcast service providers recognize the growing need to provide combined broadband and broadcast services to retain their existing subscribers. To address this opportunity and meet evolving customer expectations, service providers are introducing new customer premises equipment and service offerings such as multi-room DVR, which allows for video “placeshifting”, or the ability to access content from multiple locations and devices, and a new class of devices that connect the coaxial network in the home to online services. By providing improved customer premises equipment, service providers are able to easily introduce new services, simplify and
3
Table of Contents
enhance the user experience, and provide content security and service reliability. We believe service providers are competitively positioned to provide these services because they already have licensed access and distribution rights for premium video content and have established the infrastructure that enables carrier class quality of service, or QoS.
The stringent communications requirements associated with high-quality HD video, 3D video and other multimedia content present a significant obstacle for service providers today. In response, service providers require technology solutions that enable the distribution of such content into and throughout the home while maintaining the requisite high-quality standards demanded by subscribers. For any such technology solution to succeed, we believe it must satisfy the following requirements:
| • | High bandwidth, reliability and full QoS for HD video. Due to the fact that video is a streaming, real-time, visual experience, video quality rapidly degrades with any errors or delays in packet delivery. A high-quality video experience requires reliable first-pass transmission, very low packet error rate, low latency and low jitter. Moreover, video consumes up to 10 times more bandwidth than typical voice and data services and has higher QoS requirements. A connected home with capacity to support multiple high-quality HD video streams requires a high bandwidth network with net throughput in excess of 100 megabits per second. |
| • | Cost-effective deployment. It is important for service providers to leverage the existing installed network infrastructure inside and outside the home to minimize incremental cost and expedite new service deployments. Service providers prefer plug-and-play installation of new services as opposed to having to dispatch a service vehicle to customer premises, often referred to as a “truck roll.” Service providers are focused on saving installation time and minimizing customer service calls, thereby reducing total costs to deliver video services. |
| • | Customer ease of use. Most consumers have little tolerance for complicated consumer devices or service disruptions. Therefore, mainstream consumer adoption requires an easy to use and compelling service offering and plug-and-play service installation with minimal ongoing maintenance. |
| • | Co-existence with other services and devices. Consumers currently subscribe to a broad array of communications services, including traditional voice, cable, satellite or telecommunications carriers television, broadband access and cellular wireless, that are delivered using a number of different technologies. In addition, consumers may use a multitude of computing, communications and consumer electronics devices, such as personal computers, video players, gaming consoles, set-top boxes and televisions. Any successful home networking or access solution must seamlessly co-exist with existing services and devices without any interference or degradation in performance. |
| • | Security. The ability to protect content and consumer privacy is a key element of any successful bundled service offering. Therefore, home networking and access solutions require data encryption and other security mechanisms. |
To address these requirements, service providers are exploring home networking and access technology platforms that enable delivery of new services into and throughout the home. There are a variety of other technologies for delivering video into and throughout the home. Broadband access technology solutions include Data over Cable Service Interface Specifications, or DOCSIS, versions of Digital Subscriber Line, or xDSL, Ethernet and Worldwide Interoperability for Microwave Access, or WiMAX. Home networking technology solutions include Ethernet, HomePNA, HomePlug AV and Wi-Fi. In addition, the International Telecommunication Union, or ITU, is currently developing a new home networking technology known as g.HN. We believe each of these other technologies currently
4
Table of Contents
have limitations in meeting all the requirements necessary to effectively deliver multiple streams of SD, HD and 3D video and other multimedia content into and throughout the home.
Our Solutions
Entropic Communications provides systems solutions comprised of silicon integrated circuits with embedded software as a platform to enable delivery of multiple streams of HD video and other multimedia content into and throughout the home. Our solutions are based upon our ability to combine the following core competencies:
| • | Video communications, networking algorithms and protocols. We have extensive experience in defining and developing physical layer and media access controller protocols as well as networking, routing and security protocols. This includes expertise in advanced equalization, modulation and coding techniques, and contention-free media access controller protocols required for high quality of service video delivery. |
| • | System-on-a-chip design, mixed signal and embedded software capabilities. Our ability to integrate multiple complex functions into a single silicon solution is a result of our significant experience in many disciplines, including embedded system architecture, high-speed very large-scale integration design, microcontrollers, embedded software, packet processing and high-performance mixed signal design. Our mixed signal design expertise includes designing high-performance analog-to-digital and digital-to-analog converters. We also have in-depth experience in packaging design and automated high-volume test development, which allows us to develop cost-effective solutions. |
| • | Radio frequency integrated circuit design expertise. We have extensive experience developing highly-integrated radio frequency integrated circuits. Our broad radio frequency systems and design capability allow us to provide solutions that seamlessly integrate radio frequency functionality within a digital communications platform. Our team has extensive experience with the complex task of integrating digital, high-speed mixed signal and radio frequency integrated circuit designs into complementary metal-oxide semiconductor, or CMOS, systems-on-a-chip. |
| • | Comprehensive communications and radio frequency systems-level capabilities. Our system-level knowledge is the result of significant experience supplying solutions for service provider networks and includes an understanding of the critical elements in coaxial cable and satellite networks, such as service provider equipment and other devices both inside and outside the home. |
| • | Domain expertise in operator-based deployments. We have close working relationships with service providers, their original design manufacturer, or ODM, and OEM partners, and the consumer electronics markets that they serve. Our extensive experience with service provider deployments allows us to deliver rapid time-to-market solutions over multiple generations of customer premises equipment and access equipment. These close working relationships allow us to serve as a “trusted advisor” and contribute to and gain insight into future service provider, ODM and OEM roadmaps. |
Our products include home networking, broadband access, DBS outdoor unit solutions and silicon tuners. Our solutions target applications in all HD video and other multimedia content distribution networks through cable, satellite, telecommunications and terrestrial mediums. Our solutions are currently used in consumer electronic and networking devices, including set-top boxes, broadband routers with embedded wireless home networking (utilizing in-home coaxial cables as a wireless “backbone” to increase the coverage of the wireless home network), optical network terminals, low-noise block converters, multi-room DVRs, residential gateways and Ethernet-to-coax-bridges, and can potentially be used in other devices, such as digital televisions, gaming consoles, OTT set-top-boxes, media servers and network attached storage devices.
5
Table of Contents
Home Networking
Our home networking solutions target a large and rapidly growing market. Our home networking solutions are based on the MoCA standard. We are a founding member of MoCA, which was established in 2004 and includes as its members many major service providers, communications equipment companies, semiconductor manufacturers and consumer electronics companies. MoCA-based products use existing coaxial cable to create a robust internet protocol-based network for easy sharing of HD video and other multimedia content throughout the home. We expect that MoCA-based products will be widely accepted by service providers for digital home entertainment networking.
The implementation of home networking chipsets based on the MoCA specification requires expertise in multiple technical disciplines as well as extensive integration and testing. Any home network technology using the existing coaxial cable must overcome the inherent constraints of such infrastructure. The in-home coaxial cable network was designed to isolate individual cable outlets from each other in order to eliminate potential video signal interference between television sets that reside at different coaxial cable outlets in the home. The successful implementation of MoCA requires integrated circuits that support high wire speed signal transmission and enable low-level signal detection, real-time error correction and recovery. The broad range of expertise required for such implementation includes physical layer and media access controller system engineering, radio frequency integrated circuit and high-speed mixed signal design, complex baseband system-on-a-chip experience and embedded software expertise. In addition, MoCA designs must undergo a formal certification process in order to ensure interoperability and full compliance with the MoCA specification.
We have been working on home networking technologies on which the MoCA specification is based since 2001 and began shipping production quantities of MoCA-compliant chipsets in December 2004. We have started shipping our third generation of MoCA-compliant products. Our MoCA-compliant chipsets are incorporated in the equipment being deployed by Verizon Communications Inc., or Verizon, as part of its FiOS offering. We are currently the exclusive provider of chipsets that enable home networking applications such as multi-room DVR for Verizon’s FiOS offering. Our MoCA-compliant products can be used to support on demand video services, online video streaming services, personal computer-to-television content sharing and multi-room and online gaming. We see a growing need for a highly reliable wired home networking solution to support these new multimedia applications.
We believe that our pioneering role in developing the MoCA standard and our success to date in providing these solutions position us well to continue to be the leading provider of MoCA-compliant connected home entertainment solutions. Our MoCA-compliant home networking solutions provide the following key benefits:
| • | High data rates. In field trials defined and conducted by MoCA, our first generation solutions consistently delivered net throughput in excess of 110 megabits per second in real world conditions with no loss in performance when multiple devices were connected to the network. This performance enables sharing of multiple simultaneous streams of HD video. Our second and third generation solutions continue to have a physical layer rate of up to 270 megabits per second and we have increased net throughput to up to 175 megabits per second. The physical layer rate refers to the maximum speeds of the physical layer of our integrated circuits, while net throughput refers to the rate at which data is actually made available to applications and experienced by users. |
| • | High-quality video experience. Our solutions provide a reliable and high-quality video experience for the consumer that meets service provider requirements. Our solutions operate at frequencies on the coaxial cable that do not interfere with other services or devices. Our physical layer and media access controller provide a very low native packet error rate, |
6
Table of Contents
| without retransmissions, that is essential for service provider-quality HD video. Our media access controller is time coordinated and eliminates collisions in the network. Our solution also provides prioritized QoS and a reserved bandwidth, or parameterized QoS. |
| • | Ease of installation and use. Our solutions leverage the existing coaxial cable infrastructure and do not require expensive new wiring in the home. The plug-and-play installation of our solutions makes it easy for consumers to install and use and allows service providers to rapidly deploy new services. Both of these features enable service providers to minimize costly truck rolls. |
| • | Security and reliability. Our solutions operate on coaxial cable, which is a shielded, wired medium that can be simply isolated from neighboring home networks through both logical and physical means. We support service provider-based conditional access systems and related digital rights management and provide basic encryption for consumer privacy of personal multimedia content. In addition, our solutions create a self-healing network that provides high levels of fault tolerance and reliability. |
| • | Remote upgrade and diagnostics. Our solutions allow service providers to remotely upgrade firmware which gives them the ability to continuously enhance the features of their service offerings without truck rolls. Our solutions’ remote diagnostics tools also allow service providers to remotely diagnose and potentially remediate the home coaxial cable environment. |
Broadband Access
Our broadband access solutions are designed to meet broadband access requirements in areas characterized by fiber optic networks that terminate within one kilometer of a customer premises. In particular, our solutions allow cable service operators with fiber optic deployments to offer broadband triple play services that are competitive with very high-speed digital subscriber line, or VDSL, services offered by telecommunications carriers. We believe that this is a large potential target market for our broadband access products, and we are at an early stage in penetrating these markets.
Our broadband access solutions use coaxial cable infrastructure to deliver “last kilometer” connectivity for high-speed broadband access to single-family homes and multiple dwelling units. They incorporate the same physical layer used in our home networking products and a different network-optimized media access controller technology. Our broadband access solutions offer high performance with net throughput in excess of 100 megabits per second. The point-to-multi-point architecture of our solutions currently supports up to 61 subscribers on a single radio frequency channel. Our solutions can simultaneously support up to four channels over a single coaxial cable. As a result, our solutions are scalable up to 252 subscribers over a single distribution cable, supporting an effective net throughput in excess of 500 megabits per second. Our high-speed broadband access solutions enable service providers to offer bundled triple-play services over their existing services and cable infrastructure.
DBS Outdoor Unit
Our DBS outdoor unit solutions target the large and growing digital broadcast satellite market. In a traditional satellite installation, the ability to select multiple channels simultaneously may require multiple cables from the satellite dish to the set-top box. For example, in order to simultaneously view and record separate programs from the full channel lineup with DVRs in three rooms in a house, a user would need six separate cables from outside the home. Our DBS outdoor unit products can significantly reduce the deployment costs for digital broadcast satellite providers by allowing them to send multiple video streams from individual or multiple satellites into the home over a single cable. This simplified cabling architecture enables digital broadcast satellite providers to deploy set-top
7
Table of Contents
boxes, with multiple tuner capabilities, in multiple rooms and roll out new services without expensive installation and retrofitting while improving aesthetics. We believe that our solutions can improve the competitiveness of digital broadcast satellite services by reducing subscriber acquisition costs, decreasing additional services deployment costs and enabling a more attractive product offering. We are increasing our penetration within this target market.
Our DBS outdoor unit products include band translation switch and channel stacking switch integrated circuits, which are highly complex single-chip radio frequency integrated circuits that integrate multiple independent signal receivers and multiple discrete analog functions onto a single silicon die. Moreover, as many as four channel stacking switch integrated circuits can be linked to provide up to 12 digital broadcast satellite signals on a single cable. Our band translation switch products, which were specifically designed to operate with the DISH Network’s service offerings, are sold only to customers who incorporate them into products deployed by DISH Network. We sell our channel stacking switch products to customers who incorporate them into products deployed by other DBS service providers. We are the pioneers in developing band translation switch and channel stacking switch radio frequency integrated circuits and we have helped to define the standard for satellite signal distribution over a single cable in conjunction with members of the European Committee for Electrotechnical Standardization, or CENELEC. We believe that single cable standardization will lead to more rapid adoption and further expand the market for our products. Our band translation switch products are currently used in outdoor equipment deployed by DISH Network and our channel stacking switch products are currently used in outdoor equipment deployed by DIRECTV and other service providers.
Silicon Tuner
We provide silicon tuner integrated circuits for cable and terrestrial applications that conform to most major digital and analog video broadcast standards, including the U.S. and international broadcasting standards. Many set-top boxes and integrated digital televisions will have multiple tuners to enable advanced features such as DVR, watch-and-record functionality and picture-in-picture viewing, further expanding the market for tuner integrated circuits. Our tuner integrated circuits integrate radio frequency functions, including those performed by a surface acoustic wave, or SAW, filter, with other major discrete components onto a single die while maintaining the performance of traditional non-silicon can tuners. Our highly integrated solutions significantly reduce our customers’ design costs and shrink the tuner footprint in consumer electronics devices. We believe that the performance and small footprint of our tuners will lead to greater adoption of multiple-tuner applications across a broad range of consumer electronics.
8
Table of Contents
Our Products
We offer products that provide solutions for the delivery of HD video and other multimedia content into and throughout the connected home. Our products include home networking, broadband access, DBS outdoor unit and silicon tuner solutions. The chart below lists, for each of our products, its description, target markets and representative target devices or applications:
| Product |
Description |
Target Markets |
Representative Target Devices or Applications | |||
| Home Networking |
||||||
| EN101x |
Coaxial network interface radio frequency |
Networked home entertainment devices |
Multi-room DVR, set-top box, digital television, gaming console, home media server, residential gateway, personal computer and optical network terminal | |||
| EN2xxx |
Coaxial network controller integrated circuit |
Networked home entertainment devices |
Multi-room DVR, set-top box, digital television, gaming console, home media server, residential gateway, personal computer and optical network terminal | |||
| Broadband Access |
||||||
| EN101x |
Coaxial network interface radio frequency |
Broadband access, internet protocol television, and voice over internet protocol |
Optical network terminal, point-of-entry network controller, and access customer premises equipment for single family homes and multiple dwelling units | |||
| EN3011 |
Access network controller integrated circuit |
Broadband access, internet protocol television and voice over internet protocol |
Optical network terminal and point-of-entry network controller for single family homes and multiple dwelling units | |||
| EN3230 |
Access client integrated circuit | Broadband access, internet protocol television and voice over internet protocol |
Access customer premises equipment for single family homes and multiple dwelling units | |||
| DBS Outdoor Unit |
||||||
| RF5000 |
Band translation switch—Dual 2-channel integrated circuit |
U.S. digital broadcast satellite |
Low-noise block converter and multi-switch digital broadcast satellite products for single family homes and multiple dwelling units | |||
| RF510x |
Band translation switch—Triple 2-channel integrated circuit |
U.S. digital broadcast satellite |
Low-noise block converter and multi-switch digital broadcast satellite products for single family homes and multiple dwelling units | |||
| RF520x |
Channel stacking switch— 3-channel integrated circuit |
U.S. digital broadcast satellite |
Low-noise block converter and multi-switch digital broadcast satellite products for single family homes and multiple dwelling units | |||
| RF521x |
Channel stacking switch— 3-channel integrated circuit |
Global digital broadcast satellite |
Low-noise block converter and multi-switch digital broadcast satellite products for single family homes and multiple dwelling units | |||
| Silicon Tuners |
||||||
| RF4000/4400 |
Silicon tuner integrated circuit— Digital terrestrial |
Digital television and recorders |
HDTV, DVR, personal computer and converter boxes | |||
| RF4800 |
Silicon tuner integrated circuit— Digital cable |
Cable set-top boxes and cable-ready television |
DVR, set-top box and cable modem | |||
| EN4020 |
Universal silicon tuner integrated circuit |
Global terrestrial and cable television |
Digital TV, digital set-top box, DVR, DVD recorder, PCTV and cable modem products | |||
9
Table of Contents
Our Technology
We believe that we possess the expertise and experience, breadth and depth of technologies and the skills required to address and compete effectively in our target markets. These capabilities result from our in-depth understanding of the environments in which we operate, knowledge and experience with customer and operator requirements, and extensive communications system understanding.
Home Networking
Our home networking products are based on an innovative platform technology that allows very high-speed and reliable communications between coaxial cable home outlets without the need to modify the home coaxial cable system and without interfering with existing cable television services. This technology has been designed to address the very difficult communications environment of the coaxial cable home network architecture. We have developed an in-depth understanding of the home coaxial cable environment as a result of extensive testing and characterization of both the coaxial cable home network and its components, such as splitters, cables, taps and home entertainment devices including television sets and set-top boxes. These tests provided us with a large database of home coaxial cable network characteristics from which we have developed a set of tools and models that we use to optimize our solutions for this environment.
Coaxial home cabling is designed for “vertical” communications to and from the cable system head-end to the devices connected to coaxial cable outlets in the home, such as television sets and set-top boxes, and has in the past primarily been used for the delivery of cable television, data (cable modem) and, more recently, VoIP, also known as voice over internet protocol services. The in-home coaxial cable architecture has been specifically designed to prevent inter-outlet communications through the use of splitters with high port-to-port isolation. This leads to a highly dispersive physical layer channel, over which it is difficult for typical digital communication systems to operate. The historical inability to address these issues associated with in-home coaxial cable architecture has contributed to the creation of “islands” of digital entertainment within the home.
Our home networking technology is a full-mesh, peer-to-peer network. It overcomes the inherent limitations of home coaxial cable cabling and enables high-speed “horizontal” communications between the outlets in cable homes. This is accomplished through a combination of an adaptive physical layer that optimizes the signal modulation in order to maximize the channel capacity of the in-home coaxial cable network and a unique media access controller protocol that maintains very low latency independent of network load by allocating channel resources without contention or retransmission. The system simplifies installation and maintenance requirements through the use of an ad-hoc network controller functionality, which makes the network self-healing and provides redundancy. Our home networking solution is implemented using an efficient and flexible architecture through an optimized combination of hardware, firmware, software and cost effective radio frequency integrated circuit and system-on-a-chip implementations.
10
Table of Contents
The following graphic demonstrates how our home networking technology enables horizontal communications between home coaxial cable outlets, providing room-to-room connectivity, in addition to the vertical communications path traditionally used in the home coaxial cable system:
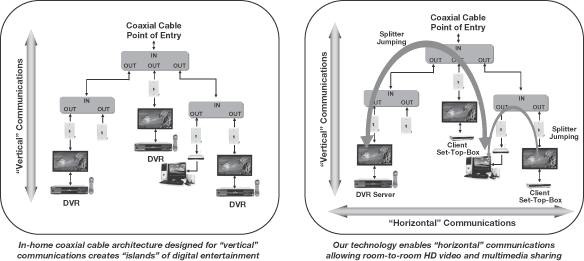
Our home networking technology was selected as the basis for the first generation MoCA standard for home networking over coaxial cable after a selection process that involved an extensive and successful field trial conducted by MoCA. Actual deployment of our product demonstrated that our home networking technology repeatedly achieved a very reliable net throughput in excess of 110 megabits per second at acceptable packet error rate levels to support in-home video distribution at quality levels appropriate for service provider-based pay-television developments. This net throughput allows for the simultaneous delivery of more than four full-rate HDTV channels and other services, such as voice and data.
MoCA has adopted and approved its second generation of specifications, known as MoCA 1.1, which addresses the evolving needs of service providers, for more bandwidth, increased device support and guaranteed QoS. Our EN2210 product, which is the first MoCA 1.1 compliant product commercially available on the market, has been selected as the standard against which other devices will be tested for compliance with the MoCA 1.1 specifications. Our EN2210 and EN2510 solutions deliver a net throughput of up to 175 megabits per second, support up to 16 nodes, provide parameterized QoS and offer security through the use of a shielded, wired connection in combination with state of the art packet-level encryption technology. The components of our EN2210 and EN2510 products are designed to easily and cost-effectively distribute multiple streams of HD quality video entertainment via a highly reliable home network.
Broadband Access
Our broadband access solutions use coaxial cable infrastructure to deliver “last kilometer” connectivity for high-speed broadband access to single-family homes and multiple dwelling units. Our solutions are designed to work on passive coaxial cable networks. This means that a fiber node in the hybrid fiber coaxial, or HFC, network, or the passive optical network, or PON, terminates at the last active device in a coaxial cable wide area network. This termination point is typically within 600 meters of a customer’s premises. For active or passive coaxial cable distribution plants extending up to 1.2 kilometers, cable operators can use a c.LINK-compliant distribution amplifier which increases coverage while delivering the same throughput performance. Our solutions are based on our c.LINK
11
Table of Contents
Access technology and provide efficient communications between an access node, such as a fiber termination in the basement of an apartment building, and the cable outlets in each apartment throughout the building.
The c.LINK Access technology utilizes a single radio frequency channel for communicating in both the “upstream” and “downstream” directions. This allows flexibility in the allocations of bandwidth transmitted in either direction. For example, if a user has a significant amount of information to send from a computer, such as video files or photos loading to a server on the Internet, the c.LINK Access technology can allocate the available bandwidth for the requisite time duration to this “upstream” direction. Also, since the access node device and the client do not transmit and receive simultaneously, the device can share much of the front-end circuitry for both transmit and receive functions, resulting in additional cost savings. Since communications to different nodes in the network and to or from each device are accomplished through the time division of the radio frequency channel, a single device using our c.LINK Access technology at the access node can communicate with as many as 31 clients, resulting in a cost-effective solution for high-speed broadband access. The time division protocol also provides each client a deterministic time slot to access the network. It guarantees true quality of service under any traffic conditions. Our solution is also able to simultaneously support up to four channels over a single coaxial cable. As a result, our solution is scalable up to 252 subscribers over a single distribution cable supporting an effective physical layer rate of over 1 gigabit per second. In addition to scalability, our c.LINK Access technology can operate in a wide range of operating frequencies between 800MHz and 1500MHz.
DBS Outdoor Unit
Our DBS outdoor unit solutions simplify the installation required to support simultaneous reception of multiple channels from multiple satellites over a single cable. This capability is critical to allow a satellite receiver to enable picture-in-picture viewing or to record and watch two or more programs simultaneously, using a single cable. In cable television systems, all the channels are available over the coaxial cable connected to the television set or the cable set-top box. In satellite systems, the number of channels available from multiple satellites typically exceeds the channel carrying capabilities of the connecting cable. The channel stacking switch and band translation switch technologies are designed to select desired satellite channels and re-arrange them for delivery to the indoor set-top box over a single connecting cable. This single cable connects the outdoor unit to either many set-top boxes in and around the home or a media center inside the home, and delivers all the programs being viewed on the various devices inside the home. In a legacy system that does not use the channel stacking switch and band translation switch technologies, additional cables may be required as the numbers of simultaneously viewed satellite channels or the number of simultaneously viewed programs increases.
The implementation of such complex radio frequency processing in an integrated radio frequency integrated circuit requires our unique radio frequency system architecture and design capabilities, including the design of multiple, independently operable, low noise oscillators on a single die, cross-point switching and high isolation techniques realized in both circuit design and advanced floor planning methodologies.
Silicon Tuners
Our radio frequency technology is well suited for the design of low-cost, high-performance, low-power and small footprint, terrestrial and cable single and multiple tuner integrated circuits. Our silicon tuner integrated circuits integrate radio frequency functions, including those performed by a SAW filter, with other major discrete components into a single die while maintaining the performance of traditional non-silicon can tuners. Our system architecture is capable of addressing today’s legacy
12
Table of Contents
standard interfaces to digital demodulation integrated circuits, and at the same time is optimized for future interfaces. This architecture is also ideal for an integrated, multiple tuner, single integrated circuit implementation. Our low noise, high dynamic range front-end and low phase noise design combined with the integrated, tunable, high selectivity radio frequency filters ensures that we can meet the stringent requirements of both digital and analog terrestrial and cable applications. Our fully-integrated, auto-calibrated, analog signal processing and high isolation techniques, including advanced floor-planning methodologies, enable us to design multi-standard, multiple tuners on a single silicon die.
Our new generation of silicon integrated circuit tuners is designed to provide a single hardware platform that is software localized for different markets. This new generation silicon tuner significantly increases the manufacturing and test efficiency for our customers by allowing them to produce a single hardware platform, thus streamlining the procurement and manufacturing process to enable net cost savings.
Customers
We work closely with ODMs, OEMs and leading service providers around the world to increase the adoption of connected home entertainment solutions that incorporate our technology. Service providers that utilize our products are mainly served by leading consumer electronic ODMs and OEMs of connected home entertainment solutions. We have been selected by leading equipment manufacturers such as Actiontec Electronics, Inc., or Actiontec, Motorola, Inc., or Motorola, Wistron NeWeb Corporation, or Wistron, and Jabil Circuit (WUXI) Co., Ltd., or Jabil Circuit, for deployments by leading service providers such as DIRECTV, DISH Network, Time Warner Cable, Cox and Verizon.
We currently rely, and expect to continue to rely, on a limited number of customers for a significant portion of our net revenues. For the year ended December 31, 2009, four customers accounted for 58% of our net revenues, and Motorola and Actiontec accounted for 27% and 16%, respectively, of our net revenues. In addition, we depend on a limited number of service providers that purchase products from our customers that incorporate our products. During the year ended December 31, 2009, products sold to our customers that were incorporated into products purchased by Verizon, DISH Network and DIRECTV accounted for substantially all of our net revenues.
For the year ended December 31, 2009, 92.1% of our net revenues were derived from Asia, 6.0% were derived from North America and 1.9% were derived from Europe. For the year ended December 31, 2008, 95.3% of our net revenues were derived from Asia, 2.6% were derived from Europe and 2.1% were derived from North America. For the year ended December 31, 2007, 93.5% of our net revenues were derived from Asia, 3.7% were derived from Europe and 2.8% were derived from North America. Many of our ODM and OEM customers in Asia incorporate our chipsets into products that they sell to U.S.-based service providers.
Research and Development
We believe our future success depends in part on our ability to introduce enhancements to our existing products and to develop new products for existing and emerging markets. We work closely with service providers and their ODM and OEM partners to understand their requirements and align our research and development efforts to meet their system requirements. We are also actively engaged in advancing the MoCA standard through our research and development efforts. We have assembled a team of highly skilled design engineers with core competencies in complex communications chipsets, radio frequency integrated circuits and embedded application software expertise. Our engineers are responsible for new product development efforts while continuing to enhance existing products and provide critical technical support to our customers.
13
Table of Contents
As of December 31, 2009, we had 178 full-time employees engaged in research and development, including 32 employees in operations. Our research and development expense was $45.2 million, $55.8 million and $35.2 million for the years ended December 31, 2009, 2008 and 2007, respectively.
Manufacturing
We use third-party foundries and assembly and test contractors to manufacture, assemble and test our products. This outsourced manufacturing approach allows us to focus our resources on the design, sales and marketing of our products and avoid the cost associated with owning and operating our own manufacturing facility. Our engineers work closely with foundries and other contractors to increase yields, lower manufacturing costs and improve quality.
We currently outsource the manufacturing of our home networking and our broadband access products principally to Taiwan Semiconductor Manufacturing Company, or TSMC, and the manufacturing of our DBS outdoor unit and silicon tuner products to TowerJazz, the name under which Tower Semiconductor Ltd. and its fully owned U.S. subsidiary Jazz Semiconductor operate. Our products are shipped from such third-party foundries to third-party assembly and testing facilities. Our home networking and our broadband access chipsets are primarily assembled and tested by Amkor Technology, Inc., or Amkor, while our DBS outdoor unit and silicon tuner products are primarily assembled by Amkor and tested by Giga Solution Tech Co., Ltd., or Giga Solution. We do not have a guaranteed level of production capacity from any of our subcontractors’ facilities to produce our products. We have implemented a robust quality management system, designed to assure high levels of product quality for our customers. We have completed and have been awarded ISO 9001:2000 certification. In addition, the independent foundries, assembly and test subcontractors identified above have been awarded ISO 9001:2000 certifications, among others.
Sales and Marketing
We sell our products worldwide through multiple channels, including our direct sales force and our network of domestic and international sales representatives and distributors. We have strategically located our direct sales personnel in the United States, Europe, China, Taiwan, Japan and Korea, where each salesperson has specific end-user market expertise. Our sales directors focus their efforts on leading ODMs and OEMs. We also have field application engineers who provide technical support and assistance to existing and potential customers in designing, testing, qualifying and certifying systems that incorporate our products.
Our sales cycles typically take a significant amount of time to complete, requiring a substantial expenditure of resources before realization of revenue from product sales, if at all. Such long sales cycles mean that service providers’ and ODM and OEM customers’ product selections, once made, are normally difficult to change. As a result, a design loss to one of our competitors may negatively impact our financial results for several years. Similarly, design wins may result in an extended period of revenue opportunities.
Our sales and marketing strategy is to achieve design wins with leading ODMs and OEMs and mass deployment of our solutions with service providers worldwide. This requires us to work extensively and collaboratively with our ODM and OEM customers as well as the service providers who purchase products from them. As a result, we believe that our established relationships allow us faster time to market and will lead to greater proliferation of our solutions.
Our marketing group focuses on our product strategy and management, product development roadmaps, product positioning, new product launch and transition, demand assessment and competitive analysis. The group also ensures that product development activities, product launch,
14
Table of Contents
channel marketing program activities, and ongoing demand and supply planning occur in a well-managed and timely manner in coordination with our development, operations and sales groups as well as our service provider representatives, ODMs and OEMs. Our marketing group also has programs in place to work closely with service providers in the role of a “trusted advisor” for MoCA deployments and initiatives designed to heighten industry awareness of our company, products and technologies, including participating in technical conferences, support of industry initiatives such as MoCA, publication of technical whitepapers and exhibition at trade shows.
Backlog
Our sales are made primarily pursuant to standard purchase orders for delivery of products. Quantities of our products to be delivered and delivery schedules are frequently revised to reflect changes in customers’ needs; customer orders generally can be canceled or rescheduled without significant penalty to the customer. For these reasons, our backlog as of any particular date is not representative of actual sales for any succeeding period, and therefore, we believe that backlog is not necessarily a reliable indicator of future net revenue levels.
Competition
The markets for our products are extremely competitive and are characterized by rapid technological change, evolving industry standards and new demands for features and performance of multimedia content delivery solutions. We believe the principal competitive factors in our markets include the following:
| • | the adoption of our products and technologies by service providers, ODMs and OEMs; |
| • | the performance and cost effectiveness of our products relative to our competitors’ products; |
| • | our ability to deliver high quality and reliable products in large volumes and on a timely basis; |
| • | our ability to build close relationships with service providers, ODMs and OEMs; |
| • | our success in developing and utilizing new technologies to offer products and features previously not available in the marketplace that are technologically superior to those offered by our competitors; |
| • | our ability to identify new and emerging markets and market trends; |
| • | our ability to recruit design and application engineers and other technical personnel; and |
| • | our ability to protect our intellectual property and obtain licenses to the intellectual property of others on commercially reasonable terms. |
We believe that we compete favorably with respect to each of these criteria. However, conditions in our markets could change rapidly and significantly as a result of technological advancements or the adoption of new standards for the delivery of HD video and other multimedia content. In addition, many of our current and potential competitors have longer operating histories, significantly greater resources, stronger name recognition and a larger base of customers than we. This may allow them to respond more quickly than we are able to respond to new or emerging technologies or changes in customer requirements or it may allow them to deliver products that are priced lower than our products or which include features and functions that are not included in our products.
In the market for home networking solutions, we are currently the only high-volume supplier of MoCA-compliant chipsets. In the near-term, therefore, we believe our primary competition in this market will be from companies that offer products based on non-MoCA home networking solutions,
15
Table of Contents
such as Ethernet, HomePNA, Home Plug AV and Wi-Fi, and potentially g.HN if and when the standard for that technology is set by the ITU. However, Broadcom Corporation, or Broadcom, has announced the availability of several multi-format video decoder system-on-a-chip solutions, or SoC, with integrated MoCA functionality and Broadcom’s home networking reference design has achieved MoCA 1.0 and MoCA 1.1 certification from the MoCA certification board. As a result, we expect products from Broadcom will begin to compete with our MoCA home networking chips in the next six months, and we expect other semiconductor manufacturers to compete with us in the manufacture and sale of MoCA-compliant chipsets in the future. In the broadband access market, our broadband access products compete with other, more well-established high-speed wide area networking technologies such as DOCSIS, xDSL and WiMAX. While we believe that our products compete favorably against alternative technologies in these markets, the ultimate competitiveness of our products is highly dependent on, and sensitive to, the particular facts and circumstances of each service provider and its end user customers such as the type of media content being distributed, the environment in which the distribution is taking place, the available network bandwidth and distribution mediums, and the number of devices connected to a network. In the DBS market, our band translation switch and channel stacking switch products face competition from discrete solution providers and other semiconductor manufacturers. In the market for tuners, our silicon tuners face competition from silicon and non-silicon tuners that offer similar functionality. In the transition to and adoption of CMOS technology to deliver silicon tuners, we believe that we currently lead the market in compliance with existing standards and quality of performance. As the integrated silicon tuner market is maturing, the number of competitive players in the market is being reduced and other competitive offerings will become available.
Intellectual Property
Our success and future revenue growth depend, in part, on our ability to develop and protect our intellectual property. We rely primarily on patent, copyright, trademark and trade secret laws, as well as nondisclosure agreements and other methods, to protect our proprietary technologies and processes. However, these measures may not provide meaningful protection for our intellectual property. We review our technological developments to identify features that provide us with a technological or commercial advantage, and we file patent applications when we deem it to be appropriate to protect these features in the United States and internationally in select countries. In addition to developing patented technology internally, we evaluate the acquisition and licensing of intellectual property from third parties that complements our business. As of February 1, 2010, we held 38 issued U.S. patents, one of which was reexamined by the U.S. Patent and Trademark Office and for which a reexamination certificate was issued. In addition, as of February 1, 2010 we had 18 foreign patents granted. Another 179 patent applications were pending in the United States and selected foreign countries as of February 1, 2010, of which nine applications have been allowed, each of which is expected to issue/grant shortly. The term of an issued patent in the United States is at least 20 years from its filing date. The U.S. Patent and Trademark Office provides term extensions for those applications that have been pending for more than three years and for which the duration of the pendency is not the fault of the applicant. Accordingly, many of our patents receive a longer term due to the benefit of such patent term extensions. Taking such patent term extensions into account, the remaining terms of our issued U.S. patents range from 12 to 17 years and the remaining terms for counter-part patents in most foreign jurisdictions are similar, provided we pay the applicable maintenance fees throughout the terms of our issued U.S. and granted foreign patents.
We are the owner of several registered trademarks in the United States and in certain foreign countries, including “Entropic,” “Entropic Communications,” “c.LINK” and “RF Magic.”
In connection with our membership in MoCA, we are required to license any of our patent claims that are essential to implement the MoCA specification to other MoCA members under reasonable
16
Table of Contents
and non-discriminatory terms. Because our core home networking technology is a primary component of the MoCA specification, we are required to license portions of this technology to other MoCA members, including other semiconductor manufacturers that may compete with us in the sale of MoCA-compliant chipsets. However, only essential patent claims necessary to implement the MoCA specification are subject to this requirement. We are not required to license patent claims that are not essential to implement the MoCA specification, nor are we required to license patent claims that are unrelated to the MoCA specification. To date we have not entered into a license of our MoCA-related patent claims, so the terms of any required license have not been established.
In addition to the licensing requirements of standards bodies to which we belong, such as MoCA, in connection with our sales or product development activities we are also sometimes required by our customers or service providers to license to unrelated third parties, on reasonable and non-discriminatory terms, patents and patent applications associated with technologies purchased or used by, or developed with or for, such customers or service providers. We expect that in the future we may be required to agree to such licensing arrangements in order to secure sales, receive development funds or settle disputes.
In addition to our patent rights, we hold significant intellectual property in the form of proprietary trade secrets which we rely on to compete. Designing integrated circuits that comply with the MoCA specification or implement our DBS outdoor unit solutions is technically difficult and requires the application of a wide range of complex engineering disciplines. During the course of creating the technology on which the MoCA standard is based, we developed significant proprietary know-how and techniques for overcoming the engineering challenges involved in designing MoCA-compliant products. We retain such know-how and techniques as proprietary trade secrets that we are not required to license to others as a result of our membership in MoCA. Similarly, we have developed significant proprietary know-how and techniques for implementing our DBS outdoor unit solutions in satellite installations. Consequently, even though we are required to license patent claims that are essential to implement the MoCA standard to other MoCA members and have agreed to license patents and patent applications related to other technologies, such as our DBS outdoor unit solutions, to third parties on reasonable and non-discriminatory terms, we believe that such licensees would need to overcome significant engineering challenges and develop or obtain comparable proprietary know-how and techniques in order to design products that compete successfully against ours.
We generally enter into confidentiality agreements with our employees, consultants and strategic partners, and typically control access to and distribution of our proprietary information. Our employees are generally required to assign their intellectual property rights to us and to treat all technology as our confidential information.
Government Regulation
As a company that provides systems solutions comprised of silicon integrated circuits with embedded software, we are subject to certain government regulations, including U.S. export controls and foreign countries’ import regulations, as well as customs duties and export quotas; regulations relating to the materials that comprise our products (such as the European Union’s Restriction on the Use of Certain Hazardous Substances in Electrical and Electronic Equipment and equivalent regulations adopted by China); and regulations placing constraints on our customers and service providers’ services (such as the Federal Communications Commission’s regulations relating to radio frequency signals emitted in the United States and laws and regulations regarding local cable franchising).
17
Table of Contents
Employees
As of December 31, 2009, we employed a total of 262 people on a full-time basis, including 146 in research and development, 84 in sales, marketing, general and administrative, and 32 in operations. We also engage temporary employees and consultants. Our ability to attract and retain qualified personnel is essential to our continued success. None of our employees is subject to a collective bargaining agreement. We have never experienced a work stoppage, and we consider our relations with our employees to be good.
EXECUTIVE OFFICERS OF THE COMPANY
The following table sets forth information regarding our executive officers as of January 30, 2010.
| Name |
Age | Position | ||
| Patrick Henry |
47 | Chief executive officer and member of our board of directors since September 2003 and president since February 2008. Mr. Henry also served as chairman of our board of directors from July 2007 to January 2009 and as our president from September 2003 to July 2007. From February 2003 to September 2003, Mr. Henry was president and chief executive officer of Pictos Technologies Inc., a developer of digital imaging products which was acquired by ESS Technology. Prior to 2003, Mr. Henry served as chief executive officer of Lincom Wireless, Inc., a chip manufacturing company focused on 802.11 wireless LAN products, vice president and general manager at LSI Logic Corporation, a provider of silicon, systems and software technologies, and senior vice president at C-Cube Microsystems Inc., a developer of digital video integrated circuits. Mr. Henry holds a B.S. in engineering science and mechanics from the Georgia Institute of Technology and an M.B.A. from the University of Southern California. |
18
Table of Contents
| Name |
Age | Position | ||
| David Lyle |
45 | Chief financial officer since June 2007. From August 2005 to June 2007, Mr. Lyle was the chief financial officer at RF Magic, Inc., or RF Magic, our wholly-owned subsidiary which we acquired in June 2007. Prior to working at RF Magic, Mr. Lyle was finance director and controller for the mobile communications business unit at Broadcom, a provider of highly-integrated semiconductor solutions. He joined Broadcom in July 2004 through its acquisition of Zyray Wireless Inc., a WCDMA baseband co-processor company, where he served as chief financial officer beginning in January 2004. Prior to 2004, Mr. Lyle served as chief financial officer at Mobilian Corporation, a wireless data communications semiconductor company, and in various finance roles at Intel Corporation, a semiconductor company, in the microprocessor and networking groups. Mr. Lyle was also previously employed at Intel Capital, the strategic investment arm of Intel Corporation, focusing on mergers and acquisitions primarily for the wireless communications and computing group. Mr. Lyle holds a B.S. in business from the University of Southern California, an M.B.A. from Arizona State University and an M.I.M. from The Thunderbird School of Global Management. |
19
Table of Contents
| Name |
Age | Position | ||
| Tom Lookabaugh |
48 | Chief technology officer since July 2009. Prior to joining Entropic, from March 2006 to June 2009, Dr. Lookabaugh was the chief executive officer of NGNA, LLC, d/b/a PolyCipher, a cable industry joint venture owned by Comcast Corporation, Time Warner Cable, Inc. and Cox Communications, Inc. focused on developing and operating a new technology for authenticating and authorizing cable services known as the Downloadable Conditional Access System for the U.S. cable industry. Prior to PolyCipher, from September 2001 through February 2006, Dr. Lookabaugh was on the faculty at the University of Colorado at Boulder where he was an assistant professor and a faculty director of the Interdisciplinary Telecommunications Program and an assistant professor in the Computer Science Department. Dr. Lookabaugh holds a B.S. in engineering physics from the Colorado School of Mines, three M.S. degrees – in electrical engineering, engineering management and statistics – from Stanford University and a Ph.D. in electrical engineering from Stanford University. |
20
Table of Contents
| Name |
Age | Position | ||
| Vinay Gokhale |
46 | Senior vice president, marketing and business development since January 2009. Prior to joining Entropic, from September 2006 until January 2009, Mr. Gokhale served as vice president, wireless segment at SiRF Technology, Inc., a supplier of products related to Global Positioning Systems. As vice president, wireless segment at SiRF Technology, Mr. Gokhale focused on developing strategic alliances and identifying early-stage technology initiatives. From September 2002 until September 2006, Mr. Gokhale served at Impinj Inc., a developer of ultra high frequency, or UHF, radio frequency identification, or RFID, solutions for both item-level and supply-chain tagging. Initially, Mr. Gokhale served as vice president, marketing, and later as executive vice president, RFID products, during which time Mr. Gokhale was responsible for driving Impinj’s entry into the RFID market and running the operations of Impinj’s RFID business unit. From July 1995 until September 2008, Mr. Gokhale served in various positions of increasing responsibility at Conexant Systems, Inc., or Conexant, a provider of solutions for imaging, video, audio and internet connectivity applications, and held the position of vice president and business unit director for Conexant’s wireless data business unit. Mr. Gokhale holds B.S. and M.S. degrees in electrical engineering from University of California, Irvine and an M.B.A. from Stanford University. |
21
Table of Contents
| Name |
Age | Position | ||
| Bill Bradford |
46 | Senior vice president of worldwide sales since October 2009. Prior to joining Entropic, from May 2009 to October 2009, Mr. Bradford was vice president of marketing and sales at Arkayne Inc., a developer of technology for internet relevancy-based search, automated link exchange and search engine optimization. From May 2008 to July 2009, Mr. Bradford also served as president and chief executive officer of IAD Industries, LLC, a company focused on the acquisition, consolidation and operation of distribution and light manufacturing operations in the infrastructure, aerospace and defense markets. From May 2006 to August 2007, Mr. Bradford was employed at Freescale Semiconductor, Inc., or Freescale, a semiconductor company. Mr. Bradford initially joined Freescale as senior vice president, global sales from May 2006 to January 2007 and later served as Freescale’s senior vice president, Americas sales and marketing and global distribution from January 2007 to August 2007. Prior to Freescale, Mr. Bradford was senior vice president, sales and marketing at ON Semiconductor Corporation, a semiconductor company, from March 2002 to May 2006. Mr. Bradford holds a B.S. in electrical engineering from Rose-Hulman Institute of Technology and a M.S. in management from the University of Alabama. | ||
| Lance Bridges |
48 | Vice president and general counsel since January 2009. Mr. Bridges joined Entropic in May 2007 as vice president of corporate development, general counsel and secretary. Prior to joining Entropic, Mr. Bridges was a partner at Cooley Godward Kronish LLP, where he practiced law since 1991. Mr. Bridges holds a B.A. in economics from the University of California, San Diego, a J.D. from the University of California, Berkeley School of Law (Boalt Hall) and an M.B.A. from the Walter A. Haas School of Business Administration, University of California, Berkeley. | ||
22
Table of Contents
| Name |
Age | Position | ||
| Kurt Noyes |
50 | Vice president, accounting and treasury since May 2009. Mr. Noyes joined Entropic in September 2002 initially as controller, and later became director of finance in October 2003, vice president of finance and administration in December 2005 and vice president, finance and chief accounting officer in May 2007. Prior to joining Entropic, Mr. Noyes served held various management positions with Cargo Technology, Inc., a packing solutions company; Camino Neurocare, Inc., a medical instrument company; Anchor Chips Inc., a semiconductor company acquired by Cypress Semiconductor Corp., a semiconductor company; Provide Commerce, Inc., an e-commerce company; and Applied Micro Circuits Corporation, a semiconductor company. Mr. Noyes holds a B.S. degree in accounting from the University of Wisconsin-La Crosse and an Executive M.B.A. degree from San Diego State University. Mr. Noyes is also a certified public accountant. |
23
Table of Contents
| Item 1A. | Risk Factors |
Investing in our common stock involves a high degree of risk. Before deciding to purchase, hold or sell our common stock, you should carefully consider the risks described below in addition to the other cautionary statements and risks described, and the other information contained, elsewhere in this Annual Report and in our other filings with the SEC. The risks and uncertainties described below are not the only ones we face. Additional risks and uncertainties not presently known to us or that we currently deem immaterial may also affect our business. If any of these known or unknown risks or uncertainties actually occurs, our business, financial condition, results of operations and/or liquidity could be seriously harmed. In that event, the trading price of our common stock could decline and you could lose some or all of your investment.
Risks Related to Our Business
We have had net operating losses for several years, had an accumulated deficit of $242.0 million as of December 31, 2009 and only recently became profitable, and we are unable to predict whether we will remain profitable.
We were incorporated in 2003, did not commence shipping production quantities of our home networking products until December 2004 and only became profitable in the fourth quarter of 2009. Consequently, any predictions about future performance may not be as accurate as they could be if we had a longer history of successfully commercializing our home networking solutions. You should not rely on our operating results for any prior quarterly or annual periods as an indication of our future operating performance.
We have incurred substantial net operating losses during our limited operating history. For the years ended December 31, 2009, 2008 and 2007, we incurred net losses attributable to common stockholders of $13.2 million, $136.4 million and $32.1 million, respectively, and for the three months ended December 31, 2009, we had net income of $1.0 million. Although we became profitable in the fourth quarter of 2009, we have incurred significant net losses since our inception and have never been profitable on an annual basis. As of December 31, 2009, we had an accumulated deficit of $242.0 million. We may incur operating losses in the future as we continue to make significant expenditures related to the development of our products and the expansion of our business, and increase our general and administrative expenses to comply with public company reporting requirements. Our ability to sustain our profitability also depends on our ability to generate and sustain substantially increased revenue and maintain or improve upon our cost control in order to counter any unforeseen difficulties, complications, product delays or other unknown factors that may require additional expenditures, or unforeseen difficulties or costs associated with the integration of acquired assets or businesses. Because of the numerous risks and uncertainties associated with our growth prospects, product development, sales and marketing and other efforts and factors, we are unable to predict whether we will remain profitable or the extent of our profitability or future losses. If we are unable to achieve adequate growth, we may not sustain profitability and our stock price could decline.
We face intense competition and expect competition to increase in the future, with many of our competitors being larger, more established and better capitalized than we are.
The markets for our products are extremely competitive and have been characterized by rapid technological change, evolving industry standards, rapid changes in customer requirements, short product life cycles and frequent introduction of next generation and new products, as well as competing technologies. This competition could make it more difficult for us to sell our products and result in increased pricing pressure, reduced gross profit as a percentage of revenues or gross margins, increased sales and marketing expenses and failure to increase or the loss of market share
24
Table of Contents
or expected market share. Semiconductor products in particular have a history of declining prices driven by customer insistence on lower prices as the cost of production is reduced and as demand falls when competitive products or newer, more advanced products are introduced. If market prices decrease faster than product costs, our gross margins and operating margins would be adversely affected. Moreover, we expect increased competition from other established and emerging companies both domestically and internationally. In particular, we expect to face future competition in the sale of MoCA-compliant chipsets. For example, Broadcom Corporation, or Broadcom, has announced the availability of several multi-format video decoded system-on-a-chip solutions with integrated MoCA functionality and Broadcom’s home networking reference design platform has achieved MoCA 1.0 and MoCA 1.1 certification from the MoCA certification board. Our current and potential competitors may also establish cooperative relationships among themselves or with third parties. If so, competitors or alliances that include our competitors may emerge that could acquire significant market share. We expect these trends to continue as companies attempt to strengthen or maintain their market positions in an evolving industry. In addition, our competitors could develop products or technologies that cause our products and technologies to become non-competitive or obsolete, or cause us to substantially reduce our prices.
Currently, we face competition from a number of established companies that offer products based on competing technologies, such as Data over Cable Service Interface Specifications, versions of Digital Subscriber Line, Ethernet, HomePNA, HomePlug AV, Wi-Fi and WiMAX, also known as Worldwide Interoperability for Microwave Access. We also expect to face competition from companies that offer products based on g.HN technology once the g.HN standard has been set by the ITU. Many of our competitors and potential competitors are substantially larger and have longer operating histories, larger customer bases and significantly greater financial, technical, sales, marketing and other resources than we. Given their capital resources, many of these larger organizations are in a better position to withstand any significant reduction in capital spending by customers or market downturns in the markets in which we compete. Many of our competitors also have broader product lines and market focus, allowing them to bundle their products and services and effectively use other products to subsidize lower prices for those products that compete with ours or to provide integrated product solutions that offer cost advantages to customers. In addition, many of our competitors have been in operation much longer than we and therefore have better name recognition and more long-standing and established relationships with service providers, ODMs and OEMs.
Our ability to compete depends on a number of factors, including:
| • | the adoption of our products and technologies by service providers, ODMs and OEMs; |
| • | the performance and cost effectiveness of our products relative to our competitors’ products; |
| • | our ability to deliver high quality and reliable products in large volumes and on a timely basis; |
| • | our ability to build close relationships with service providers, ODMs and OEMs; |
| • | our success in developing and utilizing new technologies to offer products and features previously not available in the marketplace that are technologically superior to those offered by our competitors; |
| • | our ability to identify new and emerging markets and market trends; |
| • | our ability to recruit design and application engineers and other technical personnel; |
| • | our ability to protect our intellectual property and obtain licenses to the intellectual property of others on commercially reasonable terms; and |
| • | availability of substitute goods offered at a lower price than ours. |
25
Table of Contents
Our inability to address any of these factors effectively, alone or in combination with others, could seriously harm our business, operating results and financial condition.
In addition, consolidation by industry participants or acquisitions of our competitors by our customers or suppliers could result in competitors with increased market share, larger customer bases, greater diversified product offerings and greater technological and marketing expertise, which would allow them to compete more effectively against us. Current and potential competitors may also gain such competitive advantages by establishing financial or strategic relationships with existing or potential customers, suppliers or other third-parties. These new competitors or alliances among competitors could emerge rapidly and acquire significant market share. In addition, some of our suppliers and customers offer or may offer products that compete with our products. Depending on the participants, industry consolidation or the formation of strategic relationships could have a material adverse effect on our business and results of operations by reducing our ability to compete successfully in our current markets and the markets we are seeking to serve.
We depend on a limited number of customers, and ultimately service providers, for a substantial portion of our revenues, and the loss of, or a significant shortfall in, orders from any of these parties could significantly impair our financial condition and results of operations.
We derive a substantial portion of our revenues from a limited number of customers. For example, during the twelve months ended December 31, 2009, four customers accounted for 58% of our net revenues, and Motorola and Actiontec accounted for 27% and 16%, respectively, of our net revenues. Our inability to generate anticipated revenues from our key existing or targeted customers, or a significant shortfall in sales to these customers would significantly reduce our revenues and adversely affect our operating results. Our operating results in the foreseeable future will continue to depend on our ability to effect sales to existing and other large customers.
In addition, we depend on a limited number of service providers that purchase products from our customers that incorporate our products. To date, only a limited number of major service providers, such as Verizon, DIRECTV, Time Warner Cable Inc., or Time Warner, Cox Communications, Inc., or Cox, and Bright House Networks LLC, or BHN, have publicly announced their intentions to use the MoCA standard for home networking. We also primarily rely on two major service providers, DISH Network and DIRECTV, to deploy products using our digital broadcast satellite outdoor unit solutions. During the twelve months ended December 31, 2009 and 2008, products sold to our customers that were incorporated into products purchased by Verizon, DISH Network and DIRECTV accounted for substantially all of our net revenues. If these service providers, or other service providers that elect to use our products, reduce or eliminate purchases of our customers’ products which incorporate our products, this would significantly reduce our revenues and adversely affect our operating results. Due to the continued weakness in the current economic outlook, some service providers may reduce or delay spending or taking delivery of our customers’ products which incorporate our products to respond to changing economic conditions or anticipated changes in their businesses. This may lead to an inventory build up by our customers who may, in turn, reschedule taking delivery of our products or wait to clear their existing inventory before ordering more products from us, which, in turn, may adversely affect our operating results. Our operating results in the foreseeable future will continue to depend on a limited number of service providers’ demand for products which incorporate our products.
We may have conflicts with our customers or the service providers that purchase products from our customers that incorporate our products. Any such conflict could result in events that have a negative impact on our business, including:
| • | reduced purchases of our products or our customers’ products that incorporate them; |
| • | uncertainty regarding ownership of intellectual property rights; |
26
Table of Contents
| • | litigation or the threat of litigation; or |
| • | settlements or other business arrangements imposing obligations on us or restrictions on our business, including obligations to license intellectual property rights or make cash payments. |
If we fail to develop and introduce new or enhanced products on a timely basis, our ability to attract and retain customers could be impaired, and our competitive position may be harmed.
To compete successfully, we must design, develop, market and sell new or enhanced products that provide increasingly higher levels of performance and reliability and meet the cost expectations of our customers. The introduction of new products by our competitors, the market acceptance of products based on new or alternative technologies, or the emergence of new industry standards could render our existing or future products obsolete. Our failure to anticipate or timely develop new or enhanced products or technologies in response to technological shifts could result in decreased revenues and an increase in design wins by our competitors. In particular, we may experience difficulties with product design, manufacturing, marketing or certification that could delay or prevent our development, introduction or marketing of new or enhanced products. If we fail to introduce new or enhanced products that meet the needs of our customers or penetrate new markets in a timely fashion, we will lose market share and our operating results will be adversely affected.
Our results could be adversely affected if our customers or the service providers who purchase their products are unable to successfully compete in their respective markets.
Our customers and the service providers that purchase products from our customers face significant competition from their competitors. We rely on these customers’ and service providers’ ability to develop products and/or services that meet the needs of their customers in terms of functionality, performance, availability and price. If these customers and service providers do not successfully compete, they may lose market share, which would negatively impact the demand for our products. For example, for our home networking products, there is intense competition among service providers to deliver video and other multimedia content into and throughout the home. For the sale of our home networking products, we are currently dependent on Verizon’s ability to compete in the market for the delivery of HD video and other multimedia content. Therefore, factors influencing Verizon’s ability to compete in this market, such as laws and regulations regarding local cable franchising, could have an adverse effect on our current ability to sell home networking products. In addition, our digital broadcast satellite outdoor unit products are primarily supplied to digital broadcast satellite service providers by our ODM and OEM customers. Digital broadcast satellite service providers are facing significant competition from telecommunications carriers and cable multiple service operators as they compete for customers in terms of video, voice and data services. Moreover, ODMs and OEMs who market satellite set-top boxes using our silicon tuners are competing with a variety of internet protocol-based video delivery solutions, including versions of Digital Subscriber Line technology and certain fiber optic-based solutions. Many of these technologies compete effectively with satellite set-top boxes and do not require tuners such as the ones we sell. If our customers and the service providers who purchase products from our customers that incorporate our products do not successfully compete, they may lose market share, which would reduce their demand for our products.
If the market for HD video and other multimedia content delivery solutions based on the MoCA standard does not develop as we anticipate, our revenues may decline or fail to grow, which would adversely affect our operating results.
We derive, and expect to continue to derive for the foreseeable future, a significant portion of our revenues from sales of our home networking products based on the MoCA standard. The market for such multimedia content delivery solutions based on the MoCA standard is relatively new, still
27
Table of Contents
evolving and difficult to predict. For example, while service providers are currently deploying products based on the MoCA 1.0 and MoCA 1.1 standard, MoCA is currently working on a new version of the standard, MoCA 2.0. It is uncertain when products based on the MoCA 2.0 standard will be available or how quickly service providers will begin to deploy such products. It is uncertain whether the MoCA standard will achieve and sustain high levels of demand and market acceptance. We believe our primary competition in this market currently comes from companies that offer products based on non-MoCA home networking solutions, such as Ethernet, HomePNA, Home Plug AV, Wi-Fi and WiMedia, but we expect products from Broadcom will begin to compete with our MoCA home networking chips in the next six months and we expect other semiconductor manufacturers to compete with us in the manufacture and sale of MoCA-compliant chipsets in the future. Moreover, deployment of services or electronic devices utilizing MoCA-based solutions may be delayed or slower than we anticipate. If the market for MoCA-based solutions does not continue to develop or develops more slowly than we expect, or if we make errors in predicting adoption and deployment rates for these solutions, our revenues may be significantly adversely affected.
Our success will depend to a substantial extent on the willingness of service providers, ODMs and OEMs to adopt the MoCA standard for multimedia content delivery. To date, only a limited number of major service providers, such as Verizon, DIRECTV, Time Warner, Cox and BHN had publicly announced their intention to use the MoCA standard for home networking. Some service providers, ODMs and OEMs have adopted and others may adopt multimedia content delivery solutions that rely on technologies other than the MoCA standard or may choose to wait for the introduction of products and technologies that serve as a replacement or substitute for, or represent an improvement over, MoCA-based solutions. It is critical to our success that additional service providers, including telecommunications carriers, digital broadcast satellite service providers and cable operators, adopt the MoCA standard for home networking.
Even if service providers, ODMs and OEMs adopt multimedia content delivery solutions based on the MoCA standard, we may not compete successfully in the market for MoCA-compliant chipsets.
As a member of MoCA, we are required to license any of our patent claims that are essential to implement the MoCA specifications to other MoCA members on reasonable and non-discriminatory terms. As a result, we are required to license some of our important intellectual property to other MoCA members, including other semiconductor manufacturers that may compete with us in the sale of MoCA-compliant chipsets. If we are unable to differentiate our MoCA-compliant chipsets from other MoCA-compliant chipsets by offering superior pricing and features outside MoCA specifications, we may not be able to compete effectively in the market for such chipsets. Moreover, although we are currently and actively involved in the ongoing development of the MoCA standard, we cannot guarantee that future MoCA specifications will incorporate technologies or product features we are developing or that our products will be compatible with future MoCA specifications. As additional members, including our competitors, continue to join MoCA, they and existing members may exert greater influence on MoCA and the development of the MoCA standard in a manner that is adverse to our interests. If our home networking products fail to comply with future MoCA specifications, the demand for these products could be severely reduced.
The semiconductor and communications industries have historically experienced cyclical behavior and prolonged downturns, which could impact our operating results, financial condition and cash flows.
The semiconductor and communications industries, which have historically exhibited cyclical behavior, are both currently experiencing industry downturns and are likely to experience recessionary periods in the future. The economic turmoil that arose in the credit markets in 2008 and
28
Table of Contents
2009 caused a deterioration in global economic conditions and has had an adverse effect on the ability of businesses to obtain short and long term funding for working capital. As a result, even as the economy recovers, some service providers, OEMs and ODMs may slow down their research and development activities, cancel or delay new product development, reduce their inventories and/or take a cautious approach to acquiring products, which may lead to a significant negative impact to our business. Because a significant portion of our expenses is fixed in the near term or is incurred in advance of anticipated sales, we may not be able to decrease our expenses rapidly enough to offset any unanticipated shortfall in revenues during industry downturns, which could adversely affect our operating results.
Even during periods of increased demand and industry growth, we may experience production constraints which could limit our ability to produce sufficient quantities of our products to meet the increased demand. We may also have difficulty in obtaining sufficient manufacturing, assembly and test resources from our manufacturers. Any factor adversely affecting either the semiconductor or communications industry in general, or the particular segments of any of these industries that our products target, may adversely affect our ability to generate revenue and could negatively impact our operating results, cash flow and financial condition. In addition, our operating results may also fluctuate significantly from period to period as we adjust our inventory and production requirements to meet the changing demands of our customers during this period and in the future, which may increase the volatility of the price of our stock.
Our operating results have fluctuated significantly in the past and we expect them to continue to fluctuate in the future, which could lead to volatility in the price of our common stock.
Our operating results have fluctuated in the past and are likely to continue to fluctuate, on an annual and a quarterly basis, as a result of a number of factors, many of which are outside of our control. These fluctuations in our operating results may cause our stock price to fluctuate as well. The primary factors that are likely to affect our quarterly and annual operating results include:
| • | changes in demand for our products or those offered by service providers and our customers; |
| • | the timing and amount of orders, especially from significant service providers and customers; |
| • | the seasonal nature of the sales of products that incorporate our products by certain service providers which may affect the timing of orders for our products; |
| • | the level and timing of capital spending of service providers, both in the United States and in international markets; |
| • | competitive market conditions, including pricing actions by us or our competitors; |
| • | adverse market perception of MoCA-compliant products; |
| • | our unpredictable and lengthy sales cycles; |
| • | the mix of products and product configurations sold; |
| • | our ability to successfully define, design and release new products on a timely basis that meet customers’ or service providers’ needs; |
| • | costs related to acquisitions of complementary products, technologies or businesses; |
| • | new product introductions and enhancements, or the market anticipation of new products and enhancements, by us or our competitors; |
| • | the timing of revenue recognition on sales arrangements, which may include multiple deliverables and the effect of our use of inventory “hubbing” arrangements; |
29
Table of Contents
| • | unexpected changes in our operating expenses; |
| • | general economic conditions (including the current industry and economic downturn) and political conditions in the countries where we operate or our products are sold or used; |
| • | our ability to attain and maintain production volumes and quality levels for our products, including adequate allocation of wafer, assembly and test capacity for our products by our subcontractors; |
| • | our customers’ ability to obtain other components needed to manufacture their products; |
| • | the cost and availability of components and raw materials used in our products, including, without limitation, increases in the price of gold; |
| • | changes in manufacturing costs, including wafer, test and assembly costs, manufacturing yields and product quality and reliability; |
| • | productivity of our sales and marketing force; |
| • | our inability to reduce operating expenses in a particular quarter if revenues for that quarter fall below expectations; |
| • | future accounting pronouncements and changes in accounting policies; |
| • | costs associated with litigation; and |
| • | changes in domestic and international regulatory environments. |
Unfavorable changes in any of the above factors, many of which are beyond our control, could significantly harm our business and results of operations. You should not rely on the results of prior periods as an indication of our future performance.
Our operating results may be harmed if our 2009 restructuring plan does not achieve the anticipated results or causes undesirable consequences.
In 2009, we implemented a restructuring plan which resulted in us reducing our workforce by a total of 55 individuals. Even though the reduction in our work force was announced more than nine months ago, these restructuring plans may yield unintended consequences, such as attrition beyond our intended reduction in workforce and reduced employee morale, which may cause our employees who were not affected by the reduction in workforce to seek alternate employment. Additional attrition could impede our ability to meet our operational goals, which could have a material adverse effect on our financial performance. In addition, as a result of the reductions in our workforce, we face an increased risk of employment litigation. Furthermore, employees whose positions were eliminated in connection with these restructuring plans may have sought, or seek, future employment with our competitors. Although all our employees are required to sign a confidentiality agreement with us at the time of hire, we cannot assure you that the confidential nature of our proprietary information will be maintained in the course of such future employment. We cannot assure you that we will not undertake additional restructuring activities, that any of our restructuring efforts will be successful, or that we will be able to realize the cost savings and other anticipated benefits from our previous or any future restructuring plans. In addition, if we continue to reduce our workforce, it may adversely impact our ability to respond rapidly to any new growth or revenue opportunities.
Adverse U.S. and international economic conditions have affected and may continue to adversely affect our revenues, margins and profitability.
Since September 2008, the credit markets and the financial services industry have been experiencing a period of unprecedented turmoil and upheaval characterized by the bankruptcy, failure, collapse or sale of various financial institutions and an unprecedented level of intervention
30
Table of Contents
from the U.S. federal government. These events, together with the current adverse economic conditions facing the broader economy and, in particular, the semiconductor and communications industries, have adversely affected, and may continue to adversely affect, our business as service providers cut back or delay deployments that include our products and to the extent that consumers decrease their discretionary spending for enhanced video offerings from service providers, which may in turn lead to cautious or reduced spending by service providers and, in turn, may lead to a decrease in orders for our products, thereby adversely affecting our operating results. Our operating results may also be adversely affected if the State of California adopts laws to suspend net operating loss deductions as it has done in the past in response to the sharp decrease in tax revenue collections caused by the current adverse economic conditions.
We may also experience adverse conditions in our cost base due to changes in foreign currency exchange rates that reduce the purchasing power of the U.S. dollar, increase research and development expenses and other factors. These conditions may harm our margins and prevent us from achieving or sustaining profitability if we are unable to increase the selling prices of our products or reduce our costs sufficiently to offset the effects of effective increases in our costs. Our attempts to offset the effects of cost increase through controlling our expenses, passing cost increases on to our customers or any other method may not succeed.
The success of our digital broadcast satellite outdoor unit products depends on the demand for our products within the satellite digital television market and the growth of this overall market.
In addition to our MoCA home networking products, we also derive a significant portion of our revenues from sales of our digital broadcast satellite outdoor unit products into markets served by digital broadcast satellite providers and their ODM and OEM partners. The digital broadcast satellite market may not grow in the future as anticipated or a significant market slowdown may occur, which would in turn reduce the demand for applications or devices, such as set-top boxes and low-noise block converters that rely on our digital broadcast satellite outdoor unit products. Because of the intense competition in the satellite, terrestrial and cable digital television markets, the unproven technology of many products addressing these markets and the short product life cycles of many consumer applications or devices, it is difficult to predict the potential size and future growth rate of the markets for our digital broadcast satellite outdoor unit products. If the demand for our digital broadcast satellite outdoor unit products is not as great as we expect, or if we are unable to produce competitive products to meet that demand, our revenues could be adversely affected.
Market-specific risks affecting the digital television, digital television set-top boxes and digital television peripheral markets could impair our ability to successfully sell our silicon tuners.
The market for digital television applications in digital televisions, digital television set-top boxes and digital television peripherals is characterized by certain market-specific risks, any of which may adversely affect our ability to sell our silicon tuners. For example, sellers of module tuners that offer similar or better functionality than our silicon tuner solutions may dramatically lower their prices and become more competitive than we in the tuner market. In addition, our silicon tuners may not meet the specifications or have the feature sets desired by our customers or may not be architecturally compatible with other components in the customers’ designs. Our efforts to penetrate the digital television market, in particular, will depend on our ability to overcome these and other challenges. To the extent our efforts are adversely affected by any of these risks or are otherwise unsuccessful, the demand for our silicon tuner products may not develop as anticipated or decline which would adversely affect our revenues, financial condition and results of operations.
31
Table of Contents
The success of our silicon tuners is highly dependent on our relationships with demodulator manufacturers.
Our silicon tuners are designed to be interoperable with various specific demodulator integrated circuit products that are designed and manufactured by other companies. Historically, we have relied on strategic relationships with various demodulator manufacturers to enable both parties to offer an interoperable tuner/demodulator solution to mutual end customers. Although we work in concert with third-party demodulator manufacturers to complete highly functional reference designs, we have no control over their future product plans and product roadmaps and could be effectively designed out of future customer applications by the refusal of such a demodulator manufacturer to continue to support our products. Likewise, our ability to acquire new customers is dependent on the cooperation of third-party demodulator manufacturers. If such third-party manufacturers decide to partner with one of our competitors or to provide their own tuner solutions, we would effectively be prevented from selling our products to potential new customers. Furthermore, our dependence on these third-party demodulator manufacturers often limits our strategic direction. If we were to design products that were competitive with any of such demodulator manufacturers, they may choose to stop working with us.
If any of the current or prospective demodulator manufacturers with whom we have or intend to have relationships were to stop working with us in favor of other tuner manufacturers or in favor of deploying their own tuner products, we would be effectively designed out of current and potential customers’ products and the demand for our silicon tuners would be substantially reduced.
The market for our broadband access products is limited and these products may not be widely adopted.
Our broadband access products are designed to meet broadband access requirements in areas characterized by fiber optic network deployments that terminate within one kilometer of customer premises. We believe the primary geographic markets for our broadband access products are currently in certain Asian countries such as China, Japan and Korea, and parts of Europe where there are many multi-dwelling units and fiber optic networks that extend to or near a customer premises. We do not expect to generate significant revenues from sales of our broadband access products in North America, which is generally characterized by low-density housing, or in developing nations which do not generally have extensive fiber optic networks. To the extent our efforts to sell our broadband access products into currently targeted markets are unsuccessful, the demand for these products may not develop as anticipated or may decline, either of which could adversely affect our future revenues. Moreover, these markets have a large number of service providers and varying regulatory standards, both of which may delay any widespread adoption of our products and increase the time during which competing technologies could be introduced and displace our products.
In addition, if areas characterized by fiber optic networks that terminate within one kilometer of customer premises do not continue to grow, or we are unable to develop broadband access products that are competitive outside of these areas, the demand for our broadband access products may not grow and our revenues may be limited. Even if the markets in which our broadband access products are targeted continue to grow or we are able to serve additional markets, customers and service providers may not adopt our technology. There are a growing number of competing technologies for delivering high-speed broadband access from the service provider’s network to the customer’s premises. For example, our broadband access products face competition from products using DOCSIS, versions of DSL, Ethernet and WiMAX-based solutions. Moreover, there are many other access technologies that are currently in development including some low cost proprietary solutions. If service providers adopt competing products or technologies, the demand for our broadband access products will decline and we may not be able to generate significant revenues from these products.
32
Table of Contents
We intend to expand our operations and increase our expenditures in an effort to grow our business. If we are not able to manage this expansion and growth, or if our business does not grow as we expect, we may not be able to realize a return on the resources we devote to expansion.
We have grown significantly in a short period of time, in part, as a result of our various acquisitions, including our 2007 acquisition of RF Magic. For example, our headcount increased from 83 full-time employees as of December 31, 2006 to 262 as of December 31, 2009. We anticipate that we will continue to expand our infrastructure and grow our headcount to accommodate changes in our research and development strategy and achieve planned expansion of our product offerings, projected increases in our customer base and anticipated growth in the number of our product deployments. The rapid change in the size of our organization has placed, and will continue to place, a significant strain on our administrative and operational infrastructure. Our success in managing our operations and changes in size will be dependent upon our ability to:
| • | enhance our operational, financial and management controls, reporting systems and procedures; |
| • | expand our facilities and equipment and develop new sources of supply for the manufacture, assembly and testing of our semiconductor products; |
| • | successfully hire, train, motivate and productively deploy additional employees, including technical personnel; and |
| • | expand our international resources. |
Our inability to address effectively any of these factors, alone or in combination with others, could seriously harm our ability to execute our business strategy.
Further, we intend to continue to grow our business by entering new markets, developing new product offerings and pursuing new customers. If we fail to timely or efficiently expand operational and financial systems in connection with such growth or if we fail to implement or maintain effective internal controls and procedures, resulting operating inefficiencies could increase costs and expenses more than we planned and might cause us to lose the ability to take advantage of market opportunities, enhance existing products, develop new products, satisfy customer requirements, respond to competitive pressures, control our inventory or otherwise execute our business plan. Failure to implement or maintain such controls and procedures could also impact our ability to produce timely and accurate financial statements. Additionally, if we increase our operating expenses in anticipation of the growth of our business and such growth does not meet our expectations, our financial results likely would be negatively impacted.
Any acquisition, strategic relationship, joint venture or investment could disrupt our business and harm our financial condition.
We actively pursue acquisitions, strategic relationships, joint ventures, collaborations or investments that we believe may allow us to complement our growth strategy, increase market share in our current markets or expand into adjacent markets, or broaden our technology and intellectual property. Such transactions may be complex, time consuming and expensive, and may present numerous challenges and risks including:
| • | difficulties in assimilating any acquired workforce and merging operations; |
| • | attrition and the loss of key personnel; |
| • | an acquired company, asset or technology, or a strategic collaboration or licensed asset or technology not furthering our business strategy as anticipated; |
33
Table of Contents
| • | our overpayment for a company, asset or technology or changes in the economic or market conditions or assumptions underlying our decision to make an acquisition; |
| • | difficulties entering and competing in new product or geographic markets and increased competition, including price competition; |
| • | significant problems or liabilities, including increased intellectual property and employment related litigation exposure, associated with acquired businesses, assets or technologies; |
| • | in connection with any such transaction, the need to use a significant portion of our available cash, issue additional equity securities that would dilute the then-current stockholders’ percentage ownership or incur substantial debt or contingent liabilities; |
| • | requirements to devote substantial managerial and engineering resources to any strategic relationship, joint venture or collaboration, which could detract from our other efforts or significantly increase our costs; |
| • | lack of control over the actions of our business partners in any strategic relationship, joint venture or collaboration, which could significantly delay the introduction of planned products or otherwise make it difficult or impossible to realize the expected benefits of such relationship; and |
| • | requirements to record substantial charges and amortization expense related to certain intangible assets, deferred stock compensation and other items. |
Any one of these challenges or risks could impair our ability to realize any benefit from our acquisitions, strategic relationships, joint ventures or investments after we have expended resources on them.
In addition, from time to time we may enter into negotiations for acquisitions, relationships, joint ventures or investments that are not ultimately consummated. These negotiations could result in significant diversion of management time, as well as substantial out-of-pocket costs.
We cannot forecast the number, timing or size of future acquisitions, strategic relationships, joint ventures or investments, or the effect that any such transactions might have on our operating or financial results. Any such transaction could disrupt our business and harm our operating results and financial condition.
We may not realize the anticipated financial and strategic benefits from the businesses we have acquired or be able to successfully integrate such businesses with ours.
We will need to overcome significant challenges in order to realize the benefits or synergies from the acquisitions we have completed to date. These challenges include the following:
| • | integrating businesses, operations and technologies; |
| • | retaining and assimilating key personnel; |
| • | retaining existing customers and attracting additional customers; |
| • | creating uniform standards, controls, procedures, policies and information systems; |
| • | meeting the challenges inherent in efficiently managing an increased number of employees, including some at geographic locations distant from our headquarters and senior management; and |
| • | implementing appropriate systems, policies, benefits and compliance programs. |
34
Table of Contents
Integration in particular may involve considerable risks and may not be successful. These risks include the following:
| • | the potential disruption of our ongoing business and distraction of our management; |
| • | the potential strain on our financial and managerial controls and reporting systems and procedures; |
| • | unanticipated expenses and potential delays related to integration of the operations, technology and other resources of the acquired companies; |
| • | the impairment of relationships with employees, suppliers and customers; and |
| • | potential unknown or contingent liabilities. |
The inability to integrate successfully any businesses we acquire, or any significant delay in achieving integration, could delay introduction of new products and require expenditure of additional resources to achieve integration. For example, although we recorded significant amounts of goodwill and other intangible assets in connection with the acquisitions we completed in 2007 and 2008, as a result of the recent industry and economic turmoil and its effects on our market value and business outlook, we had to reduce the carrying amount of all of these long-lived assets and, as of December 31, 2009, we have recorded an aggregate impairment charge of $113.4 million against our goodwill and intangible assets carrying value related to these acquisitions.
Investors should not rely on attempts to combine our historical financial results with those of any of our acquired businesses as separate operating entities to predict our future results of operations as a combined entity.
The average selling prices of our products have historically decreased over time and will likely do so in the future, which may reduce our revenues and gross margin.
Our products and products sold by other companies in our industry have historically experienced a decrease in average selling prices over time. We anticipate that the average selling prices of our products will continue to decrease in the future in response to competitive pricing pressures, increased sales discounts and new product introductions by our competitors. For example, we expect that other chipset manufacturers who are members of MoCA will produce competing chipsets and create pricing pressure for such products and Broadcom has announced the availability of competing chipsets for certain applications. Our future operating results may be harmed due to the decrease of our average selling prices. To maintain our current gross margins or increase our gross margins in the future, we must develop and introduce on a timely basis new products and product enhancements, continually reduce our product costs and manage product transitions in a timely and cost-effective manner. Our failure to do so would likely cause our revenues and gross margins to decline, which could have a material adverse effect on our operating results and cause the value of our common stock to decline.
Our product development efforts are time-consuming, require substantial research and development expenditures and may not generate an acceptable return.
Our product development efforts require substantial research and development expense. Our research and development expense was $45.2 million and $55.8 million for the year ended December 31, 2009 and 2008, respectively. There can be no assurance that we will achieve an acceptable return on our research and development efforts.
The development of our products is also highly complex. Due to the relatively small size of our product design teams, our research and development efforts in our core technologies may lag behind those of our competitors, some of whom have substantially greater financial and technical resources.
35
Table of Contents
We occasionally have experienced delays in completing the development and introduction of new products and product enhancements, and we could experience delays in the future. Unanticipated problems in developing products could also divert substantial engineering resources, which may impair our ability to develop new products and enhancements and could substantially increase our costs. Furthermore, we may expend significant amounts on a research and development program that may not ultimately result in a commercially successful product, and we have in the past terminated ongoing research and development programs before they could be brought to successful conclusions. As a result of these and other factors, we may be unable to develop and introduce new products successfully and in a cost-effective and timely manner, and any new products we develop and offer may never achieve market acceptance. Any failure to develop future products that would enjoy commercial success would have a material adverse effect on our business, financial condition and results of operations.
Our products typically have lengthy sales cycles, which may cause our operating results to fluctuate, and a service provider, ODM or OEM customer may decide to cancel or change its service or product plans, which could cause us to lose anticipated sales.
Our products typically have lengthy sales cycles. A service provider must first evaluate our products. This initial evaluation period can vary considerably based on the service provider and product being evaluated, and could take a significant amount of time to complete. Products incorporating new technologies generally require longer periods for evaluation. After this initial evaluation period, if a service provider decides to adopt our products, that service provider and the applicable ODM or OEM customers will need to further test and evaluate our products prior to completing the design of the equipment that will incorporate our products. Additional time is needed to begin volume production of equipment that incorporates our products. Due to these lengthy sales cycles, we may experience significant delays from the time we incur research and development and sales expenses until the time, if ever, that we generate sales from these products. The delays inherent in these lengthy sales cycles increase the risk that a customer will decide to cancel or change its product plans. From time to time, we have experienced changes, delays and cancellations in the purchase plans of our customers. A cancellation or change in plans by a service provider, ODM or OEM customer could prevent us from realizing anticipated sales. In addition, our anticipated sales could be lost or substantially reduced if a significant service provider, ODM or OEM customer reduces or delays orders during our sales cycle or chooses not to release equipment that contains our products. We may invest significant time and effort in marketing to a particular customer that does not ultimately result in a sale to that customer. As a result of these lengthy and uncertain sales cycles for our products, it is difficult for us to predict if or when our customers may purchase products in volume from us, and our operating results may vary significantly from quarter to quarter, which may negatively affect our operating results for any given quarter.
Fluctuations in the mix of products we sell may adversely affect our financial results.
Because of differences in selling prices and manufacturing costs among our products, the mix and types of products sold affect the average selling price of our products and have a substantial impact on our revenues and profit margins. To the extent our sales mix shifts toward increased sales of our lower-margin products, our overall gross margins will be negatively affected. Fluctuations in the mix and types of our products sold may also affect the extent to which we are able to recover our costs and expenditures that are associated with a particular product, and as a result can negatively impact our financial results.
36
Table of Contents
If we do not complete our design-in activities before a customer’s design window closes, we will lose the design opportunity, which could adversely affect our future sales and revenues and harm our customer relationships.
The timing of our design-in activities with key customers and prospective customers may not align with their open design windows, which may or may not be known to us, making design win predictions more difficult. If we miss a particular customer’s design window, we may be forced to wait an entire year or even longer for the next opportunity to compete for the customer’s next design. The loss of a particular design opportunity could eliminate or substantially delay revenues from certain target customers and markets, which could have a material adverse effect on our results of operations and future prospects as well as our customer relationships.
Our products must interoperate with many software applications and hardware found in service providers’ networks and other devices in the home, and if they do not interoperate properly, our business would be harmed.
Our products must interoperate with service providers’ networks and other devices in the home, which often have varied and complex specifications, utilize multiple protocol standards, software applications and products from multiple vendors, and contain multiple generations of products that have been added over time. As a result, we must continually ensure that our products interoperate properly with existing and planned future networks. To meet these requirements, we must undertake development efforts that involve significant expense and the dedication of substantial employee resources. We may not accomplish these development efforts quickly or cost-effectively, if at all. If we fail to maintain or anticipate compatibility with products, software or equipment found in our customers’ networks, we may face substantially reduced demand for our products, which would adversely affect our business, operating results and financial condition.
From time to time, we may enter into collaborations or interoperability arrangements with equipment and software vendors providing for the use, integration or interoperability of their technology with our products. These arrangements would give us access to and enable interoperability with various products or technologies in the connected home entertainment market. If these relationships fail to achieve their goals, we would have to devote substantially more resources to the development of alternative products and the support of our existing products, or the addressable market for our products may become limited. In many cases, these parties are either companies that we compete with directly in other areas or companies that have extensive relationships with our existing and potential customers and may have influence over the purchasing decisions of these customers. A number of our competitors have stronger relationships than we do with some of our existing and potential customers and, as a result, our ability to have successful arrangements with these companies may be harmed. Our failure to establish or maintain key relationships with third-party equipment and software vendors may harm our ability to successfully sell and market our products. We are currently devoting significant resources to the development of these relationships. Our operating results could be adversely affected if these efforts do not result in the revenues necessary to offset these investments.
In addition, if we find errors in the software or hardware used in service providers’ networks or problematic network configurations or settings we may have to modify our products so that they will interoperate with service providers’ networks. This could cause longer installation times for our products and order cancellations, either of which would adversely affect our business, operating results and financial condition.
37
Table of Contents
Our customers may cancel their orders, change production quantities or delay production, and if we fail to forecast demand for our products accurately, we may incur product shortages, delays in product shipments or excess or insufficient product inventory.
We sell our products to customers who integrate them into their products. We do not obtain firm, long-term purchase commitments from our customers. We have limited visibility as to the volume of our products that our customers are selling or carrying in their inventory. In addition, certain service providers are affected by seasonality in their deployment of products that incorporate our products, which may in turn impact the timing of our sales. Because production lead times often exceed the amount of time required to fulfill orders, we often must build inventory in advance of orders, relying on an imperfect demand forecast to project volumes and product mix. Our demand forecast accuracy can be adversely affected by a number of factors, including inaccurate forecasting by our customers, changes in market conditions, adverse changes in our product order mix and demand for our customers’ products. We have in the past had customers dramatically decrease and increase their requested production quantities with little or no advance notice. Even after an order is received, our customers may cancel these orders, postpone taking delivery or request a decrease in production quantities. Any such cancellation, postponement of delivery or decrease in production quantity subjects us to a number of risks, most notably that our projected sales will not materialize on schedule or at all, leading to unanticipated revenue shortfalls, reduced profit margins and excess or obsolete inventory which we may be unable to sell to other customers or which we must sell at reduced prices, or that any resulting disputes with our customers may adversely impact our future relationships with those customers. Alternatively, if we are unable to project customer requirements accurately, we may not build enough products, which could lead to delays in product shipments and lost sales opportunities in the near term, as well as force our customers to identify alternative sources of supply, which could affect our ongoing relationships with these customers and potentially reduce our market share. If we do not timely fulfill customer demands, our customers may cancel their orders and we may be subject to customer claims for cost of replacement.
Our ability to accurately predict revenues and inventory needs, and to effectively manage inventory levels, may be adversely impacted due to our use of inventory “hubbing” arrangements.
We are party to an inventory “hubbing” arrangement with Motorola and we may enter into similar arrangements with other customers in the future. Pursuant to these arrangements, we ship our products to a designated third-party warehouse, or hub, rather than shipping them directly to the customer. The products generally remain in the hub until the customer removes them for incorporation into its own products. In the absence of any hubbing arrangement, we generally recognize revenues on sales of our products upon shipment of those products to the buyer. Under our hubbing arrangement with Motorola, however, we maintain ownership of our products in the hub, and therefore do not recognize the related revenue, until the date Motorola removes them from the hub. As a result, our ability to accurately predict future revenues recognized from sales to Motorola or any other customers with which we implement hubbing arrangements may be impaired, and we may experience significant fluctuations in our quarterly operating results depending on when Motorola or any such other customers remove our products from the hub, which they may do with little or no lead time. In the short term, we may experience an increase in operating expenses as we build and ship inventory to the hub and may not recognize revenues from sales of this inventory, if at all, until Motorola or any such other customers remove it from the hub at a later time. Furthermore, because we continue to own but do not maintain control over our products after they are shipped to the hub, our ability to effectively manage inventory levels may be impaired as our shipments under the hubbing arrangement increase and we may be exposed to additional risk that the inventory in the hub becomes obsolete before sales are recognized.
38
Table of Contents
We extend credit to our customers, sometimes in large amounts, but there is no guarantee every customer will be able to pay our invoices when they become due.
As part of our routine business, we extend credit to customers purchasing our products. While our customers may have the ability to pay on the date of shipment or on the date credit is granted, their financial condition could change and there is no guarantee that customers will ever pay the invoices. Rapid changes in our customers’ financial conditions and risks associated with extending credit to our customers can subject us to a higher financial risk and could have a material adverse effect on our business, financial condition and results of operations.
We depend on a limited number of third parties to manufacture, assemble and test our products which reduces our control over key aspects of our products and their availability.
We do not own or operate a manufacturing, assembly or test facility for our products. Rather, we outsource the manufacture, assembly and testing of our products to third-party subcontractors including Taiwan Semiconductor Manufacturing Company, TowerJazz, Amkor Technologies, Inc. and Giga Solution Tech. Co., Ltd. Accordingly, we are greatly dependent on a limited number of suppliers to deliver quality products on time. Our reliance on sole or limited suppliers involves several risks, including susceptibility to increased manufacturing costs if competition for foundry capacity intensifies and reduced control over the following:
| • | supply of our products available for sale; |
| • | pricing, quality and timely delivery of our products; |
| • | prices and availability of components for our products; and |
| • | production capacity for our products. |
Because we rely on a limited number of third-party manufacturers, if we were required to change contract manufacturers or one of our contract manufacturers became unable or unwilling to continue manufacturing our products, we may sustain lost revenues, increased costs and damage to our customer relationships. In addition, we would need to expend significant time and effort to locate and qualify new third-party manufacturers, if available.
Manufacturing defects may not be detected by the testing process performed by our subcontractors. If defects are discovered after we have shipped our products, we may be exposed to warranty and consequential damages claims from our customers. Such claims may have a significant adverse impact on our revenues and operating results. Furthermore, if we are unable to deliver quality products, our reputation would be harmed, which could result in the loss of future orders and business with our customers.
When demand for manufacturing capacity is high, we may take various actions to try to secure sufficient capacity, which may be costly and negatively impact our operating results.
The ability of each of our subcontractors’ manufacturing facilities to provide us with chipsets is limited by their available capacity and existing obligations. Although we have purchase order commitments to supply specified levels of products to our customers, we do not have a guaranteed level of production capacity from any of our subcontractors’ facilities to produce our products. Facility capacity may not be available when we need it or at reasonable prices. In addition, our subcontractors may allocate capacity to the production of other companies’ products and thereby reduce deliveries to us on short notice.
39
Table of Contents
In order to secure sufficient manufacturing facility capacity when demand is high and mitigate the risks associated with an inability to meet our customers’ demands for our products, we may enter into various arrangements with subcontractors that could be costly and harm our operating results, including:
| • | option payments or other prepayments to a subcontractor; |
| • | nonrefundable deposits with or loans to subcontractors in exchange for capacity commitments; |
| • | contracts that commit us to purchase specified quantities of components over extended periods; and |
| • | purchase of testing equipment for specific use at the facilities of our subcontractors. |
We may not be able to make any such arrangements in a timely fashion or at all, and any arrangements may be costly, reduce our financial flexibility and not be on terms favorable to us. Moreover, if we are able to secure capacity, we may be obligated to use all of that capacity or incur penalties. These penalties and obligations may be expensive and require significant capital and could harm our business.
We believe that transitioning certain of our silicon products to newer or better manufacturing process technologies will be important to our future competitive position. If we fail to make this transition efficiently, our competitive position could be seriously harmed.
We continually evaluate the benefits, on a product-by-product basis, of migrating to higher performance or lower cost process technologies in order to produce higher performance, more efficient or better integrated circuits because we believe this migration is required to remain competitive. Other companies in our industry have experienced difficulty in migrating to new process technologies and, consequently, have suffered reduced yields, delays in product deliveries and increased expense levels. We may experience similar difficulties. Moreover, we are dependent on our relationships with subcontractors to successfully migrate to newer or better process technologies. Our third-party manufacturers may not make newer or better process technologies available to us on a timely or cost-effective basis, if at all. If our third-party manufacturers do not make newer or better manufacturing process technologies available to us on a timely or cost-effective basis, or if we experience difficulties in migrating to these processes, it could have a material adverse effect on our competitive position and business prospects.
We rely on sales representatives to assist in selling our products, and the failure of these representatives to perform as expected could reduce our future sales.
We sell our products to some of our customers through third-party sales representatives and distributors. Our relationships with some of these third-party sales representatives and distributors are relatively new and we are unable to predict the extent to which our third-party sales representatives and distributors will be successful in marketing and selling our products. Moreover, many of our third-party sales representatives and distributors also market and sell competing products. Our third-party sales representatives and distributors may terminate their relationships with us at any time, or with short notice, and may give greater attention to the products sold by our competitors. Our future performance will also depend, in part, on our ability to attract additional third-party sales representatives and distributors that will be able to market our products effectively, especially in markets in which we have not previously distributed our products. If we cannot retain our current third-party sales representatives and distributors and recruit additional or replacement third-party sales representatives and distributors, our revenues and operating results could be harmed.
40
Table of Contents
Our products may contain defects or errors which may adversely affect their market acceptance and our reputation and expose us to product liability claims.
Our products are very complex and may contain defects or errors, especially when first introduced or when new versions are released. Despite testing, errors may occur. Product errors could affect the performance of our products, delay the development or release of new products or new versions of products, adversely affect our reputation and our customers’ willingness to buy products from us, and adversely affect market acceptance or perception of our products. Any such errors or delays in releasing new products or new versions of products or allegations of unsatisfactory performance could cause us to lose revenue or market share, increase our service costs, cause us to incur substantial costs in redesigning our products, subject us to liability for damages and divert our resources from other tasks. Our products must successfully interoperate with products from other vendors. As a result, when problems occur in a device or application in which our product is used, it may be difficult to identify the sources of these problems. The occurrence of hardware and software errors, whether or not caused by our products, could result in the delay or loss of market acceptance of our products, and therefore delay our ability to recognize revenue from sales, and any necessary revisions may cause us to incur significant expenses. Moreover, since one of the key benefits of our home networking products is reduction of the need for service providers to dispatch service vehicles to customer premises, often referred to as “truck rolls,” problems with our products would likely result in a greater number of truck rolls and this in turn could adversely affect our sales. The occurrence of any such problems could harm our business, operating results and financial condition.
Any limitation of liability provisions in our standard terms and conditions of sale may not fully or effectively protect us from claims as a result of federal, state or local laws or ordinances or unfavorable judicial decisions in the United States or other countries. The use of our products also entails the risk of product liability claims. We maintain insurance to protect against certain claims associated with the use of our products, but our insurance coverage may not adequately cover any claim asserted against us. In addition, even claims that ultimately are unsuccessful could result in our expenditure of funds in litigation and divert management’s time and other resources.
We depend on key personnel to operate our business, and if we are unable to retain our current personnel and hire additional qualified personnel, our ability to develop and successfully market our products could be harmed.
We believe our future success will depend in large part upon our ability to attract and retain highly skilled managerial, engineering and sales and marketing personnel. Even during the recent economic downturn, there continues to be competition for qualified personnel in the markets in which we compete. In addition, the cost of living in the San Diego, California area, where our corporate headquarters is located, has proved to be an obstacle to attracting new employees in the past, and we expect that this will continue to impact, to some extent, our ability to attract and retain employees in the future. We do not have employment agreements with most of our executive or key employees and the unexpected loss of any key employees, including Patrick Henry, our president and chief executive officer, other members of our senior management or our senior engineering personnel, or an inability to attract additional qualified personnel, including engineers and sales and marketing personnel, could delay the development, introduction and sale of our products and our ability to execute our business strategy may suffer. In addition, in the event that there is a loss of key personnel, there is a potential for loss of important knowledge that may delay or negatively impact development or sale of our products and our ability to execute on our business strategy. We do not currently have any key person life insurance covering any executive officer or employee.
41
Table of Contents
If we fail to comply with environmental regulatory requirements, our operating results could be adversely affected.
We face increasing complexity in our product design and procurement operations as we adjust to requirements relating to the materials composition of many of our products. The European Union has adopted certain directives to facilitate the recycling of electrical and electronic equipment sold in the European Union, including the Restriction on the Use of Certain Hazardous Substances in Electrical and Electronic Equipment, or RoHS, directive that restricts the use of lead, mercury and certain other substances in electrical and electronic products placed on the market in the European Union after July 1, 2006, and many other countries, including China, Taiwan and Korea, where the majority of our products are manufactured and packaged and sold, have also adopted similar directives banning or limiting the use of specified substances in products introduced into their domestic markets. We have incurred costs in connection with our compliance with these environmental laws and regulations, such as costs related to eliminating lead from our semiconductor product packaging. Other environmental regulations may be enacted in the future, including in the United States, that require us to reengineer our products to utilize components that are compatible with these regulations, and this reengineering and component substitution may result in additional costs to us or disrupt our operations or logistics. If we or the third-party manufacturers of our products are unable to meet future environmental regulations in a timely manner, it could have a material adverse effect on our business, results of operations and financial condition.
Certain of our customers’ products and service providers’ services are subject to governmental regulation.
Governmental regulation could place constraints on our customers and service providers’ services and consequently reduce our customers’ demand for our products. For example, the Federal Communications Commission has broad jurisdiction over products that emit radio frequency signals in the United States. Similar governmental agencies regulate these products in other countries. Moreover, laws and regulations regarding local cable franchising could have an adverse effect on Verizon’s and other service providers’ ability to compete in the HD video and multimedia content delivery market. Although most of our products are not directly subject to current regulations of the Federal Communications Commission or any other federal or state communications regulatory agency, much of the equipment into which these products are incorporated is subject to direct governmental regulation. Accordingly, the effects of regulation on our customers or the industries in which they operate may, in turn, impede sales of our products. For example, demand for these products will decrease if equipment into which they are incorporated fails to comply with the specifications of the Federal Communications Commission.
Our failure to raise additional capital or generate the significant capital necessary to expand our operations and invest in new products could reduce our ability to compete and could harm our business.
We intend to continue spending substantial amounts in connection with our expansion in order to grow our business. We may need to obtain additional financing to pursue our business strategy, develop new products, respond to competition and market opportunities and acquire complementary businesses or technologies. We may not be able to obtain such financing on favorable terms or at all. Although we currently have access to a $10.0 million line of credit under the terms of our existing Loan and Security Agreement, as amended, with Silicon Valley Bank, or SVB, of which $7.0 million was available at December 31, 2009, the current turmoil in the credit markets may affect SVB’s willingness or ability to provide us with full access to our line of credit when needed or to renew the term of the credit line when it expires in April 2010.
42
Table of Contents
If we were to raise additional capital through further sales of our equity securities, our stockholders would suffer dilution of their equity ownership. If we engage in debt financing, we may be required to accept terms that restrict our ability to incur additional indebtedness, prohibit us from paying dividends, repurchasing our stock or making investments, and force us to maintain specified liquidity or other ratios, any of which could harm our business, operating results and financial condition. If we need additional capital and cannot raise it on acceptable terms, we may not be able to, among other things:
| • | develop or enhance our products; |
| • | continue to expand our product development and sales and marketing organizations; |
| • | acquire complementary technologies, products or businesses; |
| • | expand operations, in the United States or internationally; |
| • | hire, train and retain employees; or |
| • | respond to competitive pressures or unanticipated working capital requirements. |
Our failure to do any of these things could seriously harm our ability to execute our business strategy and may force us to curtail our research and development plans or existing operations.
Our costs have increased significantly as a result of operating as a public company, and our management is required to devote substantial time to comply with public company regulations.
As a public company, we incur significant legal, accounting and other expenses that we did not incur as a private company. In addition, the Sarbanes-Oxley Act of 2002, or the Sarbanes-Oxley Act, as well as new rules subsequently implemented by the SEC and The NASDAQ Stock Market, or NASDAQ, have imposed various requirements on public companies, including changes in corporate governance practices that did not previously exist. The Sarbanes-Oxley Act requires us to maintain effective disclosure controls and procedures and internal controls for financial reporting. In order to maintain and improve the effectiveness of our disclosure controls and procedures and internal controls over financial reporting, significant resources and management oversight are required. Our management and other personnel now devote a substantial amount of time to these new requirements. Moreover, these rules and regulations cause us to incur significant legal and financial compliance costs and make some activities more time-consuming and costly.
For example, as required by the Sarbanes-Oxley Act, commencing in year 2008, we must now perform system and process evaluation and testing of our internal controls over financial reporting to allow management and our independent registered public accounting firm to report on the effectiveness of our internal controls over financial reporting, as required by Section 404 of the Sarbanes-Oxley Act. Our compliance with Section 404 requires that we incur substantial expense and expend significant management efforts. If we identify deficiencies in our internal controls over financial reporting that are deemed to be material weaknesses, the market price of our stock could decline and we could be subject to sanctions or investigations by the NASDAQ, SEC or other regulatory authorities.
Our effective tax rate may increase or fluctuate, and we may not derive the anticipated tax benefits from any expansion of our international operations.
Our effective tax rate could be adversely affected by various factors, many of which are outside of our control. Our effective tax rate is directly affected by the relative proportions of revenue and income before taxes in the various domestic and international jurisdictions in which we operate. We are also subject to changing tax laws, regulations and interpretations in multiple jurisdictions in which we operate as well as the requirements of certain tax rulings. Changes in applicable tax laws may
43
Table of Contents
cause fluctuations between reporting periods in which the changes take place. If our business opportunities outside the United States continue to grow, we may expand our international operations and staff to better support our expansion into international markets. We anticipate that this expansion will include the implementation of an international organizational structure that could result in an increasing percentage of our consolidated pre-tax income being derived from, and reinvested in, our international operations. Moreover, we anticipate that this pre-tax income will be subject to foreign tax at relatively lower tax rates when compared to the U.S. federal statutory tax rate and as a consequence, our future effective income tax rate may be lower than the U.S. federal statutory rate. There can be no assurance that significant pre-tax income will be derived from or reinvested in our international operations, that our international operations and sales will result in a lower effective income tax rate, or that we will implement an international organizational structure. In addition, our future effective income tax rate could be adversely affected if tax authorities challenge any international tax structure that we implement or if the relative mix of U.S. and international income changes for any reason. Accordingly, there can be no assurance that our effective income tax rate will be less than the U.S. federal statutory rate.
Our ability to utilize our net operating loss and tax credit carryforwards may be limited, which could result in our payment of income taxes earlier than if we were able to fully utilize our net operating loss and tax credit carryforwards.
As of December 31, 2009, we had federal, state and foreign net operating loss carryforwards of approximately $67.9 million, $50.1 million and $0.9 million, respectively, and federal and state research and development tax credit carryforwards of $9.8 million and $9.4 million, respectively. The tax benefits related to utilization of net operating loss and tax credit carryforwards may be limited due to ownership changes or as a result of other events. For example, Section 382 of the Internal Revenue Code of 1986, as amended, or Internal Revenue Code, imposes an annual limitation on the amount of net operating loss carryforwards and tax credit carryforwards that may be used to offset federal taxable income and federal tax liabilities when a corporation has undergone a significant change in its ownership. While prior changes in our ownership, including as a result of our acquisition of RF Magic, have resulted in annual limitations on the amount of our net operating loss and tax credit carryforwards that may be utilized in the future, we do not anticipate that such annual limitations will preclude the utilization of substantially all the net operating loss and tax credit carryforwards described above in the event we become profitable. However, to the extent our use of net operating loss and tax credit carryforwards is further limited by the issuance of common stock in our initial public offering or in future offerings or transactions or by our implementation of an international tax structure or other future events, our income would be subject to cash payments of income tax earlier than it would be if we were able to fully utilize our net operating loss and tax credit carryforwards without such further limitation.
If we fail to manage our exposure to global financial and securities market risk successfully, our operating results could be adversely impacted.
We are exposed to financial market risks, including changes in interest rates, foreign currency exchange rates, credit markets and prices of marketable equity and fixed-income securities. We do not use derivative financial instruments for speculative or trading purposes.
The primary objective of most of our investment activities is to preserve principal while at the same time maximizing yields without significantly increasing risk. To achieve this objective, a majority of our marketable investments are investment grade, liquid, fixed-income securities and money market instruments denominated in U.S. dollars. If the carrying value of our investments exceeds the fair value, and the decline in fair value is deemed to be other-than-temporary, we will be required to further write down the value of our investments, which could materially harm our results of operations and financial condition. Moreover, the performance of certain securities in our investment portfolio is
44
Table of Contents
affected by the credit condition of the U.S. financial sector. With the current unstable credit environment of the U.S. financial sector, we might incur significant realized, unrealized or impairment losses associated with these investments.
Risks Related to Our Intellectual Property
Our ability to compete and our business could be jeopardized if we are unable to secure or protect our intellectual property.
We rely on a combination of patent, copyright, trademark and trade secret laws, confidentiality procedures and licensing arrangements to establish and protect our proprietary rights. However, these legal means afford only limited protection and may not adequately protect our rights or permit us to gain or keep any competitive advantage. Our patent applications may not issue as patents at all or they may not issue as patents in a form that will be advantageous to us. Our issued patents and those that may issue in the future may be challenged, invalidated or circumvented, which could limit our ability to stop competitors from marketing related products. Although we have taken steps to protect our intellectual property and proprietary technology, there is no assurance that third parties will not be able to invalidate or design around our patents. Furthermore, although we have entered into confidentiality agreements and intellectual property assignment agreements with our employees, consultants and advisors, such agreements may not be enforceable or may not provide meaningful protection for our trade secrets or other proprietary information in the event of unauthorized use or disclosure or other breaches of the agreements. Moreover, we are required to license any of our patent claims that are essential to implement MoCA specifications to other MoCA members, who could potentially include our competitors, on reasonable and non-discriminatory terms. In addition, in connection with commercial arrangements with our customers and the service providers who deploy equipment containing our products, we may be required to license our intellectual property to third parties, including competitors or potential competitors.
Despite our efforts to protect our proprietary rights, unauthorized parties may attempt to copy or otherwise obtain and use our products or technology. Monitoring unauthorized use of our technology is difficult and we cannot be certain that the steps we have taken to prevent such unauthorized use will be successful, particularly in foreign countries where the laws may not protect our proprietary rights as comprehensively as in the United States. In addition, if we become aware of a third party’s unauthorized use or misappropriation of our technology, it may not be practicable, effective or cost-efficient for us to enforce our intellectual property and contractual rights, particularly where the initiation of a claim might harm our business relationships or risk a costly and protracted lawsuit, including a potential countersuit by a competitor with patents that may implicate our products. If competitors engage in unauthorized use or misappropriation of our technology, our ability to compete effectively could be harmed.
Our participation in “patent pools” and standards setting organizations, or other business arrangements, may require us to license our patents to competitors and other third parties and limit our ability to enforce or collect royalties for our patents.
In addition to our existing obligations to license our patent claims that are essential to implement the MoCA specifications to other MoCA members, in the course of participating in patent pools and other standards setting organizations or pursuant to other business arrangements, we may agree to license certain of our technologies on a reasonable and non-discriminatory basis and, as a result, our control over the license of such technologies may be limited. We may also be unable to limit to whom we license some of our technologies, and may be unable to restrict many terms of the license. Consequently, our competitors may obtain the right to use our technology. In addition, our control over the application and quality control of our technologies that are included in patent pools or otherwise necessary for implementing industry standards may be limited.
45
Table of Contents
Any dispute with a MoCA member regarding what patent claims are necessary to implement MoCA specifications could result in litigation which could have an adverse effect on our business.
We are required to grant to other MoCA members a non-exclusive and world-wide license on reasonable and non-discriminatory terms to any of our patent claims that are essential to implement MoCA specifications. If we had a disagreement with a MoCA member regarding which of our patent claims are necessary to implement MoCA specifications, this could result in a lawsuit. Any such lawsuit, regardless of its merits, could be time-consuming, expensive to resolve, divert our management’s time and attention and harm our reputation. In addition, any such litigation could result in us being required to license on reasonable and non-discriminatory terms certain of our patent claims which we previously believed did not need to be licensed under our MoCA agreement. This could have an adverse effect on our business and harm our competitive position.
Possible third-party claims of infringement of proprietary rights against us, our customers or the service providers that purchase products from our customers, or other intellectual property claims or disputes, could have a material adverse effect on our business, results of operation or financial condition.
The semiconductor industry is characterized by a relatively high level of litigation based on allegations of infringement of proprietary rights. Numerous U.S. and foreign issued patents and pending patent applications owned by third parties exist in the fields in which we are selling and developing products. Because patent applications take many years to issue, currently pending applications, known or unknown to us, may later result in issued patents that we infringe. In addition, third parties continue to actively seek new patents in our field. It is difficult or impossible to keep fully abreast of these developments, and therefore, as we develop new and enhanced products, we may sell or distribute products that inadvertently infringe patents held by third parties.
We have in the past received and we, our customers or the service providers that purchase products from our customers may in the future receive inquiries from other patent holders and may become subject to claims that we infringe their intellectual property rights. Any intellectual property claim or dispute, regardless of its merits, could force us, our customers or the service providers that purchase our products from our customers to license the third-party’s patents for substantial royalty payments or cease the sale of the alleged infringing products or use of the alleged infringing technologies, or force us to defend ourselves and possibly our customers or contract manufacturers in litigation. Any cessation of product sales by us, our customers or the service providers that purchase products from our customers could have a substantial negative impact on our revenues. Any litigation, regardless of its outcome, could result in substantial expense and significant diversion of our management’s time and other resources. Moreover, any such litigation could subject us, our customers or the service providers that purchase our products from our customers to significant liability for damages (including treble damages), temporary or permanent injunctions, or the invalidation of proprietary rights or require us, our customers or the service providers that purchase products from our customers to license the third-party patents for substantial royalty or other payments.
In addition, we may also be required to indemnify our customers and contract manufacturers for damages they suffer as a result of such infringement or litigation.
Our use of open source and third-party software could impose limitations on our ability to commercialize our products.
We incorporate open source software into our products, including certain open source code which is governed by the GNU General Public License, Lesser GNU General Public License and Common Development and Distribution License. The terms of many open source licenses have not
46
Table of Contents
been interpreted by U.S. courts, and there is a risk that these licenses could be construed in a manner that could impose unanticipated conditions or restrictions on our ability to commercialize our products. In such event, we could be required to seek licenses from third parties in order to continue offering our products, make our proprietary code generally available in source code form (for example, proprietary code that links in particular ways to certain open source modules), which would result in our trade secrets being disclosed to the public and the potential loss of intellectual property rights in our software, re-engineer our products, discontinue the sale of our products if re-engineering cannot be accomplished on a cost-effective and timely basis, or become subject to other consequences, any of which could adversely affect our business, operating results and financial condition.
In addition to technologies we have already licensed, we may find that we need to incorporate certain proprietary third-party technologies, including software programs, into our products in the future. However, licenses to relevant third-party technologies may not be available to us on commercially reasonable terms, if at all. Therefore, we could face delays in product releases until alternative technology can be identified, licensed or developed, and integrated into our current products. Such alternative technology may not be available to us on reasonable terms, if at all, and may ultimately not be as effective as the preferred technology. Any such delays or failures to obtain licenses, if they occur, could materially adversely affect our business, operating results and financial condition.
Because we license some of our software source code directly to customers, we face increased risks that our trade secrets will be exposed through inadvertent or intentional disclosure, which could harm our competitive position or increase our costs.
We license some of our software source code to our customers, which increases the number of people who have access to some of our trade secrets and other proprietary rights. Contractual obligations of our licensees not to disclose or misuse our source code may not be sufficient to prevent such disclosure or misuse. The costs of enforcing contractual rights could substantially increase our operating costs and may not be cost-effective, reasonable under the circumstances or ultimately succeed in protecting our proprietary rights. If our competitors access our source code, they may gain further insight into the technology and design of our products, which would harm our competitive position.
Risks Related to International Operations
We expect a significant portion of our future revenues to come from our international customers, and, as a result, our business may be harmed by political and economic conditions in foreign markets and the challenges associated with operating internationally.
We have derived, and expect to continue to derive, a significant portion of our revenues from international markets. Net revenues outside of the United States comprised 97% and 98% of our total revenues for the year ended December 31, 2009 and 2008, respectively. International business activities involve certain risks, including:
| • | difficulties involved in the staffing and management of geographically dispersed operations; |
| • | longer sales cycles in certain countries, especially on initial entry into a new geographical market; |
| • | greater difficulty evaluating a customer’s ability to pay, longer accounts receivable payment cycles and greater difficulty in the collection of past-due accounts; |
| • | general economic conditions in each country; |
| • | challenges associated with operating in diverse cultural and legal environments; |
47
Table of Contents
| • | seasonal reductions in business activity specific to certain markets; |
| • | loss of revenue, property and equipment from expropriation, nationalization, war, insurrection, terrorism and other political risks; |
| • | foreign taxes and the overlap of different tax structures, including modifications to the United States tax code as a result of international trade regulations; |
| • | foreign technical standards; |
| • | changes in currency exchange rates; and |
| • | import and export licensing requirements, tariffs, and other trade and travel restrictions. |
To the extent our international sales are adversely affected by any of these risks or are otherwise unsuccessful, we could experience a reduction in revenue and our operating results could suffer.
In addition, certain foreign countries where we sell our products, such as China and Korea, have historically limited recognition and enforcement of contractual and intellectual property rights. In particular, we may have difficulty preventing ODMs and OEMs in these countries from incorporating our inventions, technologies, copyrights or trademarks into their products without our authorization or without paying us licensing fees. We may also experience difficulty enforcing our intellectual property rights in these countries, where intellectual property rights are not as respected as they are in the United States, Japan and Europe. Unauthorized use of our technologies and intellectual property rights may dilute or undermine the strength of our brand. Further, if we are not able to adequately monitor the use of our technologies by foreign-based ODMs and OEMs, or enforce our intellectual property rights in foreign countries, our revenue potential could be adversely affected.
Our products are subject to export and import controls that could subject us to liability or impair our ability to compete in international markets.
Our products are subject to U.S. export controls and may be exported outside the United States only with the required level of export license or through an export license exception, in most cases because we incorporate encryption technology into our products. In addition, various countries regulate the import of certain encryption technology and have enacted laws that could limit our ability to distribute our products or could limit our customers’ ability to implement our products in those countries. Changes in our products or changes in export and import regulations may create delays in the introduction of our products in international markets, prevent our customers with international operations from deploying our products throughout their global systems or, in some cases, prevent the export or import of our products to certain countries altogether. Any change in export or import regulations or related legislation, or change in the countries, persons or technologies targeted by such regulations or legislation, could result in decreased use of our products by, or in our decreased ability to export or sell our products to, existing or potential customers internationally.
In addition, we may be subject to customs duties and export quotas, which could have a significant impact on our revenue and profitability. The future imposition of significant increases in the level of customs duties or export quotas could have a material adverse effect on our business.
Our third-party contractors are concentrated primarily in areas subject to earthquakes and other natural disasters. Any disruption to the operations of these contractors could cause significant delays in the production or shipment of our products.
Substantially all of our products are manufactured by third-party contractors located in the Pacific Rim. The risk of an earthquake in these areas is significant due to the proximity of major earthquake fault lines to the facilities of our foundry, assembly and test subcontractors. The occurrence of earthquakes or other natural disasters could result in the disruption of our foundry or
48
Table of Contents
assembly and test capacity. Any disruption resulting from such events could cause significant delays in the production or shipment of our products until we are able to shift our manufacturing, assembling or testing from the affected contractor to another third-party vendor. We may not be able to obtain alternate capacity on favorable terms, if at all.
Risks Related to Ownership of Our Common Stock
Our stock price is volatile and may decline regardless of our operating performance, and you may not be able to resell your shares at or above the price at which you purchased such shares.
The market price for our common stock is volatile and may fluctuate significantly in response to a number of factors, most of which we cannot control, including:
| • | price and volume fluctuations in the overall stock market; |
| • | market conditions or trends in our industry or the economy as a whole; |
| • | changes in operating performance and stock market valuations of other technology companies generally, or those that sell semiconductor products in particular; |
| • | the timing of customer or service provider orders that may cause quarterly or other periodic fluctuations in our results that may, in turn, affect the market price of our common stock; |
| • | the seasonal nature of the deployment of products that incorporate our products by certain service providers which may affect the timing of orders for our products; |
| • | the timing of revenue recognition on sales arrangements, which may include multiple deliverables, and the effect of our use of inventory “hubbing” arrangements; |
| • | the financial projections we may provide to the public, any changes in these projections or our failure to meet these projections; |
| • | changes in financial estimates or ratings by any securities analysts who follow our common stock, our failure to meet these estimates or failure of those analysts to initiate or maintain coverage of our common stock; |
| • | the public’s response to press releases or other public announcements by us or third parties, including our filings with the SEC and announcements relating to product development, litigation and intellectual property impacting us or our business; |
| • | the sustainability of an active trading market for our common stock; |
| • | future sales of our common stock by our executive officers, directors and significant stockholders; |
| • | announcements of mergers or acquisition transactions; |
| • | our inclusion or deletion from certain stock indices; |
| • | announcements of technical innovations, new products or design wins by our competitors or customers; |
| • | announcements of changes in our senior management; |
| • | other events or factors, including those resulting from war, incidents of terrorism, natural disasters or responses to these events; and |
| • | changes in accounting principles. |
49
Table of Contents
In addition, the stock markets, and in particular The NASDAQ Global Market, have experienced extreme price and volume fluctuations that have affected and continue to affect the market prices of equity securities of many technology companies. Stock prices of many technology companies have fluctuated in a manner unrelated or disproportionate to the operating performance of those companies. In the past, stockholders have instituted securities class action litigation following periods of market volatility. If we were involved in securities litigation, we could incur substantial costs and our resources and the attention of management could be diverted from our business.
Future sales of our common stock or the issuance of securities convertible into or exercisable for shares of our common stock may depress our stock price.
A significant number of shares of our common stock are held by a small number of stockholders. Sales of a substantial number of shares of our common stock, the issuance of securities convertible into or exercisable for shares of our common stock or the expectation or perception in the market that the holders of a large number of our shares of common stock intend to sell their shares, could significantly reduce the market price of our common stock. In addition, because the average daily trading volume of our common stock is low, our common stock is less liquid than the stock of companies with broader public ownership and, as a result, the trading of a relatively small volume of our common stock may have a greater impact on the trading price for our stock and lead to increased volatility in our stock price.
Anti-takeover provisions in our charter documents and Delaware law might deter acquisition bids for us that you might consider favorable.
Our amended and restated certificate of incorporation and bylaws contain provisions that may make the acquisition of our company more difficult without the approval of our board of directors. These provisions:
| • | establish a classified board of directors so that not all members of our board are elected at one time; |
| • | authorize the issuance of undesignated preferred stock, the terms of which may be established and shares of which may be issued without stockholder approval, and which may include rights superior to the rights of the holders of common stock; |
| • | prohibit stockholder action by written consent, which requires all stockholder actions to be taken at a meeting of our stockholders; |
| • | provide that the board of directors is expressly authorized to make, alter, or repeal our bylaws; |
| • | establish advance notice requirements for nominations for elections to our board or for proposing matters that can be acted upon by stockholders at stockholder meetings; and |
| • | provide that in addition to any vote required by law or by our amended and restated certificate of incorporation, the approval by holders of at least 66 2/3% of our then outstanding common stock is required to adopt, amend or repeal any provision of our amended and restated bylaws. |
In addition, because we are incorporated in Delaware, we are governed by the provisions of Section 203 of the Delaware General Corporation Law which, subject to certain exceptions, prohibits stockholders owning in excess of 15% of our outstanding voting stock from merging or combining with us. These anti-takeover provisions and other provisions under Delaware law could discourage, delay or prevent a transaction involving a change in control of our company, even if doing so would benefit our stockholders. These provisions could also discourage proxy contests and make it more difficult for you and other stockholders to elect directors of your choosing and cause us to take other corporate actions you desire.
50
Table of Contents
Our principal stockholders, executive officers and directors have substantial control over the company, which may prevent you and other stockholders from influencing significant corporate decisions and may harm the market price of our common stock.
As of December 31, 2009, our executive officers, directors and holders of five percent or more of our outstanding common stock, beneficially owned, in the aggregate, 24% of our outstanding common stock. These stockholders may have interests that conflict with our other stockholders and, if acting together, have the ability to substantially influence or determine the outcome of matters submitted to our stockholders for approval, including the election and removal of directors and any merger, consolidation or sale of all or substantially all of our assets. In addition, these stockholders, acting together, may have the ability to control our management and affairs. Accordingly, this concentration of ownership may harm the market price of our common stock by:
| • | delaying, deferring or preventing a change in control; |
| • | impeding a merger, consolidation, takeover or other business combination involving us; or |
| • | discouraging a potential acquirer from making a tender offer or otherwise attempting to obtain control of us. |
If securities or industry analysts publish inaccurate or unfavorable research about our business, our stock price and trading volume could decline.
The trading market for our common stock will depend in part on the research and reports that securities or industry analysts publish about us or our business. If one or more of the analysts who covers us downgrades our stock or publishes inaccurate or unfavorable research about our business, our stock price would likely decline. If one or more of these analysts ceases coverage of us or fails to publish reports on us regularly, demand for our stock could decrease, which could cause our stock price and trading volume to decline.
We do not expect to pay any cash dividends for the foreseeable future.
The continued expansion of our business will require substantial funding. Accordingly, we do not anticipate that we will pay any cash dividends on shares of our common stock for the foreseeable future. Any determination to pay dividends in the future will be at the discretion of our board of directors and will depend upon our results of operations, financial condition, contractual restrictions, restrictions imposed by applicable law and other factors our board of directors deems relevant. Investors seeking cash dividends in the foreseeable future should not purchase or hold our common stock.
Our stock may be delisted from The NASDAQ Global Market if the closing bid price for our common stock is not maintained at $1.00 per share or higher.
Our common stock must trade at or above $1.00 to meet NASDAQ’s minimum bid requirement for continued listing on The NASDAQ Global Market. If the closing bid price of our common stock falls below $1.00, NASDAQ may make a determination to delist our common stock. Any such delisting could adversely affect the market liquidity of our common stock and the market price of our common stock could decrease and could also adversely affect our ability to obtain financing for the continuation of our operations and/or result in the loss of confidence by investors, customers, suppliers and employees. In the last 12 months, our common stock has traded at below $1.00 per share at closing for an extended period of time although NASDAQ took no action to delist our common stock at the time as it had suspended its enforcement of the rules requiring a minimum $1.00 closing bid price in response to the ongoing turmoil in the stock markets at the time.
51
Table of Contents
| Item 1B. | Unresolved Staff Comments |
Not applicable.
| Item 2. | Properties |
We entered into our current lease for 90,000 square feet of space for our corporate headquarters in San Diego, California in February 2008. Our lease expires in February 2015, subject to two five-year renewal options. In addition to our corporate headquarters, we lease additional offices in San Jose, California; Hong Kong and Shenzhen, China; Manof, Israel; Seoul, Korea and Taipei, Taiwan.
We believe that our existing properties are in good condition and are sufficient and suitable for the conduct of our business. As our existing leases expire and as we continue to expand our operations, we believe that suitable space will be available on commercially reasonable terms.
| Item 3. | Legal Proceedings |
From time to time, we may be involved in litigation relating to claims arising out of our operations. We are not a party to any legal proceedings that are expected, individually or in the aggregate, to have a material adverse effect on our business, financial condition or operating results.
For an additional discussion of certain risks associated with legal proceedings, see Part I, Item 1A, Risk Factors of this Annual Report.
| Item 4. | Submission of Matters to a Vote of Security Holders |
Not applicable.
52
Table of Contents
| Item 5. | Market for Registrant’s Common Equity, Related Stockholder Matters and Issuer Purchases of Equity Securities |
Market Information and Holders
Our common stock trades on The NASDAQ Global Market under the symbol ENTR. The following table sets forth the high and low sale prices for our common stock as reported by The NASDAQ Global Market for the periods indicated:
| High | Low | |||||
| Year Ended December 31, 2009 |
||||||
| First Quarter |
$ | 1.10 | $ | 0.42 | ||
| Second Quarter |
$ | 2.96 | $ | 0.75 | ||
| Third Quarter |
$ | 3.47 | $ | 2.22 | ||
| Fourth Quarter |
$ | 3.53 | $ | 2.23 | ||
| Year Ended December 31, 2008 |
||||||
| First Quarter |
$ | 7.67 | $ | 3.75 | ||
| Second Quarter |
$ | 5.73 | $ | 3.72 | ||
| Third Quarter |
$ | 4.70 | $ | 1.10 | ||
| Fourth Quarter |
$ | 1.55 | $ | 0.41 | ||
As of February 1, 2010, there were 241 holders of record of our common stock.
Dividend Policy
We have never declared or paid cash dividends on shares of our common stock and, under the terms of our existing credit facility, we are not permitted to pay cash dividends without our lender’s prior consent. See note 5 to the notes to consolidated financial statements included in this Annual Report. We currently intend to retain all of our earnings, if any, for use in the continued expansion of our business. We do not anticipate paying any cash dividends in the foreseeable future. Any determination to pay dividends in the future will be at the discretion of our board of directors and will depend upon our results of operations, financial condition, contractual restrictions, restrictions imposed by applicable law and other factors our board of directors deems relevant.
53
Table of Contents
Stock Performance Graph*
The graph set forth below shows a comparison of the cumulative total stockholder return on our common stock between December 7, 2007 (the date of our initial public offering) and December 31, 2009, with the cumulative total return of (i) the Philadelphia Semiconductor Index; (ii) the NASDAQ Composite Index and (iii) the NASDAQ Electronic Components Index, over the same period. This graph assumes the investment of $100 on December 7, 2007 in our common stock at its opening price of $6.00 per share and in each of the Philadelphia Semiconductor Index, the NASDAQ Composite Index and the NASDAQ Electronics Components Index, and further assumes the reinvestment of dividends, if any. We have not paid or declared any cash dividends on our common stock and do not anticipate paying any cash dividends in the foreseeable future. The stock prices and stockholder returns over the periods indicated in the graph below should not be considered indicative of future stock price performance or stockholder returns.
COMPARISON OF CUMULATIVE TOTAL RETURN FOR THE PERIOD
DECEMBER 7, 2007 THROUGH DECEMBER 31, 2009
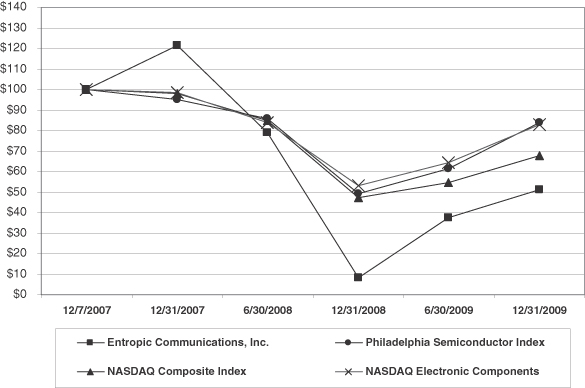
| 12/7/2007 | 12/31/2007 | 6/30/2008 | 12/31/2008 | 6/30/2009 | 12/31/2009 | |||||||
| Entropic Communications, Inc. |
100.00 | 121.33 | 79.17 | 8.33 | 37.50 | 51.17 | ||||||
| Philadelphia Semiconductor Index |
100.00 | 95.10 | 85.81 | 49.45 | 61.33 | 83.88 | ||||||
| NASDAQ Composite Index |
100.00 | 97.95 | 84.76 | 47.20 | 64.65 | 67.84 | ||||||
| NASDAQ Electronic Components |
100.00 | 98.30 | 84.07 | 53.02 | 64.18 | 82.85 |
| * | The material in this section is not “soliciting material,” is not deemed “filed” with the SEC and is not to be incorporated by reference into any of our SEC filings whether made before or after the date hereof and irrespective of any general incorporation language in any such SEC filing except to the extent we specifically incorporate this section by reference. |
54
Table of Contents
Recent Sales of Unregistered Securities
The following sets forth information regarding all unregistered securities of the Company that were sold during the year ended December 31, 2009:
| (1) | As of December 31, 2008, options to purchase up to 3,862,068 shares of our common stock were outstanding under our 2001 Stock Option Plan, or 2001 Plan. Of these options, during 2009, options exercisable for up to 803,354 shares of common stock were cancelled without being exercised and options to purchase 928,750 shares of common stock were exercised at a weighted average exercise price of $0.96 per share. As of December 31, 2009, options to purchase up to 2,129,964 shares of our common stock remained outstanding under the 2001 Plan. |
| (2) | As of December 31, 2008, options to purchase up to 1,425,629 shares of our common stock were outstanding under our RF Magic Plan, Inc. 2000 Incentive Stock Plan, or RF Magic Plan. During 2009, 80,903 of these options were cancelled without being exercised and options to purchase 272,316 shares of common stock were exercised at a weighted average exercise price of $0.70 per share. As of December 31, 2009, options to purchase up to 1,072,410 shares of our common stock remained outstanding under the RF Magic Plan. |
| (3) | In connection with our acquisition of RF Magic, we entered into put and call option agreements pursuant to which we are obligated to issue shares of our common stock in exchange for the shares of RF Magic’s common stock issuable upon exercise of stock options held by employees of RF Magic’s French subsidiary. Although we acquired RF Magic’s French subsidiary in connection with the acquisition, we did not assume the options held by the employees of the French subsidiary. As of December 31, 2008, there were 147,201 shares of our common stock subject to the put and call option agreements. During 2009, 9,542 of these options were cancelled without being exercised and options to purchase 103,079 shares of common stock were exercised and exchanged at a weighted average exercise price of $0.43 per share. As of December 31, 2009, we remain obligated to issue up to 34,580 shares of our common stock in exchange for the shares of RF Magic’s common stock issuable upon exercise of options held by the employees of our French subsidiary. |
All of the offers, sales and issuances of the securities described in paragraphs (1) and (2) were deemed to be exempt from registration under the Securities Act of 1933, as amended, or the Securities Act, in reliance on Rule 701 in that the transactions were under compensatory benefit plans and contracts relating to compensation as provided under Rule 701. The recipients of such securities were our employees, directors or bona fide consultants and received the securities under the 2001 Plan or RF Magic Plan, as the case may be. Appropriate legends were affixed to the securities issued in these transactions to the extent required. Each of the recipients of securities in these transactions had adequate access, through employment, business or other relationships, to information about us.
The issuance of the shares of our common stock described in paragraph (3) was deemed to be exempt from registration under the Securities Act in reliance on Section 3(A)(10) of the Securities Act after a fairness hearing before the California Department of Corporations.
55
Table of Contents
Issuer Purchases of Equity Securities
Pursuant to the terms of the 2001 Plan, options may be exercised prior to vesting. Shares of common stock issued prior to vesting that remain unvested are subject to a repurchase option in our favor that lapses in accordance with the original vesting schedule for the option. The following table provides information with respect to purchases made by us of shares of our common stock during the three months ended December 31, 2009:
| Period |
Total Number of Shares Purchased(1) |
Average Price Paid per Share |
Total Value Paid by Company | |||||
| December 1, 2009 through December 31, 2009 |
3,206 | $ | 0.33 | $ | 1,041.96 | |||
| November 1, 2009 through November 30, 2009 |
11,027 | 0.33 | 3,583.78 | |||||
| October 1, 2009 through October 31, 2009 |
— | — | — | |||||
| Total |
14,233 | $ | 4,625.74 | |||||
| (1) | All shares were originally purchased from us by directors, employees and consultants pursuant to exercises of unvested stock options. The shares repurchased by us during the months listed above represent shares that were repurchased from our directors, employees and consultants within 60 days of the termination of their employment or consulting relationship with us pursuant to our right to repurchase unvested shares at the original exercise price under the terms of our 2001 Plan and the related stock option agreements. |
56
Table of Contents
| Item 6. | Selected Financial Data |
The selected financial data set forth below are derived from our audited consolidated financial statements and may not be indicative of our future operating results. The following selected financial data should be read in conjunction with our consolidated financial statements and related notes thereto and Part II, Item 7 , Management’s Discussion and Analysis of Financial Condition and Results of Operations included elsewhere in this Annual Report.
| Years Ended December 31, | ||||||||||||||||||||
| 2009 | 2008 | 2007 | 2006 | 2005 | ||||||||||||||||
| (in thousands, except per share data) | ||||||||||||||||||||
| Consolidated Statement of Operations Data: |
||||||||||||||||||||
| Net revenues |
$ | 116,305 | $ | 146,033 | $ | 122,545 | $ | 41,471 | $ | 3,719 | ||||||||||
| Cost of net revenues(1) |
57,399 | 79,411 | 76,196 | 31,099 | 1,979 | |||||||||||||||
| Gross profit |
58,906 | 66,622 | 46,349 | 10,372 | 1,740 | |||||||||||||||
| Operating expense: |
||||||||||||||||||||
| Research and development(1) |
45,161 | 55,769 | 35,235 | 11,601 | 9,574 | |||||||||||||||
| Sales and marketing(1) |
13,955 | 16,262 | 10,348 | 4,112 | 2,247 | |||||||||||||||
| General and administrative(1) |
10,868 | 12,752 | 8,685 | 2,192 | 1,846 | |||||||||||||||
| Write off of in-process research and development |
— | 1,300 | 21,400 | — | — | |||||||||||||||
| Amortization of intangible assets |
16 | 2,735 | 2,634 | — | — | |||||||||||||||
| Restructuring charges |
2,173 | 1,259 | — | — | — | |||||||||||||||
| Impairment of goodwill and intangible assets |
208 | 113,193 | — | — | — | |||||||||||||||
| Total operating expenses |
72,381 | 203,270 | 78,302 | 17,905 | 13,667 | |||||||||||||||
| Loss from operations |
(13,475 | ) | (136,648 | ) | (31,953 | ) | (7,533 | ) | (11,927 | ) | ||||||||||
| Other income (expense), net |
142 | 229 | 31 | 482 | (269 | ) | ||||||||||||||
| Income tax (benefit) provision |
(93 | ) | (49 | ) | 44 | — | — | |||||||||||||
| Net loss |
(13,240 | ) | (136,370 | ) | (31,966 | ) | (7,051 | ) | (12,196 | ) | ||||||||||
| Accretion of redeemable convertible preferred stock |
— | — | (118 | ) | (126 | ) | (89 | ) | ||||||||||||
| Net loss attributable to common stockholders |
$ | (13,240 | ) | $ | (136,370 | ) | $ | (32,084 | ) | $ | (7,177 | ) | $ | (12,285 | ) | |||||
| Net loss per share attributable to common stockholders—basic and diluted |
$ | (0.19 | ) | $ | (2.01 | ) | $ | (2.47 | ) | $ | (1.66 | ) | $ | (3.70 | ) | |||||
| Weighted average number of shares used to compute net loss per share attributable to common stockholders |
69,834 | 67,733 | 13,011 | 4,325 | 3,317 | |||||||||||||||
| (1) | Includes stock-based compensation as follows: |
| Years Ended December 31, | |||||||||||||||
| 2009 | 2008 | 2007 | 2006 | 2005 | |||||||||||
| (in thousands) | |||||||||||||||
| Cost of revenues |
$ | 138 | $ | 251 | $ | 159 | $ | — | $ | — | |||||
| Research and development |
4,552 | 7,048 | 3,141 | 116 | — | ||||||||||
| Sales and marketing |
1,401 | 2,334 | 1,174 | 56 | 6 | ||||||||||
| General and administrative |
3,276 | 3,854 | 2,044 | 51 | 20 | ||||||||||
57
Table of Contents
| * | We adopted the fair value recognition and measurement provisions effective January 1, 2006, using the prospective transition method. For periods prior to January 1, 2006, we followed the intrinsic value recognition and measurement provisions. For further information, see Note 1 to the notes to consolidated financial statements included in this Annual Report. |
| Years Ended December 31, | |||||||||||||||||
| 2009 | 2008 | 2007 | 2006 | 2005 | |||||||||||||
| (in thousands) | |||||||||||||||||
| Consolidated Balance Sheet Data: |
|||||||||||||||||
| Cash, cash equivalents, restricted cash and marketable securities |
$ | 35,252 | $ | 34,410 | $ | 54,498 | $ | 13,674 | $ | 22,377 | |||||||
| Working capital |
58,862 | 57,965 | 69,848 | 18,865 | 23,143 | ||||||||||||
| Total assets |
83,814 | 86,602 | 226,326 | 31,224 | 28,957 | ||||||||||||
| Debt, software license and capital lease obligations—current and long-term |
— | — | 8,791 | 1,089 | 794 | ||||||||||||
| Total redeemable convertible preferred stock |
— | — | — | 80,379 | 77,275 | ||||||||||||
| Total stockholders’ equity (deficit) |
68,913 | 70,749 | 190,398 | (59,315 | ) | (52,571 | ) | ||||||||||
58
Table of Contents
| Item 7. | Management’s Discussion and Analysis of Financial Condition and Results of Operations |
The following discussion and analysis of our financial condition and results of operations should be read in conjunction with the information under Part II, Item 6, Selected Financial Data and our consolidated financial statements and related notes appearing elsewhere in this Annual Report. In addition to historical information, this discussion and analysis contains forward-looking statements that involve risks, uncertainties and assumptions. Our actual results may differ materially from those anticipated in these forward-looking statements as a result of certain factors, including but not limited to those set forth under Part I, Item 1A, Risk Factors and elsewhere in this Annual Report.
Overview
Entropic Communications is a leading fabless semiconductor company that designs, develops and markets systems solutions to enable connected home entertainment. Our technologies significantly change the way SD and HD video and other multimedia content such as movies, music, games and photos are brought into and delivered throughout the home. Our products include home networking chipsets based on the MoCA standard, high-speed broadband access chipsets, integrated circuits that simplify and enhance digital broadcast satellite services and silicon tuner integrated circuits. We use our considerable experience with service provider-based deployments to create solutions that address the complex requirements associated with delivering multiple streams of HD video into and throughout the home, while seamlessly coexisting with video, voice and data services that are using the same coaxial cable infrastructure.
In December 2004, we introduced and commenced commercial shipments of our home networking products. In the first quarter of 2006, we began commercially shipping our broadband access solutions. In May 2007, we acquired Arabella Software Ltd., or Arabella, a developer of embedded software. In June 2007, we acquired RF Magic, a provider of digital broadcast satellite outdoor unit and silicon tuner solutions. In 2008, we acquired certain specified assets of Vativ Technologies, Inc., or Vativ, a provider of high-bandwidth, advanced digital processing solutions for digital television and 10 gigabit Ethernet markets. Since inception, we have invested heavily in product development and have not yet achieved profitability on an annual basis, although we had net income of $1.0 million for the three months ended December 31, 2009. Our net revenues grew from $122.5 million in 2007 to $146.0 million in 2008 driven primarily by increased demand for our home networking products. Our net revenues decreased to $116.3 million in 2009 driven primarily by softness in demand for our home networking products and, to a lesser extent, by lower demand for our DBS products. As of December 31, 2009, we had an accumulated deficit of $242.0 million.
We generate net revenues principally by sales of our semiconductor products. We also generate service net revenues from development contracts. We principally sell our products directly to either ODMs or OEMs. We price our products based on market and competitive conditions and reduce the price of our products over time, as market and competitive conditions change, and as manufacturing costs are reduced. Our markets are generally characterized by declining average selling prices over the life of a product and, accordingly, we must reduce costs and successfully introduce new products and enhancements to maintain our gross margins.
We rely on a limited number of customers for a significant portion of our net revenues. Sales to these customers are in turn driven by service providers that purchase our customers’ products which incorporate our products. Substantially all of our net revenues are dependent upon three major service providers, Verizon through its FiOS deployment, DISH Network and DIRECTV. In addition, we are dependent on sales outside of the United States for almost all of our net revenues and expect that to continue in the future.
59
Table of Contents
We use third-party foundries and assembly and test contractors to manufacture, assemble and test our products. This outsourced manufacturing approach allows us to focus our resources on the design, sales and marketing of our products and avoid the cost associated with owning and operating our own manufacturing facility. A significant portion of our cost of net revenues consists of payments for the purchase of wafers and for manufacturing, assembly and test services.
We expect research and development expenses in future years to continue to increase in total dollars as we develop additional products and expand our business, and to fluctuate over the course of the year based on the timing of our fabrication mask costs. We also anticipate that our sales and marketing expenses will increase as we expand our domestic and international sales and marketing organization and activities and build brand awareness. Due to the lengthy sales cycles that we face, we may experience significant delays from the time we incur research and development and sales and marketing expenses until the time, if ever, that we generate sales from the related products.
Since our inception, we have funded our operations using a combination of preferred stock issuances, cash collections from customers, bank credit facilities, cash received from the exercise of stock options and proceeds from our initial public offering. We intend to continue spending substantial amounts in connection with the growth of our business and we may need to obtain additional financing to pursue our business strategy, develop new products, respond to competition and market opportunities, and acquire complementary businesses or technologies.
Critical Accounting Policies and Estimates
Our consolidated financial statements are prepared in accordance with United States generally accepted accounting principles, or GAAP. These accounting principles require us to make certain estimates and judgments that affect the reported amounts of assets and liabilities as of the dates of the consolidated financial statements, the disclosure of contingencies as of the dates of the consolidated financial statements, and the reported amounts of net revenues and expenses during the periods presented. Although we believe that our judgments and estimates are reasonable under the circumstances, actual results may differ from those estimates. If actual results or events differ materially from those contemplated by us in making these estimates, our reported financial condition and results of operations for future periods could be materially affected.
We believe the following to be our critical accounting policies because they are important to the portrayal of our financial condition and results of operations and they require critical management judgments and estimates about matters that are uncertain:
| • | revenue recognition; |
| • | warranty accrual; |
| • | inventory valuation; |
| • | stock-based compensation; |
| • | accounting for goodwill and other intangible assets; |
| • | accounting for income taxes; and |
| • | estimation of fair value of warrants to purchase preferred stock. |
Revenue Recognition
We recognize product revenues when the following fundamental criteria are met: (i) persuasive evidence of an arrangement exists, (ii) delivery has occurred or services have been rendered, (iii) the price to the customer is fixed or determinable and (iv) collection of the resulting receivable is
60
Table of Contents
reasonably assured. These criteria are usually met at the time of product shipment; however, we do not recognize revenue until all customer acceptance requirements have been met, when applicable.
A portion of our sales is made through distributors, agents or customers acting as agents, some of with which we have agreements allowing for pricing credits and/or rights of return. Product net revenues on sales made through these distributors are not recognized until the distributors ship the product to their customers.
We record reductions to net revenues for estimated product returns and pricing adjustments, such as competitive pricing programs, in the same period that the related revenue is recorded. The amount of these reductions is based on historical sales returns and other factors known at the time. If actual returns differ significantly from our estimates, such differences could have a material impact on our results of operations for the period in which the actual returns become known. To date, changes in estimated returns have not been material to net revenues in any related period.
We are party to an inventory “hubbing” arrangement with a key customer. Pursuant to this arrangement, we deliver products to the designated third-party warehouse based upon the customer’s projected needs, but do not recognize product revenue unless and until the customer removes our products from the third-party warehouse to incorporate into its own products.
We derive revenues from development contracts that involve new and unproven technologies. Revenues under these contracts are deferred until customer acceptance is obtained and other contract-specific terms have been completed. Provisions for losses related to development contracts, if any, are recognized in the period in which the loss first becomes probable and reasonably estimable. The costs associated with development contracts are included in cost of service revenue. We defer the cost of services provided under our development contracts. As of December 31, 2009 and 2008, we did not have any capitalized contract costs in inventory.
We receive royalties in exchange for an exclusive right to manufacture and sell certain products. We have determined that we are not able to reliably estimate the royalties earned in the period the sales occur. Thus, we record net revenues based on cash receipts. The royalty revenues recorded during the years ended December 31, 2009, 2008 and 2007 were $1.9 million, $2.9 million and $1.7 million, respectively, and are included in net revenues on the accompanying statements of operations.
We also have entered into arrangements to license our hardware and software, also referred to as the “nodes”, to certain members of MoCA for a period of three years and to provide upgrades when and if they become available. The agreements limit the rights to use the nodes to test compliance of the members’ own products to the MoCA specification. For these arrangements, we defer all of the license revenues when the nodes are delivered and recognize the revenues on a straight-line basis over the three-year term.
We provide rebates on our products to certain customers. At the time of the sale, we accrue 100% of the potential rebate as a reduction to revenue and do not apply a breakage factor. The amount of these reductions is based upon the terms included in various rebate agreements. We reverse the accrual for unclaimed rebate amounts as specific rebate programs contractually end or when we believe unclaimed rebates are no longer subject to payment and will not be paid. For the years ended December 31, 2009, 2008 and 2007, we reduced net revenue by $0.7 million, $0.8 million and $32,000, respectively, in connection with our rebate programs.
We allocate revenue for transactions that include multiple elements to each unit of accounting based on its relative fair value and recognize revenue for each unit of accounting when revenue recognition criteria have been met. The price charged when the element is sold separately generally
61
Table of Contents
determines fair value. When we have objective evidence of the fair values of undelivered elements but not delivered elements, we allocate revenue first to the fair value of the undelivered elements and the residual revenue is then allocated to the delivered elements. If the fair value of any undelivered element included in a multiple element arrangement cannot be objectively determined, revenue is deferred until all elements are delivered or services have been performed, or until fair value can objectively be determined for any remaining undelivered elements.
Warranty Accrual
We generally provide a warranty on our products for a period of one year; however, it may be longer for certain customers. Accordingly, we establish provisions for estimated product warranty costs at the time revenue is recognized based upon our historical activity and, additionally, for any known product warranty issues. Warranty provisions are recorded as a cost of net revenues. The determination of such provisions requires us to make estimates of product return rates and expected costs to replace or rework the products under warranty. When the actual product failure rates, cost of replacements and rework costs differ from our estimates, revisions to the estimated warranty accrual are made. Actual claims are charged against the warranty reserve.
Research and Development Costs
Research and development costs are expensed as incurred and primarily include costs related to personnel and third-party services, which consist primarily of contract labor services, fabrication masks, architecture licenses, engineering design development software and hardware tools, allocated support expenses and depreciation of equipment used in research and development.
Concentration of Credit Risk
Financial instruments that potentially subject us to concentration of credit risk consist primarily of cash and cash equivalents, marketable securities, accounts receivable, leases payable and lines of credit. Our policy is to place our cash and cash equivalents with high quality financial institutions in order to limit our credit exposure. Credit is extended based on an evaluation of the customer’s financial condition and a cash deposit is generally not required. We estimate potential losses on trade receivables on an ongoing basis.
We invest cash in deposits and money market funds with major financial institutions, U.S. government obligations and debt securities of corporations with investment grade credit ratings in a variety of industries. It is our policy to invest in instruments that have a final maturity of no longer than two years, and to maintain a portfolio weighted average maturity of no longer than 12 months.
Guarantees and Indemnifications
In the ordinary course of business, we have entered into agreements with customers that include indemnity provisions. To date, there have been no known events or circumstances that have resulted in any significant costs related to these indemnification provisions and, as a result, no liabilities have been recorded in the consolidated financial statements included in this Annual Report.
Inventories
Inventories are stated at the lower of cost (first-in, first-out) or market. Lower of cost or market adjustments reduce the carrying value of the related inventory and take into consideration reductions in sales prices, excess inventory levels and obsolete inventory. These adjustments are calculated on a part-by-part basis and, in general, represent excess inventory value on hand compared to 12 month
62
Table of Contents
demand projections. Once established, these adjustments are considered permanent and are not reversed until the related inventory is sold or disposed.
Stock-Based Compensation
We have stock incentive plans under which incentive stock options have been granted to employees and restricted stock units and non-qualified stock options have been granted to employees and non-employees. We also have an employee stock purchase plan for all eligible employees.
Our stock-based compensation cost is measured at the grant date, based on the estimated fair value of the award, and is recognized as an expense over the employee’s requisite service period. We have no stock-based compensation awards with market or performance conditions. The stock-based compensation expense attributable to awards under our 2007 Employee Stock Purchase Plan, or ESPP, was determined using the Black-Scholes option pricing model.
We also grant awards to non-employees and determine the fair value of such stock-based compensation awards granted as either the fair value of the consideration received or the fair value of the equity instruments issued, whichever is more reliably measurable. If the fair value of the equity instruments issued is used, it is measured using the stock price and other measurement assumptions as of the earlier of (1) the date at which a commitment for performance by the counterparty to earn the equity instruments is reached, or (2) the date at which the counterparty’s performance is completed.
We recognize excess tax benefits associated with stock-based compensation to stockholders’ equity only when realized. When assessing whether excess tax benefits relating to stock-based compensation have been realized, we follow the “with and without” approach excluding any indirect effects to be realized until after the utilization of all other tax benefits available to us.
The following assumptions are used to value options and awards granted under our equity incentive plans for the years ended December 31, 2009, 2008 and 2007:
| Employee Stock Options | ||||||
| Years Ended December 31, | ||||||
| 2009 | 2008 | 2007 | ||||
| Expected life (years) |
6.1 | 6.1 | 6.0 | |||
| Risk-free interest rate |
2.4% - 3.2% | 2.8% to 4.0% | 4.0% to 5.0% | |||
| Expected volatility |
76% to 80% | 68% to 70% | 68% to 73% | |||
| Expected dividend yield |
— | — | — | |||
The weighted-average grant date fair value per share of employee stock options granted during the years ended December 31, 2009, 2008 and 2007 was $1.49, $2.08 and $6.04, respectively. Stock-based compensation expense related to employees for the years ended December 31, 2009, 2008 and 2007 was $9.3 million, $13.4 million and $6.2 million, respectively. The total intrinsic value of outstanding options as of December 31, 2009, 2008, and 2007 was $11.9 million, $0.3 million and $40.5 million, respectively. The fair value of the stock options granted to non-employees was estimated using the Black-Scholes option valuation model. Stock-based compensation expense related to non-employees for the years ended December 31, 2009, 2008 and 2007 was $60,000, $0.1 million and $0.3 million, respectively.
In May 2009, we completed an offer to exchange, or the Offer to Exchange, certain employee stock options to purchase shares of our common stock that were outstanding under our 2007 Equity
63
Table of Contents
Incentive Plan, or the 2007 Plan, 2001 Plan, and RF Magic Plan on a three-for-two basis for replacement options granted under the 2007 Plan at an exercise price of $1.99 per share, which was the closing price of our common stock on May 15, 2009, as reported by The NASDAQ Global Market. At the expiration of the Offer to Exchange, we accepted elections to exchange options to purchase 1,600,000 shares of common stock and, as a result, we granted replacement options to purchase 1,000,000 shares of common stock. The replacement options have new vesting schedules with vesting dates that are determined by adding an additional vesting period of 12 months, or a shorter duration upon a change of control, to each vesting date under the existing vesting schedule of the options being replaced; however, no replacement option will vest sooner than 12 months from its date of grant, unless a change of control occurs. The incremental value attributed to the option awards exchanged resulted in approximately $60,000 of stock-based compensation, which will be recognized over the vesting period of the new option awards.
Goodwill and Intangible Assets
We record goodwill and other intangible assets based on the fair value of the assets acquired. In determining the fair value of the assets acquired, we utilize extensive accounting estimates and judgments to allocate the purchase price to the fair value of the net tangible and intangible assets acquired. We use the discounted cash flow method to estimate the value of intangible assets acquired. The estimates used to value and amortize intangible assets are consistent with the plans and estimates that we use to manage our business and are based on available historical information and industry estimates and averages.
We assess goodwill and certain intangible assets for impairment using fair value measurement techniques on an annual basis or more frequently if indicators of impairment exist. We perform an interim goodwill impairment test when it is more likely than not that the fair value of a reporting unit is less than the carrying amount. We operate as one reporting unit. The goodwill impairment test compares the implied fair value of the reporting unit’s goodwill with the carrying amount of that goodwill to measure the amount of the impairment loss, if any. The implied fair value of goodwill is determined in the same manner as in a business combination. Determining the fair value of the implied goodwill is judgmental in nature and often involves the use of significant estimates and assumptions. These estimates and assumptions could have a significant impact on whether or not an impairment charge is recognized and also the magnitude of any such charge. Estimates of fair value are primarily determined using discounted cash flows and market comparisons. These approaches use significant estimates and assumptions, including the size and timing of deployments by our customers and related projections and timing of future cash flows, discount rates reflecting the risk inherent in future cash flows, perpetual growth rates, stage of products in development, determination of appropriate market comparables, and determination of whether a premium or discount should be applied to comparables.
During the three months ended March 31, 2009, we implemented a restructuring plan (as described in greater detail in Note 2 to the notes of the consolidated financial statement included in this Annual Report). As part of the restructuring plan, we closed our Kfar Saba, Israel office and terminated all of the employees at that location. As a result of this location closure, we reassessed the intangible assets associated with our Kfar Saba, Israel office and recorded an impairment charge for the remaining $0.2 million of developed technology intangible assets associated with our 2007 acquisition of Arabella.
During December 2008, we lowered the business outlook and both of our revenue and cash flow projections primarily due to the delay of additional service providers in deploying our products and the longer term exposure associated with worsening general economic conditions. We also saw our market valuation significantly decrease during the fourth quarter of 2008 as our share price decreased
64
Table of Contents
65% from $1.41 at September 30, 2008 to $0.50 at December 31, 2008. Additionally, as a result of the depressed macroeconomic environment and resulting declines in equity values, we saw a perceived increase in the discount rate used in computing the values of the lowered projected cash flows. This resulted in a discount rate of 31% when we calculated our discounted cash flows attributable to the intangible assets.
As a result of the above impairment indicators, we performed an impairment analysis. Fair value in the impairment analysis was calculated using the expected discounted future cash flows. Expected future cash flows are estimated over the related assets remaining estimated useful lives and consist of the estimated net revenues and expenses associated with those assets. We determined the estimated future cash flow streams from the various intangible assets were largely independent of one another and, accordingly, estimated future cash flows by individual intangible asset were projected. In connection with our impairment analysis during the quarter ended December 31, 2008, we determined that goodwill and certain intangible assets were impaired and, accordingly, recorded an impairment charge of $88.1 million and $25.1 million, respectively. We determined our fixed assets were not impaired and therefore a charge was not recorded.
Purchase price amounts assigned to acquired in-process research and development, or IPR&D, are expensed immediately. For the years ended December 31, 2009, 2008 and 2007, we recorded write-offs of IPR&D of $0, $1.3 million and $21.4 million, respectively.
Accounting for Income Taxes
As part of the process of preparing our consolidated financial statements we are required to estimate our taxes in each of the jurisdictions in which we operate.
We utilize the liability method of accounting for income taxes. Under the liability method, deferred taxes are determined based on the temporary differences between the financial statement and tax basis of assets and liabilities using tax rates expected to be in effect during the years in which the basis differences reverse. A valuation allowance is recorded when it is more likely than not that some of the deferred tax assets will not be realized.
We also follow accounting guidance for the financial statement recognition, measurement and disclosure of uncertain tax positions recognized in an enterprise’s financial statements. Income tax positions must meet a more-likely-than-not recognition threshold to be recognized in any period. We recognize potential accrued interest and penalties related to unrecognized tax benefits within operations as income tax expense.
We estimate current tax expense together with assessing temporary differences resulting from differing treatment of items, such as accruals and allowances not currently deductible for tax purposes. These differences result in deferred tax assets and liabilities, which are included in our consolidated balance sheets. In general, deferred tax assets represent future tax benefits to be received when certain expenses previously recognized in our consolidated statements of operations become deductible expenses under applicable income tax laws or loss or credit carryforwards are utilized. Accordingly, realization of our deferred tax assets is dependent on future taxable income against which these deductions, losses and credits can be utilized. We must assess the likelihood that our deferred tax assets will be recovered from future taxable income and, to the extent we believe that recovery is not likely, we must establish a valuation allowance.
Management judgment is required in determining our provision for income taxes, our deferred tax assets and liabilities and any valuation allowance recorded against our net deferred tax assets. As of December 31, 2009, due to a change in the tax law related to the use of net operating loss
65
Table of Contents
carrybacks, we have recorded a receivable for alternative minimum taxes paid in a prior year. As of the same date, we recorded a full valuation allowance of $46.6 million against our remaining deferred tax assets, based on the available evidence, as we believed at that time it was more likely than not that we would not be able to utilize these deferred tax assets in the future. We intend to maintain the full valuation allowances until sufficient evidence exists to support the reversal of the valuation allowances. We make estimates and judgments about our future taxable income that are based on assumptions that are consistent with our plans and estimates. Should the actual amounts differ from our estimates, the amount of our valuation allowance could be materially impacted.
If our business opportunities outside the United States continue to grow, we may expand our international operations and staff to better support our expansion into international markets. We anticipate that this expansion would include the implementation of an international organizational structure that could result in an increasing percentage of our consolidated pre-tax income being derived from, and reinvested in, our international operations. We anticipate that this pre-tax income would be subject to foreign tax at relatively lower tax rates when compared to the U.S. federal statutory tax rate and as a consequence, our future effective income tax rate may be lower than the U.S. federal statutory rate.
As of December 31, 2009, we had federal, state and foreign net operating loss carryforwards of approximately $67.9 million, $50.1 million and $0.9 million, respectively. The federal and state net operating loss carryforwards will expire beginning in 2021 and 2013, respectively. As of the same date, we also had federal and state research and development tax credit carryforwards of $9.8 million and $9.4 million, respectively. The federal tax credit carryforward will expire commencing in 2021 while the State of California research tax credits will continue in effect indefinitely.
Utilization of net operating losses and credit carryforwards may be subject to an annual limitation due to ownership change limitations provided by the Internal Revenue Code and similar state provisions. The tax benefits related to future utilization of federal and state net operating losses and tax credit carryforwards may be limited or lost if cumulative changes in ownership exceed 50% within any three-year period. We have completed an analysis of the impact of our acquisition of RF Magic and prior changes in ownership of Entropic and RF Magic and have determined that such changes in ownership have resulted in limitations on the amount of the companies’ net operating loss and tax credit carryforwards that may be utilized in the future; however, we do not anticipate that such annual limitations will preclude the utilization of substantially all of the net operating loss and tax credit carryforwards described above in the event we become profitable. Our ability to utilize these net operating loss and tax credit carryforwards may be further limited by changes in ownership, the implementation of an international organizational structure, the issuance of common stock in future common stock offerings or transactions, or other future events. Additional limitations on the use of these tax attributes could occur in the event of disputes arising in examinations by various taxing authorities. Any carryforwards that will expire prior to utilization as a result of such limitations will be removed from deferred tax assets with a corresponding reduction of the valuation allowance.
On January 1, 2007, we adopted guidance that prescribes a recognition threshold and measurement process for recording in the financial statements uncertain tax positions taken or expected to be taken in a tax year. For the year ended December 31, 2009, we had recorded a cumulative reserve of approximately $9.5 million which was recorded as a decrease to deferred tax assets and a corresponding reduction to the valuation allowance.
66
Table of Contents
Acquisitions
Year Ended December 31, 2009
We made no acquisitions during the year ended December 31, 2009.
Year Ended December 31, 2008
In April 2008, we acquired certain specified assets of Vativ, including Vativ’s intellectual property rights, existing product lines, inventory and equipment. We paid $5.9 million in cash for the acquired assets. The results of operations of Vativ have been included in our results of operations from the date of acquisition.
The acquired assets did not include Vativ’s cash, cash equivalents, investments or any portion of Vativ’s accounts receivable. We assumed certain liabilities of Vativ equal to $0.3 million, including current accounts payable and accrued vacation liabilities for the former employees of Vativ hired by us. In addition, we committed to pay cash retention bonuses in the aggregate amount of $0.7 million to employees hired from Vativ in connection with the acquisition earned over the first 90 days of employment. The retention bonuses were recorded as expense during the service period and were not included in the assumed liabilities. In July 2008 and January 2009, we paid $0.6 million and $0.1 million, respectively, for these retention bonuses.
Year Ended December 31, 2007
In May 2007, we acquired all of the outstanding shares of Arabella in exchange for 389,000 shares of our common stock and other consideration for a total purchase price of $3.4 million. In June 2007, we acquired all of the outstanding shares of RF Magic in exchange for 13,042,000 shares of our common stock. Except for stock options held by employees of RF Magic’s French subsidiary, we also assumed each outstanding option to purchase RF Magic common stock and converted these options into options to purchase an aggregate of 2,685,000 shares of our common stock. Pursuant to put and call option agreements, as of December 31, 2009, we may issue up to 35,000 shares of our common stock in exchange for the shares of RF Magic’s common stock issuable upon exercise of the unassumed options.
We also assumed outstanding warrants to purchase RF Magic common and preferred stock and converted them into warrants to purchase 204,000 shares of our common stock. The total purchase price for the RF Magic acquisition was $151.0 million. The securities we issued or reserved for issuance pursuant to the RF Magic acquisition represented 34% of the combined company’s fully diluted capitalization as of the closing date of the acquisition (including shares available for issuance under equity incentive plans and assuming conversion of all outstanding preferred stock and exercise of all outstanding stock options and warrants).
67
Table of Contents
Results of Operations
The following table sets forth selected consolidated statements of operations data as a percentage of total net revenues for each of the periods indicated:
| Years Ended December 31, | |||||||||
| 2009 | 2008 | 2007 | |||||||
| Total net revenues |
100 | % | 100 | % | 100 | % | |||
| Total cost of net revenues |
49 | 54 | 62 | ||||||
| Gross profit |
51 | 46 | 38 | ||||||
| Operating expenses: |
|||||||||
| Research and development |
39 | 38 | 29 | ||||||
| Sales and marketing |
12 | 11 | 8 | ||||||
| General and administrative |
9 | 9 | 7 | ||||||
| Write off of in-process research and development |
— | 1 | 18 | ||||||
| Amortization of intangible assets |
— | 2 | 2 | ||||||
| Restructuring charges |
2 | 1 | — | ||||||
| Impairment of goodwill and intangible assets |
— | 77 | — | ||||||
| Total operating expenses |
62 | 139 | 64 | ||||||
| Loss from operations |
(11 | ) | (93 | ) | (26 | ) | |||
| Income taxes |
— | — | — | ||||||
| Net loss attributable to common stockholders |
(11 | )% | (93 | )% | (26 | )% | |||
Net Revenues. We generate net revenues principally by sales of our semiconductor products. We also generate service revenues from development contracts. We principally sell our products directly to either ODMs or OEMs. We price our products based on market and competitive conditions, and periodically reduce the price of our products as market and competitive conditions change and as manufacturing costs are reduced. Our markets are generally characterized by declining average selling prices over the life of a product and, accordingly, we must reduce costs and successfully introduce new products and enhancements to maintain our gross margins.
We currently rely, and expect to continue to rely, on a limited number of customers for a significant portion of our net revenues. For the years ended December 31, 2009 and 2008, four customers accounted for 58% and 74% of our net revenues, respectively. For the year ended December 31, 2007, three customers accounted for 92% of our net revenues. In addition, we depend on a limited number of service providers that purchase products from our customers that incorporate our products. To date, only a limited number of major service providers, such as Verizon, DIRECTV, Time Warner, Cox and BHN have publicly announced their intention to use the MoCA standard for home networking. We also primarily rely on two major service providers, DISH Network and DIRECTV, to deploy products using our DBS outdoor unit solutions. During the year ended December 31, 2009, products sold to our customers that were incorporated into products purchased by Verizon, DISH Network and DIRECTV accounted for substantially all of our net revenues. To date, the FiOS deployment by Verizon has been a major driver of our net revenues. We expect that we will continue to derive significant revenues from Verizon, but our reliance on Verizon as a major driver of our net revenues is decreasing as other service providers, such as DIRECTV, deploy our home networking products.
Since inception, we have derived our net revenues primarily from Asia and North America. Net revenues are allocated to the geographic region based on the shipping destination of customers’ orders. For sales to ODMs and OEMs, their geographic locations may differ from those of the ultimate
68
Table of Contents
end customers. Of our $116.3 million in net revenues in 2009, $107.1 million, $7.0 million and $2.2 million were derived from Asia, North America and Europe, respectively. Of our $146.0 million in net revenues in 2008, $139.2 million, $3.9 million and $2.9 million were derived from Asia, Europe and North America, respectively. Of our $122.5 million in net revenues in 2007, $114.6 million, $4.5 million and $3.4 million were derived from Asia, Europe and North America, respectively.
Accordingly, we are dependent on sales outside of the United States for almost all of our net revenues and expect that to continue in the future.
Cost of Net Revenues. We use third-party foundries and assembly and test contractors to manufacture, assemble and test our products. A significant portion of our cost of net revenues consists of payments for the purchase of wafers and for manufacturing, assembly and test services. To a lesser extent, cost of net revenues includes expenses relating to management of our contractors, the cost of shipping and logistics, royalties, inventory valuation charges taken for excess and obsolete inventory, warranty costs, changes in product cost due to changes in wafer manufacturing, assembly and test yields, allocated facilities expenses, amortization of inventory step-up and acquired developed technology. We currently outsource the manufacturing of our home networking and broadband access products principally to TSMC and the manufacturing of our digital broadcast satellite outdoor unit and silicon tuner products to TowerJazz. Our home networking and broadband access products are primarily assembled and tested by Amkor, while our digital broadcast satellite outdoor unit and silicon tuner products are primarily assembled by Amkor and tested by Giga Solution. We do not have a guaranteed level of production capacity from any of our subcontractors’ facilities to produce our products.
Gross Margin. Our gross margins increased year to year from 2007 to 2009, primarily due to decreased unit costs of our home networking chipsets principally as a result of more favorable manufacturing costs and the addition of net revenues as a result of our acquisition of RF Magic. Included in cost of net revenues for 2009 and 2008 was the amortization of developed technology of $1.6 million and $6.0 million, respectively, which resulted from the RF Magic and Vativ acquisitions. Included in cost of net revenues for 2007 was the amortization of the inventory step-up of $2.7 million that resulted from the RF Magic acquisition. Our gross margin has been and will continue to be affected by a variety of factors, including declines in selling prices of our products, especially as competition increases over time, product mix, the timing of cost reductions for fabricated wafers and assembly and test service costs, inventory valuation charges, purchase accounting-related charges, and changes in wafer manufacturing, assembly and test yields.
Research and Development Expenses. Research and development expenses primarily include costs related to personnel, third-party services that consist primarily of contract labor services, fabrication masks, architecture licenses, engineering design development software and hardware tools, allocated facilities expenses and depreciation of equipment used in research and development. While a substantial portion of our research and development activities are undertaken in support of our current and anticipated customers, we also invest in research and development to develop our technology. In the future, we expect some of the services currently performed by contractors to be performed internally.
We expect research and development expenses in future years to continue to increase in total dollars. We anticipate that our research and development expenses may fluctuate over the course of a year based on the timing of our development tools and supply costs, which include third-party services, masks costs and licenses.
Sales and Marketing Expenses. Sales and marketing expenses primarily include costs related to personnel, sales commissions, trade shows, marketing programs, depreciation and allocated facilities
69
Table of Contents
expenses. We plan to continue to increase the size of our sales and marketing organization to enable us to expand into existing and new markets. We also plan to continue to invest in expanding our domestic and international sales and marketing activities and building brand awareness. Due to the lengthy sales cycles that we face, we may experience significant delays from the time we incur research and development and sales expenses until the time, if ever, that we generate sales from these products.
General and Administrative Expenses. General and administrative expenses primarily include costs related to personnel, accounting and tax, legal compliance and allocated support expenses. We expect that in future years our general and administrative expenses will increase as we incur additional costs associated with supporting our business growth.
Gain on Fair Value of Warrant Liabilities. Gain on fair value of warrant liabilities reflects the change in fair value of the warrant liabilities calculated at the end of each reporting period. Upon the closing of our initial public offering in December 2007, warrants to purchase shares of our preferred stock that remained outstanding converted to warrants to purchase shares of our common stock and, as a result, are no longer subject to fair value adjustment. At that time, the then-current aggregate fair value of these warrants was reclassified from current liabilities to additional paid-in capital, and we ceased to record any related periodic fair value adjustments.
Comparison of Years Ended December 31, 2009 and 2008
Net Revenues. Our net revenues for 2009 were $116.3 million, as compared to net revenues of $146.0 million in 2008, a decrease of $29.7 million or 20.4%. The decrease in net revenues for 2009 was primarily driven by lower demand for our home networking products and, to a lesser extent, from lower demand of DBS outdoor unit chips.
Gross Profit/Gross Margin. Our gross profit and gross margin are impacted by the inclusion of amortization of developed technology in cost of net revenues. The amortization results from our acquisitions of RF Magic and Vativ as we used the purchase method of accounting and, as a result of the application of the purchase method, included in cost of net revenues for 2009 and 2008 was $1.6 million and $6.0 million, respectively, of amortization of developed technology, or a decrease of $4.4 million.
Gross profit for 2009 was $58.9 million, a decrease of $7.7 million, or 11.6%, from gross profit of $66.6 million in 2008. This decrease was primarily due to lower net revenues from the sales of our home networking chipsets and our DBS outdoor unit products, offset by lower amortization in the developed technology and improvement in the gross margin of our home networking chipsets. Gross margin increased from 45.6% for 2008 to 50.6% for 2009 primarily due to a decrease in the amortization of developed technology. Additionally, gross margin increased due to lower unit costs of our home networking chipsets, principally as a result of more favorable manufacturing costs, and slightly higher contribution to gross margin from the sales of our DBS outdoor unit products.
Research and Development Expenses. Research and development expenses decreased by $10.6 million, or 19.0%, from $55.8 million in 2008 to $45.2 million in 2009. This $10.6 million decrease was primarily due to decreased personnel costs of $8.9 million (of which $2.5 million was due to stock-based compensation) mainly resulting from a 17% decrease in the number of employees engaged in research and development activities due to the implementation of our March 2009 restructuring plan. Other factors contributing to the decrease in research and development expense include a $1.7 million reduction in development tools and supply costs, which include third-party services, masks costs and licenses that fluctuate in timing and amount from period to period, all of which resulted from a general decrease in research and development activities due to the March 2009
70
Table of Contents
restructuring plan, which included the cancellation of the development of our advanced network processor architecture and an associated product that was being staffed primarily out of our Kfar Saba, Israel location.
Sales and Marketing Expenses. Sales and marketing expenses decreased by $2.3 million, or 14.1%, from $16.3 million in 2008 to $14.0 million in 2009. This $2.3 million decrease included decreased personnel costs of $1.6 million (of which $0.9 million was due to stock-based compensation) which was primarily attributable to a 4% decrease in the number of employees engaged in sales and marketing activities resulting primarily from our reduction-in-force in March 2009. The remainder of the decrease in sales and marketing expenses, including decreases in travel related costs of $0.3 million and marketing and trade show costs of $0.3 million, was primarily due to a general decrease in business activities as a result of the decrease in the number of employees engaged in sales and marketing activities during 2009.
General and Administrative Expenses. General and administrative expenses decreased by $1.9 million, or 14.6%, from $12.8 million in 2008 to $10.9 million in 2009. This $1.9 million decrease in general and administrative expenses was primarily driven by decreases in non-personnel expenses including third-party services of $1.0 million, legal fees of $0.2 and recruiting fees of $0.3 million, primarily due to a general decrease in business activities. Additionally, personnel costs decreased by $0.2 million, primarily attributable to a small decrease in the number of employees engaged in general and administrative activities during 2009.
Write Off of In-Process Research and Development. We have incurred IPR&D amounts of $1.3 million in 2008 relating to the High Definition Multimedia Interface, or HDMI, switch products that we acquired from Vativ in April 2008 because the acquired technology had not yet reached technological feasibility and had no alternative future uses. A discounted cash flow approach was utilized in valuing the IPR&D. The value of the technology was the sum of the present value of projected debt-free net income, in excess of returns on requisite assets, over the economic life of the IPR&D.
Amortization of Intangible Assets. Amortization of intangible assets of $16,000 and $2.7 million was incurred during 2009 and 2008, respectively. The amortization of intangible assets in 2009 were from intangible assets acquired through the acquisition of RF Magic in June 2007. The amortization of intangible assets in 2008 were from intangible assets acquired through the acquisitions of Vativ in April 2008, RF Magic in June 2007 and Arabella in May 2007.
Restructuring Charges. We incurred restructuring charges totaling $2.2 million in 2009 resulting from the restructuring plan we initiated in March 2009 that resulted in a worldwide reduction-in-force of 55 employees and the closure of our Nice, France and Kfar Saba, Israel offices. All of the terminated employees received severance payments upon their effective termination. In addition, the affected French and Israeli employees continued to receive salaries until their termination became effective upon the expiration of applicable contractual or statutory notice periods.
We believe that the continued payment of salaries to the terminated Nice and Kfar Saba employees during their respective notice periods represented a one-time termination benefit since we were required by contract or law to make these payments whether or not these employees continued to work for us through their actual termination date. We also recorded restructuring charges relating to the termination of operating leases and other contract costs in the period in which we ceased to exercise the rights conveyed to us by the applicable contract. We do not expect to record additional material charges, if any, in the future with respect to the March 2009 restructuring plan.
In 2008, we incurred restructuring charges totaling $1.3 million as a result of two restructuring plans in 2008. In February 2008, we implemented a restructuring plan to exit the operating lease of
71
Table of Contents
our former corporate headquarters in San Diego, California. The original lease was effective through May 2010. No employees were terminated in connection with the February 2008 restructuring plan. In May 2008, we entered into an agreement with our landlord to terminate our operating lease, resulting in the completion of our restructuring plan. As a result, we recorded a $1.1 million restructuring charge, including $0.8 million that was incurred for the exited facility and $0.3 million related to the impairment of property and equipment and other long-term assets.
In August 2008, we implemented another restructuring plan to improve our operating cost structure. The cost reduction initiative included a reduction-in-force that included terminating 20 employees. We completed this plan in October 2008. We provided severance pay, medical and other related benefits to the employees terminated as a result of this restructuring plan. As a result of the August 2008 restructuring plan, we recorded a $0.2 million restructuring charge.
Impairment of Goodwill and Intangible Assets. The intangible assets associated with the acquisition of Arabella in 2007 were determined to be fully impaired as of March 31, 2009, as the core technology acquired will no longer be used in our ongoing business operations and there are no future cash flows associated with this technology. We made a decision in March 2009 to cease use of the technology and do not have any plans to use it in future operations. As a result, an impairment charge of $0.2 million was recorded in the first quarter of 2009.
We incurred impairment charges in 2008 for goodwill in the amount of $88.1 million and intangible assets in the amount of $25.1 million in connection with our annual impairment analysis conducted during the three months ended December 31, 2008. Goodwill was fully impaired due to the difference in fair value to carrying value of equity being greater than the book value of goodwill. Intangibles were impaired for all of the recorded intangibles which resulted from the acquisitions of RF Magic, Vativ and Arabella. The discounted cash flow method was used to estimate the remaining fair value of each intangible asset. The RF Magic developed technology asset was determined to be partially impaired and that the developed technology did not have as long of an estimated useful life as originally anticipated. Accordingly, the remaining useful life was reduced to two years and an impairment charge of $14.1 million was recorded. Additionally, the RF Magic customer relationships and trade names were determined to be fully impaired and an impairment charge of $8.1 million and $0.5 million, respectively, was recorded. The Arabella developed technology asset was determined to be partially impaired and an impairment charge of $0.6 million was recorded. The Vativ developed technology was determined to be fully impaired and an impairment charge of $1.8 million was recorded.
Other Income (expense), net. Other income (expense), net, decreased by $0.1 million, from $0.2 million for 2008 to $0.1 million, for 2009 primarily due to lower interest income resulting from lower interest rates in 2009 as compared to 2008.
Comparison of Years Ended December 31, 2008 and 2007
Revenues. Our revenues for 2008 were $146.0 million, as compared to revenues of $122.5 million in 2007, an increase of $23.5 million or 19.2%. The increase in revenues for 2008 was primarily driven by demand for our home networking products and from sales of DBS outdoor unit chips resulting from the RF Magic acquisition.
Gross Profit/Gross Margin. Gross profit for 2008 was $66.6 million, an increase of $20.3 million, or 43.7%, from gross profit of $46.3 million in 2007. This increase was primarily due to higher revenues from our home networking chipsets and the addition of revenues as a result of our acquisition of RF Magic. Gross margin increased from 37.8% for 2007 to 45.6% for 2008 primarily due to a decrease in the unit costs of our home networking chipsets principally as a result of more
72
Table of Contents
favorable manufacturing costs and from the contribution to gross margin from the sales of our DBS outdoor unit products as a result of our acquisition of RF Magic.
We accounted for our acquisitions of RF Magic and Vativ using the purchase method of accounting. As a result of the application of the purchase method, included in cost of net revenues for 2008 was $6.0 million of amortization of developed technology, and included in cost of net revenues for 2007 were $5.2 million of amortization of developed technology and the related cost of stepping up inventory to fair value at the acquisition date.
Research and Development Expenses. Research and development expenses increased by $20.5 million, or 58.3%, from $35.2 million in 2007 to $55.8 million in 2008. This $20.5 million increase was primarily due to increased personnel costs of $15.8 million (of which $4.1 million was due to stock-based compensation) which included $15.2 million primarily due to an increase in the number of employees engaged in research and development activities at the end of the periods and $0.6 million due to the Vativ retention bonuses. The increase in research and development personnel primarily resulted from the addition of employees in connection with the RF Magic acquisition in June 2007 and, to a lesser extent, from normal hiring to support the growth of our business and the addition of employees in connection with the Vativ acquisition in April 2008. The remainder of the increase was primarily due to increases in overhead allocations of $3.0 million and depreciation of $0.9 million, mainly due to higher facility-related costs, development tools and licensing expenditures of $1.1 million which were primarily driven by increased activities related to customer-driven projects. Research and development headcount increased from 193 full-time employees as of December 31, 2007 to 209 full-time employees (176 employees in research and development and 33 employees in operations) as of December 31, 2008, including employees added from the Vativ acquisition, and excluding former employees who were terminated in connection with our August 2008 reduction-in-force.
Sales and Marketing Expenses. Sales and marketing expenses increased by $5.9 million, or 57.2%, from $10.3 million in 2007 to $16.3 million in 2008. This $5.9 million increase included increased personnel costs of $3.8 million (of which $1.2 million was due to stock-based compensation), which was primarily related to an increase in the number of employees engaged in sales and marketing activities at the end of the periods. The increase in sales and marketing personnel primarily resulted from the addition of employees in connection with the RF Magic acquisition in June 2007 and, to a lesser extent, from normal hiring to support the growth of our business and the addition of employees in connection with the Vativ acquisition in April 2008. The remainder of the increase, including increases in overhead allocations of $1.0 million due to higher facility related costs, increased travel costs of $0.3 million and customer support materials of $0.4 million, was primarily due to a general increase in customer-related activities. Sales and marketing headcount increased from 57 full-time employees as of December 31, 2007 to 59 full-time employees as of December 31, 2008, including employees added from the Vativ acquisition and excluding former employees who were terminated in connection with our August 2008 reduction-in-force.
General and Administrative Expenses. General and administrative expenses increased by $4.1 million, or 46.8%, from $8.7 million in 2007 to $12.8 million in 2008. This $4.1 million increase included increased personnel costs of $2.3 million (of which $1.9 million was due to stock-based compensation), which included $2.9 million primarily related to the number of employees engaged in general and administrative activities including employees added from the RF Magic acquisition on June 30, 2007 and was offset by a reduction of $0.6 million in management bonuses as management bonuses were not earned in 2008. The increase in general and administrative personnel primarily resulted from the addition of employees in connection with the RF Magic acquisition in June 2007 and, to a lesser extent, from normal hiring to support the growth of our business. The remainder of the increases, including increases in third-party services and board fees of $1.0 million, legal fees of $0.4
73
Table of Contents
million and overhead allocations of $0.4 million, was primarily due to our being a public reporting company and a general increase in business activities. General and administrative headcount decreased from 31 full-time employees as of December 31, 2007 to 29 full-time employees as of December 31, 2008, including employees added from the Vativ acquisition and excluding former employees who were terminated in connection with our August 2008 reduction-in-force.
Write Off of In-Process Research and Development. We have written off IPR&D amounts of $1.3 million in 2008 relating to the HDMI switch products that we acquired from Vativ in April 2008 and $21.4 million relating to RF Magic’s channel stacking switch products which we acquired in the June 2007 RF Magic acquisition as of their respective acquisition dates because the acquired technologies had not yet reached technological feasibility and had no alternative future uses. A discounted cash flow approach was utilized in valuing the IPR&D. The value of the technologies was the sum of the present value of projected debt-free net income, in excess of returns on requisite assets, over the economic life of the IPR&D.
We expensed IPR&D of $21.4 million in 2007 at the date of our RF Magic acquisition relating to RF Magic’s channel stacking switch products because the acquired technology was next generation technology at an early stage of development and had not yet reached technological feasibility and had no alternative future uses. A discounted cash flow approach was utilized in valuing the IPR&D. The value of the technology was the sum of the present value of projected cash flow, in excess of returns on requisite assets, over the economic life of the IPR&D. The IPR&D charge is made up of two projects that were 22% complete at the date of acquisition. The estimated cost to complete these projects was $10.7 million. The discount rate applied to calculate the IPR&D charge was 24%.
Amortization of Intangible Assets. Amortization of intangible assets of $2.7 million and $2.6 million was incurred during 2008 and 2007, respectively. These intangible assets were acquired through the acquisitions of Vativ in April 2008, RF Magic in June 2007 and Arabella in May 2007.
Restructuring Charges. We incurred restructuring charges totaling $1.3 million in 2008 as a result of two restructuring plans in 2008. In February 2008, we implemented a restructuring plan to exit the operating lease of our former corporate headquarters in San Diego, California. The original lease was effective through May 2010. No employees were terminated in connection with the February 2008 restructuring plan. In May 2008, we entered into an agreement with our landlord to terminate our operating lease, resulting in the completion of our restructuring plan. As a result, we recorded a $1.1 million restructuring charge, including $0.8 million that was incurred for the exited facility and $0.3 million related to the impairment of property and equipment and other long-term assets.
In August 2008, we implemented another restructuring plan to improve our operating cost structure. The cost reduction initiative included a reduction-in-force that included terminating 20 employees. We completed this plan in October 2008. We provided severance pay, medical and other related benefits to the employees terminated as a result of this restructuring plan. As a result of the August 2008 restructuring plan, we recorded a $0.2 million restructuring charge.
Impairment of Goodwill and Intangible Assets. We incurred impairment charges in 2008 for goodwill in the amount of $88.1 million and intangible assets in the amount of $25.1 million in connection with our annual impairment analysis conducted in the three months ended December 31, 2008. Goodwill was fully impaired due to the difference in fair value to carrying value of equity being greater than the book value of goodwill. Intangibles were impaired for all of the recorded intangibles which resulted from the acquisitions of RF Magic, Arabella and Vativ. The discounted cash flow method was used to estimate the remaining fair value of each intangible asset. The RF Magic developed technology asset was determined to be partially impaired and that the developed
74
Table of Contents
technology did not have as long of an estimated useful life as originally anticipated. Accordingly, the remaining useful life was reduced to two years and an impairment charge of $14.1 million was recorded. Additionally, the RF Magic customer relationships and trade names were determined to be fully impaired and an impairment charge of $8.1 million and $0.5 million, respectively, was recorded. The Arabella developed technology asset was determined to be partially impaired and an impairment charge of $0.6 million was recorded. The Vativ developed technology was determined to be fully impaired and an impairment charge of $1.8 million was recorded.
Other Income, net. Other income, net, increased by $0.2 million, from $0 for 2007 to $0.2 million for 2008. Interest income increased by $0.2 million from $0.6 million for 2007 to $0.8 million for 2008 primarily due to an increase in average cash balances primarily from our initial public offering proceeds in 2008. Interest expense decreased by $0.2 million from $0.8 million for 2007 to $0.6 million for 2008 primarily as a result of paying off the $9.0 million debt incurred in 2007. These changes were offset by a $0.2 million decrease in gain on fair value of preferred stock warrant liabilities from $0.2 million in 2007 to $0 in 2008, as a result of the conversion of the preferred stock to common stock at our initial public offering date.
Quarterly Financial Data (Unaudited)
The following table presents certain quarterly financial data for the eight consecutive quarters ended December 31, 2009. The unaudited quarterly information has been prepared on the same basis as the audited consolidated financial statements and, in the opinion of management, includes all adjustments, consisting only of normal recurring adjustments, necessary for the fair presentation of this data. This information should be read in conjunction with our consolidated financial statements and related notes thereto included elsewhere in this Annual Report. We believe that our quarterly revenue, particularly the mix of revenue components, and operating results are likely to vary in the future. The operating results for any quarter are not necessarily indicative of the operating results for any future period or for any full year.
| Net Revenues |
Gross Profit |
Net Income (Loss)(1) |
Basic and Diluted Net Income (Loss) Per Share |
|||||||||||
| (in thousands, except per share data) | ||||||||||||||
| Year Ended December 31, 2009 |
||||||||||||||
| Fourth Quarter |
$ | 35,078 | $ | 18,116 | $ | 1,021 | $ | 0.01 | ||||||
| Third Quarter |
30,958 | 15,626 | (1,238 | ) | (0.02 | ) | ||||||||
| Second Quarter |
26,146 | 12,945 | (4,287 | ) | (0.06 | ) | ||||||||
| First Quarter |
24,123 | 12,219 | (8,736 | ) | (0.13 | ) | ||||||||
| Year Ended December 31, 2008 |
||||||||||||||
| Fourth Quarter |
$ | 29,531 | $ | 14,134 | $ | (118,943 | )(2) | $ | (1.74 | ) | ||||
| Third Quarter |
31,678 | 14,370 | (7,124 | ) | (0.11 | ) | ||||||||
| Second Quarter |
42,836 | 18,967 | (6,447 | ) | (0.10 | ) | ||||||||
| First Quarter |
41,988 | 19,151 | (3,856 | ) | (0.06 | ) | ||||||||
| (1) | Net loss attributable to common stockholders. |
| (2) | Includes impairment of goodwill and intangible assets of $113.2 million. |
75
Table of Contents
Liquidity and Capital Resources
As of December 31, 2009 and December 31, 2008, we had cash and cash equivalents of $35.3 million and $30.1 million, respectively, and marketable securities of $0 and $4.3 million, respectively.
We have access to a $10.0 million revolving credit line under the terms of our Loan and Security Agreement, as amended, with SVB. Our credit line will expire on April 21, 2010. Under the terms of this agreement, we may not transfer assets or collateral to, or make investments in, certain of our subsidiaries in an amount that exceeds $0.4 million per month in the aggregate. In addition, we are required to pay SVB a fee equal to 0.25% per annum, or the Unused Revolving Line Fee Percentage, of the average unused portion of the credit line on a monthly basis, in arrears, and the interest rate applicable to amounts outstanding under the credit line is at prime rate plus 0.5%. However, if the liquidity ratio is less than 1.75 to 1, then the Unused Revolving Line Fee Percentage will be increased to 0.5% per annum and the interest rate will be prime rate plus 2.0%. The amount available under the credit line cannot exceed 80% of the value of our eligible accounts receivable and may be decreased by certain commitments, such as the $1.2 million and $35,000 standby letters of credit that secure our performance under our headquarters facility lease and our San Jose, California facility lease, respectively. As of December 31, 2009, there were no other amounts outstanding under the credit line and $7.0 million was available under the credit line.
The following table shows our cash flows from operating activities, investing activities and financing activities for the years ended December 31, 2009, 2008 and 2007 (in thousands):
| Years Ended December 31, | ||||||||||||
| 2009 | 2008 | 2007 | ||||||||||
| Net cash provided by (used in) operating activities |
$ | 1,330 | $ | 524 | $ | (1,120 | ) | |||||
| Net cash provided by (used in) investing activities |
2,232 | (14,926 | ) | 2,935 | ||||||||
| Net cash provided by (used in) financing activities |
1,687 | (7,029 | ) | 43,732 | ||||||||
| Net effect of exchange rates on cash |
(68 | ) | 27 | — | ||||||||
| Total increase (decrease) in cash and cash equivalents |
$ | 5,181 | $ | (21,404 | ) | $ | 45,547 | |||||
Cash Flows from Operating Activities
Net cash provided by operating activities in 2009 was $1.3 million primarily resulting from a net loss of $13.2 million, an increase in accounts receivable of $1.6 million due to an increase of sales during the fourth quarter of 2009 and a decrease in other liabilities of $0.5 million, offset by $9.3 million in stock compensation expenses, $5.1 million in depreciation and amortization expenses, including $1.6 million attributable to amortization of developed technology, and a $2.3 million decrease in inventory as we sold the 2008 build up of inventory in the first half of 2009.
Net cash provided by operating activities in 2008 was $0.5 million. Although we had a net loss of $136.4 million, $123.2 million consisted of non-cash charges for impairment of goodwill and intangibles, amortization of developed technology and intangibles, inventory step-up and in-process research and development. Additionally, the net loss included other non-cash charges for depreciation of $3.3 million and stock-based compensation of $13.5 million. The remaining change in operating cash flows is primarily due to a $11.2 million decrease in accounts payable and accrued expenses and other current liabilities primarily due to lower inventory purchases late in 2008, a $3.3 million increase in inventory primarily due to our inventory build in preparation for the ramp of our channel stacking switch product into the DIRECTV deployment, as well as from softness in demand for our MoCA products mainly related to our Verizon FiOS deployment, and a decrease in accounts receivable of $10.6 million, primarily driven by lower sales and improved collections.
76
Table of Contents
Net cash used in operating activities in 2007 was $1.1 million, primarily consisting of a net loss of $32.0 million and increases of $14.7 million in accounts receivable primarily driven by higher sales, $3.7 million in inventory primarily driven by higher expected sales, and $1.0 million in prepaid assets due to an increase in higher costs associated with being publicly traded and general business growth. This was offset by the write off of in-process research and development of $21.4 million and increases of $9.0 million in accounts payable and accrued expenses, mostly related to the increase in inventory purchases and stock-based compensation of $6.5 million. The remaining changes in operating cash flows primarily reflect amortization of intangible assets and inventory step-up resulting from acquisitions, depreciation and amortization, and increases in accrued payroll and benefits and other long-term liabilities.
Cash Flows from Investing Activities
Net cash provided by investing activities was $2.2 million in 2009, consisting of maturities of short-term investments of $4.3 million offset by purchases of property and equipment of $2.1 million consisting primarily of lab equipment.
Net cash provided by investing activities was $14.9 million in 2008, consisting of $6.1 million of net cash used in the acquisition of specified Vativ assets in April 2008, purchases of property and equipment of $7.4 million primarily consisting of tenant improvements and equipment for our leased facilities in San Diego, California, and net purchases of short-term investments of $1.4 million.
Net cash provided by investing activities was $2.9 million in 2007, from net sales and maturities and purchases of short-term investments of $4.8 million to support general business growth and net cash provided by acquisitions of $4.1 million primarily from the acquisition of RF Magic, and offset by purchases of property and equipment of $6.0 million to support product development and general growth including building tenant improvements associated with our new building lease.
Cash Flows from Financing Activities
Net cash provided by financing activities was $1.7 million in 2009 provided by the net proceeds from common stock purchases pursuant to stock option exercises and our ESPP.
Net cash used in financing activities was $7.0 million in 2008, primarily driven by the payoff of outstanding debt in the amount of $8.9 million. This amount was offset by $2.2 million provided by the net proceeds from warrant exercises and common stock purchases, primarily pursuant to our ESPP.
Net cash provided by financing activities was $43.7 million in 2007, mainly from proceeds from issuance of common stock primarily as a result of our initial public offering in December 2007.
We believe that our cash, cash equivalents and marketable securities of $35.3 million at December 31, 2009 will be sufficient to fund our projected operating requirements through December 31, 2010. Additionally, we have $7.0 million available to us under our credit line with SVB as of December 31, 2009. This line of credit expires in April 2010 and we may seek to renew this line of credit before its current expiration date. We intend to continue spending substantial amounts in connection with the growth of our business and we may need to obtain additional financing to pursue our business strategy, develop new products, respond to competition and market opportunities, and acquire complementary businesses or technologies. However, we may have to reduce headcount or reduce business activities, such as slowing research and development plans, if our projected net revenues do not materialize due to continuing volatility in the technology sector and semiconductor industry, as well as volatility within the general economy as a whole. If we require additional financing we may not be able to obtain such financing on favorable terms or at all. If we were to raise additional
77
Table of Contents
capital through further sales of our equity securities, our stockholders would suffer dilution of their equity ownership. If we engage in debt financing, we may be required to accept terms that restrict our ability to incur additional indebtedness, prohibit us from paying dividends, repurchasing our stock or making investments, and force us to maintain specified liquidity or other ratios, any of which could harm our business, operating results and financial condition.
Contractual Obligations
The following table summarizes our contractual obligations as of December 31, 2009 (in thousands):
| Years Ending December 31, | |||||||||||||||||||||
| 2010 | 2011 | 2012 | 2013 | 2014 | Thereafter | Total | |||||||||||||||
| Operating leases |
$ | 4,880 | $ | 2,951 | $ | 2,441 | $ | 2,287 | $ | 2,316 | $ | 194 | $ | 15,069 | |||||||
| Inventory and related purchase obligations |
20,182 | — | — | — | — | — | 20,182 | ||||||||||||||
| Total |
$ | 25,062 | $ | 2,951 | $ | 2,441 | $ | 2,287 | $ | 2,316 | $ | 194 | $ | 35,251 | |||||||
Off-Balance Sheet Arrangements
During the periods presented, we did not have, nor do we currently have, any relationships with unconsolidated entities or financial partnerships, such as entities often referred to as structured finance or special purpose entities, which would have been established for the purpose of facilitating off-balance sheet arrangements or other contractually narrow or limited purposes.
Recently Issued Accounting Standards
In April 2009, the Financial Accounting Standards Board, or FASB, amended authoritative guidance which addresses the initial recognition, measurement and subsequent accounting for assets and liabilities arising from contingencies in a business combination, and requires that such assets acquired or liabilities assumed be initially recognized at fair value at the acquisition date if fair value can be determined during the measurement period. If the fair value as of the acquisition date cannot be determined, the asset acquired or liability assumed arising from a contingency is recognized only if certain criteria are met. This guidance also requires that a systematic and rational basis for subsequently measuring and accounting for the assets or liabilities be developed depending on their nature. This guidance is effective for assets or liabilities arising from contingencies in business combinations for which the acquisition date is during or after 2010. We do not anticipate the adoption of this guidance to have a material impact on our future consolidated financial statements, absent any material business combinations.
In April 2009, the FASB amended existing guidance on determining whether an impairment for investments in debt securities is other than temporary. We adopted the revised guidance on a prospective basis beginning April 1, 2009. The application of the revised guidance did not have an impact on our consolidated financial statements.
In May 2009, the FASB issued authoritative guidance establishing general standards of accounting and disclosure for events that occur subsequent to the balance sheet date but before financial statements are issued or are available to be issued, which we adopted on a prospective basis beginning April 1, 2009. The guidance requires the disclosure of the date through which an entity has evaluated subsequent events and the basis for selecting that date. The application of this guidance did not have an impact on our consolidated financial statements.
78
Table of Contents
In June 2009, the FASB issued authoritative guidance to improve financial reporting by enterprises involved with variable interest entities. The guidance is effective for interim and annual periods beginning after November 15, 2009, with earlier adoption permitted. We do not anticipate the adoption of this guidance to have a material impact on our future consolidated financial statements, absent any variable interest entities which require consolidation.
In June 2009, the FASB issued authoritative guidance establishing the Hierarchy of Generally Accepted Accounting Principles. The guidance provides for the FASB Accounting Standards Codification, or Codification, to become the single official source of authoritative, nongovernmental GAAP. The Codification did not change GAAP but reorganizes the literature. The application of this guidance did not have a material impact on our consolidated financial statements.
In August 2009, the FASB issued authoritative guidance that provides clarification for circumstances in which a quoted price in an active market for an identical liability is not available. The guidance is intended to reduce potential ambiguity in financial reporting when measuring the fair value of liabilities. The guidance was effective for the first interim reporting period beginning after issuance. The application of this guidance did not have a material impact on our consolidated financial statements.
In October 2009, the FASB issued authoritative guidance for arrangements with multiple deliverables. The guidance will allow companies to allocate arrangement consideration in multiple deliverable arrangements in a manner that better reflects the transaction’s economics. The guidance also removes non-software components of tangible products and certain software components of tangible products from the scope of existing software revenue guidance. The new guidance requires expanded qualitative and quantitative disclosures and is effective for fiscal years beginning on or after June 15, 2010. Early adoption of the guidance is permitted. We have adopted this guidance effective January 1, 2010 and anticipate that the application of this guidance will not have a material impact on our consolidated financial statements.
| Item 7A. | Quantitative and Qualitative Disclosures About Market Risk |
Foreign Currency Risk
Our sales have been historically denominated in U.S. dollars and an increase in the value of U.S. dollar relative to the currencies of the countries in which our customers operate could materially affect the demand of our non-U.S. customers for our products, leading to a reduction in orders placed by these customers, which would adversely affect our business. Our international sales and marketing operations incur expenses that are denominated in foreign currencies. These expenses could be materially affected by currency fluctuations; however, we do not consider this currency risk to be material as the related costs do not constitute a significant portion of our total spending. We outsource our wafer manufacturing, assembly, testing, warehousing and shipping operations; however all expenses related thereto are denominated in U.S. dollars. If the value of the U.S. dollar decreases relative to the currencies of the countries in which such contractors operate, the prices we are charged for their services may increase, which would adversely affect our business. Currently, we have not implemented any hedging strategies to mitigate risks related to the impact of fluctuations in currency exchange rates.
79
Table of Contents
Interest Rate Risk
We typically maintain an investment portfolio of various holdings, types and maturities. We do not use derivative financial instruments. We place our cash investments in deposits and money market funds with major financial institutions, U.S. government obligations and debt securities of corporations with strong credit ratings in a variety of industries that meet high credit quality standards, as specified in our investment policy guidelines. These guidelines also limit the amount of credit exposure to any one issue, issuer or type of instrument.
Our cash and cash equivalents are not subject to significant interest rate risk due to the short maturities of these instruments. As of December 31, 2009, the carrying value of our cash and cash equivalents approximated fair value. A change in market interest rates of 1.0% annualized would have impacted our net income from these investments by $0.3 million for the year ended December 31, 2009.
Cash Equivalents and Marketable Securities Risk
Our cash equivalents and marketable securities, consisting of U.S. Treasury and agency obligations, commercial paper, corporate notes and bonds, time deposits, foreign notes and certificates of deposits, are generally classified as held-to-maturity and are stated at cost, adjusted for amortization of premiums and discounts to maturity. In the past, certain of our short-term marketable securities were classified as available-for-sale and were stated at fair value, which was equal to cost due to the short-term maturity of these securities. In the event that there were to be a difference between fair value and cost in any of our available-for-sale securities, unrealized gains and losses on these investments would be reported as a separate component of accumulated other comprehensive income (loss).
Our investment policy for marketable securities requires that all securities mature in two years or less, with a weighted average maturity of no longer than 12 months. As of December 31, 2009, we did not carry any of these securities, but we may do so in the future. The fair value of marketable securities we may purchase fluctuates based on changes in market conditions and interest rates and is affected by the credit condition of the U.S. financial sector. Absent the unprecedented turmoil and upheaval in the U.S. financial sector, given the short-term maturities of marketable securities we may purchase, we do not believe these instruments to be subject to significant market or interest rate risk. However, the current unstable credit environment of the U.S. financial sector may lead us to incur significant realized, unrealized or impairment losses associated with our investments.
Investments in fixed rate interest earning instruments carry a degree of interest rate risk. Fixed rate securities may have their market value adversely impacted due to rising interest rates. Due in part to these factors, our future investment income may fall short of expectations due to changes in interest rates.
80
Table of Contents
The carrying value, maturity and estimated fair value of our cash equivalents and marketable securities as of December 31, 2009 and 2008, respectively, were as follows (in thousands, except interest rates):
| Carrying Value as of December 31, 2009 |
Maturity | Fair Value as of December 31, 2009 | |||||||||||||||
| 2010 | 2011 | 2012 | |||||||||||||||
| Investments |
|||||||||||||||||
| Cash equivalents |
$ | 8,143 | $ | — | $ | — | $ | — | $ | 8,143 | |||||||
| Weighted average yield |
0.01 | % | — | — | — | ||||||||||||
| Carrying Value as of December 31, 2008 |
Maturity | Fair Value as of December 31, 2008 | |||||||||||||||
| 2009 | 2010 | 2011 | |||||||||||||||
| Investments |
|||||||||||||||||
| Cash equivalents |
$ | 12,671 | $ | — | $ | — | $ | — | $ | 27,004 | |||||||
| Weighted average yield |
0.03 | % | — | — | — | ||||||||||||
| Marketable securities |
$ | 4,339 | $ | 4,339 | $ | — | $ | — | $ | 4,339 | |||||||
| Weighted average yield |
3.57 | % | 3.57 | % | — | — | |||||||||||
| Item 8. | Financial Statements and Supplementary Data |
The financial statements and supplementary data required by this item are included in Part IV, Item 15, Exhibits and Financial Statement Schedules of this Annual Report on Form 10-K.
| Item 9. | Changes in and Disagreements with Accountants on Accounting and Financial Disclosure |
Not applicable.
| Item 9A. | Controls and Procedures |
Conclusion Regarding the Effectiveness of Disclosure Controls and Procedures
We maintain disclosure controls and procedures that are designed to ensure that information required to be disclosed in our periodic reports filed with the SEC are recorded, processed, summarized and reported within the time periods specified in the SEC’s rules and forms and that such information is accumulated and communicated to our management, including our chief executive officer and chief financial officer, as appropriate, to allow for timely decisions regarding required disclosure. In designing and evaluating the disclosure controls and procedures, management recognizes that any controls and procedures, no matter how well designed and operated, can provide only reasonable assurance of achieving the desired control objectives, and no evaluation of controls and procedures can provide absolute assurance that all control issues and instances of fraud, if any, within a company have been detected. Management is required to apply its judgment in evaluating the cost-benefit relationship of possible controls and procedures.
As required by Rule 13a-15(b) of the Exchange Act, prior to filing this Annual Report, we carried out an evaluation, under the supervision and with the participation of our management, including our chief executive officer and chief financial officer, of the effectiveness of the design and operation of our disclosure controls and procedures (as defined in Rules 13a-15(e) and 15d-15(e) of the Exchange Act) as of the end of the period covered by this Annual Report. Based on their evaluation, our chief executive officer and chief financial officer concluded that our disclosure controls and procedures were effective at the reasonable assurance level as of the end of the period covered by this Annual Report.
81
Table of Contents
Management’s Report on Internal Control over Financial Reporting
Our management is responsible for establishing and maintaining adequate internal control over financial reporting, as such term is defined in Rule 13a-15(f) of the Securities Exchange Act of 1934, as amended, or the Exchange Act. Under the supervision and with the participation of our management, including our chief executive officer and chief financial officer, we conducted an evaluation of the effectiveness of our internal control over financial reporting based on the framework set forth in Internal Control—Integrated Framework issued by the Committee of Sponsoring Organizations of the Treadway Commission. Based on our evaluation under the framework set forth in Internal Control—Integrated Framework, our management concluded that our internal control over financial reporting was effective as of December 31, 2009. Ernst & Young LLP, the independent registered public accounting firm that audited the financial statements included in this Annual Report, has issued an attestation report on our internal control over financial reporting as of December 31, 2009, which is included herein.
Changes in Internal Control over Financial Reporting
An evaluation was also performed under the supervision and with the participation of our management, including our chief executive officer and chief financial officer, of any change in our internal control over financial reporting that occurred during our last fiscal quarter and that has materially affected, or is reasonably likely to materially affect, our internal control over financial reporting. That evaluation did not identify any change in our internal control over financial reporting that occurred during our latest fiscal quarter that has materially affected, or is reasonably likely to materially affect, our internal control over financial reporting.
82
Table of Contents
REPORT OF INDEPENDENT REGISTERED PUBLIC ACCOUNTING FIRM
The Board of Directors and Stockholders
Entropic Communications, Inc.
We have audited Entropic Communications, Inc.’s internal control over financial reporting as of December 31, 2009, based on criteria established in Internal Control—Integrated Framework issued by the Committee of Sponsoring Organizations of the Treadway Commission (the COSO criteria). Entropic Communications, Inc.’s management is responsible for maintaining effective internal control over financial reporting, and for its assessment of the effectiveness of internal control over financial reporting included in the accompanying Management’s Report on Internal Control over Financial Reporting. Our responsibility is to express an opinion on the company’s internal control over financial reporting based on our audit.
We conducted our audit in accordance with the standards of the Public Company Accounting Oversight Board (United States). Those standards require that we plan and perform the audit to obtain reasonable assurance about whether effective internal control over financial reporting was maintained in all material respects. Our audit included obtaining an understanding of internal control over financial reporting, assessing the risk that a material weakness exists, testing and evaluating the design and operating effectiveness of internal control based on the assessed risk, and performing such other procedures as we considered necessary in the circumstances. We believe that our audit provides a reasonable basis for our opinion.
A company’s internal control over financial reporting is a process designed to provide reasonable assurance regarding the reliability of financial reporting and the preparation of financial statements for external purposes in accordance with generally accepted accounting principles. A company’s internal control over financial reporting includes those policies and procedures that (1) pertain to the maintenance of records that, in reasonable detail, accurately and fairly reflect the transactions and dispositions of the assets of the company; (2) provide reasonable assurance that transactions are recorded as necessary to permit preparation of financial statements in accordance with generally accepted accounting principles, and that receipts and expenditures of the company are being made only in accordance with authorizations of management and directors of the company; and (3) provide reasonable assurance regarding prevention or timely detection of unauthorized acquisition, use, or disposition of the company’s assets that could have a material effect on the financial statements.
Because of its inherent limitations, internal control over financial reporting may not prevent or detect misstatements. Also, projections of any evaluation of effectiveness to future periods are subject to the risk that controls may become inadequate because of changes in conditions, or that the degree of compliance with the policies or procedures may deteriorate.
In our opinion, Entropic Communications, Inc. maintained, in all material respects, effective internal control over financial reporting as of December 31, 2009, based on the COSO criteria.
We also have audited, in accordance with the standards of the Public Company Accounting Oversight Board (United States), the consolidated balance sheets of Entropic Communications, Inc. as of December 31, 2009 and 2008, and the related consolidated statements of operations, redeemable convertible preferred stock and stockholders’ equity (deficit) and cash flows for each of the three years in the period ended December 31, 2009 and our report dated February 4, 2010 expressed an unqualified opinion thereon.
/s/ Ernst & Young LLP
San Diego, California
February 4, 2010
83
Table of Contents
| Item 9B. | Other Information |
Not applicable.
84
Table of Contents
PART III
Certain information required by Part III is omitted from this Annual Report because we intend to file our definitive proxy statement for the 2010 annual meeting of stockholders, or 2010 Proxy Statement, pursuant to Regulation 14A promulgated under the Exchange Act, not later than 120 days after the end of the year covered by this Annual Report, and such information will be included in the 2010 Proxy Statement and is hereby incorporated herein by reference. With the exception of the information specifically incorporated herein by reference from our 2010 Proxy Statement into this Annual Report, our 2010 Proxy Statement shall not be deemed to be filed as part of this Annual Report. Without limiting the foregoing, the discussions under the headings “Report of the Audit Committee” and “Report of the Compensation Committee” in our 2010 Proxy Statement are expressly excluded from any incorporation by reference into this Annual Report and are not deemed “filed” with the SEC.
| Item 10. | Directors, Executive Officers and Corporate Governance |
Information about our directors is incorporated by reference from the discussion under the heading Item 1—Election of Directors in our 2010 Proxy Statement. Information about compliance with Section 16(a) of the Exchange Act is incorporated by reference from the discussion under the heading Section 16(a) Beneficial Ownership Reporting Compliance in our 2010 Proxy Statement. Information about our Code of Business Conduct and Ethics governing our employees, including our chief executive officer, chief financial officer, chief accounting officer and our directors, is incorporated by reference from the discussion under the heading Entropic Policies on Business Ethics and Conduct in our 2010 Proxy Statement. Information regarding the procedures by which our stockholders may recommend nominees to our board of directors is incorporated by reference from the discussion under the heading Requirements, Including Deadlines, for Submission of Proxy Proposals, Nomination of Directors and Other Business of Stockholders in our 2010 Proxy Statement. Information about our audit committee, including the members of the committee, and our audit committee financial expert, is incorporated by reference from the discussion under the headings The Audit Committee and Audit Committee Financial Expert in our 2010 Proxy Statement. The balance of the information required by this item is contained in the discussion entitled Executive Officers of the Company in Part I of this Annual Report.
| Item 11. | Executive Compensation |
Information about director and executive compensation is incorporated by reference from the discussion under the headings 2009 Compensation of Non-Employee Directors; Executive Compensation; and Compensation Committee Interlocks and Insider Participation in our 2010 Proxy Statement.
| Item 12. | Security Ownership of Certain Beneficial Owners and Management and Related Stockholder Matters |
Information required by this item is incorporated by reference from the discussion under the headings Securities Ownership and Equity Compensation Plan Information in our 2010 Proxy Statement.
| Item 13. | Certain Relationships and Related Transactions, and Director Independence |
Information about certain relationships and transactions with related parties is incorporated by reference from the discussion under the headings Review of Related Person Transactions and Transactions with Related Persons in our 2010 Proxy Statement. Information about director
85
Table of Contents
independence is incorporated by reference from the discussion under the heading Director Independence in our 2010 Proxy Statement.
| Item 14. | Principal Accountant Fees and Services |
Information about the fees for professional services rendered by our independent auditors in 2009 and 2008 is incorporated by reference from the discussion under the heading Audit and Non-Audit Fees in Item 2—Ratification of Independent Registered Public Accounting Firm in our 2010 Proxy Statement. Our audit committee’s policy on pre-approval of audit and permissible non-audit services of our independent auditors is incorporated by reference from the section captioned Policy on Audit Committee Pre-Approval of Audit and Permissible Non-Audit Services of Independent Registered Public Accounting Firm in Item 2—Ratification of Independent Registered Public Accounting Firm in our 2010 Proxy Statement.
86
Table of Contents
| Item 15. | Exhibits and Financial Statement Schedules |
15(a)(1). Financial Statements.
The following consolidated financial statements, and related notes and Report of Independent Registered Public Accounting Firm are filed as part of this Annual Report:
15(a)(2). Financial Statement Schedules.
The following financial statement schedule is filed as part of this Annual Report:
| Page | ||
| S-1 |
All other financial statement schedules have been omitted because the required information is not applicable or not present in amounts sufficient to require submission of the schedule, or because the information is included in the consolidated financial statements or the notes thereto.
15(a)(3). Exhibits.
The exhibits listed in the accompanying “Index to Exhibits” are filed with, or incorporated by reference into, this Annual Report. The exhibit numbers on the “Index to Exhibits” that are followed by an asterisk (*) indicate exhibits filed with this Annual Report. All other exhibit numbers indicate exhibits filed by incorporation by reference. Exhibit numbers 10.1 through 10.18 are management contracts or compensatory plans or arrangements.
87
Table of Contents
REPORT OF INDEPENDENT REGISTERED PUBLIC ACCOUNTING FIRM
The Board of Directors and Stockholders
Entropic Communications, Inc.
We have audited the accompanying consolidated balance sheets of Entropic Communications, Inc. as of December 31, 2009 and 2008, and the related consolidated statements of operations, redeemable convertible preferred stock and stockholders’ equity (deficit), and cash flows for each of the three years in the period ended December 31, 2009. Our audits also included the financial statement schedule listed in the Index at Item 15(a)2. These financial statements and schedule are the responsibility of the Company’s management. Our responsibility is to express an opinion on these financial statements and schedule based on our audits.
We conducted our audits in accordance with standards of the Public Company Accounting Oversight Board (United States). Those standards require that we plan and perform the audits to obtain reasonable assurance about whether the financial statements are free of material misstatement. An audit includes examining, on a test basis, evidence supporting the amounts and disclosures in the financial statements. An audit also includes assessing the accounting principles used and significant estimates made by management, as well as evaluating the overall financial statement presentation. We believe that our audits provide a reasonable basis for our opinion.
In our opinion, the financial statements referred to above present fairly, in all material respects, the consolidated financial position of Entropic Communications, Inc. at December 31, 2009 and 2008, and the consolidated results of its operations and its cash flows for each of the three years in the period ended December 31, 2009 in conformity with U.S. generally accepted accounting principles. Also, in our opinion, the related financial statement schedule, when considered in relation to the basic financial statements taken as a whole, presents fairly in all material respects the information set for therein.
We also have audited, in accordance with the standards of the Public Company Accounting Oversight Board (United States), Entropic Communications, Inc.’s internal control over financial reporting as of December 31, 2009, based on criteria established in Internal Control—Integrated Framework issued by the Committee of Sponsoring Organizations of the Treadway Commission and our report dated February 4, 2010 expressed an unqualified opinion thereon.
/s/ Ernst & Young LLP
San Diego, California
February 4, 2010
F-1
Table of Contents
Consolidated Balance Sheets
(in thousands, except per share data)
| As of December 31, | ||||||||
| 2009 | 2008 | |||||||
| Assets |
||||||||
| Current assets: |
||||||||
| Cash and cash equivalents |
$ | 35,252 | $ | 30,071 | ||||
| Marketable securities |
— | 4,339 | ||||||
| Accounts receivable, net |
15,468 | 13,915 | ||||||
| Inventory |
16,353 | 18,693 | ||||||
| Prepaid expenses and other current assets |
3,302 | 2,785 | ||||||
| Total current assets |
70,375 | 69,803 | ||||||
| Property and equipment, net |
11,581 | 13,046 | ||||||
| Intangible assets, net |
1,623 | 3,469 | ||||||
| Other long-term assets |
235 | 284 | ||||||
| Total assets |
$ | 83,814 | $ | 86,602 | ||||
| Liabilities and stockholders’ equity |
||||||||
| Current liabilities: |
||||||||
| Accounts payable |
$ | 5,726 | $ | 5,166 | ||||
| Accrued payroll and benefits |
3,396 | 3,498 | ||||||
| Accrued expenses and other current liabilities |
2,217 | 2,707 | ||||||
| Deferred revenues |
174 | 467 | ||||||
| Total current liabilities |
11,513 | 11,838 | ||||||
| Stock repurchase liability |
345 | 784 | ||||||
| Other long-term liabilities |
3,043 | 3,231 | ||||||
| Stockholders’ equity: |
||||||||
| Preferred stock, $0.001 par value; 10,000 authorized, no shares issued and outstanding as of December 31, 2009 and 2008 |
— | — | ||||||
| Common stock, $0.001 par value; 200,000 shares authorized; 71,349 and 69,470 shares issued and outstanding as of December 31, 2009 and 2008, respectively |
71 | 69 | ||||||
| Additional paid-in capital |
310,796 | 299,305 | ||||||
| Accumulated deficit |
(241,907 | ) | (228,667 | ) | ||||
| Accumulated other comprehensive (loss) income |
(47 | ) | 42 | |||||
| Total stockholders’ equity |
68,913 | 70,749 | ||||||
| Total liabilities and stockholders’ equity |
$ | 83,814 | $ | 86,602 | ||||
See accompanying notes to consolidated financial statements.
F-2
Table of Contents
Consolidated Statements of Operations
(in thousands, except per share data)
| Years Ended December 31, | ||||||||||||
| 2009 | 2008 | 2007 | ||||||||||
| Net revenues |
$ | 116,305 | $ | 146,033 | $ | 122,545 | ||||||
| Cost of net revenues |
57,399 | 79,411 | 76,196 | |||||||||
| Gross profit |
58,906 | 66,622 | 46,349 | |||||||||
| Operating expenses: |
||||||||||||
| Research and development |
45,161 | 55,769 | 35,235 | |||||||||
| Sales and marketing |
13,955 | 16,262 | 10,348 | |||||||||
| General and administrative |
10,868 | 12,752 | 8,685 | |||||||||
| Write off of in-process research and development |
— | 1,300 | 21,400 | |||||||||
| Amortization of intangibles |
16 | 2,735 | 2,634 | |||||||||
| Restructuring charges |
2,173 | 1,259 | — | |||||||||
| Impairment of goodwill and intangible assets |
208 | 113,193 | — | |||||||||
| Total operating expenses |
72,381 | 203,270 | 78,302 | |||||||||
| Loss from operations |
(13,475 | ) | (136,648 | ) | (31,953 | ) | ||||||
| Other income, net |
142 | 229 | 31 | |||||||||
| Loss before income taxes |
(13,333 | ) | (136,419 | ) | (31,922 | ) | ||||||
| Income tax (benefit) provision |
(93 | ) | (49 | ) | 44 | |||||||
| Net loss |
(13,240 | ) | (136,370 | ) | (31,966 | ) | ||||||
| Accretion of redeemable convertible preferred stock |
— | — | (118 | ) | ||||||||
| Net loss attributable to common shareholders |
$ | (13,240 | ) | $ | (136,370 | ) | $ | (32,084 | ) | |||
| Net loss per share attributable to common stockholders—basic and diluted |
$ | (0.19 | ) | $ | (2.01 | ) | $ | (2.47 | ) | |||
| Weighted average number of shares used to compute net loss per share attributable to common stockholders |
69,834 | 67,733 | 13,011 | |||||||||
See accompanying notes to consolidated financial statements
F-3
Table of Contents
Consolidated Statements of Redeemable Convertible Preferred Stock and Stockholders’ Equity (Deficit)
(in thousands)
| Redeemable Convertible Preferred Stock | Additional Paid-in Capital |
Accumulated Deficit |
Total Stockholders’ Equity (Deficit) |
|||||||||||||||||||||||||||||||||||||||||||||||||||||||||
| Series A | Series B | Series C | Series D-1 | Series D-2 | Series D-3 | Common Stock | ||||||||||||||||||||||||||||||||||||||||||||||||||||||
| Shares | Amount | Shares | Amount | Shares | Amount | Shares | Amount | Shares | Amount | Shares | Amount | Shares | Amount | |||||||||||||||||||||||||||||||||||||||||||||||
| Balance as of December 31, 2006 |
16,344 | $ | 16,319 | 48,937 | $ | 36,165 | 34,926 | $ | 27,895 | — | $ | — | — | $ | — | — | $ | — | 5,604 | $ | 5 | $ | 893 | $ | (60,213 | ) | $ | (59,315 | ) | |||||||||||||||||||||||||||||||
| Issuance of common stock upon exercise of stock options for cash |
— | — | — | — | — | — | — | — | — | — | — | — | 3,161 | 3 | 2,126 | — | 2,129 | |||||||||||||||||||||||||||||||||||||||||||
| Stock-based compensation to employees |
— | — | — | — | — | — | — | — | — | — | — | — | — | — | 6,186 | — | 6,186 | |||||||||||||||||||||||||||||||||||||||||||
| Stock-based compensation to consultants |
— | — | — | — | — | — | — | — | — | — | — | — | — | — | 259 | — | 259 | |||||||||||||||||||||||||||||||||||||||||||
| Repurchase of shares of unvested common stock |
— | — | — | — | — | — | — | — | — | — | — | — | (10 | ) | — | (7 | ) | — | (7 | ) | ||||||||||||||||||||||||||||||||||||||||
| Issuance of common stock in conjunction with acquisition of Arabella Software, Ltd. |
— | — | — | — | — | — | — | — | — | — | — | — | 389 | 1 | 2,466 | — | 2,467 | |||||||||||||||||||||||||||||||||||||||||||
| Issuance of redeemable convertible preferred stock and common stock; preferred stock warrants and stock options assumed in conjunction with acquisition of RF Magic, Inc. |
— | — | — | — | — | — | 2,266 | 5,059 | 18,981 | 42,721 | 20,917 | 50,120 | 5,867 | 6 | 50,682 | — | 50,688 | |||||||||||||||||||||||||||||||||||||||||||
| Net reclassification of repurchase liability for early exercise of stock options |
— | — | — | — | — | — | — | — | — | — | — | — | — | — | 999 | — | 999 | |||||||||||||||||||||||||||||||||||||||||||
| Accretion of redeemable convertible preferred stock |
— | 8 | — | 71 | — | 39 | — | — | — | — | — | — | — | — | — | (118 | ) | (118 | ) | |||||||||||||||||||||||||||||||||||||||||
| Issuance of common stock upon exercise of warrants |
— | — | — | — | — | — | — | — | — | — | — | — | 307 | — | 42 | — | 42 | |||||||||||||||||||||||||||||||||||||||||||
| Issuance of common stock to employees |
— | — | — | — | — | — | — | — | — | — | — | — | 10 | — | 73 | — | 73 | |||||||||||||||||||||||||||||||||||||||||||
| Issuance of common stock upon initial public offering, net of issuance costs of $7,436 |
— | — | — | — | — | — | — | — | — | — | — | — | 8,000 | 8 | 40,556 | — | 40,564 | |||||||||||||||||||||||||||||||||||||||||||
| Conversion of redeemable convertible preferred stock to common stock in connection with initial public offering |
(16,344 | ) | (16,327 | ) | (48,937 | ) | (36,236 | ) | (34,926 | ) | (27,934 | ) | (2,266 | ) | (5,059 | ) | (18,981 | ) | (42,721 | ) | (20,917 | ) | (50,120 | ) | 44,828 | 45 | 178,352 | — | 178,397 | |||||||||||||||||||||||||||||||
| Net loss and comprehensive loss |
— | — | — | — | — | — | — | — | — | — | — | — | — | — | — | (31,966 | ) | (31,966 | ) | |||||||||||||||||||||||||||||||||||||||||
| Balance as of December 31, 2007 |
— | $ | — | — | $ | — | — | $ | — | — | $ | — | — | $ | — | — | $ | — | 68,156 | $ | 68 | $ | 282,627 | $ | (92,297 | ) | $ | 190,398 | ||||||||||||||||||||||||||||||||
See accompanying notes to consolidated financial statements.
F-4
Table of Contents
Entropic Communications, Inc.
Consolidated Statements of Redeemable Convertible Preferred Stock and Stockholders’ Equity (Deficit)—(Continued)
(in thousands)
| Redeemable Convertible Preferred Stock | Additional Paid-in Capital |
Accumulated Deficit |
Accumu- lated Other Compre- hensive income |
Total Stockholders’ Equity (Deficit) |
|||||||||||||||||||||||||||||||||||||||||||||||
| Series A | Series B | Series C | Series D-1 | Series D-2 | Series D-3 | Common Stock | |||||||||||||||||||||||||||||||||||||||||||||
| Shares | Amount | Shares | Amount | Shares | Amount | Shares | Amount | Shares | Amount | Shares | Amount | Shares | Amount | ||||||||||||||||||||||||||||||||||||||
| Balance as of December 31, 2007 |
— | $ | — | — | $ | — | — | $ | — | — | $ | — | — | $ | — | — | $ | — | 68,156 | $ | 68 | $ | 282,627 | $ | (92,297 | ) | $ | — | $ | 190,398 | |||||||||||||||||||||
| Issuance of common stock upon exercise of stock options for cash |
— | — | — | — | — | — | — | — | — | — | — | — | 639 | 1 | 382 | — | — | 383 | |||||||||||||||||||||||||||||||||
| Stock-based compensation to employees |
— | — | — | — | — | — | — | — | — | — | — | — | — | — | 13,392 | — | — | 13,392 | |||||||||||||||||||||||||||||||||
| Stock-based Compensation to consultants |
— | — | — | — | — | — | — | — | — | — | — | — | — | — | 95 | — | — | 95 | |||||||||||||||||||||||||||||||||
| Repurchase of share of unvested common stock |
— | — | — | — | — | — | — | — | — | — | — | — | (261 | ) | — | (237 | ) | — | — | (237 | ) | ||||||||||||||||||||||||||||||
| Net reclassification of repurchase liability for early exercise of stock options |
— | — | — | — | — | — | — | — | — | — | — | — | — | — | 981 | — | — | 981 | |||||||||||||||||||||||||||||||||
| Issuance of common stock upon exercise of warrants |
— | — | — | — | — | — | — | — | — | — | — | — | 460 | — | 1,259 | — | — | 1,259 | |||||||||||||||||||||||||||||||||
| Issuance of common stock to employees |
— | — | — | — | — | — | — | — | — | — | — | — | 476 | — | 882 | — | — | 882 | |||||||||||||||||||||||||||||||||
| Issuance cost of common stock |
— | — | — | — | — | — | — | — | — | — | — | — | — | — | (76 | ) | — | — | (76 | ) | |||||||||||||||||||||||||||||||
| Components of comprehensive income (loss): |
|||||||||||||||||||||||||||||||||||||||||||||||||||
| Net loss |
— | — | — | — | — | — | — | — | — | — | — | — | — | — | — | (136,370 | ) | — | (136,370 | ) | |||||||||||||||||||||||||||||||
| Translation adjustment |
— | — | — | — | — | — | — | — | — | — | — | — | — | — | — | — | 42 | 42 | |||||||||||||||||||||||||||||||||
| Comprehensive loss |
— | — | — | — | — | — | — | — | — | — | — | — | — | — | — | — | — | (136,328 | ) | ||||||||||||||||||||||||||||||||
| Balance as of December 31, 2008 |
— | $ | — | — | $ | — | — | $ | — | — | $ | — | — | $ | — | — | $ | — | 69,470 | $ | 69 | $ | 299,305 | $ | (228,667 | ) | $ | 42 | $ | 70,749 | |||||||||||||||||||||
See accompanying notes to consolidated financial statements.
F-5
Table of Contents
Entropic Communications, Inc.
Consolidated Statements of Redeemable Convertible Preferred Stock and Stockholders’ Equity (Deficit)—(Continued)
(in thousands)
| Redeemable Convertible Preferred Stock | Additional Paid-in Capital |
Accumulated Deficit |
Accumu- lated Other Compre- hensive Income (loss) |
Total Stock- holders’ Equity (Deficit) |
|||||||||||||||||||||||||||||||||||||||||||||||
| Series A | Series B | Series C | Series D-1 | Series D-2 | Series D-3 | Common Stock | |||||||||||||||||||||||||||||||||||||||||||||
| Shares | Amount | Shares | Amount | Shares | Amount | Shares | Amount | Shares | Amount | Shares | Amount | Shares | Amount | ||||||||||||||||||||||||||||||||||||||
| Balance as of December 31, 2008 |
— | $ | — | — | $ | — | — | $ | — | — | $ | — | — | $ | — | — | $ | — | 69,470 | $ | 69 | $ | 299,305 | $(228,667) | $ | 42 | $ | 70,749 | |||||||||||||||||||||||
| Issuance of common stock upon exercise of stock options for cash |
— | — | — | — | — | — | — | — | — | — | — | — | 1,324 | 1 | 1,156 | — | — | 1,157 | |||||||||||||||||||||||||||||||||
| Stock-based compensation to employees |
— | — | — | — | — | — | — | — | — | — | — | — | — | — | 9,307 | — | — | 9,307 | |||||||||||||||||||||||||||||||||
| Stock-based Compensation to consultants |
— | — | — | — | — | — | — | — | — | — | — | — | — | — | 60 | — | — | 60 | |||||||||||||||||||||||||||||||||
| Repurchase of shares of unvested common stock |
— | — | — | — | — | — | — | — | — | — | — | — | (64 | ) | — | (25 | ) | — | — | (25 | ) | ||||||||||||||||||||||||||||||
| Net reclassification of repurchase liability for early exercise of stock options |
— | — | — | — | — | — | — | — | — | — | — | — | — | — | 439 | — | — | 439 | |||||||||||||||||||||||||||||||||
| Issuance of common stock to employees |
— | — | — | — | — | — | — | — | — | — | — | — | 597 | 1 | 554 | — | — | 555 | |||||||||||||||||||||||||||||||||
| Release of restricted stock options |
— | — | — | — | — | — | — | — | — | — | — | — | 22 | — | — | — | — | — | |||||||||||||||||||||||||||||||||
| Components of comprehensive income (loss): |
|||||||||||||||||||||||||||||||||||||||||||||||||||
| Net loss |
— | — | — | — | — | — | — | — | — | — | — | — | — | — | — | (13,240 | ) | — | (13,240 | ) | |||||||||||||||||||||||||||||||
| Translation adjustment |
— | — | — | — | — | — | — | — | — | — | — | — | — | — | — | — | (89 | ) | (89 | ) | |||||||||||||||||||||||||||||||
| Comprehensive loss |
— | — | — | — | — | — | — | — | — | — | — | — | — | — | — | — | — | (13,329 | ) | ||||||||||||||||||||||||||||||||
| Balance as of December 31, 2009 |
— | $ | — | — | $ | — | — | $ | — | — | $ | — | — | $ | — | — | $ | — | 71,349 | $ | 71 | $ | 310,796 | $(241,907) | $ | (47) | $ | 68,913 | |||||||||||||||||||||||
See accompanying notes to consolidated financial statements.
F-6
Table of Contents
Consolidated Statements of Cash Flows
(in thousands)
| Years Ended December 31, | ||||||||||||
| 2009 | 2008 | 2007 | ||||||||||
| Operating activities: |
||||||||||||
| Net loss |
$ | (13,240 | ) | $ | (136,370 | ) | $ | (31,966 | ) | |||
| Adjustments to reconcile net loss to net cash used in operating activities: |
||||||||||||
| Depreciation and amortization |
3,478 | 3,250 | 1,620 | |||||||||
| Amortization of intangible assets |
1,638 | 8,745 | 5,115 | |||||||||
| Impairment of goodwill and intangible assets |
208 | 113,193 | — | |||||||||
| Stock-based compensation to consultants |
60 | 95 | 259 | |||||||||
| Stock-based compensation to employees |
9,307 | 13,392 | 6,186 | |||||||||
| Stock granted to employees in lieu of settlement |
— | — | 73 | |||||||||
| Interest expense attributable to amortization of debt issuance costs |
— | 476 | 194 | |||||||||
| In-process research and development |
— | 1,300 | 21,400 | |||||||||
| Revaluation of preferred stock warrant liabilities |
— | — | (173 | ) | ||||||||
| Impairment of assets related to restructuring charge |
94 | 259 | — | |||||||||
| Loss on disposal of assets |
— | 8 | — | |||||||||
| Changes in operating assets and liabilities: |
||||||||||||
| Restricted cash |
— | 58 | (58 | ) | ||||||||
| Accounts receivable |
(1,553 | ) | 10,576 | (14,653 | ) | |||||||
| Inventory |
2,340 | (3,347 | ) | (942 | ) | |||||||
| Prepaid expenses and other current assets |
(517 | ) | (547 | ) | (1,028 | ) | ||||||
| Other long-term assets |
49 | 42 | 657 | |||||||||
| Accounts payable |
559 | (9,349 | ) | 5,013 | ||||||||
| Accrued payroll and benefits |
(122 | ) | (876 | ) | 1,755 | |||||||
| Accrued expenses and other current liabilities |
(490 | ) | (1,869 | ) | 3,941 | |||||||
| Deferred revenues |
(293 | ) | 164 | 3 | ||||||||
| Other long-term liabilities |
(188 | ) | 1,324 | 1,484 | ||||||||
| Net cash provided by (used in) operating activities |
1,330 | 524 | (1,120 | ) | ||||||||
| Investing activities: |
||||||||||||
| Purchases of property and equipment |
(2,107 | ) | (7,439 | ) | (5,987 | ) | ||||||
| Purchases of marketable securities |
— | (17,144 | ) | (2,965 | ) | |||||||
| Sales/maturities of marketable securities |
4,339 | 15,770 | 7,746 | |||||||||
| Net cash (used in) provided by acquisitions |
— | (6,113 | ) | 4,141 | ||||||||
| Net cash provided by (used in) investing activities |
2,232 | (14,926 | ) | 2,935 | ||||||||
| Financing activities: |
||||||||||||
| Principal payments on software license and capital lease obligations |
— | (7,240 | ) | (705 | ) | |||||||
| Payment of debt issuance costs |
— | — | (147 | ) | ||||||||
| Principal payments on line of credit obligations |
— | (2,000 | ) | (1,144 | ) | |||||||
| Proceeds from draws on line of credit |
— | — | 3,000 | |||||||||
| Net proceeds from the issuance of common stock, net of issuance costs |
1,687 | 1,189 | 42,693 | |||||||||
| Proceeds from the exercise of warrants |
— | 1,259 | 42 | |||||||||
| Repurchase of restricted stock |
— | (237 | ) | (7 | ) | |||||||
| Net cash provided by (used in) financing activities |
1,687 | (7,029 | ) | 43,732 | ||||||||
| Net effect of exchange rates on cash |
(68 | ) | 27 | — | ||||||||
| Net increase (decrease) in cash and cash equivalents |
5,181 | (21,404 | ) | 45,547 | ||||||||
| Cash and cash equivalents at beginning of period |
30,071 | 51,475 | 5,928 | |||||||||
| Cash and cash equivalents at end of period |
$ | 35,252 | $ | 30,071 | $ | 51,475 | ||||||
See accompanying notes to consolidated financial statements.
F-7
Table of Contents
Notes to Consolidated Financial Statements
1. Organization and Summary of Significant Accounting Policies
Business
Entropic Communications, Inc. was organized under the laws of the state of Delaware on January 31, 2001. We are a fabless semiconductor company that designs, develops and markets system solutions to enable connected home entertainment.
Basis of Presentation
The accompanying audited condensed consolidated financial statements include our accounts and those of our wholly-owned subsidiaries. All inter-company accounts and transactions have been eliminated in consolidation. In preparing the accompanying audited condensed consolidated financial statements, we have evaluated subsequent events after the balance sheet date of December 31, 2009 through February 4, 2010, the date that these financial statements are issued.
We believe that our cash, cash equivalents and marketable securities of $35.3 million at December 31, 2009 will be sufficient to fund our projected operating requirements through December 31, 2010. We intend to continue spending substantial amounts in connection with the growth of our business and we may need to obtain additional financing to pursue our business strategy, develop new products, respond to competition and market opportunities, and acquire complementary businesses or technologies; however, should it appear that we would not have adequate cash to fund our planned operations as anticipated in our current projections, we may be required to reduce headcount or reduce business activities if our projected net revenues do not materialize.
Use of Estimates
The preparation of financial statements in conformity with United States generally accepted accounting principles, or GAAP, requires management to make estimates and assumptions that affect the amounts reported in the consolidated financial statements and these accompanying notes. Among the significant estimates affecting the consolidated financial statements are those related to business combinations, revenue recognition, allowance for doubtful accounts, inventory reserves, long-lived assets (including goodwill and intangible assets), warranty reserves, accrued bonuses, income taxes, valuation of equity securities and stock-based compensation. On an ongoing basis, management reviews its estimates based upon currently available information. Actual results could differ materially from those estimates.
Foreign Currency Translation
The functional currency for our foreign subsidiaries is the local currency. Assets and liabilities denominated in foreign currencies are translated using the exchange rates on the balance sheet dates. Net revenues and expenses are translated using the average exchange rates prevailing during the year. Any translation adjustments resulting from this process are shown separately as a component of accumulated other comprehensive income (loss) within stockholders’ equity (deficit) in the consolidated balance sheets. Foreign currency transaction gains and losses are reported in operating expenses, net in the consolidated statements of operations.
F-8
Table of Contents
Revenue Recognition
Our net revenues are generated principally by sales of our semiconductor products. During the years ended December 31, 2009, 2008 and 2007, product net revenues represented more than 99% of our total net revenues. We also generate service revenues from development contracts.
The majority of our sales occurs through the efforts of our direct sales force. The remainder of our sales occurs through sales representatives and distributors. During the years ended December 31, 2009, 2008 and 2007, more than 99% of our sales occurred through the efforts of our direct sales force.
We recognize product revenues when the following fundamental criteria are met: (i) persuasive evidence of an arrangement exists, (ii) delivery has occurred or services have been rendered, (iii) the price to the customer is fixed or determinable and (iv) collection of the resulting receivable is reasonably assured. These criteria are usually met at the time of product shipment; however, we do not recognize revenue until all customer acceptance requirements have been met, when applicable.
A portion of our sales is made through distributors, agents or customers acting as agents under agreements allowing for pricing credits and/or rights of return. Product net revenues on sales made through these distributors are not recognized until the distributors ship the product to their customers.
Net revenues derived from billing customers for shipping and handling costs are classified as a component of net revenues. Costs of shipping and handling charged by suppliers are classified as a component of cost of net revenues.
We record reductions to net revenues for estimated product returns and pricing adjustments, such as competitive pricing programs, in the same period that the related revenue is recorded. The amount of these reductions is based on historical sales returns and other factors known at the time. If actual returns differ significantly from our estimates, such differences would be recorded in our results of operations for the period in which the actual returns become known. To date, changes in estimated returns have not been material to net revenues in any related period.
We are party to an inventory “hubbing” arrangement with a key customer. Pursuant to this arrangement, we deliver products to the designated third-party warehouse based upon the customer’s projected needs, but do not recognize product revenue unless and until the customer removes our products from the third-party warehouse to incorporate into its own products.
We derive revenues from development contracts that involve new and unproven technologies. Revenues under these contracts are deferred until customer acceptance is obtained and other contract-specific terms have been completed. Provisions for losses related to development contracts, if any, are recognized in the period in which the loss first becomes probable and reasonably estimable. The costs associated with development contracts are included in cost of service revenue. We defer the cost of services provided under our development contracts. As of December 31, 2009 and 2008, we did not have any capitalized contract costs in inventory.
We receive royalties in exchange for an exclusive right to manufacture and sell certain products. We have determined that we are not able to reliably estimate the royalties earned in the period the sales occur. Thus, we record net revenues based on cash receipts. The royalty revenues recorded during the years ended December 31, 2009, 2008 and 2007 were $1.9 million, $2.9 million and $1.7 million, respectively, and are included in net revenues on the accompanying statements of operations.
F-9
Table of Contents
We have entered into arrangements to license our hardware and software, also referred to as the “nodes”, to certain members of the Multimedia over Coax Alliance, or MoCA, for a period of three years and to provide upgrades when and if they become available. The agreements limit the rights to use the nodes to test compliance of the members’ own products to the MoCA specification. For these arrangements, we defer all of the license revenues when the nodes are delivered and recognize the revenues on a straight-line basis over the three-year term.
We provide rebates on our products to certain customers. At the time of the sale, we accrue 100% of the potential rebate as a reduction to revenue and do not apply a breakage factor. The amount of these reductions is based upon the terms included in various rebate agreements. We reverse the accrual for unclaimed rebate amounts as specific rebate programs contractually end or when we believe unclaimed rebates are no longer subject to payment and will not be paid. For the years ended December 31, 2009, 2008 and 2007, we reduced net revenue by $0.7 million, $0.8 million and $32,000, respectively, in connection with our rebate programs.
We allocate revenue for transactions that include multiple elements to each unit of accounting based on its relative fair value and recognize revenue for each unit of accounting when revenue recognition criteria have been met. The price charged when the element is sold separately generally determines fair value. When we have objective evidence of the fair values of undelivered elements but not delivered elements, we allocate revenue first to the fair value of the undelivered elements, and the residual revenue is then allocated to the delivered elements. If the fair value of any undelivered element included in a multiple element arrangement cannot be objectively determined, revenue is deferred until all elements are delivered or services have been performed, or until fair value can objectively be determined for any remaining undelivered elements.
Concentration of Credit Risk
Financial instruments that potentially subject us to concentration of credit risk consist primarily of cash and cash equivalents, marketable securities, accounts receivable, leases payable and lines of credit. Our policy is to place our cash and cash equivalents with high quality financial institutions in order to limit our credit exposure. Credit is extended based on an evaluation of the customer’s financial condition and a cash deposit is generally not required. We estimate potential losses on trade receivables on an ongoing basis.
We invest cash in deposits and money market funds with major financial institutions, U.S. government obligations, debt securities of corporations with strong credit ratings and a variety of industries. A portion of our cash is invested in short-term, interest-bearing investment-grade instruments and Treasury money market funds. It is our policy to invest in instruments that have a final maturity of no longer than two years and to maintain a portfolio weighted average maturity of no longer than 12 months.
Cash and Cash Equivalents
Cash and cash equivalents consist of cash and money market funds. We consider all highly liquid investments with a maturity of three months or less from the date of purchase that are readily convertible into cash to be cash equivalents.
Marketable Securities
We account for marketable securities by determining the appropriate classification of such securities at the time of purchase and reevaluating such classification as of each balance sheet date. The investments are adjusted for amortization of premiums and discounts to maturity and such
F-10
Table of Contents
amortization is included in interest income. Realized gains and losses and declines in value judged to be other than temporary are determined based on the specific identification method and are reported in the consolidated statements of operations. No such losses have been recorded to date.
Fair Value of Financial Instruments
The carrying amounts of cash equivalents, marketable securities, trade receivables, accounts payable and other accrued liabilities approximate their fair value due to the relative short-term maturities. The fair value of marketable securities is determined using quoted market price for those securities. The carrying amounts of our capital lease obligations, loans payable and other long-term liabilities approximate their fair value. The fair value of capital lease obligations and loans payable was estimated based on the current interest rates available to us for debt instruments with similar terms, degrees of risk and remaining maturities.
Allowance for Doubtful Accounts
We evaluate the collectability of accounts receivable based on a combination of factors. In cases where we are aware of circumstances that may impair a specific customer’s ability to meet its financial obligations subsequent to the original sale, we will record a specific allowance against amounts due, and thereby reduce the net recognized receivable to the amount we reasonably believe will be collected. For all other customers, we recognize allowances for doubtful accounts based upon specific identification, industry and geographic concentrations, the current business environment and our historical experience. We did not record an allowance for doubtful accounts as of December 31, 2009 and 2008.
Inventories
Inventories are stated at the lower of cost (first-in, first-out) or market. Lower of cost or market adjustments reduce the carrying value of the related inventory and take into consideration reductions in sales prices, excess inventory levels and obsolete inventory. These adjustments are done on a part-by-part basis and, in general, represent excess inventory value on hand compared to 12 month demand projections. Once established, these adjustments are considered permanent and are not reversed until the related inventory is sold or disposed.
Property and Equipment
Property and equipment are stated at cost and are depreciated using the straight-line method over the estimated useful lives of the assets (three to seven years), except leasehold improvements and software which are amortized over the lesser of the estimated useful lives of the asset or the remaining lease/license term.
Goodwill and Intangible Assets
We record goodwill and other intangible assets based on the fair value of the assets acquired. In determining the fair value of the assets acquired, we utilize extensive accounting estimates and judgments to allocate the purchase price to the fair value of the net tangible and intangible assets acquired. We use the discounted cash flow method to estimate the value of intangible assets acquired. The estimates used to value and amortize intangible assets are consistent with the plans and estimates that we use to manage our business and are based on available historical information and industry estimates and averages.
We assess goodwill and certain intangible assets for impairment using fair value measurement techniques on an annual basis or more frequently if indicators of impairment exist. We perform an
F-11
Table of Contents
interim goodwill impairment test when it is more likely than not that the fair value of a reporting unit is less than the carrying amount. We operate within one reporting unit. The goodwill impairment test compares the implied fair value of the reporting unit’s goodwill with the carrying amount of that goodwill to measure the amount of the impairment loss, if any. The implied fair value of goodwill is determined in the same manner as in a business combination. Determining the fair value of the implied goodwill is judgmental in nature and often involves the use of significant estimates and assumptions. These estimates and assumptions could have a significant impact on whether or not an impairment charge is recognized and also the magnitude of any such charge. Estimates of fair value are primarily determined using discounted cash flows and market comparisons. These approaches use significant estimates and assumptions, including the size and timing of deployments by our customers and related projections and timing of future cash flows, discount rates reflecting the risk inherent in future cash flows, perpetual growth rates, stage of products in development, determination of appropriate market comparables and determination of whether a premium or discount should be applied to comparables.
During the three months ended March 31, 2009, we implemented a restructuring plan (see Note 2). As part of the restructuring plan, we closed our Kfar Saba, Israel office and terminated all of the employees at that location. As a result of this location closure, we reassessed the intangible assets associated with our Kfar Saba, Israel office and recorded an impairment charge for the remaining $0.2 million of developed technology intangible assets associated with our 2007 acquisition of Arabella Software, Ltd., or Arabella.
During December 2008, we lowered the business outlook and both of our revenue and cash flow projections primarily due to the delay of additional service providers in deploying our products and the longer term exposure associated with worsening general economic conditions. We also saw our market valuation significantly decrease during the fourth quarter of 2008 as our share price decreased 65% from $1.41 at September 30, 2008 to $0.50 at December 31, 2008. Additionally, as a result of the depressed macroeconomic environment and resulting declines in equity values, we saw a perceived increase in the discount rate used in computing the values of the lowered projected cash flows. This resulted in a discount rate of 31% when we calculated our discounted cash flows attributable to the intangible assets.
As a result of the above impairment indicators, we performed an impairment analysis. The fair value in the impairment analysis was calculated using the expected discounted future cash flows. Expected future cash flows are estimated over the related assets remaining estimated useful lives and consist of the estimated net revenues and expenses associated with those assets. We determined the estimated future cash flow streams from the various intangible assets were largely independent of one another and accordingly, estimated future cash flows by individual intangible asset were projected. In connection with our impairment analysis during the quarter ended December 31, 2008, we incurred impairment charges for goodwill in the amount of $88.1 million and intangible assets in the amount of $25.1 million. We determined our fixed assets were not impaired and therefore a charge was not recorded.
Purchase price amounts assigned to acquired in-process research and development, or IPR&D, are expensed immediately. For the years ended December 31, 2009, 2008 and 2007, we recorded write-offs of IPR&D of $0, $1.3 million and $21.4 million, respectively.
Guarantees and Indemnifications
In the ordinary course of business, we have entered into agreements with customers that include indemnity provisions. To date, there have been no known events or circumstances that have resulted in any significant costs related to these indemnification provisions and, as a result, no liabilities have been recorded in the accompanying financial statements.
F-12
Table of Contents
Warranty Accrual
We generally provide a warranty on our products for a period of one year; however, it may be longer for certain customers. Accordingly, we establish provisions for estimated product warranty costs at the time revenue is recognized based upon our historical activity and, additionally, for any known product warranty issues. Warranty provisions are recorded as a cost of net revenues. The determination of such provisions requires us to make estimates of product return rates and expected costs to replace or rework the products under warranty. When the actual product failure rates, cost of replacements and rework costs differ from our estimates, revisions to the estimated warranty accrual are made. Actual claims are charged against the warranty reserve.
Research and Development Costs
Research and development costs are expensed as incurred and primarily include costs related to personnel, outside services, which consist primarily of contract labor services, fabrication masks, architecture licenses, engineering design development software and hardware tools, allocated support expenses and depreciation of equipment used in research and development.
Software Development Costs
Software development costs are capitalized beginning when technological feasibility has been established and ending when a product is available for sale to customers. To date, the period between achieving technological feasibility and when the software is made available for sale to customers has been relatively short and software development costs qualifying for capitalization have not been significant. As such, all software development costs have been expensed as incurred in research and development expense.
Income Taxes
We utilize the liability method of accounting for income taxes. Under the liability method, deferred taxes are determined based on the temporary differences between the financial statement and tax basis of assets and liabilities using tax rates expected to be in effect during the years in which the basis differences reverse. A valuation allowance is recorded when it is more likely than not that some of the deferred tax assets will not be realized.
We follow accounting guidance for the financial statement recognition, measurement and disclosure of uncertain tax positions recognized in an enterprise’s financial statements. Income tax positions must meet a more-likely-than-not recognition threshold in order to be recognized for all income tax provisions. We recognize potential accrued interest and penalties related to unrecognized tax benefits within operations as income tax expense.
Stock-Based Compensation
We have stock incentive plans under which incentive stock options have been granted to employees and restricted stock units and non-qualified stock options have been granted to employees and non-employees. We also have an employee stock purchase plan for all eligible employees.
Our stock-based compensation cost is measured at the grant date, based on the estimated fair value of the award, and is recognized as an expense over the employee’s requisite service period. We have no stock-based compensation awards with market or performance conditions. The stock-based compensation expense attributable to awards under our 2007 Employee Stock Purchase Plan, or ESPP, was determined using the Black-Scholes option pricing model.
F-13
Table of Contents
We also grant awards to non-employees and determine the fair value of such stock-based compensation awards granted as either the fair value of the consideration received or the fair value of the equity instruments issued, whichever is more reliably measurable. If the fair value of the equity instruments issued is used, it is measured using the stock price and other measurement assumptions as of the earlier of (1) the date at which a commitment for performance by the counterparty to earn the equity instruments is reached, or (2) the date at which the counterparty’s performance is completed.
We recognize excess tax benefits associated with stock-based compensation to stockholders’ equity only when realized. When assessing whether excess tax benefits relating to stock-based compensation have been realized, we follow the “with and without” approach excluding any indirect effects to be realized until after the utilization of all other tax benefits available to us.
Segment Reporting
We are organized as, and operate in, one reportable segment: the design, development and sale of silicon integrated circuits. Products within this segment are embedded in electronic devices used to enable the delivery of multiple streams of high definition video and other multimedia content for entertainment purposes into and throughout the home. Our chief operating decision maker is our chief executive officer, or CEO. Our CEO reviews financial information presented on a consolidated basis evaluating financial performance and allocating resources. There are no segment managers who are held accountable for operations below the consolidated financial statement level. Our assets are primarily located in the United States and not allocated to any specific region. Therefore, geographic information is presented only for total revenue.
Recently Issued Accounting Standards
In April 2009, the Financial Accounting Standards Board, or FASB, amended authoritative guidance which addresses the initial recognition, measurement and subsequent accounting for assets and liabilities arising from contingencies in a business combination, and requires that such assets acquired or liabilities assumed be initially recognized at fair value at the acquisition date if fair value can be determined during the measurement period. If the fair value as of the acquisition date cannot be determined, the asset acquired or liability assumed arising from a contingency is recognized only if certain criteria are met. This guidance also requires that a systematic and rational basis for subsequently measuring and accounting for the assets or liabilities be developed depending on their nature. This guidance is effective for assets or liabilities arising from contingencies in business combinations for which the acquisition date is during or after 2010. We do not anticipate the adoption of this guidance to have a material impact on our future consolidated financial statements, absent any material business combinations.
In April 2009, the FASB amended existing guidance on determining whether an impairment for investments in debt securities is other than temporary. We adopted the revised guidance on a prospective basis beginning April 1, 2009. The application of the revised guidance did not have an impact on our consolidated financial statements.
In May 2009, the FASB issued authoritative guidance establishing general standards of accounting and disclosure for events that occur subsequent to the balance sheet date but before financial statements are issued or are available to be issued, which we adopted on a prospective basis beginning April 1, 2009. The guidance requires the disclosure of the date through which an entity has evaluated subsequent events and the basis for selecting that date. The application of this guidance did not have an impact on our consolidated financial statements.
F-14
Table of Contents
In June 2009, the FASB issued authoritative guidance to improve financial reporting by enterprises involved with variable interest entities. The guidance is effective for interim and annual periods beginning after November 15, 2009, with earlier adoption permitted. We do not anticipate the adoption of this guidance to have a material impact on our future consolidated financial statements, absent any variable interest entities which we might acquire an interest in which would require consolidation.
In June 2009, the FASB issued authoritative guidance establishing the Hierarchy of Generally Accepted Accounting Principles. The guidance provides for the FASB Accounting Standards Codification, or Codification, to become the single official source of authoritative, nongovernmental GAAP. The Codification did not change GAAP but reorganizes the literature. The application of this guidance did not have a material impact on our consolidated financial statements.
In August 2009, the FASB issued authoritative guidance that provides clarification for circumstances in which a quoted price in an active market for an identical liability is not available. The guidance is intended to reduce potential ambiguity in financial reporting when measuring the fair value of liabilities. The guidance was effective for the first interim reporting period beginning after issuance. The application of this guidance did not have a material impact on our consolidated financial statements.
In October 2009, the FASB issued authoritative guidance for arrangements with multiple deliverables. The guidance will allow companies to allocate arrangement consideration in multiple deliverable arrangements in a manner that is intended to better reflect the transaction’s economics. The guidance also removes non-software components of tangible products and certain software components of tangible products from the scope of existing software revenue guidance. The new guidance requires expanded qualitative and quantitative disclosures and is effective for fiscal years beginning on or after June 15, 2010. Early adoption of the guidance is permitted. We have adopted this guidance effective January 1, 2010 and anticipate that the application of this guidance will not have a material impact on our consolidated financial statements.
2. Supplemental Financial Information
Marketable Securities
We classify our marketable securities as held-to-maturity when we have the intent and ability to hold the securities to maturity. For the year ended December 31, 2009, we did not have any marketable securities. The held-to-maturity investments for the year ended December 31, 2008 are summarized as follows (in thousands):
| As of December 31, 2008 | ||||||||||||
| Cost | Gross Unrealized Gains |
Gross Unrealized Losses |
Fair Market Value | |||||||||
| Corporate debt |
$ | 3,753 | $ | — | $ | — | $ | 3,753 | ||||
| Asset-backed securities |
586 | — | — | 586 | ||||||||
| Total |
$ | 4,339 | $ | — | $ | — | $ | 4,339 | ||||
Fair Value of Financial Instruments
We hold certain financial assets, including cash equivalents and marketable securities that are required to be measured at fair value on a recurring basis. Cash equivalents include Treasury money market funds. Marketable securities were carried at amortized cost which approximated fair value.
F-15
Table of Contents
We use a three-tier fair value hierarchy, which prioritizes the inputs used in measuring fair value. These tiers include: Level 1, defined as observable inputs such as quoted prices in active markets; Level 2, defined as inputs other than quoted prices in active markets that are either directly or indirectly observable; and Level 3, defined as unobservable inputs in which little or no market data exists, therefore requiring an entity to develop its own assumptions.
The fair value of our financial assets was determined using the following levels of inputs as of December 31, 2009 and 2008 (in thousands):
| Fair Value Measurements as of December 31, 2009 | ||||||||||||
| Total | Level 1 | Level 2 | Level 3 | |||||||||
| Assets: |
||||||||||||
| Cash equivalents |
$ | 8,143 | $ | 8,143 | $ | — | $ | — | ||||
| Marketable securities |
— | — | — | — | ||||||||
| Total financial instruments |
$ | 8,143 | $ | 8,143 | $ | — | $ | — | ||||
| Fair Value Measurements as of December 31, 2008 | ||||||||||||
| Total | Level 1 | Level 2 | Level 3 | |||||||||
| Assets: |
||||||||||||
| Cash equivalents |
$ | 12,671 | $ | 12,671 | $ | — | $ | — | ||||
| Marketable securities |
4,339 | 4,339 | — | — | ||||||||
| Total financial instruments |
$ | 17,010 | $ | 17,010 | $ | — | $ | — | ||||
Inventories
The components of inventory are as follows (in thousands):
| As of December 31, | ||||||
| 2009 | 2008 | |||||
| Work in process |
$ | 4,177 | $ | 7,561 | ||
| Finished goods |
12,176 | 11,132 | ||||
| Total inventory |
$ | 16,353 | $ | 18,693 | ||
Property and Equipment
Property and equipment consist of the following (in thousands, except for years):
| Useful Lives (in years) |
As of December 31, | |||||||||
| 2009 | 2008 | |||||||||
| Office and laboratory equipment |
5 | $ | 9,325 | $ | 8,148 | |||||
| Computer equipment |
3 - 5 | 2,496 | 2,111 | |||||||
| Furniture and fixtures |
6 - 7 | 1,570 | 1,579 | |||||||
| Leasehold improvements |
Lease term | 5,122 | 4,938 | |||||||
| Licensed software |
1 - 3 | 1,195 | 1,235 | |||||||
| Construction in progress |
217 | 125 | ||||||||
| 19,925 | 18,136 | |||||||||
| Accumulated depreciation |
(8,344 | ) | (5,090 | ) | ||||||
| Property and equipment, net |
$ | 11,581 | $ | 13,046 | ||||||
Depreciation and amortization expense for the years ended December 31, 2009 and 2008 was $3.4 million and $3.3 million, respectively.
F-16
Table of Contents
Accrued Warranty
The following table presents a rollforward of our product warranty liability, which is included within accrued expenses and other current liabilities in the consolidated balance sheets (in thousands):
| As of December 31, | ||||||||
| 2009 | 2008 | |||||||
| Beginning balance |
$ | 348 | $ | 926 | ||||
| Expirations |
(471 | ) | (572 | ) | ||||
| Accruals for warranties issued during the year |
370 | 597 | ||||||
| Warranty rate adjustment |
— | (437 | ) | |||||
| Settlements made during the year |
(100 | ) | (166 | ) | ||||
| Ending balance |
$ | 147 | $ | 348 | ||||
Accrued Bonuses
We maintained a discretionary management bonus plan in each of 2009 and 2008. The potential bonus payments made under each of these plans are based significantly on the achievement of operational, financial and business development objectives for the calendar year. As of December 31, 2009, some but not all of the performance targets specified by the 2009 bonus plan had been achieved. We accrued $0.8 million in management bonuses for the year ended December 31, 2009. Any actual bonus amounts awarded will be at the discretion of the compensation committee of our board of directors and in accordance with the terms of the plan. For the year ended December 31, 2008, no amounts for management bonuses were accrued or expensed, as we determined during the year that the operational, financial and business objectives under the plan could not be achieved under the then-existing business conditions.
In addition to the 2009 management bonus plan, we also accrued for a discretionary bonus pool in the amount of $0.2 million as of December 31, 2009. This bonus pool was approved by the compensation committee of our board of directors in January 2010. No specific criteria were established by the compensation committee for awards under this bonus pool and the amount and timing of individual awards to eligible employees will be made at the discretion of the compensation committee or the individuals to whom the committee delegates its authority.
Other Long-Term Liabilities
The components of other long-term liabilities are as follows (in thousands):
| As of December 31, | ||||||
| 2009 | 2008 | |||||
| Deferred Rent |
$ | 2,280 | $ | 2,524 | ||
| Other |
763 | 707 | ||||
| Total |
$ | 3,043 | $ | 3,231 | ||
Restructuring Activity
We incurred restructuring charges totaling $2.2 million in 2009 pursuant to a restructuring plan we implemented in March 2009 plan that resulted in a worldwide reduction-in-force of 55 employees and the closure of our Nice, France and Kfar Saba, Israel offices. All of the terminated employees received severance payments upon their effective termination. In addition, the affected French and
F-17
Table of Contents
Israeli employees continued to receive salaries until their termination became effective upon the expiration of applicable contractual or statutory notice periods.
We believe that the continued payment of salaries to the terminated Nice and Kfar Saba employees during their respective notice periods represented a one-time termination benefit since we were required by contract or law to make these payments whether or not these employees continued to work for us through their actual termination date. We also recorded restructuring charges relating to the termination of operating leases and other contract costs in the period in which we ceased to exercise the rights conveyed to us by the applicable contract.
The following table presents a rollforward of our restructuring liability as of December 31, 2009, which is included within accrued payroll and benefits in the consolidated balance sheets (in thousands):
| Operating Lease Commitments |
Impairment of Property, Equipment and Related Expenses |
Impairment of Other Long- Term Assets |
Employee Separation Expenses |
Total | ||||||||||||||||
| Liability as of December 31, 2008 |
— | — | — | — | — | |||||||||||||||
| Additions |
6 | 188 | 2 | 1,977 | 2,173 | |||||||||||||||
| Non-cash charges |
(6 | ) | (94 | ) | (2 | ) | — | (102 | ) | |||||||||||
| Cash payments |
— | (94 | ) | — | (1,968 | ) | (2,062 | ) | ||||||||||||
| Liability as of December 31, 2009 |
$ | — | $ | — | $ | — | $ | 9 | $ | 9 | ||||||||||
The intangible assets associated with the acquisition of Arabella in 2007 were determined to be fully impaired as of March 31, 2009, as the core technology acquired will no longer be used in our ongoing business operations and there are no future cash flows associated with this technology. We made a decision in March 2009 to cease use of the technology and do not have any plans to use it in future operations. As a result, an impairment charge of $0.2 million was recorded in the first quarter of 2009.
In August 2008, we implemented a restructuring plan to improve our operating cost structure. We provided severance pay and other related benefits to the employees terminated as a result of this restructuring plan. We recorded a $0.2 million restructuring charge related to this plan.
In February 2008, we implemented a restructuring plan to exit the operating lease for our former corporate headquarters in San Diego, California. We recorded a $1.1 million restructuring charge, including $0.8 million for the exited facility and $0.3 million related to the impairment of property and equipment and other long-term assets.
The following table presents our restructuring liability as of December 31, 2008 in the consolidated balance sheets (in thousands):
| Operating Lease Commitments |
Impairment of Property, Equipment and Related Expenses |
Impairment of Other Long- Term Assets |
Employee Separation Expenses |
Total | ||||||||||||||||
| Liability as of December 31, 2007 |
$ | — | $ | — | $ | — | $ | — | $ | — | ||||||||||
| Additions |
815 | 190 | 64 | 190 | 1,259 | |||||||||||||||
| Non-cash charges |
— | (190 | ) | (64 | ) | — | (254 | ) | ||||||||||||
| Cash payments |
(815 | ) | — | — | (190 | ) | (1,005 | ) | ||||||||||||
| Liability as of December 31, 2008 |
$ | — | $ | — | $ | — | $ | — | $ | — | ||||||||||
F-18
Table of Contents
Deferred Rent
We recognize rent expense on a straight-line basis over the lease term and record landlord allowances for tenant improvements as deferred rent. The deferred rent is amortized over the lease term as a reduction of rent expense. As of December 31, 2009 and 2008, there was $2.3 million and $2.5 million, respectively, of unamortized deferred rent recorded as a component of other long-term liabilities.
Purchase Commitments
We had firm purchase order commitments for the acquisition of inventory as of December 31, 2009 and 2008 of $20.2 million and $4.3 million, respectively.
Net Loss Per Common Share
We compute basic loss per common share by dividing net loss attributable to common stockholders by the weighted average number of shares of common stock outstanding for the period. Diluted loss per share is computed using the weighted average number of shares of common stock and dilutive common equivalent shares outstanding during the year. Common equivalent shares from stock options and other common stock equivalents are excluded from the computation when their effect is antidilutive. We were in a loss position for all periods presented and, accordingly, there is no difference between basic loss per share and diluted loss per share.
The following table sets forth the computation of basic and diluted net loss per share for the periods indicated (in thousands, except per share data):
| Years Ended December 31, | ||||||||||||
| 2009 | 2008 | 2007 | ||||||||||
| Numerator: |
||||||||||||
| Net loss |
$ | (13,240 | ) | $ | (136,370 | ) | $ | (31,966 | ) | |||
| Accretion of redeemable convertible preferred stock |
— | — | (118 | ) | ||||||||
| Net loss attributable to common stockholders—basic and diluted |
$ | (13,240 | ) | $ | (136,370 | ) | $ | (32,084 | ) | |||
| Denominator: |
||||||||||||
| Weighted average number of shares of common stock outstanding |
70,298 | 68,877 | 14,772 | |||||||||
| Less: Restricted stock |
(464 | ) | (1,144 | ) | (1,761 | ) | ||||||
| Weighted average number of shares used in computing net loss per common share—basic and diluted |
69,834 | 67,733 | 13,011 | |||||||||
| Net loss per share—basic and diluted |
||||||||||||
| Net loss |
$ | (0.19 | ) | $ | (2.01 | ) | $ | (2.46 | ) | |||
| Accretion of redeemable convertible preferred stock |
— | — | (0.01 | ) | ||||||||
| Net loss attributable to common stockholders—basic and diluted |
$ | (0.19 | ) | $ | (2.01 | ) | $ | (2.47 | ) | |||
F-19
Table of Contents
Potentially dilutive securities that were not included in the diluted net loss per share calculations because they would be antidilutive, for any reason, are as follows (in thousands):
| Years Ended December 31, | ||||||
| 2009 | 2008 | 2007 | ||||
| Stock options outstanding |
9,141 | 10,154 | 6,738 | |||
| Stock reserved for issuance under put and call option agreements |
35 | 147 | 182 | |||
| Restricted stock |
312 | 893 | 2,049 | |||
| Common stock warrants |
— | — | 658 | |||
| Total |
9,488 | 11,194 | 9,627 | |||
3. Acquisitions
Year Ended December 31, 2009
We made no acquisitions during the year ended December 31, 2009.
Year Ended December 31, 2008
On April 3, 2008, we acquired certain specified assets of Vativ Technologies, Inc., or Vativ, including Vativ’s intellectual property rights, existing product lines, inventory and equipment. Vativ, a fabless semiconductor company based in San Diego, California, focused on providing high-bandwidth, advanced digital signal processing solutions for digital television and 10 gigabit Ethernet markets. We paid $5.9 million in cash for the acquired assets. The results of operations of Vativ have been included in our results of operations from the date of acquisition.
The acquired assets did not include Vativ’s cash, cash equivalents, investments or any portion of Vativ’s accounts receivable. We assumed certain liabilities of Vativ equal to $0.3 million, including current accounts payable and accrued vacation liabilities for the former employees of Vativ we hired. In addition, we committed to pay cash retention bonuses in the aggregate amount of $0.7 million to employees hired from Vativ in connection with the acquisition earned over the first 90 days of employment. The retention bonuses were recorded as expense during the service period and were not included in the assumed liabilities. In July 2008 and January 2009, we paid $0.6 million and $0.1 million, respectively, for these retention bonuses.
We accounted for the acquisition of Vativ by the purchase method of accounting and, as such, the assets acquired and liabilities assumed have been recorded at fair value. The excess of the purchase price over the fair value of net assets acquired was allocated to goodwill. The allocation of the purchase price for acquisitions requires extensive use of accounting estimates and judgments to allocate the purchase price to the identifiable tangible and intangible assets acquired and liabilities assumed based on their respective fair values. We determined the estimated fair values of in-process research and development, identifiable intangible assets and certain tangible assets of the acquisition based on information available at the time of the acquisition. Such valuations require significant estimates and assumptions including but not limited to: determining the timing and estimated costs to complete the in-process projects, estimating future cash flows and developing appropriate discount rates.
The following table summarizes the components of the purchase price (in thousands):
| Cash |
$ | 5,906 | |
| Direct acquisition costs |
207 | ||
| Total |
$ | 6,113 | |
F-20
Table of Contents
The acquisition was funded from our cash and cash equivalents balances.
The following table summarizes the estimated fair values of assets acquired and liabilities assumed in the acquisition (in thousands):
| Current assets |
$ | 16 | ||
| Property and equipment |
109 | |||
| Identifiable intangible assets |
3,180 | |||
| In-process research and development |
1,300 | |||
| Goodwill |
1,826 | |||
| Accounts payable and accrued liabilities |
(318 | ) | ||
| Total |
$ | 6,113 | ||
The identifiable intangible assets acquired from Vativ and related amortizations in 2008 are summarized below (in thousands, except for years):
| Purchase Price |
Estimated Useful Life (in years) |
Amortization 2008 | ||||||
| Intangible assets: |
||||||||
| Developed technology—amortization to cost of net revenues |
$ | 2,800 | 2 | $ | 1,050 | |||
| Backlog |
260 | 0.75 | 260 | |||||
| Customer relationships |
120 | 1 | 90 | |||||
| Total |
$ | 380 | $ | 350 | ||||
These identifiable intangible assets were being amortized on a straight-line basis.
The developed technology represents proprietary knowledge that was technologically feasible as of the valuation date and includes all fully functioning products at the date of the valuation. The amount assigned to the developed technology was assigned based on the estimated net discounted cash flows from the related product lines on the date of acquisition. In connection with our annual impairment test over goodwill and intangible assets conducted in the three months ended December 31, 2008, we determined the developed technology and customer relationships were fully impaired as a result of continuing market declines and low customer acceptance of this technology. An impairment charge was recorded in the fourth quarter of 2008 for the development technology and customer relations in the amount of $1.8 million and $30,000, respectively (see Notes 1 and 4).
The IPR&D acquired at the date of acquisition relates to Vativ’s High Definition Multimedia Interface switch product. The amount was expensed on the acquisition date because the acquired technology had not yet reached technological feasibility and had no alternative future uses. A discounted cash flow approach was utilized in valuing the IPR&D. The value of the technology was the sum of the present value of projected debt-free net income, in excess of returns on requisite assets, over the economic life of the IPR&D.
F-21
Table of Contents
Pro Forma Statements of Operations
The following unaudited pro forma financial information reflects the consolidated results of operations as if the acquisition of Vativ had occurred on January 1, 2007 and on January 1, 2008. The unaudited pro forma financial data presented are not necessarily indicative of our results of operations that might have occurred had the acquisition been completed at the beginning of the periods presented, and do not purport to represent what our consolidated results of operations might be for any future period (in thousands, except per share amounts):
| Years Ended December 31, | ||||||||
| 2008 | 2007 | |||||||
| (unaudited) | ||||||||
| Net revenues |
$ | 146,207 | $ | 122,920 | ||||
| Net loss attributable to common stockholders |
(139,352 | ) | (42,610 | ) | ||||
| Net loss per share attributable to common stockholders—basic and diluted |
2.06 | 3.27 | ||||||
Year Ended December 31, 2007
On May 1, 2007, we acquired all of the outstanding shares of Arabella for $3.4 million. The purchase consideration consisted of 389,000 shares of our common stock, cash consideration of $0.7 million, and legal and other costs of $0.3 million. Arabella, based in Israel, specialized in the design and development of embedded Linux software. The allocation of purchase price resulted in $1.3 million recorded for purchased technology that will be amortized over a five year life and $0.1 million of net tangible assets. The excess purchase price over the fair value of net tangible and intangible assets acquired resulted in $2.1 million recorded to goodwill. Since the acquisition, Arabella has been renamed Entropic Communications Israel Ltd. The results of operations of Entropic Communications Israel Ltd. have been included in our results of operations from the date of acquisition. In connection with our impairment analysis conducted in the three months ended December 31, 2008, we determined the intangible assets were impaired and, accordingly, recorded an impairment charge of $25.1 million (see Notes 1 and 4).
On June 30, 2007, we acquired RF Magic, a provider of digital broadcast satellite outdoor unit and silicon tuner solutions for 5,898,000 shares of our common stock and 2,278,000, 19,082,000 and 21,028,000 shares of shares of our newly created Series D-1, Series D-2 and Series D-3 redeemable convertible preferred stock, respectively. The securities we issued or reserved for issuance pursuant to the acquisition were equal to 34% of our combined fully diluted capitalization. The results of operations of RF Magic have been included in our consolidated financial statements from the date of acquisition.
In connection with the RF Magic acquisition, we entered into an escrow agreement pursuant to which (i) 885,000 shares of our common stock and (ii) shares of our Series D redeemable convertible preferred stock that are convertible into an aggregate of 1,956,000 shares of our common stock, were deposited into an escrow account to potentially be used to satisfy certain indemnification claims. On November 14, 2007, we and the representative of the former RF Magic stockholders agreed that 90,000 of these escrowed shares (calculated on an as-converted to common stock basis) would be distributed to us to satisfy an indemnification claim made by us and that the remaining shares would thereafter be released to the former RF Magic stockholders.
In connection with the acquisition of RF Magic, we assumed RF Magic common stock warrants that were outstanding on June 30, 2007 and they were included in the purchase price. The warrant holders exercised all of the outstanding warrants during the year ended December 31, 2007 and purchased an aggregate of 307,000 shares of our common stock and no warrants were outstanding at December 31, 2008.
F-22
Table of Contents
The fair value of common stock and redeemable convertible preferred stock issued to the stockholders of RF Magic was determined based on the fair value of our common stock and redeemable convertible preferred stock as of June 30, 2007. In order to calculate fair value, we utilized a probability-weighted expected return method consistent with the recommendations of the AICPA Audit and Accounting Practice Aid Series, Valuation of Privately-Held Company Equity Securities Issued as Compensation. We utilized the following four scenarios in the probability weighted calculation: liquidation, initial public offering, merger or acquisition, and status-quo. An enterprise value was calculated for us under each of the scenarios based on either the income, market or cost approach. From the enterprise value, a market value of equity was derived by reducing the enterprise value by excess balance sheet cash and deductions for debt and other obligations. The probability-weighted expected return method was then used to allocate the market value of equity to the various classes of stock.
The fair values of our common and redeemable convertible preferred stock issued in the acquisition of RF Magic were:
| Class of stock |
Value per share | ||
| Common stock |
$ | 7.22 | |
| Series D-1 redeemable convertible preferred stock |
2.23 | ||
| Series D-2 redeemable convertible preferred stock |
2.25 | ||
| Series D-3 redeemable convertible preferred stock |
2.40 | ||
Except for stock options held by employees of RF Magic’s French subsidiary, we assumed each outstanding option to purchase RF Magic common stock and converted these options into options to purchase an aggregate of 2,685,000 shares of common stock. The fair value of stock options assumed was calculated utilizing the Black-Scholes option pricing model with a risk free rate of return of 4.9%-5.0%, volatility of 73% and an expected term for each option assumed ranging from 2.5–6.0 years. Pursuant to put and call option agreements, as of December 31, 2009, we may issue up to 35,000 shares of our common stock in exchange for the shares of RF Magic’s common stock issuable upon exercise of the options not assumed.
The total cost of the acquisitions was as follows (in thousands):
| Arabella | RF Magic | Total | |||||||
| Cash |
$ | 650 | $ | — | $ | 650 | |||
| Common stock issued |
2,466 | 42,583 | 45,049 | ||||||
| Redeemable convertible preferred stock issued |
— | 98,405 | 98,405 | ||||||
| Options and warrants assumed |
— | 9,566 | 9,566 | ||||||
| Direct acquisition costs |
315 | 572 | 887 | ||||||
| Total |
$ | 3,431 | $ | 151,126 | $ | 154,557 | |||
As a result of the acquisition of RF Magic, we assumed the outstanding indebtedness owed under a venture loan and security agreement with Horizon Technology Funding Company LLC totaling $7.0 million; lease obligations for office space totaling $0.3 million and software development tools totaling $0.2 million; and open purchase order commitments totaling $0.8 million. The office lease was subsequently amended to increase the related obligation by $0.1 million.
We have accounted for the acquisitions under the purchase method of accounting. Under the purchase method of accounting, the purchase price is allocated to the net tangible and intangible assets based on their estimated fair values as of the acquisition date.
F-23
Table of Contents
The purchase price allocations are shown below (in thousands):
| Arabella | RF Magic | Total | ||||||||||
| Cash and cash equivalents |
$ | 127 | $ | 5,551 | $ | 5,678 | ||||||
| Accounts receivable |
31 | 2,350 | 2,381 | |||||||||
| Inventory |
— | 8,418 | 8,418 | |||||||||
| Other current assets |
23 | 659 | 682 | |||||||||
| Property and equipment |
61 | 1,452 | 1,513 | |||||||||
| Other long-term assets |
— | 34 | 34 | |||||||||
| Accounts payable and accrued expenses |
(168 | ) | (2,090 | ) | (2,258 | ) | ||||||
| Accrued payroll and benefits |
(23 | ) | (1,696 | ) | (1,719 | ) | ||||||
| Long-term debt |
— | (7,000 | ) | (7,000 | ) | |||||||
| Other long-term liabilities |
— | (88 | ) | (88 | ) | |||||||
| Net tangible assets |
51 | 7,590 | 7,641 | |||||||||
| Developed technology |
1,260 | 24,800 | 26,060 | |||||||||
| Customer relationships |
— | 10,800 | 10,800 | |||||||||
| Backlog |
— | 1,400 | 1,400 | |||||||||
| Trade name |
— | 1,000 | 1,000 | |||||||||
| In-process research and development |
— | 21,400 | 21,400 | |||||||||
| Goodwill |
2,120 | 84,136 | 86,256 | |||||||||
| Total purchase price |
$ | 3,431 | $ | 151,126 | $ | 154,557 | ||||||
As a result of the required adjustment of acquired assets and liabilities to their fair value at the date of purchase, we increased inventory by $2.7 million over the historical cost. The increased inventory value was recorded as a component of cost of net revenues as the related products were sold.
The goodwill amounts recorded for the acquisition of Arabella and RF Magic were not deductible for tax purposes and were assessed annually for impairment (see Notes 1 and 4). The weighted average amortization period of the unamortized identifiable intangible assets is one year as of December 31, 2009.
The developed technology represents proprietary knowledge that was technologically feasible as of the valuation date, and included all fully functioning products at the date of the valuation. The amount assigned to the developed technology was assigned based on the estimated net discounted cash flows from the related product lines on the date of acquisition. The developed technology was being amortized on a straight-line basis over a useful life of five years.
The customer relationships, backlog, and trade name were being amortized on a straight-line basis over a useful life of six years, six months and three years, respectively.
In connection with our impairment analysis conducted in the three months ended December 31, 2008, we determined the developed technology did not have as long of an estimated useful life as originally anticipated. Accordingly, the remaining useful life was reduced to two years and an impairment charge of $14.7 million was recorded related to this developed technology, and the customer relationships and trade names were determined to be fully impaired and an impairment charge of $8.1 million and $0.5 million, respectively, was recorded. Additionally, goodwill was determined to be fully impaired as of December 31, 2008 (see Notes 1 and 4).
Acquired IPR&D at the date of acquisition relates to RF Magic’s channel stacking switch products. The amount was expensed on the acquisition date because the acquired technology had
F-24
Table of Contents
not yet reached technological feasibility and had no alternative future uses. A discounted cash flow approach was utilized in valuing the IPR&D. The value of the technology was the sum of the present value of projected debt-free net income, in excess of returns on requisite assets, over the economic life of the IPR&D.
4. Goodwill and Intangible Assets
In conjunction with our March 2009 restructuring plan, we determined that the intangible assets associated with the acquisition of Arabella in 2007 were fully impaired, as the core technology acquired will no longer be used in our ongoing business operations and there are no future cash flows associated with this technology. As a result, an impairment charge of $0.2 million was recorded in 2009.
In the year ended December 31, 2008, we completed our annual impairment test over goodwill and intangible assets. We determined an impairment of goodwill and intangible assets was present. We recorded a total impairment charge of $25.1 million for intangible assets and $88.1 million for the full balance of goodwill.
The rollforward of intangible assets is as follows (in thousands):
| Year Ended December 31, 2009 | ||||||||||||||
| Gross | Accumulated Amortization |
Impairment | Net | |||||||||||
| Developed technology |
$ | 26,060 | $ | (24,229 | ) | $ | (208 | ) | $ | 1,623 | ||||
| Year Ended December 31, 2008 | ||||||||||||||
| Gross | Accumulated Amortization |
Impairment | Net | |||||||||||
| Developed technology |
$ | 28,860 | $ | (8,910 | ) | $ | (16,481 | ) | $ | 3,469 | ||||
| Customer relationships |
10,920 | (2,790 | ) | (8,130 | ) | — | ||||||||
| Backlog |
1,660 | (1,660 | ) | — | — | |||||||||
| Trade name |
1,000 | (500 | ) | (500 | ) | — | ||||||||
| $ | 42,440 | $ | (13,860 | ) | $ | (25,111 | ) | $ | 3,469 | |||||
The estimated future amortization expense of intangible assets charged to cost of net revenues and operating expenses as of December 31, 2009 is $1.6 million in the year ended December 31, 2010.
5. Liquidity and Capital Resources
We have access to a $10.0 million revolving credit line under the terms of our Loan and Security Agreement, as amended, with Silicon Valley Bank, or SVB. Our credit line with SVB will expire on April 21, 2010. Under the terms of this agreement, we may not transfer assets or collateral to, or make investments in, certain of our subsidiaries in an amount that exceeds $0.4 million per month in the aggregate. In addition, we are required to pay SVB a fee equal to 0.25% per annum, or the Unused Revolving Line Fee Percentage, of the average unused portion of the credit line on a monthly basis, in arrears, and the interest rate applicable to amounts outstanding under the credit line is at prime rate plus 0.5%. However, if the liquidity ratio is less than 1.75 to 1, then the Unused Revolving Line Fee Percentage will be increased to 0.5% per annum and the interest rate will be prime rate plus 2.0%. The amount available under the credit line cannot exceed 80% of the value of our eligible accounts receivable and may be decreased by certain commitments, such as the $1.2 million and $35,000 standby letters of credit that secure our performance under our headquarters facility lease and our
F-25
Table of Contents
San Jose, California facility lease, respectively. As of December 31, 2009, there were no other amounts outstanding under the credit line and $7.0 million was available under the credit line.
6. Commitments and Contingencies
In June and August 2007, we entered into two software license agreements. Minimum license fee payments under the June 2007 agreement total $3.8 million over four years. Minimum license fee payments under the August 2007 agreement total $1.5 million over three years.
In August 2007, we entered into a lease agreement for our current corporate headquarters in San Diego, California. Minimum lease payments under the lease agreement totaled $14.7 million over the initial seven-year term of the agreement, which is subject to two five-year renewal options.
The minimum future payments under all noncancellable operating leases with an initial term of one year or more as of December 31, 2009 are as follows (in thousands):
| Years Ending December 31, |
|||
| 2010 |
$ | 4,880 | |
| 2011 |
2,951 | ||
| 2012 |
2,441 | ||
| 2013 |
2,287 | ||
| 2014 |
2,316 | ||
| Thereafter |
194 | ||
| $ | 15,069 | ||
Rent expense for the years ended December 31, 2009, 2008 and 2007 was $2.3 million, $2.5 million and $1.3 million, respectively.
From time to time, we may be involved in litigation relating to claims arising out of our operations. We are not a party to any legal proceedings that are expected, individually or in the aggregate, to have a material adverse effect on its business, financial condition or operating results.
In November 2007, we agreed to pay $1.0 million related to the resolution of a disagreement with EchoStar Technologies Corporation. As a result of the settlement, we made an indemnification claim with the stockholders of RF Magic and recovered 12,000, 101,000 and 111,000 shares of our Series D-1, D-2 and D-3 redeemable convertible preferred stock, respectively, and 31,000 shares of our common stock for a total of $0.7 million. We recorded the difference between the settlement and the amounts recovered from the indemnification claim of $0.3 million as general and administrative expense. We also granted 10,000 shares of common stock to employee stockholders related to the indemnification claim. We recorded $0.1 million as stock compensation expense for the year ended December 31, 2007 for these stock grants.
7. Preferred Stock Warrant Liabilities
In connection with the loan and security agreement entered into with a financial institution in May 2005, we issued a warrant to the lender to purchase 579,000 shares of our Series B redeemable convertible preferred stock. In 2008, we issued 101,000 shares of our common stock in connection with warrant exercises and none of the warrants were outstanding at December 31, 2008.
In April 2007, we entered into a subordinated debt and security agreement with Horizon Technology Funding LLC and SVB under which we could receive advances of up to $8.0 million
F-26
Table of Contents
secured by all of our tangible assets excluding intellectual property, or the Growth Line. In connection with the Growth Line, the lenders obtained the right to warrants to purchase up to a maximum of 699,000 shares of our Series C redeemable convertible preferred stock in the aggregate, at a purchase price of $0.80 per share. The actual number of shares purchasable under the warrants varies according to the amount of draws taken against the Growth Line. In connection with the $1.0 million draw in April 2007 and the $1.0 million draw in August 2007, 306,000 shares became exercisable under the warrants. We recorded the fair value of these warrants of $0.5 million on the issuance date as debt discount and will accrete the value to interest expense over the repayment period of the Growth Line. The initial fair value of the warrants was calculated under the Black-Scholes pricing model with the following assumptions: contractual term of seven years, 4.8 to 5.0% risk-free interest rate, expected volatility of 73% and expected dividend yield of 0%. The warrants were classified as a liability and recorded at their fair value at the issuance date. At each reporting period, we remeasured the fair value of the warrant liability and any gains or losses were recognized as gain (loss) on fair value of preferred stock warrant liabilities. In 2008, we issued 359,000 shares of our common stock in connection with warrant exercises and none of the warrants were outstanding at December 31, 2009.
In connection with the acquisition of RF Magic, we assumed outstanding warrants for convertible preferred stock of RF Magic and issued warrants for Series D-2 and D-3 redeemable convertible preferred stock. The Series D-2 and D-3 warrants were valued on the date of acquisition and are included in the total acquisition cost. The fair value of the warrants was recorded as a liability and remeasured at each reporting period with gains or losses recognized as gain (loss) on fair value of preferred stock warrant liabilities. In 2007, we issued 98,000 shares of our common stock in connection with warrant exercises and none of the warrants were outstanding at December 31, 2009.
For the years ended December 31, 2009, 2008 and 2007, we recorded $0, $0 and a benefit of $0.2 million, respectively, reflected as the gain on fair value of warrant liabilities in the statement of operations, to reflect the change in fair value of the warrant liabilities. In December 2007, the shares of redeemable convertible preferred stock converted into common stock in connection with our initial public offering. The warrants to purchase redeemable convertible preferred stock became warrants to purchase common stock. The fair value of the warrants was re-measured as of the initial public offering date and is no longer subject to remeasurement. The remaining liabilities were reclassified to stockholders’ equity.
8. Stockholders’ Equity (Deficit)
Common Stock
In December 2007, we completed our initial public offering of common stock in which we sold and issued 8,000,000 shares of common stock. As a result of the initial public offering, we raised a total of $48.0 million in gross proceeds, or $40.6 million in net proceeds after deducting underwriting discounts and commissions of $3.3 million and other offering costs of $4.1 million.
Preferred Stock
We are authorized to issue 10,000,000 shares of undesignated preferred stock at $0.001 par value per share. Our board of directors may determine the rights, preferences, privileges, qualifications, limitations and restrictions granted or imposed upon any series of preferred stock. As of December 31, 2009, no preferred stock was outstanding.
Equity Incentive Plans
We have in effect equity compensation plans under which incentive stock options, non-qualified stock options and restricted stock units have been granted to employees, directors and consultants
F-27
Table of Contents
to purchase shares of our common stock at a price not less than the fair market value of the stock at the date of grant except in the event of a business combination.
2007 Equity Incentive Plan
Our 2007 Equity Incentive Plan, or the 2007 Plan, became effective upon the execution of the underwriting agreement in connection with our initial public offering and replaced our 2001 Stock Option Plan, or the 2001 Plan. The 2007 Plan provides for the grant of incentive and non-statutory stock options, restricted stock awards, restricted stock unit awards, stock appreciation rights, performance stock awards and other forms of equity compensation, or collectively Stock Awards. As of December 31, 2009, there were 12,222,000 shares of common stock reserved under the 2007 Plan. This share amount is automatically increased by the amount equal to the number of shares subject to any outstanding option under the 2001 Plan that expires or is forfeited following the date that the 2007 Plan became effective. In addition, the share reserve will automatically increase on January 1 of each year through 2017 by the lesser of 5% of the total number of shares of common stock outstanding on December 31 of the preceding calendar year, 7,692,000 shares of common stock, or a lesser amount of shares of common stock to be determined by the board of directors prior to the first day of the calendar year. Our board of directors may amend or terminate the 2007 Plan at any time. Generally, options outstanding vest over periods not exceeding four years and are exercisable for up to ten years from the grant date. In January 2010, 3,568,000 shares of common stock, which was 5% of the outstanding shares of common stock as of December 31, 2009, were added to the 2007 Plan.
2007 Non-Employee Directors’ Plan
Our 2007 Non-Employee Directors’ Plan, or Directors’ Plan, became effective upon the execution of the underwriting agreement in connection our initial public offering. As of December 31, 2009, an aggregate of 384,000 shares of common stock were reserved for future issuance under the plan. This amount will automatically increase on January 1 of each year through 2017 by an amount equal to the excess of: the number of shares subject to options granted during the preceding calendar year, over the number of shares, if any, added back to the share reserve during the preceding calendar year. Upon election to our board of directors, each non-employee director will receive an initial grant of a non-qualified option to purchase 51,000 shares of our common stock, which will vest in forty-eight equal monthly installments. Further, non-employee directors receive an automatic annual grant of a non-qualified option to purchase 13,000 shares of common stock, which will vest in twelve equal monthly installments. The exercise price of any options granted to a non-employee director under the Directors’ Plan is equal to 100% of the fair market value of our common stock on the date of the grant. The Directors’ Plan provides that options granted under the plan will become fully vested and exercisable in the event of a change of control. In January 2010, 102,000 shares of common stock, which was equal to the number of shares subject to grants made under the Directors’ Plan in 2009, less the shares added back from cancellations, were added to the Directors’ Plan.
2007 Employee Stock Purchase Plan
Under the terms of our ESPP, all eligible employees may purchase shares of common stock at 85% of the lower of the fair market value on the first date of each twelve-month offering period or the purchase date. Employees may authorize us to withhold up to 15% of their compensation during any offering period, subject to certain limitations, to purchase shares of our common stock under the ESPP. The ESPP authorized up to 2,526,000 shares of common stock for purchase by its employees during the year ended December 31, 2009. The ESPP share reserve will automatically increase on January 1 of each year through 2017 by the lesser of 1.5% of the total number of shares of common stock outstanding on December 31 of the preceding calendar year, 2,308,000 shares of common stock, or a lesser amount of shares of common stock to be determined by our board of directors prior
F-28
Table of Contents
to the first day of the calendar year. In January 2010, 1,070,000 shares of common stock, which was 1.5% of the outstanding shares of common stock as of December 31, 2009, were added to the ESPP.
RF Magic 2000 Incentive Stock Plan
In connection with our acquisition of RF Magic, we assumed RF Magic’s 2000 Incentive Stock Plan, or the RF Magic Plan, including all of the outstanding stock options issued under the RF Magic Plan, except those held by employees of RF Magic’s French subsidiary. The stock options under the RF Magic Plan that we assumed became options to purchase an aggregate of 2,685,000 shares of our common stock. The stock options held by employees of RF Magic’s French subsidiary that we did not assume remained as options to purchase RF Magic’s common stock. At the time of the acquisition an aggregate of 195,000 shares of RF Magic’s common stock were issuable upon exercise of the unassumed RF Magic options. The unassumed RF Magic options are a subject to put and call option agreements between us, RF Magic and the holders of these options. Under these put and call option agreements, each share of RF Magic common stock issued upon exercise of the unassumed RF Magic options will be exchanged for 0.9344 shares of our common stock, which is equal to the number of shares of our common stock issued in exchange for each outstanding share of RF Magic in the acquisition. We reserved 182,000 shares of our common stock for future issuance under the put and call option agreements as of December 31, 2007. In 2009 and 2008, 103,000 shares and 35,000 shares of our common stock, respectively, were issued in connection with the exercise of RF Magic options subject to put and call option agreements. As of December 31, 2009, options to purchase up to 35,000 shares were vested and outstanding under the RF Magic Plan with weighted average exercise price of $0.60 per share.
Stock option grants under the 2001 Plan and RF Magic Plan are subject to an early exercise provision. Those under the RF Magic Plan allow for early exercise upon approval by our board of directors. Shares of common stock obtained upon early exercise of unvested options or by restricted stock purchase rights are subject to our repurchase at the applicable original issue price and will vest according to the respective agreement. As of December 31, 2009, 2008 and 2007, 302,000, 893,000 and 2,049,000 shares, respectively, were subject to our repurchase rights.
The consideration received for the exercise of an unvested stock option is considered a deposit of the exercise price, and thus is a liability that is recorded by us. The liability associated with this potential for repurchase, and the related shares, are only reclassified into equity as the option award vests. As a result, we have recorded liabilities as of December 31, 2009, 2008 and 2007 of $0.3 million, $0.8 million and $1.8 million, respectively, for the unvested shares issued upon early exercise of stock options.
F-29
Table of Contents
Combined Incentive Plan Activity
A summary of our stock option award activity and related information under our existing incentive plans for the years ended December 31, 2009 and 2008 is set forth below. The following summary excludes options to purchase up to 35,000 and 147,000 shares of our common stock subject to put and call option agreements for RF Magic options outstanding as of December 31, 2009 and 2008, respectively.
| (in thousands, except per share data) | |||||||||
| Number of Stock Options |
Weighted-Average Exercise Price |
Aggregate Intrinsic Value | |||||||
| Outstanding as of December 31, 2007 |
6,738 | $ | 1.28 | $ | 40,458 | ||||
| Granted |
5,363 | 3.30 | |||||||
| Exercised |
(604 | ) | 0.61 | ||||||
| Cancelled/forfeited/expired |
(1,343 | ) | 2.49 | ||||||
| Outstanding as of December 31, 2008 |
10,154 | 2.23 | $ | 263 | |||||
| Granted |
3,785 | 2.18 | |||||||
| Exercised |
(1,221 | ) | 0.91 | ||||||
| Cancelled/forfeited/expired |
(3,577 | ) | 3.51 | ||||||
| Outstanding as of December 31, 2009 |
9,141 | 1.88 | $ | 11,916 | |||||
The weighted-average grant date fair value per share of employee stock options granted during the years ended December 31, 2009, 2008 and 2007 was $1.49, $2.08 and $6.04, respectively. Stock-based compensation expense related to employees for the years ended December 31, 2009, 2008 and 2007 was $9.3 million, $13.4 million and $6.2 million, respectively. The weighted average remaining contractual term of options outstanding as of December 31, 2009 was 8.0 years. The total intrinsic value of options exercised during the years ended December 31, 2009, 2008 and 2007 was $2.1 million, $1.8 million and $16.2 million respectively. Option exercises were settled with shares of common stock.
As of December 31, 2009, outstanding options to purchase 3,318,000 shares were exercisable with a weighted average exercise price of $1.49 per share and an aggregate intrinsic value of $5.8 million. The weighted average remaining contractual term of options exercisable as of December 31, 2009 was 6.7 years.
Restricted stock unit activity in 2009 and 2008 is as follows:
| Restricted Stock Units Outstanding | ||||||
| Number of Shares |
Weighted Average Grant-Date Fair Value per Share | |||||
| Balance at December 31, 2007 |
— | $ | — | |||
| Restricted stock units granted |
85,500 | 3.87 | ||||
| Restricted stock units cancelled |
(34,000 | ) | 3.85 | |||
| Restricted stock units vested |
— | — | ||||
| Balance at December 31, 2008 |
51,500 | 3.89 | ||||
| Restricted stock units granted |
10,000 | 2.61 | ||||
| Restricted stock units cancelled |
(29,750 | ) | 3.88 | |||
| Restricted stock units vested |
(21,750 | ) | 3.90 | |||
| Balance at December 31, 2009 |
10,000 | $ | 2.61 | |||
F-30
Table of Contents
Stock based compensation expense associated with the above restricted stock unit awards for the years ended December 31, 2009 and 2008, was ($0.1) million and $0.2 million, respectively.
During the year ended December 31, 2009, 597,000 shares of our common stock were purchased through the ESPP which resulted in proceeds to us of $0.6 million.
As of December 31, 2009, we had 9,027,000 authorized shares available for future issuance under all of our equity incentive plans.
Stock-Based Compensation Expense
Stock-based compensation expense recognized in our statement of operations in 2009, 2008 and 2007 included compensation expense for stock-based options and awards granted subsequent to December 31, 2005, based on the grant date fair value. For options and awards granted, expenses are amortized under the straight-line method. Stock-based compensation expense recognized in the statement of operations has been reduced for estimated forfeitures of options that are subject to vesting. Forfeitures are estimated at the time of grant and revised, if necessary, in subsequent periods if actual forfeitures differ from those estimates.
We allocated stock-based compensation expense as follows (in thousands):
| Years Ended December 31, | |||||||||
| 2009 | 2008 | 2007 | |||||||
| Cost of net revenues |
$ | 138 | $ | 251 | $ | 159 | |||
| Research and development |
4,552 | 7,048 | 3,141 | ||||||
| Sales and marketing |
1,401 | 2,334 | 1,174 | ||||||
| General and administrative |
3,276 | 3,854 | 2,044 | ||||||
| Total stock-based compensation expense |
$ | 9,367 | $ | 13,487 | $ | 6,518 | |||
We reviewed and updated our forfeiture rate, expected term and volatility assumptions. The risk-free interest rate is based on zero coupon U.S. Treasury instruments with maturities similar to those of the expected term of the award being valued. The life is the average of the contractual term of the options and the weighted-average vesting period for all option tranches. The estimated volatility incorporates historical volatility of similar entities whose share prices are publicly available. The expected dividend yield was based on our expectation of not paying dividends on common stock for the foreseeable future.
| Years Ended December 31, | ||||||
| 2009 | 2008 | 2007 | ||||
| Expected life (years) |
6.1 | 6.1 | 6.0 | |||
| Risk-free interest rate |
2.4% - 3.2% | 2.8% to 4.0% | 4.0% to 5.0% | |||
| Expected volatility |
76% to 80% | 68% to 70% | 68% to 73% | |||
| Expected dividend yield |
— | — | — | |||
We granted options and other stock awards to consultants in connection with their service agreements. For the years ended December 31, 2009, 2008 and 2007, we recorded compensation expense related to these awards of $60,000, $0.1 million and $0.3 million, respectively. The fair value of the awards was estimated using a Black-Scholes option-pricing model.
F-31
Table of Contents
The fair value of stock options granted to consultants was estimated at the grant date using the following assumptions:
| Years Ended December 31, | ||||||
| 2009 | 2008 | 2007 | ||||
| Contractual term of option (in years) |
10.0 | 10.0 | 10.0 | |||
| Risk-free interest rate |
2.4% to 3.2% | 2.8% to 4.0% | 4.0% to 4.8% | |||
| Expected volatility |
76% to 80% | 68% to 70% | 68% to 73% | |||
| Expected dividend yield |
— | — | — | |||
The fair value of stock options granted under the ESPP was estimated at the grant date using the following assumptions:
| Years Ended December 31, | ||||||
| 2009 | 2008 | 2007 | ||||
| Expected life (years) |
0.5 - 1.0 | 0.5 - 1.0 | — | |||
| Risk-free interest rate |
0.1% to 0.9% | 1.1% to 1.3% | — | |||
| Expected volatility |
82% to 180% | 100% to 116% | — | |||
| Expected dividend yield |
— | — | — | |||
In May 2009, we completed an offer to exchange, or the Offer to Exchange, certain employee stock options to purchase shares of our common stock that were outstanding under our 2007 Plan, 2001 Plan, and RF Magic Plan, on a three-for-two basis for replacement options granted under the 2007 Plan at an exercise price of $1.99 per share, which was the closing price of our common stock on May 15, 2009, as reported by The NASDAQ Global Market. At the expiration of the Offer to Exchange, we accepted elections to exchange options to purchase 1,600,000 shares of common stock and, as a result, we granted replacement options to purchase 1,000,000 shares of common stock. The replacement options have new vesting schedules with vesting dates that are determined by adding an additional vesting period of 12 months, or a shorter duration upon a change of control, to each vesting date under the existing vesting schedule of the options being replaced. However, no replacement option will vest sooner than 12 months from its date of grant, unless a change of control occurs. The incremental value attributed to the option awards exchanged resulted in approximately $60,000 of stock-based compensation, which will be recognized over the vesting period of the new option awards.
As of December 31, 2009, we estimate there were $14.8 million in total unrecognized compensation costs related to employee stock option agreements, which are expected to be recognized over a weighted-average period of 2.8 years. As of December 31, 2009, we estimate there were $0.6 million of unrecognized compensation costs related to the shares expected to be purchased through the ESPP, which are expected to be recognized over a remaining weighted-average period of 0.5 years.
Shares Reserved for Future Issuance
The following shares of common stock are reserved for future issuance (in thousands):
| As of December 31, | ||||
| 2009 | 2008 | |||
| Exercise of stock awards issued and outstanding |
9,141 | 10,154 | ||
| Authorized for grants under equity incentive plans |
9,027 | 5,146 | ||
| Subsidiary stock options subject to put and call options agreements |
35 | 147 | ||
| Total |
18,203 | 15,447 | ||
F-32
Table of Contents
9. Income Taxes
As of December 31, 2009, we had federal, state and foreign tax net operating loss carryforwards of approximately $67.9 million, $50.1 million and $0.9 million, respectively. The federal and state tax loss carryforwards will begin expiring in 2021 and 2013, respectively, unless previously utilized.
As of December 31, 2009, we also had federal and state research and development tax credit, or R&D, carryforwards of approximately $9.8 million and $9.4 million, respectively. The federal R&D tax credit carryforward will begin to expire in 2021 unless previously utilized. The California R&D tax credit will carryforward indefinitely. As of December 31, 2009, we had a California Manufacturer’s Investment Tax Credit, or MIC, carryforward of $0.1 million, which will begin to expire in 2011 unless previously utilized.
Utilization of net operating losses and credit carryforwards may be subject to an annual limitation due to future ownership change limitations provided by the Internal Revenue Code and similar state provisions. The tax benefits related to future utilization of federal and state net operating losses and tax credit carryforwards may be limited or lost if cumulative changes in ownership exceed 50% within any three-year period. While there may have been prior changes in ownership, it is anticipated that we will be able to utilize substantially all of our federal and state net operating losses and tax credit carryforwards.
Significant components of our deferred tax assets as of December 31, 2009 and 2008 are shown below (in thousands):
| As of December 31, | ||||||||
| 2009 | 2008 | |||||||
| Deferred tax assets: |
||||||||
| Net operating loss carryforwards |
$ | 25,622 | $ | 23,435 | ||||
| R&D and MIC credit carryforwards |
9,591 | 8,248 | ||||||
| Capitalized R&D |
4,816 | 7,800 | ||||||
| Other, net |
2,218 | 342 | ||||||
| Stock-based compensation |
2,940 | 1,699 | ||||||
| Acquired intangibles |
1,409 | 1,018 | ||||||
| Total deferred tax assets |
46,596 | 42,542 | ||||||
| Valuation allowance for deferred tax assets |
(46,596 | ) | (42,542 | ) | ||||
| Deferred tax liabilities: |
||||||||
| Acquired intangibles |
— | — | ||||||
| Net deferred tax assets |
$ | — | $ | — | ||||
A valuation allowance has been established to offset the deferred tax assets as realization of such assets does not meet the more-likely-than-not threshold required under accounting guidance.
Our deferred tax assets at December 31, 2009 do not include approximately $0.8 million of excess tax benefits from employee stock option exercises that are a component of our net operating loss carryovers. Stockholders’ equity will be increased by $0.8 million if and when such excess tax benefits are ultimately realized.
F-33
Table of Contents
The reconciliation of income tax computed at the federal statutory rate to the (benefit) provision for income taxes from continuing operations is as follows (in thousands):
| Years Ended December 31, | ||||||||||||
| 2009 | 2008 | 2007 | ||||||||||
| Tax computed at the federal statutory rate |
$ | (4,113 | ) | $ | (47,747 | ) | $ | (11,175 | ) | |||
| State tax, net of federal benefit |
(253 | ) | (2,877 | ) | (108 | ) | ||||||
| Goodwill impairment |
83 | 32,331 | — | |||||||||
| Permanent items |
978 | 769 | (2 | ) | ||||||||
| Stock-based compensation |
1,891 | 2,921 | 1,904 | |||||||||
| In-process research and development |
— | — | 7,490 | |||||||||
| Research credits |
(4,509 | ) | (108 | ) | (2,012 | ) | ||||||
| Tax reserves |
1,787 | 146 | 805 | |||||||||
| Change in state effective tax rate |
(17 | ) | 53 | 1,319 | ||||||||
| Change in valuation allowance |
4,055 | 14,346 | 1,928 | |||||||||
| Foreign tax expense |
5 | 117 | — | |||||||||
| Other |
— | — | (105 | ) | ||||||||
| Income tax (benefit) provision |
$ | (93 | ) | $ | (49 | ) | $ | 44 | ||||
The net income tax benefit for the year ended December 31, 2009 is recorded in our statement of operations in tax expense. The tax benefit is comprised of two pieces: 1) a receivable related to certain credits that became refundable during the year ended December 31, 2008, and 2) prior years’ alternative minimum taxes that have become refundable as a result of changes in the tax law in November of 2009.
On January 1, 2007, we adopted guidance that prescribes a recognition threshold and measurement process for recording in the financial statements uncertain positions taken or expected to be taken in a tax return. For the year ended December 31, 2009, we recorded a cumulative reserve of approximately $9.5 million which was recorded as a decrease to deferred tax assets and a corresponding reduction to the valuation allowance.
The following table summarizes the activity related to our unrecognized tax benefits (in thousands):
| Balance as of January 1, 2009 |
$ | 7,293 | |
| Increases related to prior year tax positions |
1,050 | ||
| Increases related to current year tax positions |
1,177 | ||
| Balance as of December 31, 2009 |
$ | 9,520 | |
We do not expect unrecognized tax benefits to change significantly over the next 12 months.
We file income tax returns in the United States and in various state jurisdictions with varying statutes of limitations. We are no longer subject to income tax examination by tax authorities for years prior to 2005, however, net operating loss and research credit carryforwards arising prior to that year are subject to adjustment. Our policy is to recognize interest expense and penalties related to income tax matters as a component of income tax expense. There were no accrued interest and penalties associated with uncertain tax positions as of December 31, 2009.
10. Employee Benefits
We have a defined contribution 401(k) plan for employees who are at least 21 years of age. Under the terms of the plan, employees may make voluntary contributions as a percentage of compensation,
F-34
Table of Contents
but not in excess of the maximum amounts allowed under the Internal Revenue Code. Our contributions to the plan are discretionary and we made no contributions during the years ended December 31, 2009, 2008 and 2007.
11. Supplemental Disclosure of Cash-Flow and Non-Cash Activity
Cash-Flow
The following table sets forth supplemental disclosure of cash flow information (in thousands):
| Years Ended December 31, | |||||||||
| 2009 | 2008 | 2007 | |||||||
| Cash paid for taxes |
$ | 57 | $ | 173 | $ | 29 | |||
| Cash paid for interest |
— | 225 | 535 | ||||||
Non-Cash Activity
The following table sets forth supplemental disclosure of non-cash activity (in thousands):
| Year Ended December 31, | ||||||||||
| 2009 | 2008 | 2007 | ||||||||
| Accretion of redeemable convertible preferred stock |
$ | — | $ | — | $ | 118 | ||||
| Issuance of preferred stock warrants in connection with debt financing |
— | — | 523 | |||||||
| Issuance of common stock in connection with acquisition of Arabella |
— | — | 2,466 | |||||||
| Issuance of redeemable convertible preferred stock common stock in connection with acquisition of RF Magic, net of shares recovered from escrow settlement |
— | — | 148,587 | |||||||
| Conversion of redeemable convertible preferred stock option upon closing of initial public offering |
— | — | 178,352 | |||||||
| Reclassification of preferred stock warrant liability |
— | — | 2,393 | |||||||
| Assets acquired in connection with acquisition of Vativ, net of liabilities assumed |
— | 4,287 | — | |||||||
| Repurchase liability for early exercise of stock options |
345 | 981 | 1,394 | |||||||
| Currency translation adjustment |
(47 | ) | 42 | — | ||||||
13. Significant Customer, Vendor and Geographic Information
Customers
Based on direct shipments, customers that exceeded 10% of total net revenues and accounts receivable were as follows:
| Net Revenues | Accounts Receivable | ||||||||||||||
| Years Ended December 31, | As of December 31, | ||||||||||||||
| 2009 | 2008 | 2007 | 2009 | 2008 | |||||||||||
| Actiontec Electronics, Inc. |
16 | % | 20 | % | 26 | % | 11 | % | 23 | % | |||||
| Jabil Circuit (Wuxi) Co., Ltd. |
* | * | 15 | % | * | 10 | % | ||||||||
| Motorola, Inc. |
27 | % | 36 | % | 39 | % | 12 | % | 37 | % | |||||
| Wistron NeWeb Corporation |
* | * | * | 11 | % | 13 | % | ||||||||
| Zinwell Corporation |
* | * | * | 10 | % | * | |||||||||
| * | Customer accounted for less than 10% of total net revenues or accounts receivable, as applicable, for the period indicated |
F-35
Table of Contents
Vendors
We had three vendors that represented a significant portion of total purchases (exclusive of payroll and related costs) as follows:
| Years Ended December 31, | |||||||||
| 2009 | 2008 | 2007 | |||||||
| Amkor Technology, Inc. |
27 | % | 28 | % | 25 | % | |||
| Taiwan Semiconductor Manufacturing Company, Ltd. |
25 | % | 21 | % | 40 | % | |||
| TowerJazz |
* | % | 10 | % | * | ||||
| * | Vendor accounted for less than 10% of total purchases (exclusive of payroll and related costs) for the period indicated |
Geographic Information
Net revenues are allocated to the geographic region based on the shipping destination of customer orders. Net revenues by geographic region were as follows (in thousands):
| Years Ended December 31, | |||||||||
| 2009 | 2008 | 2007 | |||||||
| Asia |
$ | 107,117 | $ | 139,157 | $ | 114,668 | |||
| Europe |
2,193 | 3,860 | 4,504 | ||||||
| North America |
6,995 | 3,016 | 3,373 | ||||||
| $ | 116,305 | $ | 146,033 | $ | 122,545 | ||||
As of December 31, 2009 and 2008, long-lived assets, which represent property, plant and equipment, net of accumulated depreciation, located outside of the United States were not material.
14. Quarterly Financial Data (Unaudited)
The following table presents certain quarterly financial data for the eight consecutive quarters ended December 31, 2009. The unaudited quarterly information has been prepared on the same basis as the audited consolidated financial statements and, in the opinion of management, includes all adjustments, consisting only of normal recurring adjustments, necessary for the fair presentation of this data. We believe that our quarterly revenue, particularly the mix of revenue components, and operating results are likely to vary in the future. The operating results for any quarter are not necessarily indicative of the operating results for any future period or for any full year.
| Net Revenues |
Gross Profit |
Net Income (Loss)(1) |
Basic and Diluted Net Income (Loss) Per Share |
|||||||||||
| (in thousands, except per share data) | ||||||||||||||
| Year Ended December 31, 2009 |
||||||||||||||
| Fourth Quarter |
$ | 35,078 | $ | 18,116 | $ | 1,021 | $ | 0.01 | ||||||
| Third Quarter |
30,958 | 15,626 | (1,238 | ) | (0.02 | ) | ||||||||
| Second Quarter |
26,146 | 12,945 | (4,287 | ) | (0.06 | ) | ||||||||
| First Quarter |
24,123 | 12,219 | (8,736 | ) | (0.13 | ) | ||||||||
| Year Ended December 31, 2008 |
||||||||||||||
| Fourth Quarter |
$ | 29,531 | $ | 14,134 | $ | (118,943 | )(2) | $ | (1.74 | ) | ||||
| Third Quarter |
31,678 | 14,370 | (7,124 | ) | (0.11 | ) | ||||||||
| Second Quarter |
42,836 | 18,967 | (6,447 | ) | (0.10 | ) | ||||||||
| First Quarter |
41,988 | 19,151 | (3,856 | ) | (0.06 | ) | ||||||||
| (1) | Net loss attributable to common stockholders. |
| (2) | Includes impairment of goodwill and intangible assets of $113.2 million. |
F-36
Table of Contents
SCHEDULE II—CONSOLIDATED VALUATION AND QUALIFYING ACCOUNTS
ENTROPIC COMMUNICATIONS, INC.
(in thousands)
| Description |
Balance at Beginning of Year |
Charged (Credited) to Costs and Expenses |
Deductions | Balance at End of Year | ||||||||||
| Year ended December 31, 2009 |
||||||||||||||
| Deducted from asset accounts: |
||||||||||||||
| Allowance for doubtful accounts |
$ | — | $ | — | $ | — | $ | — | ||||||
| Reserve for excess and obsolete inventory |
1,949 | 1,182 | (524 | ) | 2,607 | |||||||||
| Total |
$ | 1,949 | $ | 1,182 | $ | (524 | ) | $ | 2,607 | |||||
| Year ended December 31, 2008 |
||||||||||||||
| Deducted from asset accounts: |
||||||||||||||
| Allowance for doubtful accounts |
$ | 134 | $ | (134 | ) | $ | — | $ | — | |||||
| Reserve for excess and obsolete inventory |
1,491 | 526 | (68 | ) | 1,949 | |||||||||
| Total |
$ | 1,625 | $ | 392 | $ | (68 | ) | $ | 1,949 | |||||
S-1
Table of Contents
Pursuant to the requirements of Section 13 or 15(d) of the Securities Exchange Act of 1934, as amended, the registrant has duly caused this report to be signed on its behalf by the undersigned, thereunto duly authorized.
| ENTROPIC COMMUNICATIONS, INC. | ||
| By: | /S/ PATRICK HENRY | |
| Patrick Henry President and Chief Executive Officer | ||
| Date: February 4, 2010 | ||
Each of the undersigned directors and officers of Entropic Communications, Inc., hereby severally constitute Patrick Henry, David Lyle and Kurt Noyes, and each of them singly, as his true and lawful attorneys-in-fact and agents, with full power of substitution and resubstitution, for him and in his name, place and stead, in any and all capacities, to sign any and all amendments to this Annual Report on Form 10-K, and to file the same, with all exhibits thereto, and other documents in connection therewith, with the Securities and Exchange Commission, and we hereby grant unto said attorneys-in-fact and agents, and each of them, full power and authority to do and perform each and every act and thing requisite and necessary to be done in connection therewith, as fully to all intents and purposes as he might or could do in person, hereby ratifying and confirming that all said attorneys-in-fact and agents, or any of them or their or his substitute or substituted, may lawfully do or cause to be done by virtue hereof.
Pursuant to the requirements of the Securities Exchange Act of 1934, as amended, this report has been signed below by the following persons on behalf of the registrant and in the capacities and on the dates indicated.
| Signature |
Title |
Date | ||
| /S/ PATRICK HENRY Patrick Henry |
President, Chief Executive Officer and Member of the Board of Directors (Principal Executive Officer) | February 4, 2010 | ||
| /S/ DAVID LYLE David Lyle |
Chief Financial Officer (Principal Financial Officer) |
February 4, 2010 | ||
| /S/ KURT NOYES Kurt Noyes |
Vice President, Accounting and Treasury (Principal Accounting Officer) |
February 4, 2010 | ||
| /S/ UMESH PADVAL Umesh Padval |
Chairman of the Board of Directors | February 4, 2010 | ||
| /S/ THOMAS BARUCH Thomas Baruch |
Member of the Board of Directors | February 4, 2010 | ||
| /S/ KEITH BECHARD Keith Bechard |
Member of the Board of Directors | February 4, 2010 | ||
| /S/ AMIR MASHKOORI Amir Mashkoori |
Member of the Board of Directors | February 4, 2010 | ||
| /S/ KENNETH MERCHANT Kenneth Merchant |
Member of the Board of Directors | February 4, 2010 | ||
| /S/ JOHN WALECKA John Walecka |
Member of the Board of Directors | February 4, 2010 | ||
Table of Contents
Exhibit Index
| Exhibit |
Description of Document | |
| 2.1(1) | Agreement and Plan of Merger and Reorganization dated April 9, 2007, as amended, by and among the Registrant, Raptor Acquisition Sub, Inc., RF Magic, Inc. and Mark Foley, as the Stockholders’ Representative. | |
| 3.1(2) | Amended and Restated Certificate of Incorporation of the Registrant. | |
| 3.2(3) | Amended and Restated Bylaws of the Registrant. | |
| 4.1 | Reference is made to Exhibits 3.1 and 3.2. | |
| 4.2(1) | Form of Common Stock Certificate of the Registrant. | |
| 10.1+(4) | 2007 Equity Incentive Plan and Form of Option Agreement, Form of Option Grant Notice thereunder and Notice of Exercise. | |
| 10.2+(1) | 2007 Non-Employee Directors’ Stock Option Plan and Form of Option Agreement, Forms of Grant Notice and Notice of Exercise thereunder. | |
| 10.3+(4) | 2007 Employee Stock Purchase Plan and Form of Offering Document thereunder. | |
| 10.4+(1) | 2001 Equity Incentive Plan and Form of Stock Option Agreement, Form of Notice Grant of Stock Option and Form of Stock Option Exercise Notice thereunder. | |
| 10.5+(1) | RF Magic, Inc. 2000 Incentive Stock Plan and Form of Stock Option Agreement and Form of Stock Option Grant Notice thereunder. | |
| 10.6+(5) | Description of 2009 Management Bonus Plan. | |
| 10.7+(1) | Form of Indemnity Agreement by and between the Registrant and each of its directors and executive officers. | |
| 10.8+(1) | Form of Employee Innovations and Proprietary Rights Assignment Agreement by and between the Registrant and each of its executive officers. | |
| 10.9+(6) | Employment Offer Letter dated April 17, 2007 by and between the Registrant and Lance Bridges. | |
| 10.10+(7) | Retention Bonus Agreement dated March 31, 2009 by and between the Registrant and Lance Bridges. | |
| 10.11+(8) | Amended and Restated Change of Control Agreement dated December 7, 2009 by and between the Registrant and Lance Bridges. | |
| 10.12+(9) | Transition and Separation Agreement and General Release of All Claims dated October 6, 2009 between the Registrant and Michael Economy. | |
| 10.13+(6) | Employment Offer Letter dated May 2, 2007 by and between the Registrant and Itzhak Gurantz. | |
| 10.14+(6) | Amended and Restated Change of Control Agreement dated October 20, 2007 by and between the Registrant and Itzhak Gurantz. | |
| 10.15+(8) | Amended and Restated Executive Employment Agreement dated December 7, 2009 by and between the Registrant and Patrick Henry. | |
| 10.16+(6) | Employment Offer Letter dated June 5, 2007 by and between the Registrant and David Lyle. | |
| 10.17+(7) | Retention Bonus Agreement dated March 31, 2009 by and between the Registrant and David Lyle. | |
Table of Contents
| Exhibit |
Description of Document | |
| 10.18+(8) | Amended and Restated Change of Control Agreement dated December 7, 2009 by and between the Registrant and David Lyle. | |
| 10.19+(1) | Director Offer Letter dated September 1, 2004 by and between the Registrant and Amir Mashkoori. | |
| 10.20+(1) | Director Offer Letter dated March 25, 2007 by and between the Registrant and Kenneth Merchant. | |
| 10.21+(1) | Director Offer Letter dated November 23, 2004 by and between the Registrant and Umesh Padval. | |
| 10.22+(10) | Director Offer Letter dated June 9, 2009 by and between the Registrant and Keith Bechard. | |
| 10.23(11) | Loan and Security Agreement dated April 11, 2007 by and between the Registrant and Silicon Valley Bank, as amended on March 31, 2008, April 3, 2008 and May 20, 2008. | |
| 10.24(5) | Amendment to Loan and Security Agreement dated April 3, 2009 by and between the Registrant and Silicon Valley Bank. | |
| 10.25(5) | Amendment to Loan and Security Agreement dated April 22, 2009 by and between the Registrant and Silicon Valley Bank. | |
| 10.26(1) | Office Lease dated August 31, 2007 by and between the Registrant and Kilroy Realty, L.P. | |
| 10.27(1) | Promoter Member Agreement dated November 20, 2003, as amended, by and between the Registrant and Multimedia over Coax Alliance. | |
| 10.28#(1) | Corporate Supply Agreement dated March 2, 2006 by and between the Registrant and Motorola, Inc. | |
| 10.29#(1) | Development and License Agreement dated September 15, 2002 by and between RF Magic, Inc. and STMicroelectronics N.V. | |
| 21.1* | Subsidiaries of the Registrant. | |
| 23.1* | Consent of Ernst & Young LLP, Independent Registered Public Accounting Firm. | |
| 24.1* | Power of Attorney (included as part of the signature page). | |
| 31.1* | Certification of the Chief Executive Officer, as required pursuant to Section 302 of the Sarbanes-Oxley Act of 2002. | |
| 31.2* | Certification of the Chief Financial Officer, as required pursuant to Section 302 of the Sarbanes-Oxley Act of 2002. | |
| 32* | Certifications of the Chief Executive Officer and Chief Financial Officer, as required pursuant to Section 906 of the Sarbanes-Oxley Act of 2002. | |
| + | Indicates management contract or compensatory plan. |
| # | Confidential treatment has been granted with respect to certain portions of this exhibit. Omitted portions have been filed separately with the SEC. |
| * | Filed herewith. |
| (1) | Incorporated herein by reference to the Registrant’s Registration Statement on Form S-1 (No. 333-144899), as amended, filed with the SEC. |
| (2) | Incorporated herein by reference to the Registrant’s Current Report on Form 8-K filed with the SEC on December 13, 2007. |
| (3) | Incorporated herein by reference to the Registrant’s Current Report on Form 8-K filed with the SEC on December 5, 2008. |
Table of Contents
| (4) | Incorporated herein by reference to the Registrant’s Annual Report on Form 10-K filed with the SEC on March 3, 2008. |
| (5) | Incorporated herein by reference to the Registrant’s Quarterly Report on Form 10-Q filed with the SEC on May 5, 2009. |
| (6) | Incorporated herein by reference to the Registrant’s Current Report on Form 8-K filed with the SEC on April 8, 2008. |
| (7) | Incorporated herein by reference to the Registrant’s Current Report on Form 8-K filed with the SEC on April 6, 2009. |
| (8) | Incorporated herein by reference to the Registrant’s Current Report on Form 8-K filed with the SEC on December 7, 2009. |
| (9) | Incorporated herein by reference to the Registrant’s Current Report on Form 8-K filed with the SEC on October 6, 2009. |
| (10) | Incorporated herein by reference to the Registrant’s Current Report on Form 8-K filed with the SEC on June 17, 2009. |
| (11) | Incorporated herein by reference to the Registrant’s Annual Report on Form 10-K filed with the SEC on February 23, 2009. |