Attached files
 ICS
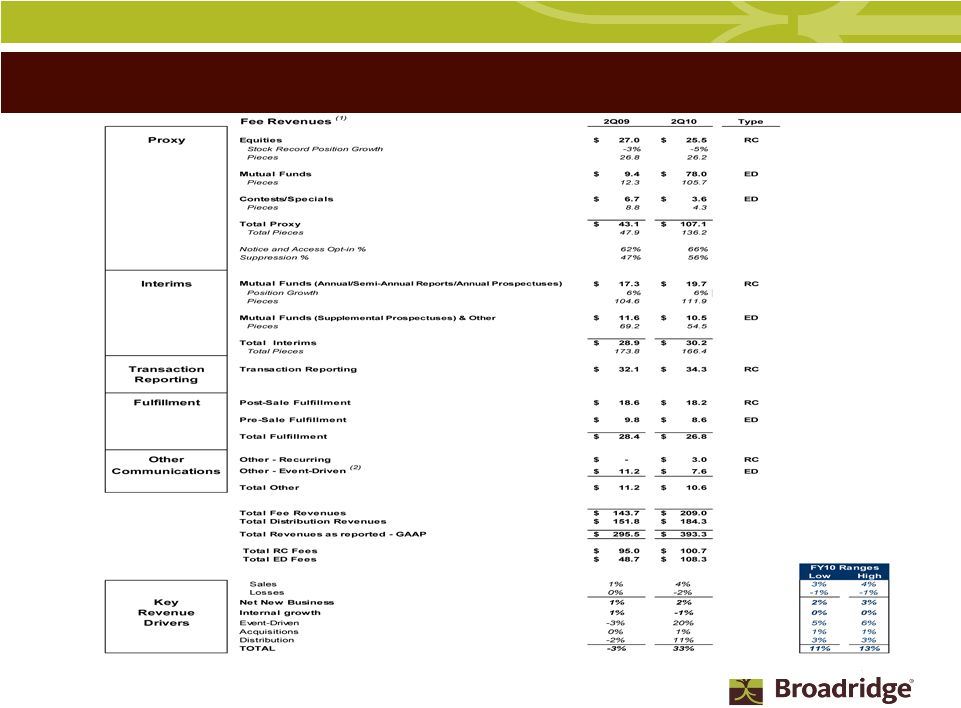
Key Segment Revenue Stats RC= Recurring ED= Event-Driven Exhibit 99.3 (1) As of 1Q09, these items represent fee revenues only and exclude
distribution revenues which are set out separately. The historical numbers have been adjusted to exclude distribution revenues. (2) Other includes 3.7M pieces for 2Q09 and 3.1M pieces for 2Q10 primarily
related to corporate actions. |
 SPS
and Outsourcing Key Segment Revenue Stats RC= Recurring ED= Event-Driven (1) 2Q09 Internal Trade Volume previously was reported as 1,693 and 267 for Equities and
Fixed Income, respectively. YTD 09 Internal Trade Volume previously
was reported as 1,597 and 269 for Equities and Fixed Income, respectively. These numbers were adjusted to reflect Losses and Sales in order to present consistent business for the purpose of calculating internal trade
growth. (2) Equity Trade volume adjusted to excludes trades processed under
fixed priced contracts. Management believes excluding this trade volume presents a stronger correlation between trade volume and Equity Trade revenue. (3) Prior Year's trade volume re-stated for comparability. (4) 2Q09 Equity Transaction-Based and Non-Transaction revenue, previously
reported as $70.0M and $48.2M respectively, has been restated to reclassify
certain revenues between categories. |