Attached files
Table of Contents
UNITED STATES
SECURITIES AND EXCHANGE COMMISSION
WASHINGTON, D.C. 20549
FORM 10-K
ANNUAL REPORT PURSUANT TO SECTION 13 OR 15 (d)
OF THE SECURITIES EXCHANGE ACT OF 1934
For the fiscal year ended September 30, 2008
Commission File Number: 0-13265
UCI MEDICAL AFFILIATES, INC.
(Name of Registrant as Specified in its Charter)
| Delaware | 59-2225346 | |
| (State or Other Jurisdiction of Incorporation or Organization) | (IRS Employer Identification Number) | |
1818 Henderson Street, Columbia, South Carolina 29201
(Address of Principal Executive Offices, Including Zip Code)
(803) 782-4278
(Registrant’s Telephone Number, Including Area Code)
| Securities registered pursuant to Section 12(b) of the Act: |
None | |
| Securities registered pursuant to Section 12(g) of the Act: |
Common Stock, $.05 par value |
Indicate by check mark whether the registrant is a well-known seasoned issuer, as defined in Rule 405 of the Securities Act.
Yes __ No X
Indicate by check mark if the registrant is not required to file reports pursuant to Section 13 or Section 15(d) of the Act. Yes __ No X
Indicate by check mark whether the registrant: (1) has filed all reports required to be filed by Section 13 or 15(d) of the Securities Exchange Act of 1934 during the preceding 12 months, and (2) has been subject to the filing requirements for the past 90 days. Yes __ No X
Indicate by check mark whether the registrant has submitted electronically and posted on its corporate Web site, if any, every Interactive Data File required to be submitted and posted pursuant to Rule 405 of Regulation S-T (§ 232.405 of this chapter) during the preceding 12 months (or for such shorter period that the registrant was required to submit and post such files). Yes __ No __
Indicate by check mark if the disclosure of delinquent filers pursuant to Item 405 of Regulation S-K is not contained herein, and will not be contained, to the best of the registrant’s knowledge, in definitive proxy or information statements incorporated by reference in Part III of this Form 10-K or any amendment to this Form 10-K. X
Indicate by check mark whether the registrant is a large accelerated filer, an accelerated filer, a non-accelerated filer, or a smaller reporting company. See definition of “large accelerated filer,” “accelerated filer,” and “smaller reporting company” in Rule 12b-2 of the Exchange Act
Large Accelerated Filer ___ Accelerated Filer ___ Non-Accelerated Filer X Smaller Reporting Company ___
Indicate by check mark whether the registrant is a shell company (as defined in Rule 12b-2 of the Exchange Act). Yes __ No X
The aggregate market value of the common equity held by non-affiliates of the registrant on December 31, 2009 was approximately $6,449,159 based on the number of shares held by non-affiliates of the registrant and the reported last sale price of common stock on December 31, 2009 ($2.25), which was the last business day of the registrant’s most recently completed second fiscal quarter. This calculation does not reflect a determination that persons are affiliates for any other purposes. The registrant has no non-voting common stock outstanding.
APPLICABLE ONLY TO REGISTRANTS INVOLVED IN BANKRUPTCY PROCEEDINGS DURING THE PRECEDING FIVE YEARS
Indicate by check mark whether the registrant has filed all documents and reports required to be filed by Section 12, 13, or 15(d) of the Securities Exchange Act of 1934 subsequent to the distribution of securities under a plan confirmed by a court. Yes X No __
The number of shares outstanding of the registrant’s common stock, $.05 par value, was 9,934,072 at December 31, 2009.
DOCUMENTS INCORPORATED BY REFERENCE
None.
Table of Contents
UCI MEDICAL AFFILIATES, INC.
2
Table of Contents
In this report on Form 10-K for the year ended September 30, 2008 (this “Form 10-K” or this “Report”), we are restating our consolidated balance sheet as of September 30, 2007, and the related consolidated statements of income, stockholders’ equity and cash flows for the years ended September 30, 2007 and 2006. These Consolidated Financial Statements have been re-audited by Elliott Davis, LLC, the independent registered public accounting firm (“Elliott Davis” or the “New Auditors”) we engaged in March 2009 to audit our consolidated balance sheet as of September 30, 2008 and the related consolidated statements of income, stockholders’ equity and cash flows for the year then ended.
In addition, we are restating the annual financial information set forth in “PART II – ITEM 6. – SELECTED FINANCIAL DATA” in this Form 10-K as of September 30, 2007, 2006, 2005, 2004, 2003 and 2002 and for the six years ended September 30, 2007. We are also restating our quarterly financial information for the three quarters ended June 30, 2008, March 31, 2008 and December 31, 2007, and the quarterly financial information for each quarter in the years ended September 30, 2007 and 2006. The quarterly financial information is set forth in this Form 10-K under the caption, “PART II – ITEM 8. – FINANCIAL STATEMENTS AND SUPPLEMENTARY DATA – NOTE 13. QUARTERLY FINANCIAL DATA.”
Our previously filed annual reports on Form 10-K, quarterly reports on Form 10-Q, earnings press releases and other similar communications for the restated periods as described above will not be amended and should not be relied upon. Therefore, the Consolidated Financial Statements, reports of our previous independent registered public accounting firm and related financial information contained in such previously filed reports should not be relied upon. Similarly, related press releases and reports describing our financial results for the aforementioned periods should no longer be relied upon.
The restatements, as described above, were principally related to an internal investigation (the “Investigation”) commenced by our Audit Committee on December 10, 2008. The circumstances that precipitated the Investigation are more fully discussed in this Form 10-K under the caption, “PART II – ITEM 7. – MANAGEMENT’S DISCUSSION AND ANALYSIS OF FINANCIAL CONDITION AND RESULTS OF OPERATIONS – Restatements and Related Matters.”
Additionally, our restated consolidated balance sheet as of September 30, 2007, and the related consolidated statements of income, stockholders’ equity and cash flows for the years ended September 30, 2007 and 2006 are set forth in this Form 10-K under the caption, “PART II – ITEM 8. – FINANCIAL STATEMENTS AND SUPPLEMENTARY DATA” and the restatement adjustments are set forth in “NOTE 2. – RESTATEMENT OF PREVIOUSLY ISSUED CONSOLIDATED FINANCIAL STATEMENTS” which is an integral part of such Consolidated Financial Statements.
3
Table of Contents
Advisory Note Regarding Forward-Looking Statements
Certain of the statements contained in this Report on Form 10-K that are not historical facts are forward-looking statements subject to the safe harbor created by the Private Securities Litigation Reform Act of 1995. We caution readers of this Form 10-K that such forward-looking statements involve known and unknown risks, uncertainties and other factors that may cause our actual results, performance or achievements to be materially different from those expressed or implied by such forward-looking statements. Although our management believes that their expectations of future performance are based on reasonable assumptions within the bounds of their knowledge of their business and operations, we can give no assurance that actual results will not differ materially from their expectations. Factors that could cause actual results to differ from expectations include, among other things, (1) the difficulty in controlling our costs of providing healthcare and administering our network of centers; (2) the possible negative effects from changes in reimbursement and capitation payment levels and payment practices by insurance companies, healthcare plans, government payers and other payment sources; (3) the difficulty of attracting primary care physicians; (4) the increasing competition for patients among healthcare providers; (5) possible government regulations negatively impacting our existing organizational structure; (6) the possible negative effects of prospective healthcare reform; (7) the challenges and uncertainties in the implementation of our expansion and development strategy; (8) the dependence on key personnel; (9) adverse conditions in the stock market, the public debt market, and other capital markets (including changes in interest rate conditions); (10) the strength of the United States economy in general and the strength of the local economies in which we conduct operations may be different than expected resulting in, among other things, a reduced demand for practice management services; (11) the demand for our products and services; (12) technological changes; (13) the ability to increase market share; (14) the adequacy of expense projections and estimates of impairment loss; (15) the impact of change in accounting policies by the Securities and Exchange Commission; (16) unanticipated regulatory or judicial proceedings; (17) the impact on our business, as well as on the risks set forth above, of various domestic or international military or terrorist activities or conflicts; (18) other factors described in this Form 10-K, including, but not limited to, those matters described under the caption “PART I – ITEM 1A. – RISK FACTORS,” and in our other reports filed with the Securities and Exchange Commission; and (19) our success at managing the risks involved in the foregoing.
PART I
General
UCI Medical Affiliates, Inc. (“UCI”) is a Delaware corporation incorporated on August 25, 1982. Operating through its wholly-owned subsidiary, UCI Medical Affiliates of South Carolina, Inc. (“UCI-SC”), as of September 30, 2008, UCI provided nonmedical management and administrative services for a network of 62 freestanding medical centers, 61 of which are located throughout South Carolina and one is located in Knoxville, Tennessee (39 operating as Doctors Care in South Carolina, one as Doctors Care in Knoxville, Tennessee, 19 as Progressive Physical Therapy Services in South Carolina, one as Luberoff Pediatrics in South Carolina, one as Carolina Orthopedic & Sports Medicine in South Carolina and one as Doctors Wellness Center in South Carolina). We refer to these 62 medical centers as the “centers” throughout this Report. As such terms are defined below in PART I – ITEM 1. – BUSINESS – Organizational Structure,” we sometimes refer to the P.A., UCI, UCI-SC, and UCI-LLC collectively as the “Company” or as “we,” “us” and “our” throughout this Report.
Recent Developments
Audit Committee Investigation of Former Chief Financial Officer
On December 10, 2008, our Audit Committee of the Board of Directors (the “Audit Committee”) commenced an internal investigation (the “Investigation”) of certain accounting irregularities with respect to our internal controls and improper expense reimbursements to Jerry F. Wells, Jr., our former Executive Vice-President of Finance, Chief Financial Officer, and Secretary. On December 17, 2008, our Board of Directors terminated the employment of Mr. Wells based upon the preliminary results of the Investigation. The Investigation is more fully discussed in this Form 10-K under the caption, “PART II - ITEM 7. – MANAGEMENT’S DISCUSSION AND ANALYSIS OF FINANCIAL CONDITION AND RESULTS OF OPERATIONS, Restatements and Related Matters.”
4
Table of Contents
On February 27, 2009, Mr. Wells executed a Confession of Judgment (the “Judgment”) in our favor in the amount of Two Million Nine Hundred Sixty-Seven Thousand Three Hundred and Eighty-Two ($2,967,382) Dollars. On July 6, 2009, the United States Department of Justice charged Mr. Wells for filing materially false, fictitious and fraudulent certifications in filings with the Securities and Exchange Commission (the “SEC”) pursuant to the Sarbanes-Oxley Act of 2002.
On July 23, 2009, Mr. Wells, pled guilty in federal court to criminal charges for falsifying eight of the Company’s periodic reports filed with the SEC. As a result of these false filings, Mr. Wells was charged with, and pled guilty to, eight counts of making false statements to a government agency, in violation of Title 18, United States Code, Section 1001. Further, during the plea hearing, Mr. Wells admitted that from January 2003 through December 2008, he embezzled $2,967,382 from the Company by (1) using the Company’s corporate credit card to pay personal expenses; (2) preparing false expense reports and submitting them for reimbursement; and, (3) submitting fraudulent check requests for non-business expenses, such as construction work on his personal residences and payments on personal credit card accounts.
Cost of the Investigation and Recovery and Collection Efforts
During our 2009 fiscal year we have incurred approximately $800,000 in costs associated with the Investigation. Such costs are composed primarily of professional fees and include certain audit-related expenses related to the re-audit of our Consolidated Financial Statements for the three-year period ending September 30, 2008.
On February 20, 2009, our Board of Directors passed a resolution declaring a forfeiture of Mr. Wells’ interest in our deferred compensation plan. On February 23, 2009, Mr. Wells signed a voluntary relinquishment of any claims under our deferred compensation plan. We do not deem Mr. Wells’ relinquishment of any interest in the deferred compensation plan as a partial settlement of amounts he owes us under the Judgment. Rather we deem such amount as a nullity as of the date of the resolution of our Board of Directors because any such interest in the deferred compensation plan had been conditionally credited to Mr. Wells under false pretenses. The amount of the conditional liability associated with the deferred compensation plan at September 30, 2008 approximated $764,000. The conditional liability at the date of relinquishment, the reversal of which we will recognize in the second quarter of 2009, approximated $600,000.
Our efforts to collect under the Judgment from Mr. Wells continue. Since September 30, 2008, we have recovered certain items of jewelry and other personal property, none of which is of significant value. Additionally, we have collected $110,000 from the sales of other assets in which Mr. Wells had an interest. Despite these collection efforts, we can give no assurance that such efforts will result in the recovery of any further amounts under the Judgment.
Further, we have filed claims with two insurance carriers under fidelity bond and employee dishonesty insurance policies. Even though we intend to vigorously pursue our claims under the bond and the policies, and believe we have coverage for our losses, we can give no assurances that our claims will result in the recovery of any amounts for which we have filed such claims.
Delisting of Our Common Stock
On February 13, 2009, our common stock was delisted from the over-the-counter bulletin board as a result of our failure to file our Annual Report on Form 10-K with the SEC. Such failure was due to the Investigation of our previous Chief Financial Officer, as described above. Since February 13, 2009, our common stock has traded on the Pink Sheets Electronic Over-the-Counter Market (the “Pink Sheets”).
Dismissal of Previous Independent Registered Accounting Firm
On February 2, 2009, our Audit Committee dismissed Scott McElveen, LLP (“Scott McElveen”) as our independent registered accounting firm. The circumstances surrounding such dismissal are more fully discussed in this Form 10-K under the caption, “PART II – ITEM 9. – CHANGES IN AND DISAGREEMENTS WITH ACCOUNTANTS ON ACCOUNTING AND FINANCIAL DISCLOSURE.”
On March 13, 2009 we engaged Elliott Davis as our New Auditors. Under the terms of their engagement, our New Auditors audited our 2008 Consolidated Financial Statements and re-audited our 2007 and 2006 Consolidated Financial Statements.
5
Table of Contents
Opening of New Centers and Relocation of Corporate Offices
Subsequent to September 30, 2008, we have opened five Doctors Care offices and one physical therapy office. The physical therapy office shares a building with a Doctors Care office. In addition, we have closed one Doctors Care office in fiscal year 2009. All of our new offices are leased and all are located in South Carolina. The terms of the leases associated with the five new office locations are twenty years and we will classify each lease as a capital lease. The aggregate amount that will be recorded (at the inception of the leases) as capital lease assets and obligations under the capital leases is $4,657,015.
In addition, in June 2009 we completed the renovation of our new corporate headquarters building which we acquired in October 2007 and have relocated all of our corporate employees who had previously been located in three separate locations to the new location in Columbia, South Carolina. We financed the purchase and renovation of the new headquarters property and since September 30, 2008 have incurred additional debt of approximately $1,800,000 related to the financing of the property.
Extension of Term and Mortgage Loans
At September 30, 2008, we had a term loan outstanding with a commercial bank in the amount of $1,597,998. The term loan was payable in monthly installments of $76,033 and was scheduled for maturity on June 16, 2009. The interest rate on the term loan was the commercial bank’s prime interest rate (5% at September 30, 2008) plus 1/2%. Prior to June 2009, and as explained further below, the term loan was extended and it was modified on November 23, 2009.
In addition, in 2008 we secured a mortgage loan commitment and agreement from the same commercial bank in the amount of $3,200,000 for the purpose of acquiring and renovating our new corporate headquarters property. At September 30, 2008, $1,400,487 was outstanding under the mortgage loan agreement. Under the terms of the mortgage loan agreement we paid interest only at one-month LIBOR plus 2.5% until the modification date, at which time $2,100,000 of the amount outstanding converted to a permanent mortgage loan. The mortgage loan was modified on November 23, 2009. As explained below, approximately $1,100,000 of the $3,200,000 amount then outstanding was transferred to the term loan. Interest on the permanent mortgage loan will continue to be paid based on one-month LIBOR plus 2.5% and we will pay total monthly payments of $11,407. Any amount outstanding on March 15, 2015 will be due and payable on that date.
The term loan, as described above, was modified on November 23, 2009. Under the modified terms, $1,100,000 of the amount outstanding under the mortgage loan was added to the outstanding balance of the term loan. After modification, the aggregate balance of the term loan was $1,785,000. The term loan agreement was further modified to extend the maturity date until October 2013. We will continue to pay monthly installments of $76,033 and the interest rate on the term loan will continue to be paid at the commercial bank’s prime interest rate plus 1/2%.
During 2009, we failed to meet certain covenants under the term loan and the mortgage loan agreements. The covenants related to the maintenance of certain debt to equity ratios and the timely filing of our annual and quarterly financial information with the commercial bank during 2009. The commercial bank has waived the violation of these covenants.
Organizational Structure
Federal law and the laws of many states, including South Carolina and Tennessee, generally specify who may practice medicine and limit the scope of relationships between medical practitioners and other parties. Under such laws, UCI and UCI-SC are prohibited from practicing medicine or exercising control over the provision of medical services. In order to comply with such laws, all medical services at the centers are provided by or under the supervision of Doctors Care, P.A., Progressive Physical Therapy, P.A. (“PPT”), Carolina Orthopedic & Sports Medicine, P.A. (“COSM”) or Doctors Care of Tennessee, P.C. (the four together as the “P.A.”), each of which has contracted with UCI-SC to be the sole provider of all non-medical direction and supervision of the centers operating in its respective state of organization. We sometimes refer to the P.A., UCI, UCI-SC, and UCI Properties, LLC (“UCI-LLC”) collectively as the “Company” or as “we,” “us” and “our” throughout this Report. The P.A. is organized so that all physician services are offered by the physicians who are employed by the P.A. Neither UCI, UCI-LLC nor UCI-SC employ practicing physicians as practitioners, exert control over their decisions regarding medical care, or represent to the public that it offers medical services.
6
Table of Contents
UCI-SC has entered into an Administrative Services Agreement with each P.A. pursuant to which UCI-SC performs all non-medical management of the P.A. and has exclusive authority over all aspects of the business of the P.A. (other than those directly related to the provision of patient medical services or as otherwise prohibited by state law). The non-medical management provided by UCI-SC includes, among other functions, treasury and capital planning, financial reporting and accounting, pricing decisions, patient acceptance policies, setting office hours, contracting with third-party payers, and all administrative services. UCI-SC provides all of the resources (systems, procedures, and staffing) to bill third-party payers or patients and provides all of the resources for cash collection and management of accounts receivables, including custody of the lockbox where cash receipts are deposited. From the cash receipts, UCI-SC pays all physician salaries and operating expenses of the centers and of UCI-SC. Compensation guidelines for the licensed medical professionals at the P.A. are set by UCI-SC, and UCI-SC establishes guidelines for selecting, hiring, and terminating the licensed medical professionals. UCI-SC also negotiates and executes substantially all of the provider contracts with third-party payers. UCI-SC does not loan or otherwise advance funds to the P.A. for any purpose.
The P.A. and UCI-SC share a common management team. In each case, the same individuals serve in the same executive offices of each entity.
UCI-SC believes that the services it provides to the P.A. do not constitute the practice of medicine under applicable laws. Because of the unique structure of the relationships described above, many aspects of our business operations have not been the subject of state or federal regulatory interpretation. We can give no assurance that a review of our business by the courts or regulatory authorities will not result in a determination that could adversely affect our operations or that the healthcare regulatory environment will not change so as to restrict our existing operations or future expansion.
The Centers
The centers are staffed by licensed physicians, physical therapists, other healthcare providers (including physician assistants and nurse practitioners), medical support staff, and administrative support staff. The medical support staff includes licensed nurses, certified medical assistants, laboratory technicians, and registered radiographic technologists.
The centers typically are open for extended hours (weekends and evenings) and provide out-patient care only. When hospitalization or specialty care is needed, referrals to appropriate specialists are made. Carolina Orthopedic and Sports Medicine is an exception since it does provide in-patient care.
Over the past five years we have increased the number of our centers by 51%. During fiscal year 2004, the number of centers increased from 41 to 43. We added two physical therapy offices (one in the Columbia, South Carolina region and one in the Charleston, South Carolina region). The number of centers in operation increased from 43 to 47 during fiscal year 2005. We added three Doctors Care offices (two in the Columbia, South Carolina region and one in the Myrtle Beach, South Carolina region) and one physical therapy office (in the Charleston, South Carolina region). The number of centers in operation increased from 47 to 52 during fiscal year 2006. We added two Doctors Care offices (one in the Columbia, South Carolina region and one in the Charleston, South Carolina region), three physical therapy offices (two in the Columbia, South Carolina region and one in the Charleston, South Carolina region), and one Wellness center (in the Columbia, South Carolina region), and we closed one physical therapy office (in the Columbia, South Carolina region). The number of centers increased from 52 to 58 during fiscal year 2007. We added five Doctors Care offices (three in the Charleston, South Carolina region and two in the Greenville-Spartanburg, South Carolina region) and one physical therapy office (in the Myrtle Beach, South Carolina region). The number of centers increased from 58 to 62 during fiscal year 2008. We added three Doctors Care offices (two in the Pee Dee, South Carolina region and one in the Myrtle Beach, South Carolina region) and one physical therapy office (in the Pee Dee, South Carolina region).
Our centers are broadly distributed throughout the State of South Carolina, and one is in Knoxville, Tennessee. Twenty-two centers are in the Columbia, South Carolina region (including seven physical therapy offices, one pediatric office, one orthopedic office, and one wellness office), sixteen in the Charleston, South Carolina region (including six physical therapy offices), seven in the Myrtle Beach, South Carolina region (including one physical therapy office), three in the Aiken, South Carolina region (including one physical therapy office), three in the Pee Dee, South Carolina region (including one physical therapy office), ten in the Greenville-Spartanburg, South Carolina region (including three physical therapy offices), and one in Knoxville, Tennessee.
7
Table of Contents
Medical Services Provided at the Centers
Our centers offer out-patient medical care for treatment of acute, episodic, and some minor chronic medical problems. The centers provide a broad range of medical services that would generally be classified as within the scope of family practice, primary care, and occupational medicine. We also offer pediatric and orthopedic medical services at two of our centers, and physical therapy at our 19 physical therapy sites. Licensed medical providers, nurses, and auxiliary support personnel provide the medical services. The services provided at the centers include, but are not limited to, the following:
| • | Routine care of general medical problems, including colds, flu, ear infections, hypertension, asthma, pneumonia, and other conditions typically treated by primary care providers; |
| • | Treatment of injuries, such as simple fractures, dislocations, sprains, bruises, and cuts; |
| • | Minor surgery, including suturing of lacerations and removal of cysts and foreign bodies; |
| • | Diagnostic tests, such as x-rays, electrocardiograms, complete blood counts, and urinalyses; and, |
| • | Occupational and industrial medical services, including drug testing, workers’ compensation cases, and physical examinations. |
Patient Charges and Payments
The fees charged to a patient are determined by the nature of medical services rendered. Our management believes that the charges at our centers are significantly lower than the charges of hospital emergency departments and are generally competitive with the charges of local physicians and other providers in the area. For the majority of our patients the charges are established by third-party payers.
Our centers accept payment from a wide range of sources. These include patient payments at time of service (by cash, check, or credit card), patient billing, and assignment of insurance benefits (including Blue Cross Blue Shield, Workers’ Compensation, and other private insurance). We also provide services for members of the three largest health maintenance organizations (“HMOs”) operating in South Carolina – BlueChoice HealthPlan (“BCHP”), Cigna/HealthSource South Carolina, Inc., and Carolina Care Plan.
Revenues generated from billings to Blue Cross Blue Shield of South Carolina (“BCBS”) and its subsidiaries, BCHP and Companion Property and Casualty Insurance Company (“CP&C”), totaled approximately 40%, 39%, and 38%, of the Company’s total revenues for fiscal years 2008, 2007, and 2006, respectively. BCBS and its subsidiaries own approximately 68% of our outstanding common stock. (See Footnote 11 to audited Consolidated Financial Statements for information on related parties.)
During the past three fiscal years, we have continued our services provided to members of HMOs. In these arrangements, we, through the P.A., act as the designated primary caregiver for members of HMOs who have selected one of our centers or providers as their primary care provider. In fiscal year 1994, we began participating in an HMO operated by BCHP and CP&C, wholly owned subsidiaries of BCBS. (See Footnote 11 to audited Consolidated Financial Statements for information on related parties.) As of September 30, 2008, all of these HMOs use a discounted fee-for-service basis for payment. HMOs do not, at this time, have a significant penetration into the South Carolina market. We are not certain if the market share of HMOs will grow in the areas in which we operate centers.
Revenues in fiscal years 2008, 2007, and 2006, also reflect our occupational medicine and industrial healthcare services (these revenues are referred to as “employer paid” and “workers’ compensation” on the table depicted below). Approximately 15% of our total revenue was derived from these occupational medicine services in fiscal year 2008, while 15% and 17% were derived in fiscal years 2007 and 2006, respectively.
8
Table of Contents
The following table sets forth our revenue and patient visits by revenue source for fiscal years 2008, 2007, and 2006:
| Percent of Patient Visits | Percent of Revenue | |||||||||||
| 2008 | 2007 | 2006 | 2008 | 2007 | 2006 | |||||||
| Patient Pay |
16 | 16 | 16 | 8 | 10 | 10 | ||||||
| Employer Paid |
8 | 9 | 9 | 3 | 3 | 4 | ||||||
| HMO |
6 | 5 | 6 | 7 | 7 | 6 | ||||||
| Workers’ Compensation |
10 | 10 | 11 | 12 | 12 | 13 | ||||||
| Medicare/Medicaid |
14 | 13 | 12 | 13 | 13 | 12 | ||||||
| Insured Patients |
43 | 44 | 43 | 55 | 52 | 49 | ||||||
| Other (Commercial Indemnity, Champus, etc.) |
3 | 3 | 3 | 2 | 3 | 6 | ||||||
| 100 | 100 | 100 | 100 | 100 | 100 | |||||||
As insurers attempt to cut costs, they typically increase the administrative burden placed on providers by requiring referral approvals and by requesting hard copies of medical records before they will pay claims. The number of patients at our centers that are covered by managed care plans is significant and accounted for 55%, 52% and 49% of our revenues in 2008, 2007 and 2006, respectively.
In accordance with the Administrative Services Agreements described previously, UCI-SC, as the agent for each P.A., processes all payments for the P.A. When payments for the P.A. are received, they are deposited in accounts owned by each P.A. and are automatically transferred to a lockbox account owned by UCI-SC. In no event are the physicians entitled to receive such payments. The patient mix in no way affects our management service fees per the Administrative Services Agreement.
Fee Arrangements
Medical services traditionally have been provided on a fee-for-service basis with insurance companies assuming responsibility for paying all or a portion of such fees. The increase in medical costs under traditional indemnity healthcare plans has been caused by a number of factors. These factors include: (i) the lack of incentives on the part of healthcare providers to deliver cost-effective medical care; (ii) the absence of controls over the utilization of costly specialty care physicians and hospitals; (iii) a growing and aging population that requires increased healthcare expenditures; and (iv) the expense involved with the introduction and use of advanced pharmaceuticals and medical technology.
As a result of escalating healthcare costs, employers, insurers, and governmental entities all have sought cost-effective approaches to the delivery of and payment for quality healthcare services. HMOs and other managed healthcare organizations have emerged as integral components in this effort. HMOs and managed care organizations enroll members by entering into contracts with employer groups or directly with individuals to provide a broad range of healthcare services for a capitation payment (we have no capitation arrangements at the present time) or a discounted fee-for-service schedule, with minimal or no deductibles or co-payments required of the members. HMOs and other managed care groups, in turn, contract with healthcare providers like us to administer medical care to their members. These contracts provide for payment to us on a discounted fee-for-service basis.
Certain third-party payers constantly seek various alternatives for reducing medical costs, some of which, if implemented, could affect our payment levels. Our management cannot predict whether changes in present payment methods will affect payments for services provided by the centers and, if so, whether they will have an adverse impact upon our business.
Competition and Marketing
All of our centers face competition, in varying degrees, from hospital emergency rooms, private doctor’s offices, other competing freestanding medical centers, hospital-supported urgent care offices and physical therapy offices. Some of these providers have financial resources that are greater than our resources. Our centers compete on the basis of accessibility, including evening and weekend hours, walk-in care, as well as limited appointment opportunities, and the attractiveness of our state-wide network to large employers and third-party payers. We have implemented substantial marketing efforts, which currently include radio and television advertisements. We have also added regional marketing representatives, developed focused promotional material, and initiated a newsletter for employers promoting our activities.
9
Table of Contents
Government Regulation
As participants in the healthcare industry, our operations and relationships are subject to extensive and increasing regulation by a number of governmental entities at the federal, state, and local levels.
Limitations on the Corporate Practice of Medicine
Federal law and the laws of many states, including South Carolina and Tennessee, generally specify who may practice medicine and limit the scope of relationships between medical practitioners and other parties. Under such laws, business corporations such as UCI and UCI-SC are prohibited from practicing medicine or exercising control over the provision of medical services. In order to comply with such laws, all medical services at our centers are provided by or are under the supervision of the P.A. pursuant to contracts with UCI-SC. The P.A. is organized so that the physicians who are employed by the P.A. offer all physician services. Neither UCI nor UCI-SC employs practicing physicians as practitioners, exerts control over any physician’s decisions regarding medical care, or represents to the public that it offers medical services.
As described previously, UCI-SC has entered into an Administrative Services Agreement with each P.A. to perform all non-medical management of the applicable P.A. and has exclusive authority over all aspects of the business of the P.A., other than those directly related to the provision of patient medical services or as otherwise prohibited by state law. (See “PART I – ITEM 1. – BUSINESS – Organizational Structure” above).
Because of the unique structure of the relationships existing between UCI-SC and each P.A., many aspects of our business operations have not been the subject of state or federal regulatory interpretation. We can give no assurance that a review by the courts or regulatory authorities of the business formerly or currently conducted by us will not result in a determination that could adversely affect our operations or that the healthcare regulatory environment will not change so as to restrict the existing operations or any potential expansion of our business.
Third Party Payments
Approximately 13, 13 and 12 percent of our revenue in 2008, 2007 and 2006, respectively, was derived from payments made by government-sponsored healthcare programs (principally, Medicare and Medicaid). As a result, any change in the laws, regulations, or policies governing reimbursements could adversely affect our operations. See “PART I – ITEM 1. – BUSINESS – Healthcare Reform” and “PART I – ITEM 1A. – RISK FACTORS – If the laws, regulations, and policies governing government-sponsored healthcare programs are changed, our operations could be materially adversely affected,” below. State and federal civil and criminal statutes also impose substantial penalties, including civil and criminal fines and imprisonment, on healthcare providers that fraudulently or erroneously bill governmental or other third-party payers for healthcare services. We believe we are in compliance with such laws, but we can give no assurance that our activities will not be challenged or scrutinized by governmental authorities.
Federal Anti-Kickback and Self-Referral Laws
Certain provisions of the Social Security Act, commonly referred to as the “Anti-kickback Statute,” prohibit the offer, payment, solicitation, or receipt of any form of remuneration in return for the referral of Medicare or state healthcare program patients or patient care opportunities, or in return for the recommendation, arrangement, purchase, lease, or order of items or services that are covered by Medicare or state healthcare programs. We believe that we are not in violation of the Anti-kickback Statute or similar state statutes.
On April 14, 1998, the Office of the Inspector General (the “OIG”), the government office that is charged with the enforcement of the federal Anti-kickback Statute, issued an advisory opinion regarding a proposed management services contract unrelated to us that involved a cost plus a percentage of net revenue payment arrangement (“Advisory Opinion 98-4”). Based on its analysis of the intent and scope of the Anti-kickback Statute, the OIG determined that it could not approve the arrangement because the structure of the management agreement raised the following concerns under the Anti-kickback Statute: (i) the agreement might include financial incentives to increase patient referrals; (ii) the agreement did not include any controls to prevent over utilization; and (iii) the
10
Table of Contents
percentage billing arrangement may include financial incentives that increase the risk of abusive billing practices. The OIG opinion did not find that the management arrangement violated the Anti-kickback Statute, rather that the arrangement may involve prohibited remuneration absent sufficient controls to minimize potential fraud and abuse. An OIG advisory opinion is only legally binding on the Department of Health and Human Services (including the OIG) and the requesting party and is limited to the specific conduct of the requesting party because additional facts and circumstances could be involved in each particular case. Accordingly, we believe that Advisory Opinion 98-4 does not have broad application to the provision by UCI and UCI-SC of nonmedical management and administrative services for the centers. We also believe that we have implemented appropriate controls to ensure that the arrangements between UCI and UCI-SC and the centers do not result in abusive billing practices or the over utilization of items and services paid for by federal healthcare programs.
The applicability of the Anti-kickback Statute to many business transactions in the healthcare industry, including the service agreements with the centers and the development of ancillary services by UCI and UCI-SC, has not been subject to any significant judicial and regulatory interpretation. We believe that although remuneration for the management services is provided for under our service agreements with the centers, UCI and UCI-SC are not in a position to make or influence referrals of patients or services reimbursed under Medicare or state healthcare programs to the centers. In addition, UCI and UCI-SC is not a separate provider of Medicare or state healthcare program reimbursed services. Consequently, we do not believe that the service and management fees payable to UCI and UCI-SC should be viewed as remuneration for referring or influencing referrals of patients or services covered by such programs as prohibited by the Anti-kickback Statute.
The U.S. Congress in the Omnibus Budget Reconciliation Act of 1993 enacted significant prohibitions against physician referrals. Subject to certain exemptions, a physician or a member of his or her immediate family is prohibited from referring Medicare or Medicaid patients to an entity providing “designated health services” in which the physician has an ownership or investment interest or with which the physician has entered into a compensation arrangement. While we believe we are currently in compliance with such legislation, future regulations could require us to modify the form of our relationships with physician groups.
State Anti-Kickback and Self-Referral Laws
Some states have also enacted similar self-referral laws, and we believe that more states will likely follow. We believe that our practices fit within exemptions contained in such laws. Nevertheless, in the event we expand our operations to certain additional jurisdictions, structural and organizational modifications of our relationships with physician groups might be required to comply with new or revised state statutes. Such modifications could adversely affect our operations.
Through UCI’s wholly owned subsidiary, UCI-SC, we provide non-medical management and administrative services to the centers in South Carolina and Tennessee. South Carolina and Tennessee have adopted anti-kickback and self-referral laws that regulate financial relationships between healthcare providers and entities that provide healthcare services. The following is a summary of the applicable state anti-kickback and self-referral laws.
South Carolina
South Carolina’s Provider Self-Referral Act of 1993 generally provides that a healthcare provider may not refer a patient for the provision of any designated healthcare service to an entity in which the healthcare provider is an investor or has an investment interest. Under our current operations, we do not believe UCI or UCI-SC is an entity providing designated healthcare services for purposes of the South Carolina Provider Self-Referral Act. The centers provide all healthcare services to patients through employees of the P.A. No provider investors in the P.A. refer patients to the centers for designated healthcare services. Accordingly, under South Carolina law, we believe that the provider self-referral prohibition would not apply to our centers or operations in South Carolina.
In addition to self-referral prohibitions, South Carolina’s Provider Self-Referral Act of 1993 also prohibits the offer, payment, solicitation, or receipt of a kickback, directly or indirectly, overtly or covertly, in cash or in kind, for referring or soliciting patients. We believe that payment arrangements are reasonable compensation for services rendered and do not constitute payments for referrals.
11
Table of Contents
Tennessee
The Tennessee physician conflict of interest/disclosure law provides that physicians are free to enter into lawful contractual relationships, including the acquisition of ownership interests in healthcare facilities. The law further recognizes that these relationships can create potential conflicts of interests, which shall be addressed by the following: (a) the physician has a duty to disclose to the patient or referring colleagues such physician’s ownership interest in the facility or therapy at the time of referral and prior to utilization; (b) the physician shall not exploit the patient in any way, as by inappropriate or unnecessary utilization; (c) the physician’s activities shall be in strict conformity with the law; (d) the patient shall have free choice either to use the physician’s proprietary facility or therapy or to seek the needed medical services elsewhere; and (e) when a physician’s commercial interest conflicts so greatly with the patient’s interest as to be incompatible, the physician shall make alternative arrangements for the care of the patient.
We believe that Tennessee’s conflict of interest/disclosure law does not apply to our current operations because UCI and UCI-SC are not providers of healthcare services. The centers provide all healthcare services to patients through employees of the P.A. Even if the Tennessee conflict of interest/disclosure law were to apply, our internal quality assurance/utilization review programs will help identify any inappropriate utilization by a center.
Tennessee also has a law regulating healthcare referrals. The general rule is that a physician who has an investment interest in a healthcare entity shall not refer patients to the entity unless a statutory exception exists. A healthcare entity is defined as an entity that provides healthcare services. We believe that UCI and UCI-SC do not fit within the definition of a “healthcare entity” because UCI and UCI-SC are not providers of healthcare services. The centers provide all healthcare services to patients through employees of the P.A. No provider investors in the P.A. refer patients for designated healthcare services except the sole physician shareholder of the P.A. We believe that referrals by the sole shareholder of the P.A. come within a statutory exception. Accordingly, under Tennessee law, we believe that the provider self-referral prohibition would not apply to our center or operations in Tennessee.
Tennessee’s anti-kickback provision prohibits a physician from making payments in exchange for the referral of a patient. In addition, under Tennessee law a physician may not split or divide fees with any person for referring a patient. The Tennessee Attorney General has issued opinions that determined that the fee-splitting prohibition applied to management services arrangements. The Tennessee fee-splitting prohibition contains an exception for reasonable compensation for goods or services. We believe that the payment arrangements between UCI and UCI-SC, as applicable, and the centers are reasonable compensation for services rendered and do not constitute payments for referrals or a fee-splitting arrangement.
Antitrust Laws
Because each P.A. is a separate legal entity, each may be deemed a competitor subject to a range of antitrust laws that prohibit anti-competitive conduct, including price fixing, concerted refusals to deal, and division of market. We believe we are in compliance with such state and federal laws that may affect our development of integrated healthcare delivery networks, but we can give no assurance that a review of our business by courts or regulatory authorities will not result in a determination that could adversely affect our operations.
Healthcare Reform Initiatives
President Obama and members of Congress have recently proposed significant reforms to the U.S. healthcare system. Both the U.S. Senate and House of Representatives have conducted hearings about U.S. healthcare reform. The Obama administration’s fiscal year 2010 budget included proposals to limit Medicare payments and increase taxes. In addition, members of Congress have proposed a public (government) healthcare insurance option to compete with private plans, healthcare insurance co-ops and other publicly sponsored healthcare measures. Various healthcare reform proposals have also emerged at the state level. We cannot predict what healthcare initiatives, if any, will be implemented at the federal or state level, or the effect any future legislation or regulation will have on us.
Regulation of Provider Networks
Many states regulate the establishment and operation of networks of healthcare providers. Generally, these laws do not apply to the hiring and contracting of physicians by other healthcare providers. South Carolina and Tennessee do not currently regulate the establishment or operation of networks of healthcare providers except where such entities provide utilization review services through
12
Table of Contents
private review agents. We believe that we are in compliance with these laws in the states in which we currently do business, but we can give no assurance that future interpretations of these laws by the regulatory authorities in South Carolina, Tennessee, or the states in which we may expand in the future will not require licensure of our operations as an insurer or provider network or a restructuring of some or all of our operations. In the event we are required to become licensed under these laws, the licensure process can be lengthy, costly and time consuming and, unless the regulatory authority permits us to continue to operate while the licensure process is progressing, we could experience a material adverse change in our business while the licensure process is pending. In addition, many of the licensing requirements mandate strict financial and other requirements that we may not immediately be able to meet. Further, once licensed, we would be subject to continuing oversight by and reporting to the respective regulatory agency.
HIPAA
Under the Health Insurance Portability and Accountability Act of 1996 (“HIPAA”), the Secretary of Health and Human Services (“HHS”) has adopted national data interchange standards for some types of electronic transactions and the data elements used in those transactions; adopted security standards to protect the confidentiality, integrity and availability of patient healthcare information; and adopted privacy standards to prevent inappropriate access, use and disclosure of patient healthcare information. In December 2000, HHS published the final privacy regulations that took effect in April 2003. These regulations restrict the use and disclosure of individually identifiable healthcare information without the prior informed consent of the patient. In February 2003, HHS published the final security regulations, which took effect in April 2005. These regulations mandate that healthcare facilities implement operational, physical and technical security measures to reasonably prevent accidental, negligent, or intentional inappropriate access or disclosure of patient healthcare information. A violation of HIPAA’s standard transactions, privacy and security provisions may result in criminal and civil penalties, which could adversely affect our financial condition and results of operations. See “PART I – ITEM 1A. – RISK FACTORS – We are required to comply with laws governing the transmission, security and privacy of healthcare information that require significant compliance costs, and any failure to comply with these laws could result in material criminal and civil penalties,” below. We conduct our operations in an attempt to comply with all applicable HIPAA requirements, but we can give no assurance that our activities or interpretations of applicable law will not be challenged or scrutinized by governmental authorities.
Employees
As of September 30, 2008, we had 862 employees (658 on a full-time equivalent basis). This amount includes 193 medical providers employed by the P.A.
Investing in our common stock involves various risks which are particular to our Company, our industry and our market area. Several risk factors regarding investing in our common stock are discussed below. This listing should not be considered as all-inclusive. Any of the following risks, as well as other risks, uncertainties, and possibly inaccurate assumptions underlying our plans and expectations, could result in material harm to our business, results of operations and financial condition and cause the value of our securities to decline, which in turn could cause investors to lose all or part of their investment in our Company. These factors, among others, could also cause actual results to differ from those we have experienced in the past or those we may express or imply from time to time in any forward-looking statements we make. See “Advisory Note Regarding Forward-Looking Statements” above in this Report. Investors are advised that it is impossible to identify or predict all risks, and that risks not currently known to us or that we currently deem immaterial also could affect us in the future.
Our determination that previously issued consolidated financial statements should no longer be relied upon and the restatement of our consolidated financial statements has subjected us to significant cost and a number of additional risks and uncertainties, including increased costs for accounting and legal fees and the increased possibility of legal proceedings.
As previously disclosed in Forms 8-K filed January 15, 2009 and August 6, 2008 and as discussed elsewhere in this Form 10-K and in Note 2 to our restated consolidated financial statements, we determined that our previously issued financial statements for all prior years and interim periods dating back to our fiscal year ended September 30, 2002 should no longer be relied upon because of errors
13
Table of Contents
in such financial statements. We further determined to restate in this Report the following: our consolidated balance sheet as of September 30, 2007, and the related consolidated statements of income, stockholders’ equity and cash flows for the years ended September 30, 2007 and 2006; the annual financial information set forth in “PART II – ITEM 6. – SELECTED FINANCIAL DATA” in this Form 10-K as of September 30, 2006, 2005, 2004, 2003 and 2002; the quarterly financial information for the three quarters ended June 30, 2008, March 31, 2008 and December 31, 2007; and the quarterly financial information for each quarter in the years ended September 30, 2007 and 2006. This restatement has subjected us to significant cost and a number of additional risks and uncertainties, including the following:
| • | Substantial unanticipated costs in the form of accounting, legal fees and similar professional fees, in addition to the substantial diversion of time and attention of our Chief Financial Officer and members of our finance department in preparing the restatement. Although the restatement is complete, we can give no assurance that we will not incur additional costs associated with the restatement. |
| • | As a result of the determination that our previously issued financial statements could no longer be relied upon and the restatement of certain prior financial statements, we may be susceptible to legal claims or lawsuits from current or former stockholders, regulators or others. If such events occur, we may incur substantial defense costs regardless of the outcome of these actions and insurance and indemnification may not be sufficient to cover the losses we may incur. Likewise, such events might cause a further diversion of our management’s time and attention. If we do not prevail in one or more of these potential actions, we could be required to pay substantial damages or settlement costs, which could adversely affect our business, financial condition, results of operations and liquidity. |
We have had a material weakness in our internal control over financial reporting and we cannot assure that we have developed an effective remediation plan.
As part of the Investigation, we have identified deficiencies in our internal control over financial reporting. We believe that we have properly remediated the material weaknesses in our internal control over financial reporting that were identified, but we cannot assure you that we have adequately addressed these deficiencies or that we have discovered all of the deficiencies that may exist in our internal control over financial reporting.
We can provide no assurance that our medical centers will be able to compete effectively with other existing healthcare providers.
The business of providing healthcare-related services is highly competitive. Many companies, including professionally managed physician practice management companies like ours, manage medical clinics, and employ clinic physicians at the clinics. Large hospitals, other physician practice centers, retail healthcare providers, private doctor’s offices and healthcare companies, HMOs, and insurance companies are also involved in activities similar to ours. Because our main business is the provision of medical services to the general public, our primary competitors are the local physician practices and hospital emergency rooms in the markets where we operate medical centers. Increased competition is expected in our markets from retail healthcare providers, often located in retail businesses such as drug stores and discount store operations, which offer treatment without an appointment for certain permitted routine diagnoses. Some of these competitors have longer operating histories or significantly greater resources than we do. In addition, traditional sources of medical services, such as hospital emergency rooms and private physicians, have had in the past a higher degree of recognition and acceptance than the medical centers that we operate. We cannot assure you that we will be able to compete effectively or that additional competitors will not enter the market in the future.
If a regulatory authority finds that our organization and relationships do not comply with existing or future laws and regulations, our operations could be materially adversely affected.
As a participant in the healthcare industry, our operations and relationships are subject to extensive and increasing regulation by a number of governmental bodies at the federal, state and local levels. Although we have tried to structure our business to comply with these existing laws and regulations, we have had little guidance as to whether we comply or not because of the unique structure of our business operations. We cannot assure you that a review by the courts or regulatory authorities of our former or current business will not result in a determination that could adversely affect our operations. In particular, we can provide you with no assurance that a court or regulatory body would find that our structure and business operations comply with the following:
14
Table of Contents
| • | State and federal laws limiting the provision of medical services by business corporations; |
| • | State and federal anti-kickback and self-referral laws; |
| • | Antitrust laws; and, |
| • | Federal and state laws and regulations governing insurance companies, HMOs, and other managed care organizations. |
We have provided you with a discussion of each of these areas in the section titled “Government Regulation” under PART 1 – ITEM 1, above.
Furthermore, the laws and regulations governing the healthcare industry change rapidly and constantly. Political, economic and regulatory influences are currently subjecting the healthcare industry to fundamental changes. We anticipate that the current presidential administration, Congress and certain state legislatures will continue to review and assess alternative healthcare delivery systems and payment methods with an objective of ultimately reducing healthcare costs and expanding access. Public debate of these issues will likely continue in the future. At this time, we cannot predict which, if any, healthcare reform proposals will be adopted, but any initiatives that force us to modify or restrict our existing operations and any proposed expansion of our business could materially affect our business.
If the laws, regulations, and policies governing government-sponsored healthcare programs are changed, our operations could be materially adversely affected.
We have derived approximately 13, 13 and 12 percent of our revenues in 2008, 2007 and 2006, respectively, from payments made by government-funded healthcare programs (principally, Medicare and Medicaid). President Obama and both houses of Congress have recently proposed and are currently engaged in active debate concerning reformation of the structure and funding for the U.S. healthcare system, including the Medicare and Medicaid programs. Although none of the bills currently being considered have become law, various proposals contain items that would have a material adverse impact on government-sponsored healthcare programs, such as proposals to limit Medicare payments and increase taxes. Also, many states have enacted or are considering enacting measures designed to reduce Medicaid expenditures. States have also adopted, or are considering, legislation designed to reduce coverage and program eligibility and/or impose additional taxes on hospitals to help finance or expand states’ Medicaid systems. We are unable to predict the future course of federal or state healthcare legislation. Further changes in the law or regulatory framework that reduce our revenues or increase our costs could have a material adverse effect on our business, financial condition or results of operation.
We are subject to healthcare fraud and abuse regulations that could result in significant liability, require us to change our business practices and restrict our operations in the future.
We are subject to various U.S. federal and state laws targeting fraud and abuse in the healthcare industry, including anti-kickback and false claims laws. Violations of these laws are punishable by criminal or civil sanctions, including substantial fines, imprisonment and exclusion from participation in healthcare programs such as Medicare and Medicaid. Additionally, state and federal civil and criminal statutes impose substantial penalties, including civil and criminal fines and imprisonment, on healthcare providers that fraudulently or wrongfully bill governmental or other third-party payers for healthcare services. We believe we are in material compliance with these laws, but we cannot assure you that our activities will not be challenged or scrutinized by governmental authorities.
We are required to comply with laws governing the transmission, security and privacy of healthcare information that require significant compliance costs, and any failure to comply with these laws could result in material criminal and civil penalties.
Numerous state and federal laws and regulations govern the collection, dissemination, use and confidentiality of patient-identifiable healthcare information, including HIPAA and its related rules and regulations. The HIPAA privacy rules restrict the use and disclosure of patient information and requires entities to safeguard that information and to provide certain rights to individuals with respect to that information. The HIPAA security rules establish elaborate requirements for safeguarding patient information transmitted or stored electronically. We conduct our operations in an attempt to comply with all applicable HIPAA requirements.
15
Table of Contents
Given the complexity of the HIPAA regulations, the possibility that the regulations may change and the fact that the regulations are subject to changing and sometimes conflicting interpretation, our ongoing ability to comply with the HIPAA requirements is uncertain. Additionally, the costs of complying with any changes to the HIPAA regulations may have a negative impact on our operations. Sanctions for failing to comply with the HIPAA healthcare information provisions include criminal penalties and civil sanctions, including significant monetary penalties. A failure by us to comply with state healthcare laws that may be more restrictive than the HIPAA regulations could result in additional penalties.
Departures of our key personnel or directors may impair our operations.
We have two executive officers. D. Michael Stout, M.D., serves as our President, Chief Executive Officer and Director of Medical Affairs. Joseph A. Boyle, CPA, serves as our Executive Vice President and Chief Financial Officer. They are instrumental in our organization and are the key executives in charge of our medical and business operations. We cannot be assured of the continued service of either of them and each of them would be difficult to replace. Additionally, our directors’ community involvement, diverse backgrounds, and extensive business relationships are important to our success.
Because of the nature of our business, we run the risk that we will be unable to collect the fees that we have earned.
Virtually all of our consolidated net revenue was derived in the past, and we believe will be derived in the future, from our medical centers’ charges for services on a fee-for-service basis. Accordingly, we assume the financial risk related to collection, including the potential uncollectability of accounts, long collection cycles for accounts receivable, and delays associated with reimbursement by third-party payers, such as governmental programs, private insurance plans and managed care organizations. Increases in write-offs of doubtful accounts, delays in receiving payments or potential retroactive adjustments, and penalties resulting from audits by payers may require us to borrow funds to meet our current obligations or may otherwise have a material adverse effect on our financial condition and results of operations.
We are subject to certain special risks in connection with the intangible assets reported on our balance sheet.
As a result of our various acquisition transactions, intangible assets (net of accumulated amortization) of approximately $3.4 million have been recorded on our balance sheet as of September 30, 2008. Because of a change in accounting principles adopted by the accounting profession, we ceased amortizing our intangible assets in the fiscal year ending September 30, 2002. Instead, after an initial review of our intangible assets for impairment in connection with our adoption of this new accounting principle, we analyze our intangible assets on an annual basis for impairment of value. Under these current accounting principles, our net unamortized balance of intangible assets acquired was not considered to be impaired as of September 30, 2008.
We cannot assure you that we will ever realize the value of our remaining intangible assets in the future. We may be required to recognize that the value of our intangible assets has been impaired in our subsequent annual reviews upon analyzing our operating results. Any future determination that a significant impairment has occurred would require us to write-off the impaired portion of our remaining intangible assets, which could have a material adverse effect on our results of operations and financial condition.
Changes in accounting standards could impact reported earnings.
The accounting standard setters, including the FASB, the SEC and other regulatory bodies, periodically change the financial accounting and reporting standards that govern the preparation of our consolidated financial statements. These changes can be hard to predict and can materially impact how we record and report our financial condition and results of operations. Among other possible impacts, we could be required to apply a new or revised standard retroactively, which could result in material changes to, and restatements of, prior period financial statements.
You may have difficulty in selling your shares because of the absence of an active public market.
On February 13, 2009, our common stock was delisted from the Over-the-Counter Bulletin Board (“OTCBB”) as a result of our failure to timely file with the SEC our Annual Report on Form 10-K. Such failure was due to the Investigation of our former CFO. Since February 13, 2009, our common stock has traded on the Pink Sheets Electronic Over-the-Counter Market (“Pink Sheets”). Consequently, our stockholders may find disposing of shares of our common stock and obtaining accurate quotations of its market value more difficult. In addition, the delisting may make our common stock substantially less attractive as:
16
Table of Contents
| • | collateral for loans; |
| • | an investment by financial institutions because of their internal policies or state legal investment laws; |
| • | consideration to finance any future acquisitions of medical practices; and, |
| • | an investment opportunity by investors should we desire to raise additional capital in the future. |
We have been informed that the NASD may be considering higher standards for permitting quotations of securities on the OTCBB. If the NASD does raise its standards, relisting on the OTCBB may no longer be available as a trading market for our stockholders. Consequently, potential investors should only invest in our common stock if they have a long-term investment intent. If an active market does not develop and a stockholder desires to sell its shares of our common stock, the stockholder will be required to locate a buyer on its own and may not be able to do so.
The absence of a public market makes the price of our common stock particularly volatile and susceptible to market fluctuations.
Trading in our common stock has historically been very limited, and we cannot assure stockholders that an active trading market for our common stock will ever develop or be sustained. Because of the limited trading liquidity in our common stock, the market price of our common stock has been vulnerable to significant fluctuations in response to very limited market trading in our shares. Sales of substantial amounts of our common stock in the public market, or the perception that these sales could occur, could adversely affect prevailing market prices of our common stock and could impair our future ability to raise capital through the sale of our equity securities. The market price of our common stock will remain subject to significant fluctuations in response to these factors as well as in response to operating results and other factors affecting stock prices generally. The stock market in recent years has experienced price and volume fluctuations that often have been unrelated or disproportionate to the operating performance of companies. These fluctuations, as well as general economic and market conditions, may adversely affect the market price of our common stock in the future. We are unable to predict the effect, if any, that future sales of our common stock or the availability of our common stock for sale may have on the market price of our common stock from time to time.
Stockholders may have difficulty selling their shares because our common stock is a “penny stock” and is subject to special SEC rules that make transactions in our common stock burdensome for broker-dealers.
Our stock is a “penny stock.” The Commission has adopted regulations which generally define “penny stock” as any equity security that has a market price (as defined) less than $5.00 per share or an exercise price of less than $5.00 per share, subject to certain exceptions. Our common stock is covered by the Commission’s penny stock rules, which impose additional sales practice requirements on broker-dealers who sell to persons other than established customers and “accredited investors.” The term “accredited investor” refers generally to institutions with assets in excess of $5,000,000 or individuals with a net worth in excess of $1,000,000 or annual income exceeding $200,000 or $300,000 jointly with their spouse. If a penny stock is traded in the secondary market, the Commission rules require the broker-dealer to provide to the purchaser a standardized risk disclosure schedule prepared by the Commission explaining the nature of the penny stock market and the risks associated with it. The broker-dealer also must provide to the purchaser the current bid and offer quotations for the penny stock, the compensation payable to both the broker-dealer and its registered representative, and the rights and remedies available to an investor in cases of fraud in penny stock transactions. If the broker-dealer is the sole market maker, the broker-dealer must disclose to the purchaser this fact and the broker-dealer’s presumed control over the market. The foregoing information must be given to the purchaser orally or in writing prior to effecting the transaction and must be given to the purchaser in writing before or with the purchaser’s confirmation. In addition, the penny stock rules require that prior to a transaction in a penny stock not otherwise exempt from the rules, the broker-dealer must make a special written determination that the penny stock is a suitable investment for the purchaser and that the purchaser has sufficient knowledge and experience in financial matters to be capable of evaluating the risks of transactions in penny stocks and must receive the purchaser’s written agreement to the transaction. Finally, after the sale, the broker-dealer must provide to the purchaser monthly account statements showing the market value of each penny stock held in the purchaser’s account and containing information on the limited market in penny stocks. The additional burdens that these Commission rules impose upon broker-dealers may discourage broker-dealers from effecting transactions in our common stock and could severely limit a stockholder’s ability to sell its shares in the secondary market.
17
Table of Contents
The market price of our common stock may fluctuate widely in the future.
The trading price of our common stock could be subject to wide fluctuations in response to quarter-to-quarter variations in our operating results, material announcements made by us from time to time, governmental regulatory action, general conditions in the healthcare industry, or other events, or factors, many of which are beyond our control. In addition, the stock market has experienced extreme price and volume fluctuations, which have particularly affected the market prices of many healthcare services companies and which have often been unrelated to the operating performance of these companies. Our operating results in future quarters may be below the expectations of securities analysts and investors. In this event, the price of our common stock would likely decline, perhaps substantially.
Anti-takeover provisions in our certificate of incorporation and state corporate laws could deter or prevent take-over attempts by a potential purchaser of our common stock and deprive you of the opportunity to obtain a takeover premium for your shares.
In many cases, stockholders receive a premium for their shares when a company is purchased by another. Various provisions in our certificate of incorporation and bylaws and state corporate laws could deter and make it more difficult for a third party to bring about a merger, sale of control, or similar transaction without approval of our board of directors. These provisions tend to perpetuate existing management. As a result, our stockholders may be deprived of opportunities to sell some or all of their shares at prices that represent a premium over market prices.
These provisions, which could make it less likely that a change in control will occur, include:
| • | provisions in our certificate of incorporation establishing three classes of directors with staggered terms, which means that only one-third of the members of the board of directors is elected each year and each director serves for a term of three years. |
| • | provisions in our certificate of incorporation authorizing the board of directors to issue a series of preferred stock without stockholder action, which issuance could discourage a third party from attempting to acquire, or make it more difficult for a third party to acquire, a controlling interest in us. |
We do not expect to pay dividends on our common stock in the foreseeable future.
We intend to retain future earnings, if any, for use in the operation and expansion of our business. Consequently, we do not plan to pay dividends until we recover any losses that we have incurred and become profitable. Additionally, our future dividend policy will depend on our earnings, financial condition, and other factors that our Board of Directors considers relevant.
Stockholders may suffer dilution in their interests in our common stock if we offer additional shares of common stock in the future or if certain third parties exercise their option rights to acquire additional shares of our common stock.
Although we have no present intent to offer for sale additional shares of common stock, we cannot ensure that, in the future, we will not have to seek additional capital by offering and selling additional shares of common stock in order to continue to operate, acquire additional medical practices in our current or other markets, or achieve successful operations. If it becomes necessary to raise additional capital to support our operations, there is no assurance that additional capital will be available to us, that additional capital can be obtained on terms favorable to us, or that the price of any additional shares that may be offered by us in the future will not be less than the subscription price paid by our stockholders. Although the precise effect on existing stockholders of sales of additional shares of common stock cannot presently be determined, either or both the ownership and voting percentage and the relative value of shares of common stock held by our existing stockholders could be diluted by our issuance of additional stock.
As of December 31, 2009, BCHP, a wholly-owned subsidiary of BCBS, owned in the aggregate 6,726,019 shares, or approximately 67.71 percent, of our outstanding common stock. Under various agreements among BCHP and us, we have given these companies the right at any time to purchase from us the number of shares of our voting stock as is necessary for BCBS and its affiliated entity, as a group, to obtain and then maintain an aggregate ownership of not less than 48 percent of our outstanding voting stock. To the extent the BCBS subsidiary exercises its right in conjunction with a sale of voting stock by us to other parties, the price to be paid by the
18
Table of Contents
BCBS subsidiary is the average price to be paid by the other purchasers in that sale. Otherwise, the price is the average closing bid price of our voting stock on the ten trading days immediately preceding the election by the BCBS subsidiary to exercise its purchase rights. Consequently, to the extent the BCBS subsidiary elects to exercise any or a portion of its rights under these anti-dilution agreements, the sale of shares of common stock to the BCBS subsidiary will have the effect of further reducing the percentage voting interest in us represented by a share of the common stock.
Certain affiliates have the ability to exercise substantial influence.
The substantial ownership of our common stock by the BCBS subsidiary and other of our affiliates may provide them with the ability to exercise substantial influence over, or based on the present ownership of the BCBS subsidiary, determine the outcome of, the election of directors and other matters submitted for approval by our stockholders. As a result, other stockholders may be unable to successfully oppose matters that are presented by these entities for action by stockholders, or to take actions that are opposed by these entities. The ownership by these entities may also have the effect of delaying, deterring, or preventing a change in our control without the consent of these entities. These effects could reduce the value of our stock. In addition, sales of common stock by these entities could result in another stockholder obtaining control over us.
We are dependent upon the good reputation of our physicians.
The success of our business is dependent upon quality medical services being rendered by our physicians. As the patient-physician relationship involves inherent trust and confidence, any negative publicity, whether from civil litigation, allegations of criminal misconduct, or forfeiture of medical licenses, with respect to any of our physicians and/or our facilities could adversely affect our results of operations.
Our revenues and profits could be diminished if we lose the services of key physicians.
Substantially all of our revenues are derived from medical services performed by physicians. Some of our physicians produce more revenue than other physicians in our Company. Certain of these higher producing physicians could retire, become disabled, terminate their employment agreements or provider contracts, or otherwise become unable or unwilling to continue generating revenues at the current level, or discontinue practicing medicine within our organization. Patients who have been served by those physicians could choose to request medical services from our competitors, reducing our revenues and profits. Moreover, we may not be able to attract or retain other qualified physicians into our Company to replace the services of such physicians.
We may become subject to claims of medical malpractice for which our insurance coverage may not be adequate. Such claims could materially increase our costs and reduce our profitability.
Since we are involved in the delivery of healthcare services to the public, we are exposed to the risk of professional liability claims. Claims of this nature, if successful, could result in substantial damage awards to the claimants, which may exceed the limits of any applicable insurance coverage. We are currently insured under policies in amounts management deems appropriate, based upon historical claims and the nature and risk of our business. Nevertheless, there are exclusions and exceptions to coverage under each insurance policy that may make coverage for any claim unavailable, future claims could exceed the limits of available insurance coverage, existing insurers could become insolvent and fail to meet their obligations to provide coverage for such claims, and such coverage may not always be available with sufficient limits and at reasonable cost to adequately and economically insure us in the future. A judgment against us could materially increase our costs and reduce our profitability.
Our business is concentrated in specific geographic locations and could be affected by a depressed economy in these areas.
We provide our services primarily in South Carolina and have one center in Tennessee. A stagnant or depressed economy in South Carolina could affect all of our markets and adversely affect our business and results of operations.
Terrorist attacks, acts of war, natural disasters or other catastrophic events may adversely affect our operating results and financial condition.
Our centers are vulnerable to damage from hurricanes, tornados, fires, floods, power losses, telecommunications failures, computer viruses, acts of terrorism, acts of war and similar events that may cause an interruption in our business. Any such catastrophic event or other unexpected disruption of one or more of our centers could have a material adverse effect on our business, results of
19
Table of Contents
operations and financial condition. Furthermore, future terrorist attacks, acts of war, natural disasters or other catastrophic events may adversely affect prevailing economic conditions generally. These events, depending on their magnitude, could have a material effect on our operating results and financial condition.
ITEM 1B. UNRESOLVED STAFF COMMENTS
There are no comments from the staff of the SEC regarding our periodic or current reports under the Exchange Act that remain unresolved.
In September 2007, the Company formed a South Carolina limited liability company, UCI Properties, LLC (“UCI-LLC”), for the purpose of holding certain real estate. The sole member of UCI-LLC is UCI-SC.
During the quarter ended June 30, 2008, the Company entered into a loan agreement with a financial institution with a commitment level up to $3,200,000. The loan agreement was entered into by UCI-LLC to finance the purchase of, and renovations to, a new corporate headquarters located in Columbia, South Carolina. At September 30, 2008, the outstanding balance on the term note was approximately $1,400,000. The note has a variable interest rate based on the Adjusted Libor Rate with interest only payments due through September 2009. Starting in December 2009, the balance is payable in equal monthly installments of principal and interest in the amount of $11,407 with the balance due on March 5, 2015. The promissory note is collateralized by a lien on the property. As more fully discussed under the caption, “PART 1. – ITEM 1. BUSINESS – Recent Developments – Extension of Term and Mortgage Loans,” this loan was renewed and extended during 2009.
During fiscal year 2008, a center located in Surfside Beach, South Carolina was purchased by UCI-LLC for a total purchase price of $815,000. This property was previously rented by UCI-SC and occupied as a medical center. A portion of the purchase price was funded by a promissory note in the original principal amount of $695,000, and is collateralized with a lien on the property. At September 30, 2008, the outstanding balance on the mortgage loan was approximately $690,000. The promissory note accrues interest at a rate of 5.95 percent per annum. Starting on August 16, 2008 and continuing for 59 months thereafter, principal and interest payments in the amount of $5,890 are payable. The entire unpaid balance of principal and interest will be due on July 16, 2013.
Our centers are broadly distributed throughout the State of South Carolina, and one is in Knoxville, Tennessee. Twenty-two centers are in the Columbia, South Carolina region (including seven physical therapy offices, one pediatric office, one orthopedic office, and one wellness office), sixteen in the Charleston, South Carolina region (including six physical therapy offices), seven in the Myrtle Beach, South Carolina region (including one physical therapy office), three in the Aiken, South Carolina region (including one physical therapy office), three in the Pee Dee, South Carolina region (including one physical therapy office), ten in the Greenville-Spartanburg, South Carolina region (including three physical therapy offices), and one in Knoxville, Tennessee. The centers are all free-standing buildings in good repair. At September 30, 2008, our corporate offices were located on the second floor of one of the Columbia, South Carolina centers. In 2009, our corporate offices relocated to a newly renovated free-standing building in Columbia, South Carolina owned by UCI-LLC.
All of our centers are leased by UCI-SC, except for the one center which is owned by UCI-LLC. The centers are generally located on well-traveled streets or highways, with easy access. Each property offers free, off-street parking immediately adjacent to the center. Our lease terms range from five to twenty years. Most of our leases are classified as operating leases; however, we have twelve leases that are classified as capital leases, as of September 30, 2008. All of our capital leases have lease terms of twenty years and all have been executed since 2004. At September 30, 2008, we reported assets and liabilities of $9,334,040 and $9,784,416, respectively, associated with our capital leases related to real estate leases. Two centers are leased from physician employees of the P.A.
We are a party to various claims, legal activities, and complaints arising in the normal course of business. In the opinion of management and legal counsel, aggregate liabilities, if any, arising from currently known or pending legal actions would not have a material adverse effect on our financial position.
20
Table of Contents
ITEM 4. SUBMISSION OF MATTERS TO A VOTE OF SECURITY HOLDERS
None.
21
Table of Contents
PART II
ITEM 5. MARKET FOR REGISTRANT’S COMMON EQUITY, RELATED STOCKHOLDER MATTERS AND ISSUER PURCHASES OF EQUITY SECURITIES
Until October 19, 1998, UCI’s common stock was traded on the NASDAQ SmallCap Market under the symbol UCIA. On October 20, 1998, UCI’s common stock was delisted from trading on the NASDAQ SmallCap Market as a consequence of UCI’s failure to meet certain quantitative requirements under the NASD’s expanded listing criteria. Subsequent to October 20, 1998, trading in UCI’s common stock was conducted through the OTCBB. On February 13, 2009 UCI’s common stock was delisted from the OTCBB as a result of UCI’s failure to file its Annual Report on Form 10-K with the SEC. Such failure was due to the Investigation commenced by UCI’s Audit Committee on December 10, 2008 which is more fully discussed in this Form 10-K under the caption, “PART II – ITEM 7. – MANAGEMENT’S DISCUSSION AND ANALYSIS OF FINANCIAL CONDITION AND RESULTS OF OPERATIONS, Restatements and Related Matters.” Since February 13, 2009 UCI’s common stock has traded on the “Pink Sheets.”
The prices set forth below indicate the high and low bid prices reported on the over-the-counter bulletin board. The quotations reflect inter-dealer prices without retail markup, markdown, or commission and may not necessarily reflect actual transactions.
| Bid Price
| ||||
| High
|
Low
| |||
| Fiscal Year Ended September 30, 2008 |
||||
| 1st quarter (10/01/07 - 12/31/07) |
$4.44 | $3.65 | ||
| 2nd quarter (01/01/08 - 03/31/08) |
3.90 | 3.40 | ||
| 3rd quarter (04/01/08 - 06/30/08) |
3.50 | 3.00 | ||
| 4th quarter (07/01/08 - 09/30/08) |
3.10 | 2.30 | ||
| Fiscal Year Ended September 30, 2007 |
||||
| 1st quarter (10/01/06 - 12/31/06) |
$3.40 | $2.85 | ||
| 2nd quarter (01/01/07 - 03/31/07) |
3.55 | 2.98 | ||
| 3rd quarter (04/01/07 - 06/30/07) |
3.95 | 3.43 | ||
| 4th quarter (07/01/07 - 09/30/07) |
3.80 | 3.50 | ||
As of September 30, 2008, there were 242 stockholders of record of UCI’s common stock, excluding individual participants in security position listings.
UCI has not paid cash dividends on its common stock since its inception and has no plans to declare cash dividends in the foreseeable future.
During the fiscal year ended September 30, 2008, there were no shares of common stock issued by UCI upon the exercise of options which were registered under the Securities Act.
As of January 15, 2010, the high and low bid prices for our common stock on the Pink Sheets were $2.20 and $2.30, respectively.
22
Table of Contents
No equity securities of UCI were repurchased by UCI during the fiscal year ended September 30, 2008.
Equity Compensation Plan Information
During the fiscal year ended September 30, 2008, there were no securities issued upon exercise of outstanding options, warrants and rights, and no securities remaining available for future issuance, under equity compensation plans approved or not approved by security holders.
PERFORMANCE GRAPH
This Section is not soliciting material, is not deemed filed with the SEC or subject to Regulation 14A or 14C, or to the liabilities of Section 18 of the Securities Exchange Act of 1934, as amended, and is not to be incorporated by reference in any filing of the Company under the Securities Act of 1933, as amended, or the Securities Exchange Act of 1934, as amended, whether made before or after the date hereof and irrespective of any general incorporation language in any such filing.
The following graph compares cumulative total shareholder return of UCI’s common stock over a five-year period with The NASDAQ Global Market Index and with a Peer Group of companies for the same period. Total shareholder return represents stock price changes and assumes the reinvestment of dividends. The graph assumes the investment of $100 on September 30, 2003.
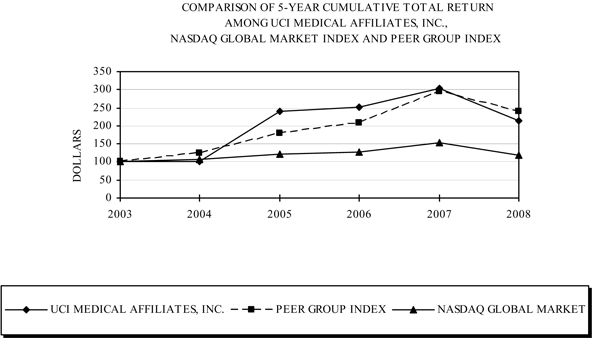
| Fiscal Year Ended | ||||||||||||
| 09/30/03 | 09/30/04 | 09/30/05 | 09/30/06 | 09/30/07 | 09/30/08 | |||||||
| UCI Medical Affiliates, Inc. |
100.00 | 100.00 | 241.18 | 252.10 | 302.52 | 214.29 | ||||||
| Peer Group |
100.00 | 125.35 | 180.38 | 208.36 | 293.90 | 240.96 | ||||||
| NASDAQ Global Market Index |
100.00 | 106.02 | 120.61 | 127.77 | 152.68 | 118.28 | ||||||
The members of the Peer Group are Continucare Corporation, IntegraMed America, Inc., Pediatrix Medical Group, Inc., and Metropolitan Health Networks. The returns of each company in the Peer Group have been weighted according to their respective stock market capitalization for purposes of arriving at a Peer Group average. The prices of UCI’s common stock used in computing the returns reflected above are the average of the high and low bid prices reported for UCI’s common stock during the fiscal year ended on such dates.
23
Table of Contents
ITEM 6. SELECTED FINANCIAL DATA
STATEMENTS OF INCOME DATA
| Years ended September 30, | |||||||||||||||||||||||||||
| 2008 | 2007 | 2006 | 2005 | 2004 | 2003 | 2002 | |||||||||||||||||||||
| Restated(1) | Restated(1) | Restated(1) | Restated(1) | Restated(1) | Restated(1) | ||||||||||||||||||||||
| unaudited (2) | unaudited (2) | unaudited (2) | unaudited (2) | ||||||||||||||||||||||||
| Revenues |
$ | 77,045,256 | $ | 71,645,715 | $ | 62,287,914 | $ | 55,769,651 | $ | 46,897,058 | $ | 43,244,873 | $ | 36,550,491 | |||||||||||||
| Operating expenses |
(61,244,515 | ) | (56,804,833 | ) | (49,319,085 | ) | (43,048,009 | ) | (37,417,109 | ) | (33,636,531 | ) | (29,102,089) | ||||||||||||||
| Operating margin |
15,800,741 | 14,840,882 | 12,968,829 | 12,721,642 | 9,479,949 | 9,608,342 | 7,448,402 | ||||||||||||||||||||
| General and administrative expenses |
(14,056,608 | ) | (12,588,646 | ) | (11,085,785 | ) | (8,963,837 | ) | (7,576,783 | ) | (7,598,918 | ) | (8,030,519) | ||||||||||||||
| Income before income taxes |
1,744,133 | 2,252,236 | 1,883,044 | 3,757,805 | 1,903,166 | 2,009,424 | (582,117) | ||||||||||||||||||||
| Income tax (expense) benefit |
(666,714 | ) | (910,195 | ) | (771,320 | ) | 4,138,008 | 429,000 | - | - | |||||||||||||||||
| Net income (loss) |
$ | 1,077,419 | $ | 1,342,041 | $ | 1,111,724 | $ | 7,895,813 | $ | 2,332,166 | $ | 2,009,424 | $ | (582,117) | |||||||||||||
| Basic earnings (loss) per share |
$ | 0.11 | $ | 0.14 | $ | 0.11 | $ | 0.81 | $ | 0.24 | $ | 0.21 | $ | (0.06) | |||||||||||||
| Basic weighted average common shares outstanding |
9,914,122 | 9,881,613 | 9,783,502 | 9,740,472 | 9,717,849 | 9,650,472 | 9,650,515 | ||||||||||||||||||||
| Diluted earnings (loss) per share |
$ | 0.11 | $ | 0.14 | $ | 0.11 | $ | 0.80 | $ | 0.24 | $ | 0.21 | $ | (0.06) | |||||||||||||
| Diluted weighted average common shares outstanding |
9,914,122 | 9,915,524 | 9,858,959 | 9,879,345 | 9,717,849 | 9,650,472 | 9,650,515 | ||||||||||||||||||||
|
BALANCE SHEET DATA | |||||||||||||||||||||||||||
| As of September 30, | |||||||||||||||||||||||||||
| 2008 | 2007 | 2006 | 2005 | 2004 | 2003 | 2002 | |||||||||||||||||||||
| Restated(1) | Restated(1) | Restated(1) | Restated(1) | Restated(1) | Restated(1) | ||||||||||||||||||||||
| unaudited (2) | unaudited (2) | unaudited (2) | unaudited (2) | unaudited (2) | |||||||||||||||||||||||
| Working capital |
$ | 2,893,448 | $ | 3,131,840 | $ | 3,327,514 | $ | 4,019,484 | $ | 251,836 | $ | 675,846 | $ | 539,190 | |||||||||||||
| Property and equipment, net |
10,935,156 | 8,533,327 | 7,495,676 | 5,716,341 | 4,540,833 | 3,935,020 | 3,764,545 | ||||||||||||||||||||
| Capital leases, net |
9,334,040 | 6,667,718 | 3,335,790 | 718,873 | 56,767 | - | - | ||||||||||||||||||||
| Total assets |
37,539,241 | 34,015,661 | 27,347,424 | 22,404,133 | 15,120,837 | 14,162,904 | 13,171,069 | ||||||||||||||||||||
| Long-term debt, including current portion |
3,754,139 | 2,587,164 | 3,519,410 | 4,662,890 | 3,229,809 | 3,326,686 | 4,078,478 | ||||||||||||||||||||
| Capital lease obligations, including current portion |
9,784,416 | 6,830,339 | 3,320,163 | 787,374 | 274,088 | - | - | ||||||||||||||||||||
| Stockholders’ equity (deficit) |
$ | 14,377,447 | $ | 13,300,028 | $ | 11,778,516 | $ | 10,451,687 | $ | 2,555,874 | $ | 223,708 | $ | (1,785,716) | |||||||||||||
| (1) | The “STATEMENTS OF INCOME DATA” for the six years ended September 30, 2007 and the “BALANCE SHEET DATA” as of September 30, 2007, 2006, 2005, 2004, 2003 and 2002 have been restated. Such restatements and an explanation of the restatement adjustments are described in “PART II – ITEM 7. – MANAGEMENT’S DISCUSSION AND ANALYSIS OF FINANCIAL CONDITION AND RESULTS OF OPERATIONS, Restatements and Related Matters.” The following tables set forth the effects of the restatement adjustments on previously reported amounts for the six years ended September 30, 2007 and as of September 30, 2007, 2006, 2005, 2004, 2003 and 2002. |
| (2) | The restatement adjustments for the four years ended September 30, 2005 and as of September 30, 2006, 2005, 2004, 2003 and 2002 have not been audited and accordingly such information is deemed to be unaudited data. |
24
Table of Contents
The following tables reflect the effects of the restatement of financial information for the years ended September 30, 2007, 2006, 2005 and 2004.
| Year ended September 30, | ||||||||||||||||||||||
| 2007 | 2006 | |||||||||||||||||||||
| As Previously Reported |
Restatement Adjustments |
Restated | As Previously Reported |
Restatement Adjustments |
Restated | |||||||||||||||||
| Revenues |
$ | 71,856,952 | $ | (211,237 | ) | $ | 71,645,715 | $ | 63,672,049 | $ | (1,384,135 | ) | $ | 62,287,914 | ||||||||
| Operating expenses |
(57,192,316 | ) | 387,483 | (56,804,833) | (49,042,800 | ) | (276,285 | ) | (49,319,085) | |||||||||||||
| Operating margin |
14,664,636 | 176,246 | 14,840,882 | 14,629,249 | (1,660,420 | ) | 12,968,829 | |||||||||||||||
| General and administrative expenses |
(12,272,216 | ) | (316,430 | ) | (12,588,646) | (10,114,742 | ) | (971,043 | ) | (11,085,785) | ||||||||||||
| Income before income taxes |
2,392,420 | (140,184 | ) | 2,252,236 | 4,514,507 | (2,631,463 | ) | 1,883,044 | ||||||||||||||
| Income tax benefit |
(947,404 | ) | 37,209 | (910,195) | (1,804,137 | ) | 1,032,817 | (771,320) | ||||||||||||||
| Net income |
$ | 1,445,016 | $ | (102,975 | ) | $ | 1,342,041 | $ | 2,710,370 | $ | (1,598,646 | ) | $ | 1,111,724 | ||||||||
| Basic earnings per share |
$ | 0.15 | $ | (0.01 | ) | $ | 0.14 | $ | 0.28 | $ | (0.16 | ) | $ | 0.11 | ||||||||
| Basic weighted average common shares outstanding |
9,881,613 | 9,881,613 | 9,881,613 | 9,783,502 | 9,783,502 | 9,783,502 | ||||||||||||||||
| Diluted earnings per share |
$ | 0.15 | $ | (0.01 | ) | $ | 0.14 | $ | 0.27 | $ | (0.16 | ) | $ | 0.11 | ||||||||
| Diluted weighted average common shares outstanding |
9,915,524 | 9,915,524 | 9,915,524 | 9,858,959 | 9,858,959 | 9,858,959 | ||||||||||||||||
| (unaudited) Year ended September 30, | ||||||||||||||||||||||
| 2005 | 2004 | |||||||||||||||||||||
| As Previously Reported |
Restatement Adjustments |
Restated |
As Previously Reported |
Restatement Adjustments |
Restated | |||||||||||||||||
| Revenues |
$ | 56,641,717 | $ | (872,066 | ) | $ | 55,769,651 | $ | 47,473,880 | $ | (576,822 | ) | $ | 46,897,058 | ||||||||
| Operating expenses |
(43,074,924 | ) | 26,915 | (43,048,009) | (37,525,084 | ) | 107,975 | (37,417,109) | ||||||||||||||
| Operating margin |
13,566,793 | (845,151 | ) | 12,721,642 | 9,948,796 | (468,847 | ) | 9,479,949 | ||||||||||||||
| General and administrative expenses |
(8,594,437 | ) | (369,400 | ) | (8,963,837) | (7,163,859 | ) | (412,924 | ) | (7,576,783) | ||||||||||||
| Income before income taxes |
4,972,356 | (1,214,551 | ) | 3,757,805 | 2,784,937 | (881,771 | ) | 1,903,166 | ||||||||||||||
| Income tax benefit |
2,568,960 | 1,569,048 | 4,138,008 | 429,000 | - | 429,000 | ||||||||||||||||
| Net income |
$ | 7,541,316 | $ | 354,497 | $ | 7,895,813 | $ | 3,213,937 | $ | (881,771 | ) | $ | 2,332,166 | |||||||||
| Basic earnings per share |
$ | 0.77 | $ | 0.04 | $ | 0.81 | $ | 0.33 | $ | (0.09 | ) | $ | 0.24 | |||||||||
| Basic weighted average common shares outstanding |
9,740,472 | 9,740,472 | 9,740,472 | 9,717,849 | 9,717,849 | 9,717,849 | ||||||||||||||||
| Diluted earnings per share |
$ | 0.76 | $ | 0.04 | $ | 0.80 | $ | 0.33 | $ | (0.09 | ) | $ | 0.24 | |||||||||
| Diluted weighted average common shares outstanding |
9,879,345 | 9,879,345 | 9,879,345 | 9,717,849 | 9,717,849 | 9,717,849 | ||||||||||||||||
Restatement adjustments are described in “PART II – ITEM 7. – MANAGEMENT’S DISCUSSION AND ANALYSIS OF FINANCIAL CONDITION AND RESULTS OF OPERATIONS, Restatements and Related Matters.”
25
Table of Contents
The following tables reflect the effects of the restatement of financial information for the years ended September 30, 2003 and 2002.
| (unaudited) | ||||||||||||||||||||||
| Year ended September 30, | ||||||||||||||||||||||
| 2003 | 2002 | |||||||||||||||||||||
| As Previously Reported |
Restatement Adjustments |
Restated | As Previously Reported |
Restatement Adjustments |
Restated | |||||||||||||||||
| Revenues |
$ | 43,518,068 | $ | (273,195 | ) | $ | 43,244,873 | $ | 38,526,603 | $ | (1,976,112 | ) | $ | 36,550,491 | ||||||||
| Operating expenses |
(33,928,254 | ) | 291,723 | (33,636,531) | (29,102,089 | ) | - | (29,102,089) | ||||||||||||||
| Operating margin |
9,589,814 | 18,528 | 9,608,342 | 9,424,514 | (1,976,112 | ) | 7,448,402 | |||||||||||||||
| General and administrative expenses |
(7,214,448 | ) | (384,470 | ) | (7,598,918) | (8,030,519 | ) | - | (8,030,519) | |||||||||||||
| Income before income taxes |
2,375,366 | (365,942 | ) | 2,009,424 | 1,393,995 | (1,976,112 | ) | (582,117) | ||||||||||||||
| Income tax benefit |
- | - | - | - | - | - | ||||||||||||||||
| Net income (loss) |
$ | 2,375,366 | $ | (365,942 | ) | $ | 2,009,424 | $ | 1,393,995 | $ | (1,976,112 | ) | $ | (582,117) | ||||||||
| Basic earnings (loss) per share |
$ | 0.25 | $ | (0.04 | ) | $ | 0.21 | $ | 0.14 | $ | (0.20 | ) | $ | (0.06) | ||||||||
| Basic weighted average common shares outstanding |
9,650,472 | 9,650,472 | 9,650,472 | 9,650,515 | 9,650,515 | 9,650,515 | ||||||||||||||||
| Diluted earnings (loss) per share |
$ | 0.25 | $ | (0.04 | ) | $ | 0.21 | $ | 0.14 | $ | (0.20 | ) | $ | (0.06) | ||||||||
| Diluted weighted average common shares outstanding |
9,650,472 | 9,650,472 | 9,650,472 | 9,650,515 | 9,650,515 | 9,650,515 | ||||||||||||||||
Restatement adjustments are described in “PART II – ITEM 7. – MANAGEMENT’S DISCUSSION AND ANALYSIS OF FINANCIAL CONDITION AND RESULTS OF OPERATIONS, Restatements and Related Matters.”
26
Table of Contents
The following table reflects the effects of the restatement of financial information at September 30, 2007:
| As of September 30, 2007 | |||||||||||
| As Previously Reported |
Restatement Adjustments |
Restated | |||||||||
| Assets |
|||||||||||
| Current assets |
|||||||||||
| Cash and cash equivalents |
$ | 487,423 | $ | - | $ | 487,423 | |||||
| Accounts Receivable, net of allowance for doubtful accounts of $3,200,375 |
11,414,362 | (4,578,135 | ) | 6,836,227 | |||||||
| Inventory |
957,569 | - | 957,569 | ||||||||
| Income taxes receivable |
1,057,308 | (99,208 | ) | 958,100 | |||||||
| Deferred taxes |
1,334,397 | 2,341,677 | 3,676,074 | ||||||||
| Prepaid expenses and other current assets |
332,624 | 171,835 | 504,459 | ||||||||
| Total current assets |
15,583,683 | (2,163,831 | ) | 13,419,852 | |||||||
| Property and equipment, less accumulated depreciation of $13,355,681 |
9,335,135 | (801,807 | ) | 8,533,328 | |||||||
| Leased property under capital leases, less accumulated amortization of $605,512 |
397,180 | 6,270,537 | 6,667,717 | ||||||||
| Deferred taxes |
11,034 | (11,034 | ) | - | |||||||
| Restricted investments |
1,956,087 | - | 1,956,087 | ||||||||
| Goodwill, less accumulated amortization of $2,451,814 |
3,391,942 | - | 3,391,942 | ||||||||
| Other assets |
46,735 | - | 46,735 | ||||||||
| Total Assets |
$ | 30,721,796 | $ | 3,293,865 | $ | 34,015,661 | |||||
| Liabilities and Stockholders’ Equity |
|||||||||||
| Current liabilities |
|||||||||||
| Line of credit |
$ | 415,888 | $ | - | $ | 415,888 | |||||
| Current portion of long-term debt |
890,842 | - | 890,842 | ||||||||
| Obligations under capital leases |
141,060 | 130,492 | 271,552 | ||||||||
| Accounts payable |
2,739,425 | - | 2,739,425 | ||||||||
| Payable to patients and insurance carriers |
- | 1,648,015 | 1,648,015 | ||||||||
| Accrued salaries and payroll taxes |
2,681,346 | - | 2,681,346 | ||||||||
| Accrued compensated absences |
315,774 | 118,832 | 434,606 | ||||||||
| Other accrued liabilities |
1,206,338 | - | 1,206,338 | ||||||||
| Total current liabilities |
8,390,673 | 1,897,339 | 10,288,012 | ||||||||
| Long-term liabilities |
|||||||||||
| Accounts payable |
96,511 | - | 96,511 | ||||||||
| Deferred tax liability |
415,204 | (407,639 | ) | 7,565 | |||||||
| Deferred compensation liability |
2,068,436 | - | 2,068,436 | ||||||||
| Long-term debt, net of current portion |
1,696,322 | - | 1,696,322 | ||||||||
| Obligations under capital leases |
183,673 | 6,375,114 | 6,558,787 | ||||||||
| Total long-term liabilities |
4,460,146 | 5,967,475 | 10,427,621 | ||||||||
| Total Liabilities |
12,850,819 | 7,864,814 | 20,715,633 | ||||||||
| Commitments and contingencies |
- | - | - | ||||||||
| Stockholders’ Equity |
|||||||||||
| Preferred stock, par value $.01 per share: authorized shares - 10,000,000; none issued |
- | - | - | ||||||||
| Common stock, par value $.05 per share: authorized shares - 50,000,000; |
|||||||||||
| Issued and outstanding - 9,914,122 shares |
495,706 | - | 495,706 | ||||||||
| Paid-in capital |
22,105,024 | - | 22,105,024 | ||||||||
| Accumulated deficit |
(4,729,753 | ) | (4,570,949 | ) | (9,300,702) | ||||||
| Total Stockholders’ Equity |
17,870,977 | (4,570,949 | ) | 13,300,028 | |||||||
| Total Liabilities and Stockholders’ Equity |
$ | 30,721,796 | $ | 3,293,865 | $ | 34,015,661 | |||||
Restatement adjustments are described in “PART II – ITEM 7. – MANAGEMENT’S DISCUSSION AND ANALYSIS OF FINANCIAL CONDITION AND RESULTS OF OPERATIONS, Restatements and Related Matters.”
27
Table of Contents
The following table reflects the effects of the restatement of financial information at September 30, 2006, unaudited:
| September 30, 2006 | |||||||||||
| As Previously Reported |
Restatement Adjustments |
Restated | |||||||||
| Assets |
|||||||||||
| Current assets |
|||||||||||
| Cash and cash equivalents |
$ | 533,209 | $ | - | $ | 533,209 | |||||
| Accounts Receivable, net of allowance for doubtful accounts of $4,561,140 |
10,627,543 | (5,115,927 | ) | 5,511,616 | |||||||
| Inventory |
876,609 | - | 876,609 | ||||||||
| Income taxes receivable |
256,920 | (79,241 | ) | 177,679 | |||||||
| Deferred taxes |
1,605,297 | 2,381,078 | 3,986,375 | ||||||||
| Prepaid expenses and other current assets |
265,271 | - | 265,271 | ||||||||
| Total current assets |
14,164,849 | (2,814,090 | ) | 11,350,759 | |||||||
| Property and equipment, less accumulated depreciation of $12,392,306 |
8,197,988 | (702,312 | ) | 7,495,676 | |||||||
| Leased property under capital leases, less accumulated amortization of $209,206 |
550,986 | 2,784,804 | 3,335,790 | ||||||||
| Deferred taxes |
440,232 | (46,679 | ) | 393,553 | |||||||
| Restricted investments |
1,343,432 | - | 1,343,432 | ||||||||
| Goodwill, less accumulated amortization of $2,451,814 |
3,391,942 | - | 3,391,942 | ||||||||
| Other assets |
36,272 | - | 36,272 | ||||||||
| Total Assets |
$ | 28,125,701 | $ | (778,277 | ) | $ | 27,347,424 | ||||
| Liabilities and Stockholders’ Equity |
|||||||||||
| Current liabilities |
|||||||||||
| Line of credit |
$ | 279,373 | $ | - | $ | 279,373 | |||||
| Current portion of long-term debt |
902,120 | - | 902,120 | ||||||||
| Obligations under capital leases |
127,582 | 53,279 | 180,861 | ||||||||
| Accounts payable |
2,297,493 | - | 2,297,493 | ||||||||
| Payable to patients and insurance carriers |
- | 898,986 | 898,986 | ||||||||
| Accrued salaries and payroll taxes |
2,109,588 | 216,073 | 2,325,661 | ||||||||
| Accrued compensated absences |
342,993 | 54,467 | 397,460 | ||||||||
| Other accrued liabilities |
741,291 | - | 741,291 | ||||||||
| Total current liabilities |
6,800,440 | 1,222,805 | 8,023,245 | ||||||||
| Long-term liabilities |
|||||||||||
| Accounts payable |
414,231 | - | 414,231 | ||||||||
| Deferred tax liability |
346,707 | (346,707 | ) | - | |||||||
| Deferred compensation liability |
1,374,840 | - | 1,374,840 | ||||||||
| Long-term debt, net of current portion |
2,617,290 | - | 2,617,290 | ||||||||
| Obligations under capital leases |
325,703 | 2,813,599 | 3,139,302 | ||||||||
| Total long-term liabilities |
5,078,771 | 2,466,892 | 7,545,663 | ||||||||
| Total Liabilities |
11,879,211 | 3,689,697 | 15,568,908 | ||||||||
| Commitments and contingencies |
- | - | - | ||||||||
| Stockholders’ Equity |
|||||||||||
| Preferred stock, par value $.01 per share: authorized shares - 10,000,000; none issued |
- | - | - | ||||||||
| Common stock, par value $.05 per share: authorized shares - 50,000,000; |
|||||||||||
| Issued and outstanding - 9,826,297 shares |
491,315 | - | 491,315 | ||||||||
| Paid-in capital |
21,929,944 | - | 21,929,944 | ||||||||
| Accumulated deficit |
(6,174,769 | ) | (4,467,974 | ) | (10,642,743) | ||||||
| Total Stockholders’ Equity |
16,246,490 | (4,467,974 | ) | 11,778,516 | |||||||
| Total Liabilities and Stockholders’ Equity |
$ | 28,125,701 | $ | (778,277 | ) | $ | 27,347,424 | ||||
Restatement adjustments are described in “PART II – ITEM 7. – MANAGEMENT’S DISCUSSION AND ANALYSIS OF FINANCIAL CONDITION AND RESULTS OF OPERATIONS – Restatements and Related Matters.”
28
Table of Contents
The following table reflects the effects of the restatement of financial information at September 30, 2005, unaudited:
| September 30, 2005 | |||||||||||
| As Previously Reported |
Restatement Adjustments |
Restated | |||||||||
| Assets |
|||||||||||
| Current assets |
|||||||||||
| Cash and cash equivalents |
$ | 961,610 | $ | - | $ | 961,610 | |||||
| Accounts Receivable, net of allowance for doubtful accounts of $3,419,127 |
8,778,025 | (3,728,264 | ) | 5,049,761 | |||||||
| Inventory |
623,941 | - | 623,941 | ||||||||
| Deferred taxes |
1,342,565 | 1,640,033 | 2,982,598 | ||||||||
| Prepaid expenses and other current assets |
169,171 | - | 169,171 | ||||||||
| Total current assets |
11,875,312 | (2,088,231 | ) | 9,787,081 | |||||||
| Property and equipment, less accumulated depreciation of $11,194,847 |
5,967,159 | (250,818 | ) | 5,716,341 | |||||||
| Leased property under capital leases, less accumulated amortization of $103,577 |
46,077 | 672,796 | 718,873 | ||||||||
| Deferred taxes |
2,104,606 | (221,497 | ) | 1,883,109 | |||||||
| Restricted investments |
892,509 | - | 892,509 | ||||||||
| Goodwill, less accumulated amortization of $2,451,814 |
3,391,942 | - | 3,391,942 | ||||||||
| Other assets |
14,278 | - | 14,278 | ||||||||
| Total Assets |
$ | 24,291,883 | $ | (1,887,750 | ) | $ | 22,404,133 | ||||
| Liabilities and Stockholders’ Equity |
|||||||||||
| Current liabilities |
|||||||||||
| Current portion of long-term debt |
$ | 1,164,100 | $ | - | $ | 1,164,100 | |||||
| Obligations under capital leases |
95,215 | 14,320 | 109,535 | ||||||||
| Accounts payable |
882,988 | - | 882,988 | ||||||||
| Payable to patients and insurance carriers |
- | 439,931 | 439,931 | ||||||||
| Income taxes payable |
- | 127,699 | 127,699 | ||||||||
| Accrued salaries and payroll taxes |
1,979,048 | - | 1,979,048 | ||||||||
| Accrued compensated absences |
320,434 | - | 320,434 | ||||||||
| Other accrued liabilities |
743,862 | - | 743,862 | ||||||||
| Total current liabilities |
5,185,647 | 581,950 | 5,767,597 | ||||||||
| Long-term liabilities |
|||||||||||
| Accounts payable |
1,115,711 | - | 1,115,711 | ||||||||
| Deferred tax liability |
278,211 | (278,211 | ) | - | |||||||
| Deferred compensation liability |
892,509 | - | 892,509 | ||||||||
| Long-term debt, net of current portion |
3,498,790 | - | 3,498,790 | ||||||||
| Obligations under capital leases |
- | 677,839 | 677,839 | ||||||||
| Total long-term liabilities |
5,785,221 | 399,628 | 6,184,849 | ||||||||
| Total Liabilities |
10,970,868 | 981,578 | 11,952,446 | ||||||||
| Commitments and contingencies |
- | - | - | ||||||||
| Stockholders’ Equity |
|||||||||||
| Preferred stock, par value $.01 per share: authorized shares - 10,000,000; none issued |
- | - | - | ||||||||
| Common stock, par value $.05 per share: authorized shares - 50,000,000; |
|||||||||||
| Issued and outstanding - 9,740,472 shares |
487,024 | - | 487,024 | ||||||||
| Paid-in capital |
21,719,130 | - | 21,719,130 | ||||||||
| Accumulated deficit |
(8,885,139 | ) | (2,869,328 | ) | (11,754,467) | ||||||
| Total Stockholders’ Equity |
13,321,015 | (2,869,328 | ) | 10,451,687 | |||||||
| Total Liabilities and Stockholders’ Equity |
$ | 24,291,883 | $ | (1,887,750 | ) | $ | 22,404,133 | ||||
Restatement adjustments are described in “PART II – ITEM 7. – MANAGEMENT’S DISCUSSION AND ANALYSIS OF FINANCIAL CONDITION AND RESULTS OF OPERATIONS – Restatements and Related Matters.”
29
Table of Contents
The following table reflects the effects of the restatement of financial information at September 30, 2004, unaudited:
| September 30, 2004 | |||||||||||
| As Previously Reported |
Restatement Adjustments |
Restated | |||||||||
| Assets |
|||||||||||
| Current assets |
|||||||||||
| Cash and cash equivalents |
$ | 533,533 | $ | - | $ | 533,533 | |||||
| Accounts Receivable, net of allowance for doubtful accounts of $2,518,464 |
7,382,619 | (2,609,553 | ) | 4,773,066 | |||||||
| Inventory |
618,446 | - | 618,446 | ||||||||
| Deferred taxes |
500,000 | - | 500,000 | ||||||||
| Prepaid expenses and other current assets |
266,788 | - | 266,788 | ||||||||
| Total current assets |
9,301,386 | (2,609,553 | ) | 6,691,833 | |||||||
| Property and equipment, less accumulated depreciation of $10,211,897 |
4,788,529 | (247,696 | ) | 4,540,833 | |||||||
| Leased property under capital leases, less accumulated amortization of $62,001 |
56,767 | - | 56,767 | ||||||||
| Restricted investments |
429,140 | - | 429,140 | ||||||||
| Goodwill, less accumulated amortization of $2,451,814 |
3,391,942 | - | 3,391,942 | ||||||||
| Other assets |
10,322 | - | 10,322 | ||||||||
| Total Assets |
$ | 17,978,086 | $ | (2,857,249 | ) | $ | 15,120,837 | ||||
| Liabilities and Stockholders’ Equity |
|||||||||||
| Current liabilities |
|||||||||||
| Current portion of long-term debt |
$ | 793,234 | $ | - | $ | 793,234 | |||||
| Obligations under capital leases |
178,874 | - | 178,874 | ||||||||
| Accounts payable |
1,669,565 | - | 1,669,565 | ||||||||
| Payable to patients and insurance carriers |
- | 366,576 | 366,576 | ||||||||
| Accrued salaries and payroll taxes |
1,926,095 | - | 1,926,095 | ||||||||
| Accrued compensated absences |
595,744 | - | 595,744 | ||||||||
| Current portion of pre-petition payroll taxes |
301,601 | - | 301,601 | ||||||||
| Other accrued liabilities |
608,308 | - | 608,308 | ||||||||
| Total current liabilities |
6,073,421 | 366,576 | 6,439,997 | ||||||||
| Long-term liabilities |
|||||||||||
| Accounts payable |
1,193,935 | - | 1,193,935 | ||||||||
| Long-term portion of pre-petition payroll taxes |
1,970,102 | - | 1,970,102 | ||||||||
| Deferred compensation liability |
429,140 | - | 429,140 | ||||||||
| Long-term debt, net of current portion |
2,436,575 | - | 2,436,575 | ||||||||
| Obligations under capital leases |
95,214 | - | 95,214 | ||||||||
| Total long-term liabilities |
6,124,966 | - | 6,124,966 | ||||||||
| Total Liabilities |
12,198,387 | 366,576 | 12,564,963 | ||||||||
| Commitments and contingencies |
- | - | - | ||||||||
| Stockholders’ Equity |
|||||||||||
| Preferred stock, par value $.01 per share: authorized shares - 10,000,000; none issued |
- | - | - | ||||||||
| Common stock, par value $.05 per share: authorized shares - 50,000,000; |
|||||||||||
| Issued and outstanding - 9,740,472 shares |
487,024 | - | 487,024 | ||||||||
| Paid-in capital |
21,719,130 | - | 21,719,130 | ||||||||
| Accumulated deficit |
(16,426,455 | ) | (3,223,825 | ) | (19,650,280) | ||||||
| Total Stockholders ’ Equity |
5,779,699 | (3,223,825 | ) | 2,555,874 | |||||||
| Total Liabilities and Stockholders’ Equity |
$ | 17,978,086 | $ | (2,857,249 | ) | $ | 15,120,837 | ||||
Restatement adjustments are described in “PART II – ITEM 7. – MANAGEMENT’S DISCUSSION AND ANALYSIS OF FINANCIAL CONDITION AND RESULTS OF OPERATIONS – Restatements and Related Matters.”
30
Table of Contents
The following table reflects the effects of the restatement of financial information at September 30, 2003, unaudited:
| September 30, 2003 | |||||||||||
| As Previously Reported |
Restatement Adjustments |
Restated | |||||||||
| Assets |
|||||||||||
| Current assets |
|||||||||||
| Cash and cash equivalents |
$ | 683,135 | $ | - | $ | 683,135 | |||||
| Accounts Receivable, net of allowance for doubtful accounts of $1,924,820 |
6,874,423 | (1,965,843 | ) | 4,908,580 | |||||||
| Inventory |
646,320 | - | 646,320 | ||||||||
| Prepaid expenses and other current assets |
227,666 | - | 227,666 | ||||||||
| Total current assets |
8,431,544 | (1,965,843 | ) | 6,465,701 | |||||||
| Property and equipment, less accumulated depreciation of $9,294,442 |
4,027,767 | (92,747 | ) | 3,935,020 | |||||||
| Restricted investments |
362,419 | - | 362,419 | ||||||||
| Goodwill, less accumulated amortization of $2,451,814 |
3,391,942 | - | 3,391,942 | ||||||||
| Other assets |
7,822 | - | 7,822 | ||||||||
| Total Assets |
$ | 16,221,494 | $ | (2,058,590 | ) | $ | 14,162,904 | ||||
| Liabilities and Stockholders’ Equity |
|||||||||||
| Current liabilities |
|||||||||||
| Current portion of long-term debt |
$ | 946,358 | $ | - | $ | 946,358 | |||||
| Accounts payable |
998,052 | - | 998,052 | ||||||||
| Payable to patients and insurance carriers |
- | 283,464 | 283,464 | ||||||||
| Accrued salaries and payroll taxes |
1,610,651 | - | 1,610,651 | ||||||||
| Accrued compensated absences |
268,610 | - | 268,610 | ||||||||
| Current portion of pre-petition payroll taxes |
720,477 | - | 720,477 | ||||||||
| Other accrued liabilities |
962,243 | - | 962,243 | ||||||||
| Total current liabilities |
5,506,391 | 283,464 | 5,789,855 | ||||||||
| Long-term liabilities |
|||||||||||
| Accounts payable |
1,917,779 | - | 1,917,779 | ||||||||
| Long-term portion of pre-petition payroll taxes |
3,488,815 | 3,488,815 | |||||||||
| Deferred compensation liability |
362,419 | - | 362,419 | ||||||||
| Long-term debt, net of current portion |
2,380,328 | - | 2,380,328 | ||||||||
| Total long-term liabilities |
8,149,341 | - | 8,149,341 | ||||||||
| Total Liabilities |
13,655,732 | 283,464 | 13,939,196 | ||||||||
| Commitments and contingencies |
- | - | - | ||||||||
| Stockholders’ Equity |
|||||||||||
| Preferred stock, par value $.01 per share: authorized shares - 10,000,000; none issued |
- | - | - | ||||||||
| Common stock, par value $ .05 per share: authorized shares - 50,000,000; |
|||||||||||
| Issued and outstanding - 9,650,472 shares |
482,524 | - | 482,524 | ||||||||
| Paid-in capital |
21,723,630 | - | 21,723,630 | ||||||||
| Accumulated deficit |
(19,640,392 | ) | (2,342,054 | ) | (21,982,446) | ||||||
| Total Stockholders’ Equity |
2,565,762 | (2,342,054 | ) | 223,708 | |||||||
| Total Liabilities and Stockholders’ Equity |
$ | 16,221,494 | $ | (2,058,590 | ) | $ | 14,162,904 | ||||
Restatement adjustments are described in “PART II – ITEM 7. – MANAGEMENT’S DISCUSSION AND ANALYSIS OF FINANCIAL CONDITION AND RESULTS OF OPERATIONS – Restatements and Related Matters.”
31
Table of Contents
The following table reflects the effects of the restatement of financial information at September 30, 2002, unaudited:
| September 30, 2002 | |||||||||||
| As Previously Reported |
Restatement Adjustments |
Restated | |||||||||
| Assets |
|||||||||||
| Current assets |
|||||||||||
| Cash and cash equivalents |
$ | 269,298 | $ | - | $ | 269,298 | |||||
| Accounts Receivable, net of allowance for doubtful accounts of $1,661,047 |
6,349,629 | (1,689,084 | ) | 4,660,545 | |||||||
| Inventory |
393,795 | - | 393,795 | ||||||||
| Prepaid expenses and other current assets |
297,178 | - | 297,178 | ||||||||
| Total current assets |
7,309,900 | (1,689,084 | ) | 5,620,816 | |||||||
| Property and equipment, less accumulated depreciation of $8,149,811 |
3,764,545 | - | 3,764,545 | ||||||||
| Restricted investments |
343,283 | - | 343,283 | ||||||||
| Goodwill, less accumulated amortization of $2,451,814 |
3,391,942 | - | 3,391,942 | ||||||||
| Other assets |
50,483 | - | 50,483 | ||||||||
| Total Assets |
$ | 14,860,153 | $ | (1,689,084 | ) | $ | 13,171,069 | ||||
| Liabilities and Stockholders’ Equity |
|||||||||||
| Current liabilities |
|||||||||||
| Current portion of long-term debt |
$ | 1,014,829 | $ | - | $ | 1,014,829 | |||||
| Accounts payable |
762,646 | - | 762,646 | ||||||||
| Payable to patients and insurance carriers |
- | 287,028 | 287,028 | ||||||||
| Accrued salaries and payroll taxes |
1,514,745 | - | 1,514,745 | ||||||||
| Accrued compensated absences |
267,943 | - | 267,943 | ||||||||
| Current portion of pre-petition payroll taxes |
475,079 | - | 475,079 | ||||||||
| Other accrued liabilities |
759,356 | - | 759,356 | ||||||||
| Total current liabilities |
4,794,598 | 287,028 | 5,081,626 | ||||||||
| Long-term liabilities |
|||||||||||
| Accounts payable |
2,083,167 | - | 2,083,167 | ||||||||
| Long-term portion of pre-petition payroll taxes |
4,385,060 | 4,385,060 | |||||||||
| Deferred compensation liability |
343,283 | - | 343,283 | ||||||||
| Long-term debt, net of current portion |
3,063,649 | - | 3,063,649 | ||||||||
| Total long-term liabilities |
9,875,159 | - | 9,875,159 | ||||||||
| Total Liabilities |
14,669,757 | 287,028 | 14,956,785 | ||||||||
| Commitments and contingencies |
- | - | - | ||||||||
| Stockholders’ Equity |
|||||||||||
| Preferred stock, par value $.01 per share: authorized shares - 10,000,000; none issued |
- | - | - | ||||||||
| Common stock, par value $.05 per share: authorized shares - 50,000,000; |
|||||||||||
| Issued and outstanding - 9,650,515 shares |
482,524 | - | 482,524 | ||||||||
| Paid-in capital |
21,723,630 | - | 21,723,630 | ||||||||
| Accumulated deficit |
(22,015,758 | ) | (1,976,112 | ) | (23,991,870) | ||||||
| Total Stockholders’ Equity (Deficit) |
190,396 | (1,976,112 | ) | (1,785,716) | |||||||
| Total Liabilities and Stockholders’ Equity (Deficit) |
$ | 14,860,153 | $ | (1,689,084 | ) | $ | 13,171,069 | ||||
Restatement adjustments are described in “PART II – ITEM 7. – MANAGEMENT’S DISCUSSION AND ANALYSIS OF FINANCIAL CONDITION AND RESULTS OF OPERATIONS – Restatements and Related Matters.”
32
Table of Contents
ITEM 7. MANAGEMENT’S DISCUSSION AND ANALYSIS OF FINANCIAL CONDITION AND RESULTS OF OPERATIONS
The following discussion and analysis provides information that we believe is relevant to an assessment and understanding of our consolidated results of operations and financial condition. This discussion should be read in conjunction with the Consolidated Financial Statements and notes thereto.
Restatements and Related Matters
In this Form 10-K, we are restating our consolidated balance sheet as of September 30, 2007, and the related consolidated statements of income, stockholders’ equity and cash flows for the years ended September 30, 2007 and 2006. These Consolidated Financial Statements have been re-audited by our New Auditors we engaged in March 2009 to audit our consolidated balance sheet as of September 30, 2008 and the related consolidated statements of income, stockholders’ equity and cash flows for the year then ended.
In addition, we are restating the annual financial information set forth in “PART II – ITEM 6. – SELECTED FINANCIAL DATA” in this Form 10-K as of September 30, 2007, 2006, 2005, 2004, 2003 and 2002 and for the six years ended September 30, 2007. We are also restating our quarterly financial information for the three quarters ended June 30, 2008, March 31, 2008 and December 31, 2007 and the quarterly financial information for each quarter in the years ended September 30, 2007 and 2006. The quarterly financial information is set forth in this Form 10-K under the caption, “PART II – ITEM 8. – FINANCIAL STATEMENTS AND SUPPLEMENTARY DATA – NOTE 13. QUARTERLY FINANCIAL DATA.”
Our previously filed annual reports on Form 10-K, quarterly reports on Form 10-Q, earnings press releases and other similar communications for the restated periods as described above will not be amended and should not be relied upon. Therefore, the Consolidated Financial Statements, reports of our previous independent registered public accounting firm and related financial information contained in such previously filed reports should not be relied upon.
The restatements, as described above, were principally related to an internal investigation (the “Investigation”) commenced by our Audit Committee on December 10, 2008. The Investigation announced on Forms 8-K filed on December 18, 2008 and January 15, 2009, respectively, was initiated due to the detection of irregularities with respect to our internal controls and improper expense reimbursements and other disbursements to Jerry F. Wells, Jr., the former Executive Vice-President of Finance, Chief Financial Officer, and Secretary of UCI Medical Affiliates, Inc. (the “former CFO” or Mr. Wells). Mr. Wells’ employment was terminated on December 17, 2008. As a result of the Investigation, on February 27, 2009, Mr. Wells executed a Confession of Judgment in our favor in the amount of $2,967,382 (the “Confession Amount”) related to amounts he had embezzled. The amounts Mr. Wells embezzled from 2003 through 2007 are set forth in Table A, below. Table A does not include $483,145 and $102,030 Mr. Wells embezzled in fiscal years 2008 and 2009, respectively.
The Confession Amount was composed of several categories of items that impact the restatements. First, certain items included in the Confession Amount were reflected as operating expenses in our Consolidated Financial Statements at the time of Mr. Wells’ fraud; however, in the restatements, the items have been reclassified as general and administrative (“G&A”) expenses. Similarly, we have determined that certain items processed by Mr. Wells which have been construed as legitimate business expenses were also improperly classified as operating expenses. These items have also been reclassified as G&A expenses. In addition, the former CFO classified certain fraudulent transactions as property and equipment and such transactions were included in our Consolidated Financial Statements in the periods of and subsequent to the date of the fraud as property and equipment, net of accumulated depreciation. Restatement adjustments from 2003 through 2007 related to the fraudulent transactions and other reclassifications are set forth in Table B, below.
33
Table of Contents
| Table A Fraudulent Transactions Included in Confession of Judgment | |||||||||||||||||||||||
| 2007 | 2006 | 2005 | 2004 | 2003 | 2002 | ||||||||||||||||||
| Operating expenses reclassified to G&A expenses |
$ | 277,510 | $ | 299,128 | $ | 260,425 | $ | 166,280 | $ | 177,867 | $ | - | |||||||||||
| Amounts recorded as G&A expenses |
120,637 | 39,748 | 13,787 | 25,253 | 22,755 | - | |||||||||||||||||
| Amounts recorded as property and equipment |
171,623 | 496,877 | 28,964 | 185,424 | 95,929 | - | |||||||||||||||||
| Total fraudulent transactions |
$ | 569,770 | $ | 835,753 | $ | 303,176 | $ | 376,957 | $ | 296,551 | $ | - | |||||||||||
| Table B Restatement Adjustments Related to Fraudulent Transactions and Reclassifications | |||||||||||||||||||||||
| Statements of Income Reclassifications | 2007 | 2006 | 2005 | 2004 | 2003 | 2002 | |||||||||||||||||
| Fraudulent operating expenses reclassified to G&A expenses | $ | 277,510 | $ | 299,128 | $ | 260,425 | $ | 166,280 | $ | 177,867 | $ | - | |||||||||||
| Non-fraudulent operating expenses reclassified to G&A expenses | 87,520 | 116,092 | 80,075 | 61,220 | 110,674 | - | |||||||||||||||||
| Total operating expenses reclassified to G&A expenses | $ | 365,030 | $ | 415,220 | $ | 340,500 | $ | 227,500 | $ | 288,541 | $ | - | |||||||||||
| Statements of Income Adjustments | |||||||||||||||||||||||
| Write-off of property and equipment to G&A expense | $ | 171,623 | $ | 496,877 | $ | 28,964 | $ | 185,424 | $ | 95,929 | $ | - | |||||||||||
| Reversal of depreciation expense: | |||||||||||||||||||||||
| Operating expenses | (59,602 | ) | (40,375 | ) | (25,778 | ) | (30,475 | ) | (3,182 | ) | - | ||||||||||||
| G&A expenses | (12,525 | ) | (5,008 | ) | (63 | ) | - | - | - | ||||||||||||||
| Net effect on income before income taxes | $ | 99,496 | $ | 451,494 | $ | 3,123 | $ | 154,949 | $ | 92,747 | $ | - | |||||||||||
| Balance Sheets Adjustments |
|||||||||||||||||||||||
| Restatement adjustments to reduce property and equipment, net of accumulated depreciation |
$ | 801,807 | $ | 702,313 | $ | 250,819 | $ | 247,696 | $ | 92,747 | $ | - | |||||||||||
In addition, as part of the Investigation, our Audit Committee directed our new Chief Financial Officer to reevaluate our critical accounting policies and compliance with those policies (the “Accounting Policy Review”). In accordance with the Accounting Policy Review it was determined that certain accounting policies had not been applied properly in the current and prior periods. Thus, the restatements include certain adjustments related to the correction of errors resulting from the noncompliance with our accounting policies.
The Accounting Policy Review did not indicate that the noncompliance with our accounting policies which occurred during the tenure of our former CFO resulted from a scheme to intentionally misrepresent the results of our operations or our financial position. Rather, the Accounting Policy Review has indicated that the misapplication of our accounting policies resulted from material weaknesses in our internal control over financial reporting related to the former CFO’s failure to properly supervise the application of such accounting policies in recording certain transactions, as well as the failure of our former independent registered public accounting firm to detect such misapplications in connection with its audits of our consolidated financial statements. We believe we have properly remediated the material weaknesses in our internal control over financial reporting that were identified as part of the Investigation and Accounting Policy Review. The status of our internal control over financial reporting and the remedial actions we have taken are more fully discussed in this Form 10-K under the caption “PART II – ITEM 9A. – CONTROLS AND PROCEDURES.”
The financial accounts and transactions that were affected and a description of matters which were discovered pursuant to the Accounting Policy Review are summarized as follows:
Accounts Receivable and Revenues – We have determined that since fiscal year 2002, accounts receivable and revenues were misstated due to differences between our standard fees (“Standard Fees”), upon which revenues were initially recorded and the actual amounts that were collected from payers, primarily insurance carriers (“Contracted Amounts”). The difference between the Standard Fees and Contracted Amounts are referred to as “Contractual Adjustments.”
34
Table of Contents
Our Accounting Policy Review determined that, contrary to our policy, we had been recognizing Contractual Adjustments as a reduction to revenues and accounts receivable in the period in which the payments were collected, not at the time the services were rendered, billed and recognized as revenues. Typically, a short period of time transpires between the recognition of Standard Fees as revenues and Contractual Adjustments as reductions to revenues and accounts receivable. In the event that there are no changes in the difference between the Standard Fees and Contracted Amounts and accounts receivables balances remain consistent, the impact on revenues and accounts receivables would not be expected to be significant. However, when there is an increase in Standard Fees without a corresponding and proportionate increase in Contracted Amounts, revenues are misstated for a short period of time and the accumulated effect of the revenue misstatements cause a cumulative misstatement in accounts receivable. Additionally, changes in the amounts of revenues recognized and in the amounts of accounts receivable outstanding from period to period have an impact on the amounts of Contractual Adjustments recognized and the corresponding adjustments to revenues.
We have evaluated the differences between our Standard Fees and Contracted Amounts since fiscal year 2001 and have determined that the difference between the Standard Fees and the Contracted Amounts have increased from an insignificant amount in fiscal year 2001 to approximately 34% in fiscal year 2008. As a result, revenues and accounts receivable have been misstated over that period. The restatement adjustments related to revenues and accounts receivable associated with Contractual Adjustments in the years 2002 through 2007 are set forth in the Table C, below.
| Table C | ||||||||||||||||||
| Restatement Adjustments Related to Contractual Adjustments | ||||||||||||||||||
| Statements of Income Adjustments | 2007 | 2006 | 2005 | 2004 | 2003 | 2002 | ||||||||||||
| Restatement adjustments to decrease revenues |
$ | 211,237 | $ | 1,384,135 | $ | 872,066 | $ | 576,822 | $ | 273,195 | $ | 1,976,112 | ||||||
| Balance Sheets Adjustments |
||||||||||||||||||
| Restatement adjustments to decrease accounts receivable at the end of each year |
$ | 5,293,567 | $ | 5,082,330 | $ | 3,698,195 | $ | 2,826,129 | $ | 2,249,307 | $ | 1,976,112 | ||||||
|
Accounts Receivable and Payable to Patients and Insurance Carriers - We have determined that amounts previously reported as accounts receivable have been reported net of credit balances in certain patients’ accounts and certain amounts payable to insurance carriers. The credits in patients’ accounts relate to a number of different circumstances, the most typical of which are payments made by patients which are subsequently paid by an insurance carrier. Amounts payable to insurance carriers also relate to a number of different circumstances, the most typical of which are payments made by two or more carriers related to one claim.
Since 2006, we have more aggressively collected fees from patients at the time of service and in some cases we have subsequently determined that the patient had insurance that covered the charge. Accordingly, the amounts payable to patients have increased in the period from 2006 through 2008. Additionally, in 2005 and 2006, we installed a new medical management and billing system which has allowed us to better delineate between charges payable to patients and charges payable to insurance carriers. Payables to patients are liquidated through reimbursements to patients or the application of credit balances in patients’ accounts to subsequent services. Payables to insurance carriers are liquidated through “take backs,” whereby insurance carriers apply amounts payable to them for future claims.
Reclassification of amounts payable to patients and insurance companies as of the end of years 2002 through 2007 are set forth in Table D, below. The reclassifications had no impact on the amounts of revenues recognized or the results of operations during the indicated periods.
| ||||||||||||||||||
| Table D | ||||||||||||||||||
| Restatement Adjustments Related to Amounts Payable to Patients and Insurance Carriers | ||||||||||||||||||
| Balance Sheets Adjustments | 2007 | 2006 | 2005 | 2004 | 2003 | 2002 | ||||||||||||
| Restatement adjustments to increase accounts receivable and payables to patients and insurance carriers |
$ | 1,648,015 | $ | 898,986 | $ | 439,931 | $ | 366,576 | $ | 283,464 | $ | 287,028 | ||||||
35
Table of Contents
Allowance for Doubtful Accounts – In accordance with our Accounting Policy Review, we performed an evaluation of the activity in and adequacy of our allowance for doubtful accounts. We have determined that our allowance for doubtful accounts as of September 30, 2006, and the amounts recognized as bad debt expense for the year then ended were understated. Additionally, we determined that a less significant portion of the amount by which the allowance for doubtful accounts as of September 30, 2006 was understated, related to the understatement of bad debt expense in the years ended September 30, 2005 and 2004. The restatement adjustments related to the allowance for doubtful accounts and bad debt expense are set forth in Table E, below.
| Table E | |||||||||||||||||||||
| Restatement Adjustments Related to the Allowance for Doubtful Accounts | |||||||||||||||||||||
| Statements of Income Adjustments | 2007 | 2006 | 2005 | 2004 | 2003 | 2002 | |||||||||||||||
| Restatement adjustments to increase bad debt expense |
$ | - | $ | 462,582 | $ | 320,000 | $ | 150,000 | $ | - | $ | - | |||||||||
| Balance Sheets Adjustments |
|||||||||||||||||||||
| Restatement adjustments to increase allowance for doubtful accounts |
$ | 932,582 | $ | 932,582 | $ | 470,000 | $ | 150,000 | $ | - | $ | - | |||||||||
|
Capital Leases – In accordance with our Accounting Policy Review, we evaluated our leases for proper classification and performed classification tests as prescribed by Statement of Financial Accounting Standards (“SFAS”) No. 13 and other relevant accounting standards. We determined that all of our leases pertaining to real estate were classified as operating leases; however, we determined that certain real estate leases we had entered since 2004 were not properly classified and that such leases met the criteria as set forth in SFAS No. 13 for capital lease classification. The restatement adjustments related to capital lease assets and obligations, amortization expense, interest expense and rent expense are set forth in Table F, below.
| |||||||||||||||||||||
| Table F | |||||||||||||||||||||
| Restatement Adjustments Related to Reclassification of Operating Leases to Capital Leases | |||||||||||||||||||||
| Statements of Income Adjustments | 2007 | 2006 | 2005 | 2004 | 2003 | 2002 | |||||||||||||||
| Restatement adjustments to recognize interest expense on capital leases | $ | 453,983 | $ | 188,009 | $ | 54,762 | $ | - | $ | - | $ | - | |||||||||
| Restatement adjustments to recognize amortization expense on capital leases | 242,501 | 94,940 | 30,887 | - | - | - | |||||||||||||||
| Restatement adjustments to reverse rent expense | (543,490 | ) | (220,237 | ) | (66,286 | ) | - | - | - | ||||||||||||
| Net effect on income before income taxes | $ | 152,994 | $ | 62,712 | $ | 19,363 | $ | - | $ | - | $ | - | |||||||||
| Balance Sheets Adjustments | |||||||||||||||||||||
| Restatement adjustments to recognize capital lease assets | $ | 6,638,865 | $ | 2,910,631 | $ | 703,683 | $ | - | $ | - | $ | - | |||||||||
| Restatement adjustments to recognize accumulated amortization on capital leases |
(368,328 | ) | (125,827 | ) | (30,887 | ) | - | - | - | ||||||||||||
| Restatement adjustments to recognize capital lease assets, net of accumulated amortization | $ | 6,270,537 | $ | 2,784,804 | $ | 672,796 | $ | - | $ | - | $ | - | |||||||||
| Restatement adjustments to recognize capital lease obligations | $ | 6,505,606 | $ | 2,866,879 | $ | 692,159 | $ | - | $ | - | $ | - | |||||||||
36
Table of Contents
Other – In accordance with the our Accounting Policy Review, we evaluated certain accruals which were misstated related to salaries and payroll taxes and compensated absences, which in prior years were not considered of sufficient materiality to record. We elected to make the related adjustments as part of the restatements, as well as an item that affected our prepaid expense account. The restatement adjustments related to these items are set forth in Table G, below.
| Table G | |||||||||||||||||||||||
| Restatement Adjustments Related to Other Items | |||||||||||||||||||||||
| Statements of Income Adjustments | 2007 | 2006 | 2005 | 2004 | 2003 | 2002 | |||||||||||||||||
| Restatement adjustments to increase (decrease) operating expenses for other items | $ | (115,845 | ) | $ | 206,586 | $ | - | $ | - | $ | - | $ | - | ||||||||||
| Restatement adjustments to increase (decrease) G&A expenses for other items | (207,698 | ) | 63,954 | - | - | - | - | ||||||||||||||||
| Net effect on income before income taxes | $ | (323,543 | ) | $ | 270,540 | $ | - | $ | - | $ | - | $ | - | ||||||||||
| Balance Sheets Adjustments |
|||||||||||||||||||||||
| Restatement adjustments to increase accrued salaries and payroll taxes | $ | - | $ | 216,073 | $ | - | $ | - | $ | - | $ | - | |||||||||||
| Restatement adjustments to increase accrued compensated absences | $ | 118,832 | $ | 54,467 | $ | - | $ | - | $ | - | $ | - | |||||||||||
| Restatement adjustments to increase prepaid expenses | $ | 171,835 | $ | - | $ | - | $ | - | $ | - | $ | - | |||||||||||
| The restatement adjustments as described above are reflected in this Form 10-K under the caption, “PART II – ITEM 6. – SELECTED FINANCIAL DATA” in accordance with the financial caption to which they pertain. Table H, below, reconciles previously reported net income and accumulated deficit to restated amounts and summarizes the above restatement adjustments applied in the determination of net income by financial statement caption. Table I, below, summarizes the cumulative restatement adjustments described above applied to the balance sheets by financial statement caption. | |||||||||||||||||||||||
| Table H | |||||||||||||||||||||||
| Reconciliation of Net Income Year ended September 30, | |||||||||||||||||||||||
| 2007 | 2006 | 2005 | 2004 | 2003 | 2002 | ||||||||||||||||||
| Net income, as previously reported | $ | 1,445,016 | $ | 2,710,370 | $ | 7,541,316 | $ | 3,213,937 | $ | 2,375,366 | $ | 1,393,995 | |||||||||||
| Restatement adjustments: | |||||||||||||||||||||||
| Revenues | (211,237 | ) | (1,384,135 | ) | (872,066 | ) | (576,822 | ) | (273,195 | ) | (1,976,112) | ||||||||||||
| Operating expenses | 387,483 | (276,285 | ) | 26,915 | 107,975 | 291,723 | - | ||||||||||||||||
| General and administrative expenses | (316,430 | ) | (971,043 | ) | (369,400 | ) | (412,924 | ) | (384,470 | ) | - | ||||||||||||
| Restatement adjustments to income before income tax benefit |
(140,184 | ) | (2,631,463 | ) | (1,214,551 | ) | (881,771 | ) | (365,942 | ) | (1,976,112) | ||||||||||||
| Income tax restatement adjustments | 37,209 | 1,032,817 | 1,569,048 | - | - | - | |||||||||||||||||
| Effect of restatement adjustments, after tax | (102,975 | ) | (1,598,646 | ) | 354,497 | (881,771 | ) | (365,942 | ) | (1,976,112) | |||||||||||||
| Net income (loss), as restated | $ | 1,342,041 | $ | 1,111,724 | $ | 7,895,813 | $ | 2,332,166 | $ | 2,009,424 | $ | (582,117) | |||||||||||
| Reconciliation of Accumulated Deficit As of September 30, | |||||||||||||||||||||||
| 2007 | 2006 | 2005 | 2004 | 2003 | 2002 | ||||||||||||||||||
| Accumulated deficit, as previously reported | $ | (4,729,753 | ) | $ | (6,174,769 | ) | $ | (8,885,139 | ) | $ | (16,426,455 | ) | $ | (19,640,392 | ) | $ | (22,015,758) | ||||||
| Cumulative restatement adjustments | (4,570,949 | ) | (4,467,974 | ) | (2,869,328 | ) | (3,223,825 | ) | (2,342,054 | ) | (1,976,112) | ||||||||||||
| Accumulated deficit, as restated | $ | (9,300,702 | ) | $ | (10,642,743 | ) | $ | (11,754,467 | ) | $ | (19,650,280 | ) | $ | (21,982,446 | ) | $ | (23,991,870) | ||||||
37
Table of Contents
| Table I | ||||||||||||||||||||||||
| Restatement Adjustments to Balance Sheets As of September 30, |
||||||||||||||||||||||||
| 2007 | 2006 | 2005 | 2004 | 2003 | 2002 | |||||||||||||||||||
| Restatement adjustments: |
||||||||||||||||||||||||
| Assets |
||||||||||||||||||||||||
| Current assets: |
||||||||||||||||||||||||
| Accounts receivable: |
||||||||||||||||||||||||
| Contractual adjustments |
$ | (5,293,568 | ) | $ | (5,082,330 | ) | $ | (3,698,194 | ) | $ | (2,826,129 | ) | $ | (2,249,307 | ) | $ | (1,976,112) | |||||||
| Credit balances |
1,648,015 | 898,985 | 439,930 | 366,576 | 283,464 | 287,028 | ||||||||||||||||||
| Allowance for doubtful accounts |
(932,582 | ) | (932,582 | ) | (470,000 | ) | (150,000 | ) | - | - | ||||||||||||||
| Total accounts receivable |
(4,578,135 | ) | (5,115,927 | ) | (3,728,264 | ) | (2,609,553 | ) | (1,965,843 | ) | (1,689,084 | ) | ||||||||||||
| Income taxes receivable |
(99,208 | ) | (79,241 | ) | - | - | - | - | ||||||||||||||||
| Deferred taxes |
2,341,677 | 2,381,078 | 1,640,033 | - | - | - | ||||||||||||||||||
| Prepaid expenses and other current assets |
171,835 | - | - | - | - | - | ||||||||||||||||||
| Total current assets |
(2,163,831 | ) | (2,814,090 | ) | (2,088,231 | ) | (2,609,553 | ) | (1,965,843 | ) | (1,689,084 | ) | ||||||||||||
| Noncurrent assets: |
||||||||||||||||||||||||
| Property and equipment, net of accumulated depreciation |
(801,807 | ) | (702,312 | ) | (250,818 | ) | (247,696 | ) | (92,747 | ) | - | |||||||||||||
| Leased property under capital leases, net of accumulated amortization |
6,270,537 | 2,784,804 | 672,796 | - | - | - | ||||||||||||||||||
| Deferred taxes |
(11,034 | ) | (46,679 | ) | (221,497 | ) | - | - | - | |||||||||||||||
| Total Assets |
$ | 3,293,865 | $ | (778,277 | ) | $ | (1,887,750 | ) | $ | (2,857,249 | ) | $ | (2,058,590 | ) | $ | (1,689,084 | ) | |||||||
| Liabilities |
||||||||||||||||||||||||
| Current liabilities: |
||||||||||||||||||||||||
| Obligations under capital leases |
$ | 130,492 | $ | 53,279 | $ | 14,320 | $ | - | $ | - | $ | - | ||||||||||||
| Payable to patients and insurance carriers |
1,648,015 | 898,986 | 439,931 | 366,576 | 283,464 | 287,028 | ||||||||||||||||||
| Income taxes payable |
- | - | 127,699 | - | - | - | ||||||||||||||||||
| Accrued salaries and payroll taxes |
- | 216,073 | - | - | - | - | ||||||||||||||||||
| Accrued compensated absences |
118,832 | 54,467 | - | - | - | - | ||||||||||||||||||
| Total current liabilities |
1,897,339 | 1,222,805 | 581,950 | 366,576 | 283,464 | 287,028 | ||||||||||||||||||
| Noncurrent liabilities: |
||||||||||||||||||||||||
| Deferred taxes |
(407,639 | ) | (346,707 | ) | (278,211 | ) | - | - | - | |||||||||||||||
| Obligations under capital leases |
6,375,114 | 2,813,599 | 677,839 | - | - | - | ||||||||||||||||||
| Total Liabilities |
7,864,814 | 3,689,697 | 981,578 | 366,576 | 283,464 | 287,028 | ||||||||||||||||||
| Accumulated deficit |
(4,570,949 | ) | (4,467,974 | ) | (2,869,328 | ) | (3,223,825 | ) | (2,342,054 | ) | (1,976,112) | |||||||||||||
| Total Liabilities and Stockholders’ Equity |
$ | 3,293,865 | $ | (778,277 | ) | $ | (1,887,750 | ) | $ | (2,857,249 | ) | $ | (2,058,590 | ) | $ | (1,689,084) | ||||||||
Critical Accounting Policies
Our discussion and analysis of our financial condition and results of operations is based upon our Consolidated Financial Statements included in this Report, which have been prepared in accordance with accounting principles generally accepted in the United States. The preparation of these financial statements requires us to make estimates and judgments that affect the reported amounts of assets, liabilities, revenues and expenses, and related disclosure of contingent assets and liabilities. We consider critical accounting policies to be those that require more significant judgments and estimates in the preparation of our financial statements and include the following: (1) revenue recognition; (2) accounts receivable; (3) allowance for doubtful accounts; (4) consideration of impairment of intangible assets; and (5) valuation reserve on net deferred tax assets.
Revenue recognition -
We record revenues at the estimated net amount that we expect to receive from patients, employers, third-party payers, and others at the time we perform the services. The amount of revenue we recognize pursuant to the services we provide is subject to significant judgments and estimates. We have stated billing rates which are billed as gross revenues when services are performed. The amounts we bill are then reduced by our estimate of amounts we do not expect to collect due to discounts (“Contractual Adjustments”) that are taken by third-party payers or otherwise given to patients who pay us directly. We estimate Contractual Adjustments based on the ratio of cash collected in the preceding periods to gross revenues we billed. See PART II – ITEM 7. – MANAGEMENT’S DISCUSSION AND ANALYSIS OF FINANCIAL CONDITION AND RESULTS OF OPERATIONS – Restatements and Related Matters – Accounts Receivable and Revenues” for a discussion of issues regarding our prior accounting for Contractual Adjustments which are reflected in the restatement adjustments to certain of our Consolidated Financial Statements and unaudited financial data included in this Report.
38
Table of Contents
Accounts Receivable -
Accounts receivable represent the net receivables we expect to collect related to the services we provide. The amount we record as net accounts receivable is subject to significant judgments and estimates. As explained in the above caption, “Revenue recognition,” the amounts we bill and record as accounts receivable are reduced by our estimate of amounts we will not collect due to Contractual Adjustments that are taken by third-party payers or otherwise given to patients who pay us directly. Additionally, as explained below in the caption, “Allowance for doubtful accounts,” our accounts receivable are also reduced by our estimate of losses which may result from the inability of some of our patients or other third-party payers to make required payments. See “PART II – ITEM 7. – MANAGEMENT’S DISCUSSION AND ANALYSIS OF FINANCIAL CONDITION AND RESULTS OF OPERATIONS – Restatements and Related Matters – Accounts Receivable and Revenues” and “– Accounts Receivable and Payable to Patients and Insurance Carriers” for a discussion of issues regarding our prior accounting for accounts receivable that are reflected in restatement adjustments to certain of our Consolidated Financial Statements and unaudited financial data included in this Report.
Allowance for doubtful accounts -
We maintain our allowance for doubtful accounts for estimated losses, which may result from the inability of our patients to make required payments. Most of our allowance for doubtful accounts relate to amounts owed to us by patients who are or become responsible for the payments associated with services we provide. We base our allowance on the likelihood of recoverability of accounts receivable considering such factors as past experience and current collection trends. Factors taken into consideration in estimating the allowance include: amounts past due, in dispute, or a client that we believe might be having financial difficulties. If economic, industry, or business trends worsen beyond earlier estimates, we increase the allowance for doubtful accounts by recording additional bad debt expense. See “PART II – ITEM 7. – MANAGEMENT’S DISCUSSION AND ANALYSIS OF FINANCIAL CONDITION AND RESULTS OF OPERATIONS – Restatements and Related Matters – Allowance for Doubtful Accounts” for a discussion of issues regarding our prior accounting for allowance for doubtful accounts that are reflected in restatement adjustments to certain of our Consolidated Financial Statements and unaudited financial data included in this Report.
Consideration of impairment of intangible assets -
We evaluate the recovery of the carrying amount of excess of cost over fair value of assets, primarily goodwill, acquired by determining if a permanent impairment has occurred. This evaluation is done annually as of September 30th of each year or more frequently if indicators of permanent impairment arise. Indicators of a permanent impairment include, among other things, significant adverse change in legal factors or the business climate, an adverse action by a regulator, unanticipated competition, loss of key personnel or allocation of goodwill to a portion of the business that is to be sold or otherwise disposed. At such time as impairment is determined, the intangible assets are written off during that period.
Valuation reserve on net deferred tax assets -
We record a valuation allowance to reduce our deferred tax assets to the amount that management considers is more likely than not to be realized. Based upon our current financial position, results from operations, and our forecast of future earnings, we do not believe we currently need a valuation allowance.
Comparison of Fiscal Year Ended September 30, 2008 to Fiscal Year Ended September 30, 2007 and Comparison of Fiscal Year Ended September 30, 2007 to Fiscal Year Ended September 30, 2006
Revenues and Operating Expenses
Our revenues are derived from the medical services we provide to our patients. Amounts we earn as revenues are paid by our patients or collected from third-party payers, including insurance carriers, employers or other third-parties.
Operating expenses are those costs that we incur in the direct delivery of our services to patients and include the costs to operate and maintain our medical centers. Such costs include the salaries and benefits associated with our medical providers and other center employees, rent, depreciation, interest expense on our capital leases, medical supplies and other expenses incurred by our medical centers.
39
Table of Contents
As more fully discussed above, our revenues and operating expenses for the two fiscal years ended September 30, 2007 have been restated. The following table sets forth our revenues, operating expenses and operating margin for the three fiscal years ended September 30, 2008.
| For the years ended September 30, | |||||||||||
| 2008 | 2007 | 2006 | |||||||||
| (Restated) | (Restated) | ||||||||||
| Revenues |
$ | 77,045,256 | $ | 71,645,715 | $ | 62,287,914 | |||||
| Operating Expenses |
(61,244,515 | ) | (56,804,833 | ) | (49,319,085) | ||||||
| Operating Margin |
$ | 15,800,741 | $ | 14,840,882 | $ | 12,968,829 | |||||
Comparison of Revenues and Operating Expenses in 2008 to 2007
We recognized revenues of $77,045,256 in fiscal year 2008 compared to revenues of $71,645,715 in fiscal year 2007. Our revenues are affected by a number of different factors, including increases or decreases in reimbursement rates from third-party payers, the mix of our patients between the nature of the payment source, competitive factors, the severity of seasonal illnesses, the general economic environment and most importantly, the number of new centers we open in the current and preceding year.
The increase in our revenues between our 2008 and 2007 fiscal years of $5,399,541, or 7.54%, was primarily the result of the revenues contributed by the four centers we opened in 2008 and the revenues of the six centers opened at various times in 2007. In 2008, centers that were opened in 2008 contributed revenues of approximately $1,596,000 to total revenues. Centers that were opened in 2007 contributed approximately $5,008,000 of revenues in 2008 in excess of the amount of revenues the same centers contributed in 2007. The decrease of approximately $1,204,000 in revenues associated with our other centers was due to an approximate 3.5% decrease in the number of patient encounters at those centers, which was partially offset by slight increases in other variables such as increases in our charges and reimbursement rates. We believe the decrease in patient encounters primarily resulted from the general worsening economic conditions in 2008 and increased competition.
Our operating expenses were $61,244,515 in fiscal year 2008 compared to $56,804,833 in fiscal year 2007. The increase of $4,439,682, or 7.82%, was due to several factors, the primary factor of which was the cost associated with the opening of the new centers in 2008 and the full year effect of the costs associated with the centers opened in 2007. Additionally, rent expense related to our medical centers increased approximately $384,000. A significant component of this increase related to rent increases on nine of our medical centers which experienced scheduled rent increases based on the Consumer Price Index during 2008. Another component of the increase in operating expenses in 2008 compared to 2007 related to the change in our estimate of the salvage values of our property and equipment. In years prior to 2008, we estimated our salvage value at 10% of the cost of property and equipment. We eliminated our estimate of salvage value in 2008 (reduced to zero) which resulted in an increase in depreciation expense of approximately $600,000 in operating expenses. The increases in operating expenses were offset by significantly reduced bad debt expense in 2008 compared to 2007 of $1,097,000. This decrease was a result of more aggressive collection efforts and the full migration to a new billing and receivables management system.
General and Administrative Expenses (G&A)
G&A expenses consist of the costs and expenses to administer and support our medical centers. Such costs include salaries and benefits of corporate employees (administrative, maintenance and billing departments), postage and shipping, professional fees, advertising, banking fees and other costs incidental to operating our corporate office.
40
Table of Contents
As more fully discussed above, our G&A expenses for the two fiscal years ended September 30, 2007 have been restated. The following table sets forth our G&A expenses for the three fiscal years ended September 30, 2008.
| For the years ended September 30, | |||||||||
| 2008 | 2007 | 2006 | |||||||
| (Restated) | (Restated) | ||||||||
| General and administrative expenses |
$ | 14,056,608 | $ | 12,588,646 | $ | 11,085,785 | |||
Comparison of G&A Expenses in 2008 to 2007
Our G&A expenses were $14,056,608 in fiscal year 2008 compared to $12,588,646 in fiscal year 2007. The increase of $1,467,962, or 12.0%, was due to several factors, the primary factor of which was the increase in salaries and benefit expenses of corporate employees of approximately $1,030,000. Most of the increase in salaries and benefit expenses was due to the addition of approximately twenty employees in our billing department. Additionally, depreciation expense increased by approximately $421,000, of which $351,000 related to the change in our estimate of salvage value as discussed above under the caption “Comparison of Revenues and Operating Expenses in 2008 to 2007.” The overall increase was partially offset by a reduction in interest expense of approximately $197,000. This reduction in interest expense was due to reduced average outstanding balances on our line of credit, reduced amounts outstanding under our term note and generally lower variable interest rates. Moreover, G&A expenses in 2008 and 2007 include approximately $483,000, and $570,000, respectively, of fraudulent transactions and reclassifications from operating expenses related to the fraudulent conduct of our former CFO.
Comparison of Income Tax Expenses in 2008 to 2007
Our income tax expense was $666,714 in fiscal year 2008 compared to $910,195 in fiscal year 2007 and our effective tax rates were 38.2% and 40.4%, respectively. Our effective tax rates vary from the combined enacted federal and state tax rates due to the net effect of nondeductible expenses, offset by certain tax credits we recognize.
Comparison of Revenues and Operating Expenses in 2007 to 2006
We recognized revenues of $71,645,715 in fiscal year 2007 compared to revenues of $62,287,914 in fiscal year 2006. The increase in our revenues between our 2007 and 2006 fiscal years of approximately $9,358,000, or 15.02% was primarily the result of the revenues contributed by the six centers we opened in 2007 and the revenues of the five centers opened at various times in 2006. In 2007, centers that were opened in 2007 contributed revenues of approximately $2,672,000 to total revenues. Centers that were opened in 2006 contributed approximately $2,751,000 of revenues in 2007 in excess of the amount of revenues the same centers contributed in 2006. The increase of approximately $3,935,000 in revenues associated with our other centers was due to an increase in patient encounters in 2007 of approximately 4.7% and by slight increases in other variables such as our charges and reimbursement rates.
Our operating expenses were $56,804,833 in fiscal year 2007 compared to $49,319,085 in fiscal year 2006. The increase of $7,485,748, or 15.18%, was due primarily to the costs associated with the opening of the new centers in 2007 and the full year effect of the costs associated with the centers opened in 2006.
Comparison of G&A Expenses in 2007 to 2006
Our G&A expenses were $12,588,646 in fiscal year 2007 compared to $11,085,785 in fiscal year 2006. The increase of $1,502,861, or 13.6%, was due to several factors, the primary factor of which was the increase in salaries and benefit expenses of corporate employees of approximately $1,348,000. Most of the increase in salaries and benefit expenses was due to the significant expansion of our billing department which included the addition of several managerial positions. Moreover, G&A expenses in 2007 and 2006 include approximately $570,000 and $836,000, respectively, of fraudulent transactions and reclassifications from operating expenses related to the fraudulent conduct of our former CFO.
41
Table of Contents
Comparison of Income Tax Expenses in 2007 to 2006
Our income tax expense was $910,195 in fiscal year 2007 compared to $771,320 in fiscal year 2006 and our effective tax rates were 40.4% and 40.1%, respectively. Our effective tax rates vary from the combined enacted federal and state tax rates due to the net effect of nondeductible expenses, offset by certain tax credits we recognized for tax purposes.
Liquidity and Capital Resources
Our primary liquidity and capital requirements are to fund working capital for current operations, including the expansion of our business through opening new centers, and servicing our long-term debt. Typically, the cash requirements associated with the opening of new centers have been limited to funding the purchase of furniture and medical equipment necessary to provide medical services and funding the operations of the new centers until such time as they generate positive cash flows. The primary sources to meet our liquidity and capital requirements are funds generated from operations, a $1,000,000 line of credit with a commercial bank and other term and mortgage loans.
The line of credit bears interest at the commercial bank’s prime interest rate which was 5% at September 30, 2008 and is secured by our accounts receivable. At September 30, 2007 we had $415,888 outstanding under the line of credit and at September 30, 2008, we had no outstanding borrowings under the line of credit. During 2008, the maximum amount outstanding under the line of credit was $1,000,000, the average amount outstanding was approximately $443,000 and we recognized interest expense of $31,741 related to the line of credit. The weighted average interest rate on the line of credit during 2008 was 7.17%.
At September 30, 2008, we had a term loan outstanding with a commercial bank in the amount of $1,597,998. The term loan was payable in monthly installments of $76,033 and was scheduled for maturity on June 16, 2009. The interest rate on the term loan was the commercial bank’s prime interest rate (5% at September 30, 2008) plus 1/2%. Prior to June 2009, and as explained further below, the term loan was extended and it was modified on November 23, 2009.
In addition, in 2008 we secured a mortgage loan commitment and agreement from the same commercial bank in the amount of $3,200,000 for the purpose of acquiring and renovating our new corporate headquarters property. At September 30, 2008, $1,400,487 was outstanding under the mortgage loan agreement. Under the terms of the mortgage loan agreement we paid interest only at one-month LIBOR plus 2.5% until the modification date, at which time $2,100,000 of the amount outstanding converted to a permanent mortgage loan. The mortgage loan was modified on November 23, 2009. As explained below, approximately $1,100,000 of the $3,200,000 amount then outstanding was transferred to the term loan. Interest on the permanent mortgage loan will continue to be paid based on one-month LIBOR plus 2.5% and we will pay total monthly payments of $11,407. Any amount outstanding on March 15, 2015 will be due and payable on that date.
The term loan, as described above, was modified on November 23, 2009. Under the modified terms, $1,100,000 of the amount outstanding under the mortgage loan was added to the outstanding balance of the term loan. After modification, the aggregate balance of the term loan was $1,785,000. The term loan agreement was further modified to extend the maturity date until October 2013. We will continue to pay monthly installments of $76,033 and the interest rate on the term loan will continue to be paid at the commercial bank’s prime interest rate plus 1/2%.
During 2009, we failed to meet certain covenants under the term loan and the mortgage loan agreements. The loan covenants related to the maintenance of certain debt to equity ratios and the timely filing of our annual and quarterly financial information with the commercial bank during 2009. The commercial bank has waived the violation of these covenants.
Additionally, in the fiscal year ending September 30, 2008 we acquired a center in Surfside Beach, SC for $815,000. We financed the acquisition of the center with a mortgage loan in the amount of $695,000, of which approximately $690,000 was outstanding at September 30, 2008.
Long-term debt increased from $2,587,134 at September 30, 2007 to $3,754,139 at September 30, 2008, due to borrowings on the new term note and mortgage loan, offset by regular principal pay-downs. Our management believes that for the next 12 months and the foreseeable future thereafter it will be able to continue to fund debt service requirements out of cash generated through operations.
42
Table of Contents
Cash provided by operating activities for the fiscal year ended September 30, 2008 was $4,786,388 compared to $4,054,374 for the fiscal year ended September 30, 2007. Cash provided by operating activities for the fiscal year ended September 30, 2006 was $4,603,612. In each of the three years ended September 30, 2008, cash provided by operations resulted primarily from net income, and was increased by non-cash charges to net income, the primary components of which were the provision for losses on accounts receivable, depreciation and amortization and the provision for deferred income taxes. In aggregate, such non-cash charges increased cash provided by operating activities by $5,944,600, $6,178,992 and $5,474,520 for the years ended September 30, 2008, 2007 and 2006, respectively. Such increase was partially offset by continued growth in our accounts receivable of $2,037,045, $5,108,525 and $4,105,445 for the years ended September 30, 2008, 2007 and 2006, respectively. In the years ended September 30, 2007 and 2006, the increase in accounts payable and accrued expenses of $2,048,839 and $2,294,628, respectively, contributed significantly to cash provided by operating activities. In fiscal year 2008, we reduced our accounts payable and accrued expenses by $1,106,975.
Cash used by investing activities for the fiscal year ended September 30, 2008 was $4,851,334 compared to $2,900,667 for the fiscal year ended September 30, 2007. Cash used by investing activities for the fiscal year ended September 30, 2006 was $3,512,187. In each of the three years ended September 30, 2008, the primary use of cash in investing activities related to the purchases of property and equipment, a significant amount of which related to the purchase of furniture and medical equipment to outfit the new centers we opened in each of the three years ended September 30, 2008. Additionally, as discussed above, in fiscal year 2008, we purchased a medical office and acquired and began renovations of a new corporate office.
Cash provided by financing activities for the fiscal year ended September 30, 2008 was $347,172. Cash used in financing activities for the fiscal year ended September 30, 2007 and 2006 was $1,199,493 and $1,519,826, respectively. In 2008, the increase in our financing activities resulted from the financing activities related to the purchase of a medical office and the acquisition of the property for a new corporate office. Such financing activities were offset by the liquidation in 2008 of amounts outstanding under our line of credit as of September 30, 2007. In the years ended September 30, 2007 and 2006, we used cash in financing activities to reduce our debt and other long-term obligations by $1,468,024 and $1,972,404, respectively. Such reductions were offset by increases in our line of credit and other financing activities in the two year period ended September 30, 2007.
At September 30, 2008, we had cash and cash equivalents of $769,649 compared to $487,423 at September 30, 2007, an increase of $282,226. Our working capital was $2,893,448 at September 30, 2008 compared to $3,131,840 at September 30, 2007.
Contractual Obligations
The following table summarizes our contractual obligations as of September 30, 2008:
| Payment Due By Period | ||||||||||
| Contractual Obligations | Total | < 1 Year | 1-3 Years | 3-5 Years | >5 Years | |||||
| Long-term Debt |
4,419,251 | 1,118,215 | 1,175,666 | 928,357 | 1,197,013 | |||||
| Capital Leases |
21,426,422 | 1,323,392 | 2,339,906 | 2,312,008 | 15,451,116 | |||||
| Operating Leases |
30,455,531 | 3,553,272 | 6,523,135 | 4,824,320 | 15,554,804 | |||||
Please refer to Footnotes 4 and 6 to our Consolidated Financial Statements included in this report.
ITEM 7A. QUANTITATIVE AND QUALITATIVE DISCLOSURES ABOUT MARKET RISK
We are exposed to changes in interest rates primarily as a result of our borrowing activities, which includes credit facilities with financial institutions used to maintain liquidity and fund our business operations, as well as notes payable to various third parties in connection with certain acquisitions of property and equipment. The nature and amount of our debt may vary as a result of future business requirements, market conditions and other factors. The definitive extent of our interest rate risk is not quantifiable or predictable because of the variability of future interest rates and business financing requirements. We do not currently use derivative instruments to adjust our interest rate risk profile.
43
Table of Contents
Approximately $755,000 of our debt at September 30, 2008 was subject to fixed interest rates. Approximately $2,999,000 of our debt at September 30, 2008 was subject to variable interest rates. Based on the outstanding amounts of variable rate debt at September 30, 2008, our interest expense on an annualized basis would increase approximately $30,000 for each increase of one percent in the prime rate.
We also have exposure to increases in the consumer price index associated with certain operating and capital leases we have entered, all of which relate to our leased real estate. At September 30, 2008, we had $3,274,958 in aggregate annual lease payments that are subject to increases based on future changes in the consumer price index. Typically, the lease agreements stipulate that the lease payments will increase every three years based on the aggregate increase in the consumer price index over the preceding three years. Of the aggregate annual lease payments subject to change based on the consumer price index, annual payments subject to change in 2009, 2010, 2011 and 2012 are $262,416, $719,880, $2,125,581 and $167,081, respectively.
We do not utilize financial instruments for trading or other speculative purposes, nor do we utilize leveraged financial instruments.
44
Table of Contents
ITEM 8. FINANCIAL STATEMENTS AND SUPPLEMENTARY DATA
INDEX TO CONSOLIDATED FINANCIAL STATEMENTS
Schedule II, Valuation and Qualifying Accounts, is omitted because the information is included in the consolidated financial statements and notes.
45
Table of Contents
Report of Independent Registered Accounting Firm
To the Board of Directors and Stockholders
UCI Medical Affiliates, Inc.
Columbia, South Carolina
We have audited the accompanying consolidated balance sheets of UCI Medical Affiliates, Inc. and Subsidiaries as of September 30, 2008 and 2007, and the related consolidated statements of income, changes in stockholders’ equity, and cash flows for each of the three years in the period ended September 30, 2008. These consolidated financial statements are the responsibility of the Company’s management. Our responsibility is to express an opinion on these consolidated financial statements based on our audits.
We conducted our audits in accordance with the standards of the Public Company Accounting Oversight Board (United States). Those standards require that we plan and perform the audit to obtain reasonable assurance about whether the consolidated financial statements are free of material misstatement. An audit includes examining, on a test basis, evidence supporting the amounts and disclosures in the consolidated financial statements. An audit also includes assessing the accounting principles used and significant estimates made by management, as well as evaluating the overall consolidated financial statement presentation. We believe that our audits provide a reasonable basis for our opinion.
In our opinion, the consolidated financial statements referred to above present fairly, in all material respects, the financial position of UCI Medical Affiliates, Inc. and Subsidiaries as of September 30, 2008 and 2007, and the results of their operations and their cash flows for each of the three years in the period ended September 30, 2008, in conformity with U.S. generally accepted accounting principles.
As discussed in Note 2 to the consolidated financial statements, the 2007 and 2006 consolidated financial statements have been restated to correct misstatements.
We were not engaged to examine management’s assessment of the effectiveness of UCI Medical Affiliates, Inc.’s internal control over financial reporting as of September 30, 2008, included in the accompanying Evaluation of Disclosure Controls and Procedures and Management’s Report on Internal Control over Financial Reporting and, accordingly, we do not express an opinion thereon.
/s/ ELLIOTT DAVIS, LLC
Columbia, South Carolina
January 28, 2010
SIGNED ORIGINAL ON ELLIOTT DAVIS, LLC LETTERHEAD
IS ON FILE IN THE CORPORATE OFFICE OF
UCI MEDICAL AFFILIATES, INC.
46
Table of Contents
Consolidated Balance Sheets
September 30, 2008 and 2007
| (Restated, see Note 2) | ||||||
| 2008 | 2007 | |||||
| Assets |
||||||
| Current Assets |
||||||
| Cash |
$ | 769,649 | $ | 487,423 | ||
| Accounts Receivable, net of allowance for doubtful accounts of $2,872,119 and $3,200,375 |
6,186,375 | 6,836,227 | ||||
| Inventory |
955,892 | 957,569 | ||||
| Income taxes receivable |
186,948 | 958,100 | ||||
| Deferred taxes |
3,310,902 | 3,676,074 | ||||
| Prepaid expenses and other current assets |
380,703 | 504,459 | ||||
| Total current assets |
11,790,469 | 13,419,852 | ||||
| Property and equipment, less accumulated depreciation of $13,622,353 and $13,355,681 |
10,935,156 | 8,533,328 | ||||
| Leased property under capital leases, less accumulated amortization of $1,200,660 and $605,512 |
9,334,040 | 6,667,717 | ||||
| Deferred taxes |
124,757 | - | ||||
| Restricted investments |
1,906,143 | 1,956,087 | ||||
| Goodwill, less accumulated amortization of $2,451,814 |
3,391,942 | 3,391,942 | ||||
| Other assets |
56,734 | 46,735 | ||||
| Total Assets |
$ | 37,539,241 | $ | 34,015,661 | ||
| Liabilities and Stockholders’ Equity |
||||||
| Current liabilities |
||||||
| Line of credit |
$ | - | $ | 415,888 | ||
| Current portion of long-term debt |
944,528 | 890,842 | ||||
| Obligations under capital leases |
349,738 | 271,552 | ||||
| Accounts payable |
427,850 | 2,739,425 | ||||
| Payable to patients and insurance carriers |
2,215,638 | 1,648,015 | ||||
| Accrued salaries and payroll taxes |
3,127,691 | 2,681,346 | ||||
| Accrued compensated absences |
538,392 | 434,606 | ||||
| Other accrued liabilities |
1,293,184 | 1,206,338 | ||||
| Total current liabilities |
8,897,021 | 10,288,012 | ||||
| Long-term liabilities |
||||||
| Accounts payable |
- | 96,511 | ||||
| Deferred tax liability |
- | 7,565 | ||||
| Deferred compensation liability |
2,020,484 | 2,068,436 | ||||
| Long-term debt, net of current portion |
2,809,611 | 1,696,322 | ||||
| Obligations under capital leases |
9,434,678 | 6,558,787 | ||||
| Total long-term liabilities |
14,264,773 | 10,427,621 | ||||
| Total Liabilities |
23,161,794 | 20,715,633 | ||||
| Commitments and contingencies (Note 10) |
- | - | ||||
| Stockholders’ Equity |
||||||
| Preferred stock, par value $.01 per share: authorized shares - 10,000,000; none issued |
- | - | ||||
| Common stock, par value $.05 per share: authorized shares - 50,000,000; |
495,706 | 495,706 | ||||
| Paid-in capital |
22,105,024 | 22,105,024 | ||||
| Accumulated deficit |
(8,223,283) | (9,300,702) | ||||
| Total Stockholders’ Equity |
14,377,447 | 13,300,028 | ||||
| Total Liabilities and Stockholders’ Equity |
$ | 37,539,241 | $ | 34,015,661 | ||
The accompanying notes are an integral part of these consolidated financial statements.
47
Table of Contents
Consolidated Statements of Income
Years ended September 30, 2008, 2007 and 2006
| 2008 | (Restated, see Note 2) 2007 |
(Restated, see Note 2) 2006 | |||||||||
| Revenues |
$ | 77,045,256 | $ | 71,645,715 | $ | 62,287,914 | |||||
| Operating expenses |
(61,244,515 | ) | (56,804,833 | ) | (49,319,085) | ||||||
| Operating margin |
15,800,741 | 14,840,882 | 12,968,829 | ||||||||
| General and administrative expenses |
(14,056,608 | ) | (12,588,646 | ) | (11,085,785) | ||||||
| Income before income taxes |
1,744,133 | 2,252,236 | 1,883,044 | ||||||||
| Income tax expense |
(666,714 | ) | (910,195 | ) | (771,320) | ||||||
| Net income |
$ | 1,077,419 | $ | 1,342,041 | $ | 1,111,724 | |||||
| Basic earnings per share |
$ | 0.11 | $ | 0.14 | $ | 0.11 | |||||
| Basic weighted average common shares outstanding |
9,914,122 | 9,881,613 | 9,783,502 | ||||||||
| Diluted earnings per share |
$ | 0.11 | $ | 0.14 | $ | 0.11 | |||||
| Diluted weighted average common shares outstanding |
9,914,122 | 9,915,524 | 9,858,959 | ||||||||
The accompanying notes are an integral part of these consolidated financial statements.
48
Table of Contents
Consolidated Statements of Changes in Stockholders’ Equity
Years ended September 30, 2008, 2007 and 2006
| Common Stock | Paid-in | Accumulated | Total Stockholders’ | ||||||||||||
| Shares | Amount | Capital | Deficit | Equity | |||||||||||
| Balance at October 1, 2005, as previously reported |
9,740,472 | $ | 487,024 | $ | 21,719,130 | $ | (8,885,139 | ) | $ | 13,321,015 | |||||
| Prior period adjustments, (see Note 2) |
- | - | - | (2,869,328 | ) | (2,869,328) | |||||||||
| Balance at October 1, 2005, restated |
9,740,472 | 487,024 | 21,719,130 | (11,754,467 | ) | 10,451,687 | |||||||||
| Net income, restated |
- | - | - | 1,111,724 | 1,111,724 | ||||||||||
| Exercise of stock options |
85,825 | 4,291 | 210,814 | - | 215,105 | ||||||||||
| Balance at September 30, 2006, restated |
9,826,297 | 491,315 | 21,929,944 | (10,642,743 | ) | 11,778,516 | |||||||||
| Net income, restated |
- | - | - | 1,342,041 | 1,342,041 | ||||||||||
| Exercise of stock options |
87,825 | 4,391 | 175,080 | - | 179,471 | ||||||||||
| Balance at September 30, 2007, restated |
9,914,122 | 495,706 | 22,105,024 | (9,300,702 | ) | 13,300,028 | |||||||||
| Net income |
- | - | - | 1,077,419 | 1,077,419 | ||||||||||
| Balance at September 30, 2008 |
9,914,122 | $ | 495,706 | $ | 22,105,024 | $ | (8,223,283 | ) | $ | 14,377,447 | |||||
The accompanying notes are an integral part of these consolidated financial statements.
49
Table of Contents
Consolidated Statements of Cash Flows
Years ended September 30, 2008, 2007 and 2006
| 2008 | (Restated, see Note 2) 2007 |
(Restated, see Note 2) 2006 | |||||||
| Operating activities: |
|||||||||
| Net income |
$ | 1,077,419 | $ | 1,342,041 | $ | 1,111,724 | |||
| Adjustments to reconcile net income to net |
|||||||||
| Provision for losses on accounts receivable |
2,686,897 | 3,783,914 | 3,643,590 | ||||||
| Depreciation and amortization |
3,024,853 | 1,636,204 | 1,303,251 | ||||||
| Loss on disposal of property and equipment |
59,756 | - | - | ||||||
| Deferred taxes |
232,850 | 758,874 | 527,679 | ||||||
| Changes in operating assets and liabilities: |
|||||||||
| Accounts receivable |
(2,037,045) | (5,108,525) | (4,105,445) | ||||||
| Inventory |
1,677 | (80,960) | (252,668) | ||||||
| Income taxes receivable |
771,152 | (780,421) | (177,679) | ||||||
| Income taxes payable |
- | - | (127,699) | ||||||
| Prepaid expenses and other current assets |
123,756 | (239,188) | (96,100) | ||||||
| Accounts payable and accrued expenses |
(1,106,975) | 2,048,839 | 2,294,628 | ||||||
| Deferred compensation |
(47,952) | 693,596 | 482,331 | ||||||
| Cash provided by operating activities |
4,786,388 | 4,054,374 | 4,603,612 | ||||||
| Investing activities: |
|||||||||
| Purchases of property and equipment |
(4,891,279) | (2,401,097) | (3,039,270) | ||||||
| Proceeds from sale of property |
- | 123,548 | - | ||||||
| Increase in other assets |
(9,999) | (10,463) | (21,994) | ||||||
| Decrease (increase) in restricted investments |
49,944 | (612,655) | (450,923) | ||||||
| Cash used in investing activities |
(4,851,334) | (2,900,667) | (3,512,187) | ||||||
| Financing activities: |
|||||||||
| Proceeds from issuance of common stock |
- | 132,016 | 173,205 | ||||||
| Net (payments ) borrowings on line of credit |
(415,888) | 136,515 | 279,373 | ||||||
| Proceeds from borrowings on notes |
2,095,487 | - | - | ||||||
| Principal payments on notes |
(928,512) | (932,246) | (1,143,480) | ||||||
| Principal payments on capital lease obligations |
(307,404) | (218,058) | (127,444) | ||||||
| Payments on other long-term obligations |
(96,511) | (317,720) | (701,480) | ||||||
| Cash provided by (used in) financing activities |
347,172 | (1,199,493) | (1,519,826) | ||||||
| Increase (decrease) in cash and cash equivalents |
282,226 | (45,786) | (428,401) | ||||||
| Cash and cash equivalents at beginning of year |
487,423 | 533,209 | 961,610 | ||||||
| Cash and cash equivalents at end of year |
$ | 769,649 | $ | 487,423 | $ | 533,209 | |||
| Supplemental cash flow information: |
|||||||||
| Cash paid during the year for: |
|||||||||
| Interest |
$ | 1,241,691 | $ | 992,413 | $ | 679,805 | |||
| Income taxes |
$ | 412,000 | $ | 1,000,000 | $ | - | |||
| Supplemental disclosure of non-cash investing and financing activities: |
|||||||||
| Capital lease obligations incurred |
$ | 3,261,481 | $ | 3,728,234 | $ | 2,660,233 | |||
| Tax benefit for fair market value of exercised stock options |
$ | - | $ | 47,455 | $ | 41,900 | |||
The accompanying notes are an integral part of these consolidated financial statements.
50
Table of Contents
NOTES TO CONSOLIDATED FINANCIAL STATEMENTS
NOTE 1. DESCRIPTION OF COMPANY AND SIGNIFICANT ACCOUNTING POLICIES
Description of Company
UCI Medical Affiliates, Inc. (“UCI”) is a Delaware corporation incorporated on August 25, 1982. Operating through its wholly-owned subsidiary, UCI Medical Affiliates of South Carolina, Inc. (“UCI-SC”), UCI provides nonmedical management and administrative services for a network of 62 freestanding medical centers, 61 of which are located throughout South Carolina and one is located in Knoxville, Tennessee (39 operating as Doctors Care in South Carolina, one as Doctors Care in Knoxville, Tennessee, 19 as Progressive Physical Therapy Services in South Carolina, one as Luberoff Pediatrics in South Carolina, one as Carolina Orthopedic & Sports Medicine in South Carolina and one as Doctors Wellness Center in South Carolina).
Basis of Preparation
The Company’s financial statements have been prepared in conformity with accounting principles generally accepted in the United States of America.
Principles of Consolidation
The consolidated financial statements include the accounts of UCI, UCI-SC, UCI Properties, LLC (“UCI-LLC”), Doctors Care, P.A., Progressive Physical Therapy, P.A. (“PPT”), Carolina Orthopedic & Sports Medicine, P.A. (“COSM”), and Doctors Care of Tennessee, P.C. (the four together as the “P.A.” and together with UCI, UCI-SC and UCI-LLC, the “Company”). Because of the corporate practice of medicine laws in the states in which the Company operates, the Company does not own medical practices but instead enters into exclusive long-term management and administrative services agreements with the P.A.s that operate the medical practices. Consolidation of the financial statements is required under Financial Accounting Standards Board (“FASB”) Interpretation No. 46, as revised, (“FIN 46”) “Consolidation of Variable Interest Entities.” UCI-SC, in its sole discretion, can effect a change in the nominee shareholder of each of the P.A.s at any time for a payment of $100 from the new nominee shareholder to the old nominee shareholder, with no limits placed on the identity of any new nominee shareholder and no adverse impact resulting to UCI-SC or the P.A. from such change. All significant intercompany accounts and transactions are eliminated in consolidation, including management fees.
Use of Estimates
The preparation of financial statements in conformity with accounting principles generally accepted in the United States of America requires management to make certain estimates and assumptions that affect the reported amounts of assets and liabilities and disclosures of contingent assets and liabilities at the date of the financial statements and the reported amounts of revenue and expenses during the reporting period. The most significant estimates are related to the allowance for doubtful accounts, goodwill and intangible assets, income taxes, contingencies, and revenue recognition. The Company bases its estimates on historical experience and on various other assumptions that are believed to be reasonable under the circumstances, the results of which form the basis for making judgments about the carrying value of assets and liabilities that are not readily apparent from other sources. Actual results may differ from these estimates in the near term.
Cash and Cash Equivalents
The Company considers all short-term deposits with a maturity of three months or less at acquisition date to be cash equivalents. At September 30, 2008, the Company had cash deposits in excess of federally insured limits in the approximate amount of $1,468,000.
51
Table of Contents
Accounts Receivable
Accounts receivable are primarily amounts due from patients and amounts due under fee-for-service contracts from third-party payers, such as insurance companies, self-insured employers and government-sponsored healthcare programs. Concentration of credit risk related to accounts receivable is limited by number, diversity and the state-wide geographic dispersion of the business units managed by the Company, as well as by the large number of patients and payers, including the various governmental agencies in the state. The accounts receivable balances serve as collateral for certain of the Company’s financing arrangements.
Allowance for Doubtful Accounts
The Company maintains an allowance for doubtful accounts for estimated losses, which may result from the inability of patients or third-party payers to make required payments. The allowance is based on the likelihood of recoverability of accounts receivable considering such factors as past experience and current collection trends. Factors taken into consideration in estimating the allowance include: amounts past due, charge-off trends and amounts in dispute. If economic, industry, or specific customer business trends worsen beyond estimates, the allowance for doubtful accounts is increased by recording additional bad debt expense.
Inventory
The Company’s inventory consists of medical supplies and drugs and both are carried at the lower of average cost or market. The volume of supplies carried at a center varies very little from month to month; therefore, management does only an annual physical inventory count and does not maintain a perpetual inventory system.
Property and Equipment
Property and equipment is recorded at cost. Depreciation is provided principally by the straight-line method over the estimated useful lives of the assets, ranging from five to forty years.
Maintenance, repairs and minor renewals are charged to expense. Major renewals or betterments, which prolong the life of the assets, are capitalized.
Upon disposal of depreciable property, the asset accounts are reduced by the related cost and accumulated depreciation. The resulting gains and losses are reflected in the consolidated statements of operations.
Long-Lived Asset Impairment
Impairment of long-lived assets, such as property and equipment, are recorded in accordance with Statement of Financial Accounting Standards (“SFAS”) No.144, “Accounting for the Impairment or Disposal of Long-Lived Assets,” as amended. An impairment of a long-lived asset exists when the carrying value of an asset exceeds its fair value and when the carrying value is not recoverable through future operations. The carrying values of long-lived assets are reviewed for impairment when events or changes in circumstances indicate that the carrying amount of assets may not be recoverable. For the three years ended September 30, 2008, the Company recognized no material impairment losses related to long-lived assets.
Goodwill
Goodwill is recorded in accordance with SFAS No. 142, “Goodwill and Other Intangible Assets,” as amended. Goodwill represents the excess of cost over the fair value of assets acquired. Goodwill and intangible assets with indefinite lives are assessed for impairment at least annually using a fair-value-based approach. For the three years ended September 30, 2008, the Company recognized no material impairment losses related to goodwill.
Fair Value of Financial Instruments
The estimated fair value of financial instruments has been determined by the Company using available market information and appropriate valuation methodologies. However, judgment is required in interpreting data to develop the estimates of fair value. Accordingly, management’s estimates are not necessarily indicative of the amounts that the Company could realize in a current
52
Table of Contents
market exchange. Management’s fair value estimates are based on pertinent information available to management as of September 30, 2008 and 2007. The fair values of the Company’s financial instruments are estimated based on current market rates and instruments with the same risk and maturities. The fair values of cash and cash equivalents, accounts receivable, restricted investments, or the related deferred compensation liability, all accounts payables, line of credit, notes payable and payables to related parties approximate the carrying values of these financial instruments.
Restricted Investments
Restricted investments represent Company-owned life insurance policies used to fund the Company’s deferred compensation liability. Changes in cash surrender value are recorded in the Company’s statement of income.
Revenue Recognition
Revenue is recognized at estimated net contracted amounts to be received from patients, employers, third-party payers, and others at the time the related services are rendered. The Company records an estimate for contractual adjustments at the time bills are generated for services rendered. Revenues generated from billings to a major customer, Blue Cross and Blue Shield of South Carolina and its subsidiaries (“BCBS”) totaled approximately 40%, 39%, and 38%, of the Company’s total revenues for fiscal years 2008, 2007, and 2006, respectively. BCBS owns approximately 68% of the Company’s common stock. Revenues generated from billings to state worker’s compensation plans totaled approximately 12% of the Company’s total revenues for the fiscal years 2008, 2007 and 2006.
Concentration of Credit Risk
In the normal course of providing healthcare services, the Company extends credit to patients without requiring collateral. The Company assesses its ability to collect balances due and allowances are established to provide for management’s estimate of uncollectible balances. Approximately 20% of the Company’s year end accounts receivable balance is due from BCBS. No other single payer represents more than 5% of the year end balance. Future revenues of the Company are largely dependent on third-party payers and private insurance companies.
Stock Based Compensation
The Company recognizes compensation costs related to share-based payment transactions ratably in its financial statements over the period that an employee provides service in exchange for the award. The Company applies the modified prospective method to account for its share-based payments. Under the modified prospective method, companies are allowed to record compensation cost for new and modified awards over the related vesting period of such awards prospectively and record compensation cost prospectively on the nonvested portion, at the date of adoption, of previously issued and outstanding awards over the remaining vesting period of such awards. No change to prior periods presented is permitted under the modified prospective method. At September 30, 2008 and 2007, the Company had no nonvested stock options outstanding in any of its plans.
The fair value at the date of grant of the stock option is estimated using the Black-Scholes option-pricing model. The dividend yield is based on estimated future dividend yields. The risk-free rate for periods within the contractual term of the share option is based on the U.S. Treasury yield curve in effect at the time of grant. Expected volatilities are generally based on the historical volatility of the Company’s stock. The expected term of share options granted is generally derived from historical experience. Compensation expense is recognized on a straight-line basis over the stock option vesting period.
Income Taxes
Deferred tax assets and liabilities are recorded based on the difference between the financial statement and tax bases of assets and liabilities as measured by the enacted tax rates which are anticipated to be in effect when these differences reverse. The deferred tax provision is the result of the net change in the deferred tax assets to amounts expected to be realized. Valuation allowances are provided against deferred tax assets when the Company determines it is more likely than not that the deferred tax asset will not be realized. The tax returns for the seven fiscal years ending September 30, 2008 are open for examination by the Internal Revenue Service and the open tax years by state authorities include returns for the fiscal years ending September 30, 2007, 2006, 2005, and 2004.
53
Table of Contents
In 2006, the FASB issued Interpretation No. 48 (“FIN 48”), “Accounting for Uncertainty in Income Taxes – an Interpretation of SFAS No. 109.” FIN 48 clarifies the accounting for uncertainty in income taxes recognized in an enterprise’s financial statements in accordance with SFAS No. 109, “Accounting for Income Taxes.” FIN 48 also prescribes a recognition threshold and measurement of a tax position taken or expected to be taken in an enterprise’s tax return. FIN 48 is effective for fiscal years beginning after December 15, 2006. Accordingly, the Company adopted FIN 48 effective October 1, 2007. The adoption of FIN 48 did not have a material impact on the Company’s consolidated financial position.
Leases
The Company leases office locations and various equipment under non-cancellable operating and capital leases. The Company accounts for these leases in accordance with SFAS No. 13, “Accounting for Leases,” as amended.
Advertising Costs
Advertising and marketing costs are expensed as incurred.
Earnings Per Share
Net income per share is computed in accordance with SFAS No. 128, “Earnings Per Share,” as amended. Basic earnings per share are calculated by dividing income available to common shareholders by the weighted-average number of shares outstanding for each period. Diluted earnings per common share are calculated by adjusting the weighted-average shares outstanding assuming conversion of all potentially dilutive stock options.
Segment Information
The Company has a number of operating segments as defined by SFAS No. 131, “Disclosures about Segments of an Enterprise and Related Information.” All the Company’s operating segments are aggregated into one reportable segment. In its determination of aggregating its operating segments into one reportable segment management considered the following factors: the consistency of the services (direct to patient medical services) provided to its patients; the consistent manner in which its services are delivered to its patients; the similarity in which the Company is reimbursed for its services; the relative close geographic proximity of the operating segments; and, the comparable regulatory environment in which its operating segments operate.
New Accounting Pronouncements
In September 2006, the FASB issued SFAS No. 157, “Fair Value Measurements,” effective for the Company’s fiscal year beginning October 1, 2008. This Statement defines fair value, establishes a framework for measuring fair value, and expands disclosures about fair value measurements. This Statement does not require any new fair value measurements, but simplifies and codifies related guidance within GAAP. This Statement applies under other accounting pronouncements that require or permit fair value measurements. The Company is currently reviewing this pronouncement, but the Company believes it will not have a material impact on the Company’s consolidated financial statements. On February 12, 2008, the FASB issued FASB Staff Position No. 157-2, “Effective Date of FASB Statement No. 157” (“FSP 157-2”) which defers the effective date for all nonfinancial assets and nonfinancial liabilities, except those that are recognized or disclosed at fair value in the financial statements on a recurring basis (that is, at least annually), to fiscal years beginning after November 15, 2008.
In February 2007, the FASB issued SFAS No. 159, “The Fair Value Option for Financial Assets and Financial Liabilities,” (“SFAS No. 159”) which gives companies the option to measure eligible financial assets, financial liabilities and firm commitments at fair value (i.e., the fair value option), on an instrument-by-instrument basis, that are otherwise not permitted to be accounted for at fair value under other accounting standards. The election to use the fair value option is available when an entity first recognizes a financial asset or financial liability or upon entering into a firm commitment. Subsequent changes in fair value must be recorded in earnings. SFAS No. 159 is effective for financial statements issued for fiscal years beginning on or after November 15, 2007. The Company is in the process of evaluating the impacts, if any, of adopting this pronouncement.
54
Table of Contents
In December 2007, the FASB issued SFAS No. 141 (revised 2007), “Business Combinations.” SFAS No. 141 (revised 2007) replaces SFAS No. 141, “Business Combinations,” and applies to all transactions or other events in which an entity obtains control of one or more businesses and combinations achieved without the transfer of consideration. This statement is effective for fiscal years beginning on or after December 15, 2008.
In December 2007, the FASB issued SFAS No. 160, “Noncontrolling Interests in Consolidated Financial Statements,” (“SFAS No. 160”) an amendment of Accounting Research Bulletin No. 51, which establishes new standards governing the accounting for and reporting on noncontrolling interest (“NCIs”) in partially owned consolidated subsidiaries and the loss of control of subsidiaries. Certain provisions of SFAS No. 160 indicate, among other things, that NCIs (previously referred to as minority interests) be treated as a separate component of equity, not as a liability; that increases and decreases in the parent’s ownership interest that leave control intact be treated as equity transactions, rather than a step acquisition or dilution gains or losses; and that losses of a partially owned consolidated subsidiary be allocated to the NCI even when such allocation might result in a deficit balance. SFAS No. 160 also requires changes to certain presentation and disclosure requirements. SFAS No. 160 is effective beginning October 1, 2009. The Company is currently evaluating the impact and disclosure implications of SFAS No. 160 but does not expect it to have a significant impact, if any, on the Company’s financial statements.
In March 2008, the FASB issued SFAS No. 161, “Disclosures about Derivative Instruments and Hedging Activities” (“SFAS 161”). SFAS 161 requires enhanced disclosures about an entity’s derivative and hedging activities. This statement is effective for financial statements issued for fiscal years beginning after November 15, 2008. The Company does not currently use derivative instruments or engage in hedging activities and, therefore, this statement is not applicable to the Company.
In May 2008, the FASB issued SFAS No. 162, “The Hierarchy of Generally Accepted Accounting Principles” (“SFAS 162”). SFAS 162 is intended to improve financial reporting by identifying a consistent framework, or hierarchy, for selecting accounting principles to be used in preparing financial statements that are presented in conformity with US GAAP for nongovernmental entities. The Company does not expect the adoption of SFAS 162 to have a material effect on its results of operations or financial position.
The SEC’s Office of the Chief Accountant and the staff of the FASB issued press release 2008-234 on September 30, 2008 (“Press Release”) to provide clarifications on fair value accounting. The Press Release includes guidance on the use of management’s internal assumptions and the use of “market” quotes. It also reiterates the factors in SEC Staff Accounting Bulletin (“SAB”) Topic 5M which should be considered when determining other-than-temporary impairment: the length of time and extent to which the market value has been less than cost; financial condition and near-term prospects of the issuer; and the intent and ability of the holder to retain its investment for a period of time sufficient to allow for any anticipated recovery in market value. The Company does not expect this SEC guidance to have a material effect on its results of operations or financial position
On October 10, 2008, the FASB issued FSP SFAS 157-3, “Determining the Fair Value of a Financial Asset When the Market for That Asset Is Not Active” (“FSP SFAS 157-3”). This FSP clarifies the application of SFAS No. 157, “Fair Value Measurements” in a market that is not active and provides an example to illustrate key considerations in determining the fair value of a financial asset when the market for that asset is not active. The FSP is effective upon issuance, including prior periods for which financial statements have not been issued. For the Company, this FSP was effective for the quarter ended September 30, 2008.
In June 2009, the FASB issued SFAS No. 168, “The FASB Accounting Standards Codification TM and the Hierarchy of Generally Accepted Accounting Principles – a replacement of FASB Statement No. 162,” (“SFAS 168”). SFAS 168 establishes the FASB Accounting Standards Codification TM (“Codification”) as the source of authoritative generally accepted accounting principles (“GAAP”) for nongovernmental entities. The Codification does not change GAAP. Instead, it takes the thousands of individual pronouncements that currently comprise GAAP and reorganizes them into approximately 90 accounting Topics, and displays all Topics using a consistent structure. Contents in each Topic are further organized first by Subtopic, then Section and finally Paragraph. The Paragraph level is the only level that contains substantive content. Citing particular content in the Codification involves specifying the unique numeric path to the content through the Topic, Subtopic, Section and Paragraph structure. FASB suggests that all citations begin with “FASB ASC,” where ASC stands for Accounting Standards Codification. SFAS 168 is effective for interim and annual periods ending after September 15, 2009 and will not have an impact on the Company’s financial position but will change the referencing system for accounting standards.
55
Table of Contents
In April 2009, the FASB issued FSP SFAS 157-4, “Determining Fair Value When the Volume and Level of Activity for the Asset or Liability Have Significantly Decreased and Identifying Transactions That are Not Orderly,” which recognizes that quoted prices may not be determinative of fair value when the volume and level of trading activity has significantly decreased. The evaluation of certain factors may necessitate that fair value be determined using a different valuation technique. Fair value should be the price that would be received to sell an asset or paid to transfer a liability in an orderly transaction, not a forced liquidation or distressed sale. If a transaction is considered to not be orderly, little, if any, weight should be placed on the transaction price. If there is not sufficient information to conclude as to whether or not the transaction is orderly, the transaction price should be considered when estimating fair value. An entity’s intention to hold an asset or liability is not relevant in determining fair value. Quoted prices provided by pricing services may still be used when estimating fair value in accordance with SFAS 157; however, the entity should evaluate whether the quoted prices are based on current information and orderly transactions. Inputs and valuation techniques are required to be disclosed in addition to any changes in valuation techniques.
In April 2009, the FASB issued FSP SFAS 107-1 and APB 28-1, “Interim Disclosures about Fair Value of Financial Instruments,” which requires disclosures about the fair value of financial instruments for interim reporting periods of publicly traded companies as well as in annual financial statements and also requires those disclosures in summarized financial information at interim reporting periods. A publicly traded company includes any company whose securities trade in a public market on either a stock exchange or in the over-the-counter market, or any company that is a conduit bond obligor. Additionally, when a company makes a filing with a regulatory agency in preparation for sale of its securities in a public market it is considered a publicly traded company for this purpose.
The two preceding staff positions are effective for periods ending after June 15, 2009, with early adoption permitted for periods ending after March 15, 2009. The staff positions will have no material impact on the Company’s financial statements. Additional disclosures will be provided where applicable.
SFAS 165, “Subsequent Events,” (“SFAS 165”) was issued in May 2009 and provides guidance on when a subsequent event should be recognized in the financial statements. Subsequent events that provide additional evidence about conditions that existed at the date of the balance sheet should be recognized at the balance sheet date. Subsequent events that provide evidence about conditions that arose after the balance sheet date but before financial statements are issued, or are available to be issued, are not required to be recognized. The date through which subsequent events have been evaluated must be disclosed as well as whether it is the date the financial statements were issued or the date the financial statements were available to be issued. For nonrecognized subsequent events which should be disclosed to keep the financial statements from being misleading, the nature of the event and an estimate of its financial effect, or a statement that such an estimate cannot be made, should be disclosed. The standard is effective for interim or annual periods ending after June 15, 2009. See Note 12 for management’s evaluation of subsequent events.
SFAS 167, “Amendments to FASB Interpretation No. 46(R),” (“SFAS 167”) was also issued in June 2009. The standard amends FIN 46(R) to require a company to analyze whether its interest in a variable interest entity (“VIE”) gives it a controlling financial interest. A company must assess whether it has an implicit financial responsibility to ensure that the VIE operates as designed when determining whether it has the power to direct the activities of the VIE that significantly impact its economic performance. Ongoing reassessments of whether a company is the primary beneficiary is also required by the standard. SFAS 167 amends the criteria to qualify as a primary beneficiary as well as how to determine the existence of a VIE. The standard also eliminates certain exceptions that were available under FIN 46(R). SFAS 167 is effective as of the beginning of each reporting entity’s first annual reporting period that begins after November 15, 2009, for interim periods within that first annual reporting period, and for interim and annual reporting periods thereafter. Earlier application is prohibited. Comparative disclosures will be required for periods after the effective date. The Company does not expect the standard to have any impact on the Company’s financial position.
Other accounting standards that have been issued or proposed by the FASB or other standards-setting bodies are not expected to have a material impact on the Company’s financial position, results of operations or cash flows.
Reclassifications
Certain amounts in the prior period financial statements have been reclassified to conform to the current period presentation.
56
Table of Contents
NOTE 2. RESTATEMENT OF PREVIOUSLY ISSUED CONSOLIDATED FINANCIAL STATEMENTS
The Company is restating its consolidated financial statements for the year ended September 30, 2007 and for the year ended September 30, 2006, as well as for other prior and interim periods. The restatements were principally related to an internal investigation (the “Investigation”) commenced by the Company’s Audit Committee on December 10, 2008. The Investigation, initially announced on December 18, 2008, was initiated due to the detection of irregularities with respect to the Company’s internal controls and improper expense reimbursements and other disbursements to Jerry F. Wells, Jr., the former Executive Vice-President of Finance, Chief Financial Officer, and Secretary of UCI Medical Affiliates, Inc. (the “former CFO” or Mr. Wells). Mr. Wells’ employment was terminated on December 17, 2008. As a result of the Investigation, on February 27, 2009, Mr. Wells executed a Confession of Judgment in favor of the Company in the amount of $2,967,382 (the “Confession Amount”) related to amounts he had embezzled in the fiscal years from 2003 through 2009.
The Confession Amount was composed of several categories of items that impact the restatements. First, certain items included in the Confession Amount were reflected as operating expenses in the Company’s consolidated financial statements at the time of Mr. Wells’ fraud; however, in the restatements, the items have been reclassified as general and administrative expenses. Similarly, the Company has determined that certain items processed by Mr. Wells which have been construed as legitimate business expenses were also improperly classified as operating expenses. These items have also been reclassified as general and administrative expenses. In addition, the former CFO classified certain fraudulent transactions as property and equipment and such transactions were included in the consolidated financial statements in the periods of and subsequent to the date of the fraud as property and equipment, net of accumulated depreciation. Restatement adjustments which impact the consolidated financial statements for the two-year period ended September 30, 2007, related to the fraudulent transactions and other reclassifications are set forth in Table A, below.
| Table A Restatement Adjustments Related to Fraudulent Transactions and Reclassifications |
||||||||||||
| Periods | ||||||||||||
| prior to | ||||||||||||
| Statements of Income Reclassifications | 2007 | 2006 | 2006 | |||||||||
| Fraudulent operating expenses reclassified to G&A expenses |
$ | 277,510 | $ | 299,128 | $ | 604,572 | ||||||
| Non-fraudulent operating expenses reclassified to G&A expenses |
87,520 | 116,092 | 251,969 | |||||||||
| Total operating expenses reclassified to G&A expenses |
$ | 365,030 | $ | 415,220 | $ | 856,541 | ||||||
| Statements of Income Adjustments | ||||||||||||
| Write-off of property and equipment to G&A expense |
$ | 171,623 | $ | 496,877 | $ | 310,317 | ||||||
| Reversal of depreciation expense: |
(59,602 | ) | (40,375 | ) | (59,435 | ) | ||||||
| Operating expenses |
(12,525 | ) | (5,008 | ) | (63 | ) | ||||||
| G&A expenses |
||||||||||||
| Net effect on income before income taxes |
$ | 99,496 | $ | 451,494 | $ | 250,819 | ||||||
| Balance Sheet Adjustments | ||||||||||||
| Restatement adjustments to reduce property and equipment, net of accumulated depreciation |
$ | 801,807 | ||||||||||
In addition, as part of the Investigation, the Audit Committee directed the Company’s new Chief Financial Officer to re-evaluate its critical accounting policies and compliance with those policies (the “Accounting Policy Review”). In accordance with the Accounting Policy Review it was determined that certain accounting policies had not been applied properly in the current and prior periods. Thus, the restatements include certain adjustments related to the correction of errors resulting from the noncompliance with the Company’s accounting policies.
The Accounting Policy Review did not indicate that the noncompliance with the accounting policies which occurred during the tenure of the former CFO resulted from a scheme to intentionally misrepresent the results of the Company’s operations or its financial position. Rather, the Accounting Policy Review has indicated that the misapplication of the accounting policies resulted from the former CFO’s failure to supervise properly the application of such accounting policies in recording certain transactions, as well as the failure of the Company’s former independent registered public accounting firm to detect such misapplications in connection with its
57
Table of Contents
audit of the consolidated financial statements. The Company believes it has properly remediated the material weaknesses in its internal control over financial reporting.
The financial accounts and transactions that were affected and a description of matters which were discovered pursuant to the Accounting Policy Review are summarized as follows:
Accounts Receivable and Revenues – It was determined that since fiscal year 2002, accounts receivable and revenues were misstated due to differences between standard fees (“Standard Fees”), upon which revenues were initially recorded and the actual amounts that were collected from payers, primarily insurance carriers (“Contracted Amounts”). The difference between the Standard Fees and Contracted Amounts are referred to as Contractual Adjustments.
Historically, Contractual Adjustments were recognized as a reduction to revenues and accounts receivable in the period in which the payments were collected, not at the time the services were rendered, billed and recognized as revenues. Typically, a short period of time transpires between the recognition of Standard Fees as revenues and Contractual Adjustments as reductions to revenues and accounts receivable. In the event that there are no changes in the difference between the Standard Fees and Contracted Amounts and accounts receivables balances remain consistent, the impact on revenues and accounts receivables would not be expected to be significant. However, when there is an increase in Standard Fees without a corresponding and proportionate increase in Contracted Amounts, revenues are misstated for a short period of time and the accumulated effect of the revenue misstatements cause a cumulative misstatement in accounts receivable. Additionally, changes in the amounts of revenues recognized and in the amounts of accounts receivable outstanding from period to period have an impact on the amounts of Contractual Adjustments recognized and the corresponding adjustments to revenues.
The Company evaluated the differences between Standard Fees and Contracted Amounts since fiscal year 2001 and determined that the difference between the Standard Fees and the Contracted Amounts have increased from an insignificant amount in fiscal year 2001 to approximately 34% in fiscal year 2008. As a result, revenues and accounts receivable have been misstated over that period. The restatement adjustments related to revenues and accounts receivable associated with Contractual Adjustments in the years 2007 and 2006 and in the preceding periods are set forth in the Table B, below.
| Table B Restatement Adjustments Related to Contractual Adjustments | |||||||||
| Periods | |||||||||
| prior to | |||||||||
| Statement of Income Adjustments | 2007 | 2006 | 2006 | ||||||
| Restatement adjustments to decrease revenues |
$ | 211,237 | $ | 1,384,135 | $ | 3,698,195 | |||
| Balance Sheet Adjustments | |||||||||
| Restatement adjustments to decrease accounts receivable at the end of each year |
$ | 5,293,567 | |||||||
Accounts Receivable and Payable to Patients and Insurance Carriers – It was determined that amounts previously reported as accounts receivable have been reported net of credit balances in certain patients’ accounts and certain amounts payable to insurance carriers. The credits in patients’ accounts relate to a number of different circumstances, the most typical of which are payments made by patients which are subsequently paid by an insurance carrier. Amounts payable to insurance carriers also relate to a number of different circumstances, the most typical of which are payments made by two or more carriers related to one claim.
Since 2006, the Company has more aggressively collected fees from patients at the time of service and in some cases has subsequently determined that the patient had insurance that covered the charge. Payables to patients are liquidated through reimbursements to patients or the application of credit balances in patients’ accounts to fees for subsequent services. Payables to insurance carriers are liquidated through “take backs,” whereby insurance carriers apply amounts payable to them to future claims.
Reclassifications of amounts payable to patients and insurance companies as of September 30, 2007 are set forth in Table C, below. The reclassifications had no impact on the amounts of revenues recognized or the results of operations.
58
Table of Contents
| Table C | |||
| Balance Sheet Adjustment | 2007 | ||
| Restatement adjustments to increase accounts receivable and payables to patients and insurance carriers |
$ | 1,648,015 | |
Allowance for Doubtful Accounts – In accordance with the Accounting Policy Review the Company performed an evaluation of the activity in and adequacy of its allowance for doubtful accounts. It was determined that the allowance for doubtful accounts as of September 30, 2006, and the amounts recognized as bad debt expense for the year then ended were understated. Additionally, it was determined that a less significant portion of the amount by which the allowance for doubtful accounts as of September 30, 2006, was understated, related to the understatement of bad debt expense prior years. The restatement adjustments related to the allowance for doubtful accounts and bad debt expense are set forth in Table D, below.
| Table D Restatement Adjustments Related to the Allowance for Doubtful Accounts | |||||||||
| Periods | |||||||||
| prior to | |||||||||
| Statement of Income Adjustments | 2007 | 2006 | 2006 | ||||||
| Restatement adjustments to increase bad debt expense |
$ | - | $ | 462,582 | $ | 470,000 | |||
| Balance Sheets Adjustments | |||||||||
| Restatement adjustments to increase the allowance for doubtful accounts |
$ | 932,582 | |||||||
Capital Leases – In accordance with the Accounting Policy Review, the Company evaluated its leases for proper classification and performed classification tests as prescribed by Statement of Financial Accounting Standard (“SFAS”) No. 13 and other relevant accounting standards. It was determined that all leases pertaining to real estate were classified as operating leases; however, the Company determined that certain real estate leases which it had entered since 2004 were not properly classified and that such leases met the criteria as set forth in SFAS No. 13 for capital lease classification. The restatement adjustments related to capital lease assets and obligations, amortization expense, interest expense and operating expenses are set forth in Table E below.
| Table E Restatement Adjustments Related to Reclassification of Operating Leases to Capital Leases |
||||||||||||
| Periods prior to |
||||||||||||
| Statements of Income Adjustments | 2007 | 2006 | 2006 | |||||||||
| Restatement adjustments to recognize interest expense on capital leases |
$ | 453,983 | $ | 188,009 | $ | 54,762 | ||||||
| Restatement adjustments to recognize amortization expense on capital leases |
242,501 | 94,940 | 30,887 | |||||||||
| Restatement adjustments to reverse rent expense |
(543,490 | ) | (220,237 | ) | (66,286 | ) | ||||||
| Net effect on income before income taxes |
$ | 152,994 | $ | 62,712 | $ | 19,363 | ||||||
| Balance Sheet Adjustments | ||||||||||||
| Restatement adjustments to recognize capital lease assets |
$ | 6,638,865 | ||||||||||
| Restatement adjustments to recognize accumulated amortization on capital leases |
(368,328 | ) | ||||||||||
| Restatement adjustments to recognize capital lease assets, net of accumulated amortization |
$ | 6,270,537 | ||||||||||
| Restatement adjustments to recognize capital lease obligations |
$ | 6,505,606 | ||||||||||
59
Table of Contents
Other – In accordance with the Company’s Accounting Policy Review, it evaluated certain accruals which were misstated related to salaries and payroll taxes and compensated absences, which in prior years were not considered of sufficient materiality to record. The Company elected to make the related adjustments as part of the restatements, as well as an item that affected its prepaid expense account. The restatement adjustments related to these items are set forth in Table F below.
| Table F Restatement Adjustments Related to Other Items | ||||||||||
| Periods prior to | ||||||||||
| Statements of Income Adjustments | 2007 | 2006 | 2006 | |||||||
| Restatement adjustments to increase (decrease) operating expenses for other items |
$ | (115,845 | ) | $ | 206,586 | $ | - | |||
| Restatement adjustments to increase (decrease) G&A expenses for other items |
(207,698 | ) | 63,954 | - | ||||||
| Net (increase) decrease on income before income taxes |
$ | (323,543 | ) | $ | 270,540 | $ | - | |||
| Balance Sheet Adjustments | ||||||||||
| Restatement adjustments to increase accrued compensated absences |
$ | 118,832 | ||||||||
| Restatement adjustments to increase prepaid expenses |
$ | 171,835 | ||||||||
The restatement adjustments as described above are reflected in the consolidated financial statements for the two years ended September 30, 2007 in accordance with the financial caption to which they pertain. Table G, below, reconciles previously reported net income and accumulated deficit to restated amounts and summarizes the above restatement adjustments applied in the determination of net income by financial statement caption. Table H, below, summarizes the above restatement adjustments applied to the balance sheet as of September 30, 2007 by financial statement caption.
| Table G Reconciliation of Net Income | |||||||||||
| Years ended September 30, | Periods prior to | ||||||||||
| 2007 | 2006 | 2006 | |||||||||
| Net income, as previously reported |
$ | 1,445,016 | $ | 2,710,370 | |||||||
| Restatement adjustments: |
|||||||||||
| Revenues |
(211,237 | ) | (1,384,135 | ) | $ | (3,698,195) | |||||
| Operating expenses |
387,483 | (276,285 | ) | 426,613 | |||||||
| General and administrative expenses |
(316,430 | ) | (971,043 | ) | (1,166,794) | ||||||
| Restatement adjustments to income |
(140,184 | ) | (2,631,463 | ) | (4,438,376) | ||||||
| Income tax restatement adjustments |
37,209 | 1,032,817 | 1,569,048 | ||||||||
| Effect of restatement adjustments, after tax |
(102,975 | ) | (1,598,646 | ) | $ | (2,869,328) | |||||
| Net income, as restated |
$ | 1,342,041 | $ | 1,111,724 | |||||||
| Reconciliation of Accumulated Deficit | |||||||||||
| As of September 30, | Accumulated October 1, | ||||||||||
| 2007 | 2006 | 2005 | |||||||||
| Accumulated deficit, as previously reported |
$ | (4,729,753 | ) | $ | (6,174,769 | ) | $ | (8,885,139) | |||
| Cumulative restatement adjustments |
(4,570,949 | ) | (4,467,974 | ) | (2,869,328) | ||||||
| Accumulated deficit, as restated |
$ | (9,300,702 | ) | $ | (10,642,743 | ) | $ | (11,754,467) | |||
60
Table of Contents
| Table H Restatement Adjustments to Balance Sheet | ||||||
| 2007 |
||||||
| Restatement adjustments: |
||||||
| Assets |
||||||
| Current assets: |
||||||
| Accounts receivable: |
||||||
| Contractual adjustments |
$ (5,293,568) | |||||
| Credit balances |
1,648,015 | |||||
| Allowance for doubtful accounts |
(932,582) | |||||
| Total accounts receivable |
(4,578,135) | |||||
| Income taxes receivable |
(99,208) | |||||
| Deferred taxes |
2,341,677 | |||||
| Prepaid expenses and other current assets |
171,835 | |||||
| Total current assets |
(2,163,831) | |||||
| Noncurrent assets: |
||||||
| Property and equipment, net of accumulated depreciation |
(801,807) | |||||
| Leased property under capital leases, net of accumulated amortization |
6,270,537 | |||||
| Deferred taxes |
(11,034) | |||||
| Total Assets |
$ 3,293,865 | |||||
| Liabilities and Stockholders’ Equity |
||||||
| Current liabilities : |
||||||
| Obligations under capital leases |
$ 130,492 | |||||
| Payable to patients and insurance carriers |
1,648,015 | |||||
| Accrued compensated absences |
118,832 | |||||
| Total current liabilities |
1,897,339 | |||||
| Noncurrent liabilities: |
||||||
| Obligations under capital leases |
6,375,114 | |||||
| Deferred tax liability |
(407,639) | |||||
| Total Liabilities |
7,864,814 | |||||
| Accumulated deficit |
(4,570,949) | |||||
| Total Liabilities and Stockholders’ Equity |
$ 3,293,865 | |||||
Consolidated Statements of Income – Restatement Adjustments
The following table sets forth the effect of the restatement adjustments on the applicable line items within the Company’s consolidated statements of income for the periods ending September 30, 2007 and 2006:
| Years ended September 30, | ||||||||||||||||||||||
| 2007 | 2006 | |||||||||||||||||||||
| As Previously Reported |
Restatement Adjustments |
Restated | As Previously Reported |
Restatement Adjustments |
Restated | |||||||||||||||||
| Revenues |
$ | 71,856,952 | $ | (211,237) | $ | 71,645,715 | $ | 63,672,049 | $ | (1,384,135) | $ | 62,287,914 | ||||||||||
| Operating expenses |
(57,192,316 | ) | 387,483 | (56,804,833) | (49,042,800 | ) | (276,285 | ) | (49,319,085) | |||||||||||||
| Operating margin |
14,664,636 | 176,246 | 14,840,882 | 14,629,249 | (1,660,420 | ) | 12,968,829 | |||||||||||||||
| General and administrative expenses |
(12,272,216 | ) | (316,430 | ) | (12,588,646) | (10,114,742 | ) | (971,043 | ) | (11,085,785) | ||||||||||||
| Income before income taxes |
2,392,420 | (140,184 | ) | 2,252,236 | 4,514,507 | (2,631,463 | ) | 1,883,044 | ||||||||||||||
| Income tax expense |
(947,404 | ) | 37,209 | (910,195) | (1,804,137 | ) | 1,032,817 | (771,320) | ||||||||||||||
| Net income |
$ | 1,445,016 | $ | (102,975 | ) | $ | 1,342,041 | $ | 2,710,370 | $ | (1,598,646) | $ | 1,111,724 | |||||||||
| Basic earnings per share |
$ | 0.15 | $ | (0.01 | ) | $ | 0.14 | $ | 0.28 | $ | (0.16 | ) | $ | 0.11 | ||||||||
| Basic weighted average common shares outstanding |
9,881,613 | 9,881,613 | 9,881,613 | 9,783,502 | 9,783,502 | 9,783,502 | ||||||||||||||||
| Diluted earnings per share |
$ | 0.15 | $ | (0.01 | ) | $ | 0.14 | $ | 0.27 | $ | (0.16 | ) | $ | 0.11 | ||||||||
| Diluted weighted average common shares outstanding |
9,915,524 | 9,915,524 | 9,915,524 | 9,858,959 | 9,858,959 | 9,858,959 | ||||||||||||||||
61
Table of Contents
Consolidated Balance Sheet – Restatement Adjustments
The following table sets forth the effect of the restatement adjustments on the applicable line items within the Company’s consolidated balance sheet at September 30, 2007:
| As of September 30, 2007 | |||||||||||
| As Previously Reported |
Restatement Adjustments |
Restated | |||||||||
| Assets |
|||||||||||
| Current assets |
|||||||||||
| Cash and cash equivalents |
$ | 487,423 | $ | - | $ | 487,423 | |||||
| Accounts Receivable, net of allowance for doubtful accounts of $3,200,375 |
11,414,362 | (4,578,135 | ) | 6,836,227 | |||||||
| Inventory |
957,569 | - | 957,569 | ||||||||
| Income taxes receivable |
1,057,308 | (99,208 | ) | 958,100 | |||||||
| Deferred taxes |
1,334,397 | 2,341,677 | 3,676,074 | ||||||||
| Prepaid expenses and other current assets |
332,624 | 171,835 | 504,459 | ||||||||
| Total current assets |
15,583,683 | (2,163,831 | ) | 13,419,852 | |||||||
| Property and equipment, less accumulated depreciation of $13,355,681 |
9,335,135 | (801,807 | ) | 8,533,328 | |||||||
| Leased property under capital leases, less accumulated amortization of $605,512 |
397,180 | 6,270,537 | 6,667,717 | ||||||||
| Deferred taxes |
11,034 | (11,034 | ) | - | |||||||
| Restricted investments |
1,956,087 | - | 1,956,087 | ||||||||
| Goodwill, less accumulated amortization of $2,451,814 |
3,391,942 | - | 3,391,942 | ||||||||
| Other assets |
46,735 | - | 46,735 | ||||||||
| Total Assets |
$ | 30,721,796 | $ | 3,293,865 | $ | 34,015,661 | |||||
| Liabilities and Stockholders’ Equity |
|||||||||||
| Current liabilities |
|||||||||||
| Line of credit |
$ | 415,888 | $ | - | $ | 415,888 | |||||
| Current portion of long-term debt |
890,842 | - | 890,842 | ||||||||
| Obligations under capital leases |
141,060 | 130,492 | 271,552 | ||||||||
| Accounts payable |
2,739,425 | - | 2,739,425 | ||||||||
| Payable to patients and insurance carriers |
- | 1,648,015 | 1,648,015 | ||||||||
| Accrued salaries and payroll taxes |
2,681,346 | - | 2,681,346 | ||||||||
| Accrued compensated absences |
315,774 | 118,832 | 434,606 | ||||||||
| Other accrued liabilities |
1,206,338 | - | 1,206,338 | ||||||||
| Total current liabilities |
8,390,673 | 1,897,339 | 10,288,012 | ||||||||
| Long-term liabilities |
|||||||||||
| Accounts payable |
96,511 | - | 96,511 | ||||||||
| Deferred tax liability |
415,204 | (407,639 | ) | 7,565 | |||||||
| Deferred compensation liability |
2,068,436 | - | 2,068,436 | ||||||||
| Long-term debt, net of current portion |
1,696,322 | - | 1,696,322 | ||||||||
| Obligations under capital leases |
183,673 | 6,375,114 | 6,558,787 | ||||||||
| Total long-term liabilities |
4,460,146 | 5,967,475 | 10,427,621 | ||||||||
| Total Liabilities |
12,850,819 | 7,864,814 | 20,715,633 | ||||||||
| Commitments and contingencies |
- | - | - | ||||||||
| Stockholders’ Equity |
|||||||||||
| Preferred stock, par value $.01 per share: authorized shares - 10,000,000; none issued |
- | - | - | ||||||||
| Common stock, par value $.05 per share: authorized shares - 50,000,000; |
|||||||||||
| Issued and outstanding - 9,914,122 shares |
495,706 | - | 495,706 | ||||||||
| Paid-in capital |
22,105,024 | - | 22,105,024 | ||||||||
| Accumulated deficit |
(4,729,753 | ) | (4,570,949 | ) | (9,300,702) | ||||||
| Total Stockholders’ Equity |
17,870,977 | (4,570,949 | ) | 13,300,028 | |||||||
| Total Liabilities and Stockholders’ Equity |
$ | 30,721,796 | $ | 3,293,865 | $ | 34,015,661 | |||||
62
Table of Contents
NOTE 3. PROPERTY AND EQUIPMENT
Property and equipment consists of the following at September 30:
| Useful Life Range (in years) |
2008 | 2007 | ||||||||||||
| Cost | Accumulated Depreciation |
Cost | Accumulated Depreciation | |||||||||||
| (Restated) | (Restated) | |||||||||||||
| Land |
N/A | $ | 113,300 | $ | - | $ | - | $ | - | |||||
| Building |
5 - 40 | 776,496 | 3,587 | 78,681 | 17,130 | |||||||||
| Leasehold Improvements |
5 - 15 | 6,463,507 | 3,073,046 | 5,806,710 | 2,724,837 | |||||||||
| Construction In Progress |
N/A | 1,773,284 | - | - | - | |||||||||
| Furniture & Fixtures |
5 - 10 | 3,542,144 | 2,533,625 | 3,322,711 | 2,149,827 | |||||||||
| EDP – Companion |
5 | 1,175,676 | 1,175,676 | 1,402,274 | 1,304,436 | |||||||||
| EDP – Other |
5 - 10 | 2,406,022 | 1,605,983 | 2,416,764 | 1,660,400 | |||||||||
| Medical Equipment |
5 - 10 | 5,934,739 | 3,561,127 | 6,397,756 | 3,907,555 | |||||||||
| Other Equipment |
5 - 10 | 2,270,867 | 1,590,837 | 2,382,233 | 1,521,339 | |||||||||
| Autos |
5 - 10 | 101,474 | 78,472 | 81,880 | 70,157 | |||||||||
| Totals |
$ | 24,557,509 | $ | 13,622,353 | $ | 21,889,009 | $ | 13,355,681 | ||||||
At September 30, 2008, property and equipment included $1,773,284 of assets that had not yet been placed in service, and therefore have no related depreciation. These assets include the land, building and related costs for the new corporate office that is undergoing renovations, including capitalized interest of $41,168. Management expects the assets to be placed into service during fiscal year 2009.
Depreciation expense totaled $2,429,705, $1,239,897, and $1,197,642, for the years ended September 30, 2008, 2007, and 2006, respectively. Based on historical data, the Company re-evaluated the salvage values of the property and equipment. As a result of this review, the Company reduced the salvage values to zero and recognized additional depreciation expense of $941,236 for fiscal year 2008.
63
Table of Contents
NOTE 4. CAPITAL AND OPERATING LEASES
Capital Leases
The following is an analysis of the leased property under capital leases by major classes at September 30, 2008 and 2007:
| Classes of property: | 2008 | 2007 | ||||
| (Restated) | ||||||
| Buildings |
$ | 9,900,335 | $ | 6,638,864 | ||
| Medical Equipment |
118,768 | 118,768 | ||||
| EDP - Other |
515,597 | 515,597 | ||||
| 10,534,700 | 7,273,229 | |||||
| Less: Accumulated Amortization |
(1,200,660) | (605,512) | ||||
| $ | 9,334,040 | $ | 6,667,717 | |||
Amortization expense on capital leases totaled $595,148, $396,307 and $105,609 for the years ended September 30, 2008, 2007 and 2006, respectively.
The following is a schedule by years of future minimum lease payments under capital leases together with the present value of the net minimum lease payments as of September 30, 2008:
| Year ending September 30: |
|||
| 2009 |
$ | 1,323,392 | |
| 2010 |
1,183,902 | ||
| 2011 |
1,156,004 | ||
| 2012 |
1,156,004 | ||
| 2013 |
1,156,004 | ||
| Thereafter |
15,451,116 | ||
| Total minimum lease payments |
21,426,422 | ||
| Less: Amount representing interest |
(11,642,006) | ||
| Present value of net minimum lease payments |
$ | 9,784,416 | |
Operating Leases
UCI-SC leases office and medical center space under various operating lease agreements. Certain operating leases provide for escalation payments, exclusive of renewal options.
Future minimum lease payments under noncancellable operating leases with a remaining term in excess of one year as of September 30, 2008, are as follows:
| Year ending September 30: |
|||
| 2009 |
$ | 3,553,272 | |
| 2010 |
3,462,665 | ||
| 2011 |
3,060,470 | ||
| 2012 |
2,609,955 | ||
| 2013 |
2,214,365 | ||
| Thereafter |
15,554,804 | ||
| Total minimum lease payments |
$ | 30,455,531 | |
Total rental expense under operating leases for fiscal years 2008, 2007, and 2006 was $3,585,090, $3,155,784 and $2,822,985, respectively.
64
Table of Contents
NOTE 5. INCOME TAXES
The components of the provision for income taxes for the years ended September 30 are as follows:
| 2008 | 2007 | 2006 | |||||||
| (Restated) | (Restated) | ||||||||
| Current: |
|||||||||
| Federal |
$ | 359,766 | $ | 151,751 | $ | 83,260 | |||
| State |
74,098 | 47,025 | 202,282 | ||||||
| 433,864 | 198,776 | 285,542 | |||||||
| Deferred: |
|||||||||
| Federal |
213,065 | 646,744 | 441,617 | ||||||
| State |
19,785 | 64,675 | 44,161 | ||||||
| 232,850 | 711,419 | 485,778 | |||||||
| Total income tax provision |
$ | 666,714 | $ | 910,195 | $ | 771,320 | |||
Deferred taxes result from temporary differences in the recognition of certain items of income and expense, and the changes in the valuation allowance attributable to deferred tax assets.
At September 30, 2008, 2007, and 2006, the Company’s deferred tax assets (liabilities) are as follows:
| 2008 | 2007 | 2006 | |||||||
| (Restated) | (Restated) | ||||||||
| Accounts receivable |
$ | 2,860,145 | $ | 3,348,525 | $ | 3,688,627 | |||
| Operating loss carryforwards |
- | - | 79,048 | ||||||
| Fixed assets |
207,833 | 104,402 | 143,825 | ||||||
| Goodwill |
(483,700) | (415,204) | (346,707) | ||||||
| Accruals |
719,189 | 533,975 | 465,361 | ||||||
| Other |
132,192 | 96,811 | 349,774 | ||||||
| $ | 3,435,659 | $ | 3,668,509 | $ | 4,379,928 | ||||
The principal reasons for the differences between the consolidated income tax (benefit) expense and the amount computed by applying the statutory federal income tax rate of 35% to pre-tax income were as follows for the years ended September 30:
| 2008 | 2007 | 2006 | |||||||
| (Restated) | (Restated) | ||||||||
| Tax at federal statutory rate |
$ | 610,447 | $ | 788,423 | $ | 659,065 | |||
| Effect on rate of: |
|||||||||
| Nondeductible expenses |
25,218 | 21,010 | 16,710 | ||||||
| Operating loss carryforwards |
- | - | (61,547) | ||||||
| State income tax |
56,330 | 72,605 | 160,188 | ||||||
| Other |
(25,281) | 28,157 | (3,096) | ||||||
| $ | 666,714 | $ | 910,195 | $ | 771,320 | ||||
The Company has analyzed the tax positions taken or expected to be taken in its federal, state and local tax filings and has concluded that it has no material liability related to uncertain tax positions in accordance with FIN 48.
65
Table of Contents
NOTE 6. FINANCING ARRANGEMENTS
The Company maintains a line of credit of $1,000,000 with a commercial bank. At September 30, 2008 there were no outstanding borrowings under the line of credit. At September 30, 2007, the Company had outstanding borrowings under the line of approximately $416,000. During 2008 and 2007, the average amounts outstanding under the line of credit were $443,000 and $457,000, respectively. The line of credit bears interest at the commercial bank’s prime rate, which was 5% at September 30, 2008. Borrowings are collateralized by the Company’s accounts receivable and the maturity date of the line of credit is December 31, 2010.
At September 30, 2008, the Company had a term loan outstanding with a commercial bank in the amount of $1,597,998. The term loan was payable in monthly installments of $76,033 and was scheduled for maturity on June 16, 2009. The interest rate on the term loan was the commercial bank’s prime interest rate (5% at September 30, 2008) plus 1/2%. Prior to June 2009, and as explained further below, the term loan was extended and it was modified on November 23, 2009. Accordingly, $845,611 and $752,387 of amounts due under the term loan are classified as current and long-term liabilities, respectively, at September 30, 2008. The term loan is secured by substantially all the Company’s assets.
In addition, in 2008 the Company secured a mortgage loan commitment and agreement from the same commercial bank in the amount of $3,200,000 for the purpose of acquiring and renovating its new corporate headquarters property. At September 30, 2008, $1,400,487 was outstanding under the mortgage loan agreement. Under the terms of the mortgage loan agreement the Company paid interest only at one-month LIBOR plus 2.5% until the modification date, at which time $2,100,000 of the amount outstanding converted to a permanent mortgage loan. The mortgage loan was modified on November 23, 2009. As explained below, approximately $1,100,000 of the $3,200,000 amount then outstanding was transferred to the term loan. Interest on the permanent mortgage loan will continue to be paid based on one-month LIBOR plus 2.5% and the Company will pay total monthly payments of $11,407. Any amount outstanding on March 5, 2015 will be due and payable on that date. The mortgage loan is secured by a lien on the Company’s corporate headquarters.
The term loan, as described above, was modified on November 23, 2009. Under the modified terms, $1,100,000 of the amount outstanding under the mortgage loan was added to the outstanding balance of the term loan. After modification, the aggregate balance of the term loan was $1,785,000. The term loan agreement was further modified to extend the maturity date until October 2013. The Company will continue to pay monthly installments of $76,033 and the interest rate on the term loan will continue to be paid at the commercial bank’s prime interest rate plus 1/2%.
During 2009, the Company failed to meet certain covenants under the term loan and the mortgage loan agreements. The loan covenants related to the maintenance of certain debt to equity ratios and the timely filing of the Company’s annual and quarterly financial information with the commercial bank during 2009. The commercial bank has waived the violation these loan covenants.
On July 17, 2008, the Company purchased a Doctors Care building for a total purchase price of $815,000. This property was previously rented by the Company and occupied as a medical center. A portion of the purchase price was funded by a promissory note in the original principal amount of $695,000, and is collateralized by a lien on the property. At September 30, 2008, the outstanding balance on the mortgage loan was approximately $690,000. The promissory note accrues interest at a rate of 5.95 percent per annum. Starting on August 16, 2008 and continuing for 59 months thereafter, principal and interest payments in the amount of $5,890 are payable. The entire unpaid balance of principal and interest will be due on July 16, 2013.
66
Table of Contents
Long-term debt consists of the following at September 30:
| 2008 | 2007 | ||||||
| Term note in the amount of $3,200,000 dated June 16, 2005, payable in monthly installments including interest at a rate of prime plus 1/2 % (prime rate is 5% as of September 30, 2008) of $76,033, maturing October, 2013, collateralized by substantially all assets of the Company. | $ | 1,597,998 | $ | 2,373,634 | |||
| Note payable in the amount o f $1,600,000 with monthly installments of $13,328 including interest at 8% through February 2009 collateralized by accounts receivable from patients and leasehold interests and the guarantee of the P.A. | 65,325 | 213,530 | |||||
| Term note with a commitment level up to $3,200,000 payable to a financial institution, with a variable interest rate based on the one month Libor Rate (2.485% at September 30, 2008), plus 2.5% interest only payments due through September 2009. In November 2009, $1,100,000 was transferred to the term loan described above and the remaining balance of $2,100,000 will be payable in monthly installments of $11,407 including interest. The loan matures on March 5, 2015, and is collateralized by a lien on the property. | 1,400,487 | - | |||||
| Mortgage loan payable to a financial institution in the amount of $695,000 with monthly installments of $5,890 including interest at 5.95% from August 16, 2008 through July 16, 2013, with a final payment of all remaining principal and accrued interest due in July 2013, collateralized by a lien on the property and substantially all the assets of the Company. | 690,329 | - | |||||
| Subtotal |
3,754,139 | 2,587,164 | |||||
| Less, current portion | (944,528 | ) | (890,842) | ||||
| Total Long-term Debt | $ | 2,809,611 | $ | 1,696,322 | |||
Aggregate maturities of notes payable are as follows:
| Year ending September 30, | |||
| 2009 |
$ | 944,528 | |
| 2010 |
880,058 | ||
| 2011 |
137,822 | ||
| 2012 |
145,200 | ||
| 2013 |
671,315 | ||
| Thereafter |
975,216 | ||
| $ | 3,754,139 | ||
67
Table of Contents
NOTE 7. EMPLOYEE BENEFIT AND STOCK OPTION PLANS
Employee Benefit Plans
The Company has an employee savings plan (the “Savings Plan”) that qualifies as a deferred salary arrangement under Section 401(k) of the Internal Revenue Code. Under the Savings Plan participating employees may defer a portion of their pretax earnings, up to the Internal Revenue Service annual contribution limit. The Company matches 150% of each employee’s contribution up to a maximum of 4% of the employee’s earnings. The Company’s matching contributions were approximately $920,000, $948,000, and $830,000, in fiscal years 2008, 2007, and 2006, respectively.
During June 1997, the Company’s Board of Directors approved the UCI/Doctors Care Deferred Compensation Plan (the “Plan”) for key employees of the Company with an effective date of June 1998. Under the Plan, as amended and restated effective January 1, 2005, key employees may defer up to 30% of their pre-tax earnings. The Company may match up to three times the employee’s contribution percentage up to a limit of 10% of the employee’s pre-tax earnings. Employees with at least five years of service vest immediately in the Company’s matching contribution. Distributions from the Plan to the employee or their beneficiaries may occur if the employee resigns or is terminated, becomes disabled or deceased, reaches the normal retirement age of 65, or if there is a change of control of the Company. Participating employees may elect a lump-sum payment or be paid in annual installments; however, in no event may the employee receive the first payment until six months after the event which precipitated the distribution. The Company’s matching contributions were approximately $261,000, $263,000, and $226,000, in fiscal years 2008, 2007, and 2006, respectively. The Company establishes and maintains insurance contracts, classified as “Restricted investments” in the Company’s balance sheets, to fund the Deferred Compensation Plan. The “Deferred compensation liability” increases or decreases based on employee and Company contributions plus or minus earnings or losses on the deemed investment selections of the participants less any payments to participants.
Pursuant to the Company’s incentive stock option plan adopted in 1994, (the “1994 Plan”), “incentive stock options,” within the meaning of Section 422 of the Internal Revenue Code, may be granted to employees of the Company. The 1994 Plan provides for the granting of options for the purchase of 750,000 shares at 100% of the fair market value of the stock at the date of grant (or for 10% or higher shareholders, at 110% of the fair market value of the stock at the date of grant). Options granted under the 1994 Plan vest at a rate of 33% in each of the three years following the grant. Vested options become exercisable one year after the date of grant and can be exercised within ten years of the date of grant, subject to earlier termination upon cessation of employment. At September 30, 2008, there were no stock options outstanding under the 1994 Plan.
During the fiscal year ended September 30, 1996, the Company adopted a Non-Employee Director Stock Option Plan (the “1996 Non-Employee Plan”). The 1996 Non-Employee Plan provides for the granting of options to two non-employee directors for the purchase of 10,000 shares of the Company’s common stock at the fair market value as of the date of grant. Under this plan, a total of 5,000 options were issued to two non-employee directors. These options were exercisable during the period commencing on March 20, 1999 and ending on March 20, 2006. At September 30, 2006, stock options under the 1996 Non-Employee Plan had expired.
During the fiscal year ended September 30, 1997, the Company adopted a Non-Employee Director Stock Option Plan (the “1997 Non-Employee Plan”). The 1997 Non-Employee Plan provides for the granting of options to three non-employee directors for the purchase of 20,000 shares of the Company’s common stock at the fair market value as of the date of grant. Under this plan, 5,000 options were issued to Thomas G. Faulds, Ashby Jordan, M.D., and Charles M. Potok. These options were exercisable during the period commencing on March 28, 2000 and ending on March 28, 2007. At September 30, 2007, all stock options were exercised under the 1997 Non-Employee Plan.
The Company established the 2007 Equity Incentive Plan (the “Plan”), effective as of March 7, 2007, to use Common Stock of UCI (“Common Stock”) as a tool to encourage employees of UCI and its subsidiaries, its affiliates and its joint ventures to work together to increase the overall value of UCI Common Stock. The Company believes the Plan will serve the interests of UCI and its stockholders because it allows employees to have a greater personal financial interest in UCI through ownership of its Common
68
Table of Contents
Stock, the right to acquire its Common Stock, or other plan awards and rights that are measured and paid based on UCI’s performance. The types of equity incentives under this Plan include:
| (a) | Incentive Stock Options; |
| (b) | Nonqualified Stock Options; |
| (c) | Stock Appreciation Rights; |
| (d) | Restricted Stock Grants; |
| (e) | Performance Shares; |
| (f) | Share Awards; and |
| (g) | Phantom Stock Awards. |
At September 30, 2008, no equity incentives have been issued under this Plan.
Stock Option Plans
The following table summarizes activity and weighted average fair value of options granted for the three previous fiscal years for the Company’s four stock option plans.
| Stock Options |
1994 Plan |
1996 Non-Employee Plan |
1997 Non- Employee Plan | |||
| Outstanding and Exercisable at 09/30/05 |
225,650 | 5,000 | 10,000 | |||
| Exercised |
(85,825) | — | — | |||
| Forfeited |
(53,000) | (5,000) | — | |||
| Outstanding and Exercisable at 09/30/06 |
86,825 | — | 10,000 | |||
| Exercised |
(77,825) | — | (10,000) | |||
| Forfeited |
(9,000) | — | — | |||
| Outstanding and Exercisable at 09/30/07 |
— | — | — | |||
| Exercised |
— | — | — | |||
| Forfeited |
— | — | — | |||
| Outstanding and Exercisable at 09/30/08 |
— | — | — | |||
The Company has not granted options under any plans during fiscal years 2008, 2007, and 2006, and there have been no options exercised during 2008; options for 87,825 shares were exercised during 2007; and, options for 85,825 shares were exercised during 2006.
69
Table of Contents
The following table summarizes the weighted average exercise price of stock options exercisable at the end of each of the three previous fiscal years:
| Weighted Average Exercise Price |
1994 Plan | 1996 Non-Employee Plan |
1997 Non-Employee Plan | ||||||
| Outstanding at 09/30/05 |
$ | 2.63 | $ | 3.50 | $ | 2.50 | |||
| Exercisable at 09/30/05 |
2.63 | 3.50 | 2.50 | ||||||
| Granted FY 05/06 |
— | — | (2.50) | ||||||
| Exercised FY 05/06 |
— | — | — | ||||||
| Forfeited FY 05/06 |
— | (3.50) | — | ||||||
| Outstanding at 09/30/06 |
$ | 2.63 | — | $ | 2.50 | ||||
| Exercisable at 09/30/06 |
2.63 | — | 2.50 | ||||||
| Granted FY 06/07 |
— | — | — | ||||||
| Exercised FY 06/07 |
— | — | (2.50) | ||||||
| Forfeited FY 06/07 |
(2.63) | — | — | ||||||
| Outstanding at 09/30/07 |
$ | — | $ | — | $ | — | |||
| Exercisable at 09/30/08 |
— | — | — | ||||||
| Granted FY 07/08 |
— | — | — | ||||||
| Exercised FY 07/08 |
— | — | — | ||||||
| Forfeited FY 07/08 |
— | — | — | ||||||
| Outstanding at 09/30/08 |
$ | — | $ | — | $ | — | |||
All of the stock options had fully vested prior to October 1, 2000, and therefore, there was no compensatory effect for the three years ended September 30, 2008. The Company has historically calculated the fair value of stock options using the Black-Scholes option-pricing model.
NOTE 8. OPERATING EXPENSES
The components of operating expenses for each of the three years ended September 30 are as follows:
| 2008 | 2007 | 2006 | |||||||
| (Restated) | (Restated) | ||||||||
| Salaries and benefits |
$ | 41,125,450 | $ | 38,054,726 | $ | 32,750,362 | |||
| Rent |
3,430,919 | 3,046,588 | 2,729,528 | ||||||
| Maintenance and utilities |
1,674,017 | 1,469,300 | 1,199,691 | ||||||
| Taxes and insurance |
1,949,824 | 1,480,541 | 1,266,375 | ||||||
| Communications expense |
828,657 | 913,809 | 728,446 | ||||||
| Medical and other supplies |
5,682,964 | 5,706,433 | 5,145,496 | ||||||
| Provision for doubtful accounts |
2,686,897 | 3,783,914 | 3,643,590 | ||||||
| Depreciation and amortization |
2,290,479 | 1,322,667 | 973,292 | ||||||
| Interest expense |
900,046 | 453,983 | 188,009 | ||||||
| Other expenses |
675,262 | 572,872 | 694,296 | ||||||
| $ | 61,244,515 | $ | 56,804,833 | $ | 49,319,085 | ||||
70
Table of Contents
NOTE 9. GENERAL AND ADMINISTRATIVE EXPENSES
The components of general and administrative expenses for each of the three years ended September 30 are as follows:
| 2008 | 2007 | 2006 | |||||||
| (Restated) | (Restated) | ||||||||
| Salaries and benefits |
$ | 7,310,495 | $ | 6,280,869 | $ | 4,933,060 | |||
| Maintenance and utilities |
374,259 | 385,805 | 421,929 | ||||||
| Postage and shipping |
721,625 | 635,052 | 396,999 | ||||||
| Office supplies |
162,901 | 189,458 | 183,607 | ||||||
| Advertising |
1,500,300 | 1,339,323 | 1,364,476 | ||||||
| Professional fees |
389,531 | 321,311 | 200,692 | ||||||
| Depreciation and amortization |
734,374 | 313,537 | 329,959 | ||||||
| Interest expense |
341,645 | 538,430 | 491,797 | ||||||
| Banking fees |
543,904 | 499,968 | 401,775 | ||||||
| Misappropriation loss |
483,148 | 569,770 | 835,752 | ||||||
| Other expenses |
1,494,426 | 1,515,123 | 1,525,739 | ||||||
| $ | 14,056,608 | $ | 12,588,646 | $ | 11,085,785 | ||||
NOTE 10. COMMITMENTS AND CONTINGENCIES
The Company is insured for professional and general liability on a claims-made basis, with additional tail coverage being obtained when necessary.
The Company provides healthcare benefits to its employees under a partially self-insured healthcare plan. Claims are paid by the Company up to an individual and aggregate amount limit of $75,000 and $1,925,000. Claims in excess of these limits are covered by a third-party insurance contract. Healthcare benefit claims of approximately $1,976,000, $1,415,000, and $1,361,000, respectively, for each of the three fiscal years ended September 30, 2008, are included in these financial statements. The Company has accrued estimated incurred but not reported healthcare claims of approximately $379,000 and $269,000 as of September 30, 2008 and September 30, 2007, respectively. As discussed in Note 12 the partially self-insured healthcare plan was modified subsequent to September 30, 2008.
In the ordinary course of conducting its business, the Company becomes involved in litigation, claims, and administrative proceedings. Certain litigation, claims, and proceedings were pending at September 30, 2008, and management intends to vigorously defend the Company in such matters.
The healthcare industry is subject to numerous laws and regulations of federal, state and local governments. These laws and regulations include, but are not necessarily limited to, matters such as licensure, accreditation, government healthcare program participation requirements, reimbursement for patient services and Medicare and Medicaid fraud and abuse. Recently, government activity has increased with respect to investigations and allegations concerning possible violations of fraud and abuse statutes and regulations by healthcare providers.
Violations of these laws and regulations could result in expulsion from government healthcare programs together with the imposition of significant fines and penalties, as well as significant repayments for patient services previously billed. Management believes that the Company is in compliance with fraud and abuse laws and regulations as well as other applicable government laws and regulations; however, the possibility for future governmental review and interpretation exists.
The Company is exposed to changes in interest rates primarily as a result of its borrowing activities, which includes credit facilities with financial institutions used to maintain liquidity and fund its business operations, as well as notes payable to various third parties in connection with certain acquisitions of property and equipment. The nature and amount of the Company’s debt may vary as a result of future business requirements, market conditions and other factors. The definitive extent of the Company’s interest rate risk is not quantifiable or predictable because of the variability of future interest rates and business financing requirements. The Company does not currently use derivative instruments to adjust its interest rate risk profile.
71
Table of Contents
Approximately $755,000 of the Company’s debt at September 30, 2008 was subject to fixed interest rates. Approximately $2,999,000 of its debt at September 30, 2008 was subject to variable interest rates. Based on the outstanding amounts of variable rate debt at September 30, 2008, the Company’s interest expense on an annualized basis would increase approximately $30,000 for each increase of one percent in the prime rate.
The Company also has exposure to increases in the consumer price index associated with certain operating and capital leases it has entered, all of which relate to its leased real estate. At September 30, 2008, the Company had $3,891,698 in aggregate annual lease payments that are subject to increases based on future changes in the consumer price index. Typically, the lease agreements stipulate that the lease payments will increase every three years based on the aggregate increase in the consumer price index over the preceding three years. Of the aggregate annual lease payments subject to change based on the consumer price index, annual payments subject to change in 2009, 2010, 2011 and 2012 are $262,416, $719,880, $2,125,581 and $783,821, respectively.
The Company does not utilize financial instruments for trading or other speculative purposes, nor does it utilize leveraged financial instruments.
NOTE 11. RELATED PARTY TRANSACTIONS
Relationship between UCI-SC and the P.A.
Pursuant to agreements between UCI-SC and the P.A., UCI-SC provides non-medical management services and personnel, facilities, equipment and other assets to the medical centers. UCI-SC guarantees the compensation of the physicians employed by the P.A. The agreements also allow UCI-SC to negotiate contracts with HMOs and other organizations for the provision of medical services by the P.A. physicians. Under the terms of the agreement, the P.A. assigns all revenue generated from providing medical services to UCI-SC. UCI-SC pays on the P.A.’s behalf the cost of medical services, including physician salaries. The P.A. is owned by D. Michael Stout, M.D., who is also the Chief Executive Officer for UCI and UCI-SC.
Relationship between the Company and Blue Cross Blue Shield of South Carolina
Blue Cross Blue Shield of South Carolina (BCBS) owns 100% of BlueChoice HealthPlan (“BCHP”), Companion Property & Casualty Insurance Company (“CP&C”) and Companion Technologies, Inc. (“CT”). At September 30, 2008, BCHP owned 6,107,838 shares of the Company’s outstanding common stock and CP&C owned 618,181 shares of the Company’s outstanding common stock, which combine to approximately 68% of the Company’s outstanding common stock.
Facility Leases
Two medical facilities operated by UCI-SC are leased from physician employees of the P.A. Total lease payments made by UCI-SC under these leases during the Company’s fiscal years ended September 30, 2008, 2007, and 2006, were approximately $126,000, $123,000 and $123,000, respectively.
Other Transactions with Related Parties
At September 30, 2008, BCBS and its subsidiaries control 6,726,019 shares, or approximately 68% of the Company’s outstanding common stock. The shares acquired by BlueChoice HealthPlan (“BCHP”) and Companion Property & Casualty Insurance Company (“CP&C”) from the Company were purchased pursuant to stock purchase agreements and were not registered. BCHP and CP&C have the right to require registration of the stock under certain circumstances as described in the agreement. BCBS and its subsidiaries have the option to purchase as many shares as may be necessary for BCBS to obtain ownership of not less than 48% of the outstanding common stock of the Company in the event that the Company issues additional stock to other parties (excluding shares issued to employees or directors of the Company).
The Company enters into capital lease obligations with CT to purchase computer equipment, software, and billing and accounts receivable upgrades. The total of all lease obligations to CT recorded at September 30, 2008 is $183,673.
72
Table of Contents
During the Company’s fiscal year ended September 30, 1994, UCI-SC entered into an agreement with CP&C pursuant to which UCI-SC, through the P.A., acts as the primary care provider for injured workers of firms carrying worker’s compensation insurance through CP&C.
UCI-SC, through the P.A., provides services to members of a health maintenance organization (“HMO”) operated by BlueChoice HealthPlan (“BCHP”) who has selected the P.A. as their primary care provider.
During fiscal years 2008, 2007, and 2006, the Company paid BCBS and its subsidiaries approximately $29,000, $44,000, and $24,000, respectively, in interest.
Revenues generated from billings to BCBS and its subsidiaries totaled approximately 40%, 39%, and 38%, of the Company’s total revenues for fiscal years 2008, 2007, and 2006, respectively. Amounts receivable from BCBS and its subsidiaries approximated $2,305,000 and $2,128,000 at September 30, 2008 and 2007, respectively.
NOTE 12. SUBSEQUENT EVENTS
As more fully explained in Note 2, on December 10, 2008, the Company’s Audit Committee of the Board of Directors (the “Audit Committee”) commenced an internal investigation (the “Investigation”) of certain accounting irregularities with respect to its internal controls and improper expense reimbursements to Jerry F. Wells, Jr., the Company’s former Executive Vice-President of Finance, Chief Financial Officer, and Secretary. On December 17, 2008, the Board of Directors terminated the employment of Mr. Wells based upon the preliminary results of the Investigation. On February 27, 2009, Mr. Wells executed a Confession of Judgment (the “Judgment”) in favor of the Company in the amount of Two Million Nine Hundred Sixty-Seven Thousand Three Hundred and Eighty-Two ($2,967,382) Dollars.
During the Company’s 2009 fiscal year approximately $800,000 in costs associated with the Investigation have been incurred. Such costs are composed primarily of professional fees and include certain audit-related expenses related to the re-audit of the Company’s consolidated financial statements for the three year period ending September 30, 2008.
On February 20, 2009, the Company’s Board of Directors passed a resolution declaring a forfeiture of Mr. Wells’ interest in the Company’s deferred compensation plan. On February 23, 2009, Mr. Wells signed a voluntary relinquishment of any claims under the deferred compensation plan. The Company does not deem the relinquishment of any of Mr. Wells’ interest in the deferred compensation plan as a partial settlement of amounts he owes the Company under the Judgment. Rather, the Company deems such amount a nullity as of the date of the resolution of our Board of Directors because any such interest in the deferred compensation plan had been conditionally credited to Mr. Wells under false pretenses. The amount of the conditional liability associated with the deferred compensation plan at September 30, 2008 approximated $764,000. The conditional liability at the date of forfeiture, the reversal of which will be recognized in the second quarter of 2009, approximated $600,000.
The Company’s efforts to collect under the Judgment from Mr. Wells continue. As of August 2009, the Company has recovered certain items of jewelry and other personal property, none of which is of significant value. Additionally, the Company has collected $110,000 from the sales of other assets in which Mr. Wells had an interest.
Further, the Company has filed claims with two insurance carriers under a fidelity bond and employee dishonety insurance policies. Even though it intends to vigorously pursue its claims under the policies, the Company can make no reasonable estimate of amounts it may receive under the bond and the policies. Similarly, the Company is unable to estimate whether amounts owed to the Company pursuant to the Judgment will be collected. Accordingly, the Company has not recognized any net receivable associated with the insurance claims or the Judgment at September 30, 2008.
On February 13, 2009 the Company’s common stock was delisted from the Over-The-Counter Bulletin Board as a result of the Company’s failure to file its Annual Report on Form 10-K with the Securities and Exchange Commission for the fiscal year ended September 30, 2008. Such failure was due to the Investigation of the Company’s previous Chief Financial Officer, as described above. Since February 13, 2009, the Company’s common stock has traded on the Pink Sheets Electronic Over-The-Counter Market.
73
Table of Contents
Subsequent to September 30, 2008, the Company has opened five Doctors Care centers and one Physical Therapy center and has closed one Doctors Care center. The Physical Therapy center shares a building with a Doctors Care center. All of the new centers are leased and all are located in South Carolina. The terms of the leases associated with the five new centers locations are twenty years and all will be classified as capital leases. The aggregate amount the Company will record (at the inception of the leases) as capital lease assets and obligations under the capital leases is $4,657,015. In addition, in June 2009, the Company completed the renovation of its new corporate headquarters building which was acquired in October 2007, and relocated all of its corporate employees to the new location in Columbia, South Carolina. The Company financed the purchase and renovation of the new headquarters property and, since September 30, 2008, has incurred additional debt of approximately $1,800,000 related to the financing of the property.
Subsequent to September 30, 2008, the Company has renegotiated several loans that were outstanding at September 30, 2008. The circumstances and related events which have occurred since September 30, 2008 associated with the renegotiated loans are described in Note 6.
In January 2009, the Company terminated its self-insured healthcare plan and entered into an insurance contract with BCBS to cover the Company’s employees. The monthly premiums paid to BCBS approximate $225,000.
74
Table of Contents
NOTE 13. QUARTERLY FINANCIAL DATA (unaudited)
The following table sets forth unaudited selected financial information for the quarters indicated. The quarterly financial information has been derived from unaudited consolidated financial statements, which, in the opinion of management, include all adjustments (consisting of normal recurring adjustments and restatement adjustments which are set forth in the tables following the table below and are described in Note 2 to the Company’s consolidated financial statements) necessary for a fair presentation of such information. The results of any quarter are not necessarily indicative of the results to be expected for any future period. The sum of certain amounts listed below differs from the annual reported total due to rounding.
| Year ended September 30, 2008 - Quarters ended | ||||||||||||||||
| December 31, 2007 | March 31, 2008 | June 30, 2008 | September 30, 2008 | |||||||||||||
| (Restated) | (Restated) | (Restated) | ||||||||||||||
| Revenues |
$ | 18,155,761 | $ | 21,230,753 | $ | 18,711,651 | $ | 18,947,091 | ||||||||
| Operating expenses |
(14,834,568 | ) | (16,178,125 | ) | (14,335,282 | ) | (15,896,540) | |||||||||
| Operating margin |
3,321,193 | 5,052,628 | 4,376,369 | 3,050,551 | ||||||||||||
| General and administrative expenses |
(3,610,543 | ) | (3,605,747 | ) | (3,265,550 | ) | (3,574,768) | |||||||||
| Income (loss) from operations |
(289,350 | ) | 1,446,881 | 1,110,819 | (524,217) | |||||||||||
| Income tax benefit (expense) |
110,607 | (553,085 | ) | (424,622 | ) | 200,386 | ||||||||||
| Net income (loss) after provision for income taxes |
$ | (178,743 | ) | $ | 893,796 | $ | 686,197 | $ | (323,831 | ) | ||||||
| Basic earnings per common share |
$ | (0.02 | ) | $ | 0.09 | $ | 0.07 | $ | (0.03) | |||||||
| Diluted earnings per common share |
(0.02 | ) | 0.09 | 0.07 | (0.03) | |||||||||||
| Year ended September 30, 2007 - Quarters ended | ||||||||||||||||
| December 31, 2006 | March 31, 2007 | June 30, 2007 | September 30, 2007 | |||||||||||||
| (Restated) | (Restated) | (Restated) | (Restated) | |||||||||||||
| Revenues |
$ | 17,065,105 | $ | 19,229,328 | $ | 17,354,297 | $ | 17,996,985 | ||||||||
| Operating expenses |
(13,741,064 | ) | (14,200,359 | ) | (13,924,930 | ) | (14,938,480) | |||||||||
| Operating margin |
3,324,041 | 5,028,969 | 3,429,367 | 3,058,505 | ||||||||||||
| General and administrative expenses |
(2,843,595 | ) | (3,191,524 | ) | (3,329,435 | ) | (3,224,092) | |||||||||
| Income (loss) from operations |
480,446 | 1,837,445 | 99,932 | (165,587) | ||||||||||||
| Income tax benefit (expense) |
(194,163 | ) | (742,567 | ) | (40,386 | ) | 66,921 | |||||||||
| Net income (loss) after provision for income taxes |
$ | 286,283 | $ | 1,094,878 | $ | 59,546 | $ | (98,666) | ||||||||
| Basic earnings per common share |
$ | 0.03 | $ | 0.11 | $ | 0.01 | $ | (0.01) | ||||||||
| Diluted earnings per common share |
0.03 | 0.11 | 0.01 | (0.01) | ||||||||||||
| Year ended September 30, 2006 - Quarters ended | ||||||||||||||||
| December 31, 2005 | March 31, 2006 | June 30, 2006 | September 30, 2006 | |||||||||||||
| (Restated) | (Restated) | (Restated) | (Restated) | |||||||||||||
| Revenues |
$ | 13,894,683 | $ | 16,299,856 | $ | 15,663,930 | $ | 16,429,445 | ||||||||
| Operating expenses |
(11,435,430 | ) | (12,448,563 | ) | (12,458,036 | ) | (12,977,056 | ) | ||||||||
| Operating margin |
2,459,253 | 3,851,293 | 3,205,894 | 3,452,389 | ||||||||||||
| General and administrative expenses |
(2,445,850 | ) | (2,784,193 | ) | (2,866,638 | ) | (2,989,104) | |||||||||
| Income (loss) from operations |
13,403 | 1,067,100 | 339,256 | 463,285 | ||||||||||||
| Income tax benefit (expense) |
(5,490 | ) | (437,099 | ) | (138,964 | ) | (189,767) | |||||||||
| Net income (loss) after provision for income taxes |
$ | 7,913 | $ | 630,001 | $ | 200,292 | $ | 273,518 | ||||||||
| Basic earnings per common share |
$ | - | $ | 0.06 | $ | 0.02 | $ | 0.03 | ||||||||
| Diluted earnings per common share |
- | 0.06 | 0.02 | 0.03 | ||||||||||||
75
Table of Contents
The following tables reflect the effects of the restatement of financial information for the quarters ended December 31, 2007, March 31, 2008 and June 30, 2008.
| (unaudited) | |||||||||||||||||||||||
| Quarter Ended | |||||||||||||||||||||||
| December 31, 2007 | March 31, 2008 | ||||||||||||||||||||||
| As Previously Reported |
Restatement Adjustments |
Restated | As Previously Reported |
Restatement Adjustments |
Restated | ||||||||||||||||||
| Revenues |
$ | 18,259,278 | $ | (103,517 | ) | $ | 18,155,761 | $ | 20,891,823 | $ | 338,930 | $ | 21,230,753 | ||||||||||
| Operating expenses |
(14,510,104 | ) | (324,464 | ) | (14,834,568 | ) | (16,476,509 | ) | 298,384 | (16,178,125) | |||||||||||||
| Operating margin |
3,749,174 | (427,981 | ) | 3,321,193 | 4,415,314 | 637,314 | 5,052,628 | ||||||||||||||||
| General and administrative expenses |
(3,368,476 | ) | (242,067 | ) | (3,610,543 | ) | (3,571,587 | ) | (34,160 | ) | (3,605,747) | ||||||||||||
| Income before income taxes |
380,698 | (670,048 | ) | (289,350 | ) | 843,727 | 603,154 | 1,446,881 | |||||||||||||||
| Income tax benefit (expense) |
(151,000 | ) | 261,607 | 110,607 | (335,853 | ) | (217,232 | ) | (553,085) | ||||||||||||||
| Net income |
$ | 229,698 | $ | (408,441 | ) | $ | (178,743 | ) | $ | 507,874 | $ | 385,922 | $ | 893,796 | |||||||||
| Basic earnings per share |
$ | 0.02 | $ | (0.04 | ) | $ | (0.02 | ) | $ | 0.05 | $ | 0.04 | $ | 0.09 | |||||||||
| Basic weighted average common shares outstanding |
9,914,122 | 9,914,122 | 9,914,122 | 9,914,122 | 9,914,122 | 9,914,122 | |||||||||||||||||
| Diluted earnings per share |
$ | 0.02 | $ | (0.04 | ) | $ | (0.02 | ) | $ | 0.05 | $ | 0.04 | $ | 0.09 | |||||||||
| Diluted weighted average common shares outstanding |
9,914,122 | 9,914,122 | 9,914,122 | 9,914,122 | 9,914,122 | 9,914,122 | |||||||||||||||||
| (unaudited) | |||||||||||
| Quarter Ended June 30, 2008 | |||||||||||
| As Previously Reported |
Restatement Adjustments |
Restated | |||||||||
| Revenues |
$ | 19,301,437 | $ | (589,786 | ) | $ | 18,711,651 | ||||
| Operating expenses |
(15,385,261 | ) | 1,049,979 | (14,335,282) | |||||||
| Operating margin |
3,916,176 | 460,193 | 4,376,369 | ||||||||
| General and administrative expenses |
(3,276,829 | ) | 11,279 | (3,265,550) | |||||||
| Income before income taxes |
639,347 | 471,472 | 1,110,819 | ||||||||
| Income tax expense |
(254,216 | ) | (170,406 | ) | (424,622) | ||||||
| Net income |
$ | 385,131 | $ | 301,066 | $ | 686,197 | |||||
| Basic earnings per share |
$ | 0.04 | $ | 0.03 | $ | 0.07 | |||||
| Basic weighted average common shares outstanding |
9,914,122 | 9,914,122 | 9,914,122 | ||||||||
| Diluted earnings per share |
$ | 0.04 | $ | 0.03 | $ | 0.07 | |||||
| Diluted weighted average common shares outstanding |
9,914,122 | 9,914,122 | 9,914,122 | ||||||||
Restatement adjustments are described in NOTE 2. RESTATEMENT OF PREVIOUSLY ISSUED CONSOLIDATED FINANCIAL STATEMENTS.
76
Table of Contents
The following tables reflect the effects of the restatement of financial information for the quarters ended December 31, 2006, March 31, 2007, June 30, 2007 and September 30, 2007.
| (unaudited) | ||||||||||||||||||||||
| Quarter Ended | ||||||||||||||||||||||
| December 31, 2006 | March 31, 2007 | |||||||||||||||||||||
| As Previously | Restatement | As Previously | Restatement | |||||||||||||||||||
| Reported | Adjustments | Restated | Reported | Adjustments | Restated | |||||||||||||||||
| Revenues |
$ | 17,043,268 | $ | 21,837 | $ | 17,065,105 | $ | 19,371,606 | $ | (142,278 | ) | $ | 19,229,328 | |||||||||
| Operating expenses |
(13,065,273 | ) | (675,791 | ) | (13,741,064) | (14,600,019 | ) | 399,660 | (14,200,359) | |||||||||||||
| Operating margin |
3,977,995 | (653,954 | ) | 3,324,041 | 4,771,587 | 257,382 | 5,028,969 | |||||||||||||||
| General and administrative expenses |
(2,622,482 | ) | (221,113 | ) | (2,843,595) | (3,150,174 | ) | (41,350 | ) | (3,191,524) | ||||||||||||
| Income before income taxes |
1,355,513 | (875,067 | ) | 480,446 | 1,621,413 | 216,032 | 1,837,445 | |||||||||||||||
| Income tax benefit (expense) |
(511,418 | ) | 317,255 | (194,163) | (612,514 | ) | (130,053 | ) | (742,567) | |||||||||||||
| Net income |
$ | 844,095 | $ | (557,812 | ) | $ | 286,283 | $ | 1,008,899 | $ | 85,979 | $ | 1,094,878 | |||||||||
| Basic earnings per share |
$ | 0.09 | $ | (0.06 | ) | $ | 0.03 | $ | 0.10 | $ | 0.01 | $ | 0.11 | |||||||||
| Basic weighted average common shares outstanding |
9,827,167 | 9,827,167 | 9,827,167 | 9,871,167 | 9,871,167 | 9,871,167 | ||||||||||||||||
| Diluted earnings per share |
$ | 0.09 | $ | (0.06 | ) | $ | 0.03 | $ | 0.10 | $ | 0.01 | $ | 0.11 | |||||||||
| Diluted weighted average common shares outstanding |
9,915,122 | 9,915,122 | 9,915,122 | 9,963,992 | 9,963,992 | 9,963,992 | ||||||||||||||||
| (unaudited) | ||||||||||||||||||||||
| Quarter Ended | ||||||||||||||||||||||
| June 30, 2007 | September 30, 2007 | |||||||||||||||||||||
| As Previously | Restatement | As Previously | Restatement | |||||||||||||||||||
| Reported | Adjustments | Restated | Reported | Adjustments | Restated | |||||||||||||||||
| Revenues |
$ | 17,557,264 | $ | (202,967 | ) | $ | 17,354,297 | $ | 17,884,814 | $ | 112,171 | $ | 17,996,985 | |||||||||
| Operating expenses |
(13,664,805 | ) | (260,125 | ) | (13,924,930) | (15,862,219 | ) | 923,739 | (14,938,480) | |||||||||||||
| Operating margin |
3,892,459 | (463,092 | ) | 3,429,367 | 2,022,595 | 1,035,910 | 3,058,505 | |||||||||||||||
| General and administrative expenses |
(3,122,393 | ) | (207,042 | ) | (3,329,435) | (3,377,167 | ) | 153,075 | (3,224,092) | |||||||||||||
| Income before income taxes |
770,066 | (670,134 | ) | 99,932 | (1,354,572 | ) | 1,188,985 | (165,587) | ||||||||||||||
| Income tax benefit (expense) |
(289,972 | ) | 249,586 | (40,386) | 466,500 | (399,579 | ) | 66,921 | ||||||||||||||
| Net income |
$ | 480,094 | $ | (420,548 | ) | $ | 59,546 | $ | (888,072 | ) | $ | 789,406 | $ | (98,666) | ||||||||
| Basic earnings per share |
$ | 0.05 | $ | (0.04 | ) | $ | 0.01 | $ | (0.09 | ) | $ | 0.08 | $ | (0.01) | ||||||||
| Basic weighted average common shares outstanding |
9,914,122 | 9,914,122 | 9,914,122 | 9,914,122 | 9,914,122 | 9,914,122 | ||||||||||||||||
| Diluted earnings per share |
$ | 0.05 | $ | (0.04 | ) | $ | 0.01 | $ | (0.09 | ) | $ | 0.08 | $ | (0.01) | ||||||||
| Diluted weighted average common shares outstanding |
9,914,122 | 9,914,122 | 9,914,122 | 9,914,122 | 9,914,122 | 9,914,122 | ||||||||||||||||
Restatement adjustments are described in NOTE 2. RESTATEMENT OF PREVIOUSLY ISSUED CONSOLIDATED FINANCIAL STATEMENTS.
77
Table of Contents
The following tables reflect the effects of the restatement of financial information for the quarters ended December 31, 2005, March 31, 2006, June 30, 2006 and September 30, 2006.
| (unaudited) | ||||||||||||||||||||||
| Quarter Ended | ||||||||||||||||||||||
| December 31, 2005 | March 31, 2006 | |||||||||||||||||||||
| As Previously Reported |
Restatement Adjustments |
Restated | As Previously Reported |
Restatement Adjustments |
Restated | |||||||||||||||||
| Revenues |
$ | 14,631,891 | $ | (737,208 | ) | $ | 13,894,683 | $ | 16,971,379 | $ | (671,523 | ) | $ | 16,299,856 | ||||||||
| Operating expenses |
(11,187,705 | ) | (247,725 | ) | (11,435,430) | (12,713,374 | ) | 264,811 | (12,448,563) | |||||||||||||
| Operating margin |
3,444,186 | (984,933 | ) | 2,459,253 | 4,258,005 | (406,712 | ) | 3,851,293 | ||||||||||||||
| General and administrative expenses |
(2,236,409 | ) | (209,441 | ) | (2,445,850) | (2,578,246 | ) | (205,947 | ) | (2,784,193) | ||||||||||||
| Income before income taxes |
1,207,777 | (1,194,374 | ) | 13,403 | 1,679,759 | (612,659 | ) | 1,067,100 | ||||||||||||||
| Income tax benefit (expense) |
(409,000 | ) | 403,510 | (5,490) | (672,742 | ) | 235,643 | (437,099) | ||||||||||||||
| Net income |
$ | 798,777 | $ | (790,864 | ) | $ | 7,913 | $ | 1,007,017 | $ | (377,016 | ) | $ | 630,001 | ||||||||
| Basic earnings per share |
$ | 0.08 | $ | (0.08 | ) | $ | 0.00 | $ | 0.10 | $ | (0.04 | ) | $ | 0.06 | ||||||||
| Basic weighted average common shares outstanding |
9,740,472 | 9,740,472 | 9,740,472 | 9,740,472 | 9,740,472 | 9,740,472 | ||||||||||||||||
| Diluted earnings per share |
$ | 0.08 | $ | (0.08 | ) | $ | 0.00 | $ | 0.10 | $ | (0.04 | ) | $ | 0.06 | ||||||||
| Diluted weighted average common shares outstanding |
9,928,122 | 9,928,122 | 9,928,122 | 9,928,122 | 9,928,122 | 9,928,122 | ||||||||||||||||
| (unaudited) | ||||||||||||||||||||||
| Quarter Ended | ||||||||||||||||||||||
| June 30, 2006 | September 30, 2006 | |||||||||||||||||||||
| As Previously Reported |
Restatement Adjustments |
Restated | As Previously Reported |
Restatement Adjustments |
Restated | |||||||||||||||||
| Revenues |
$ | 15,636,858 | $ | 27,072 | $ | 15,663,930 | $ | 16,431,921 | $ | (2,456 | ) | $ | 16,429,465 | |||||||||
| Operating expenses |
(11,971,354 | ) | (486,682 | ) | (12,458,036) | (13,170,367 | ) | 193,311 | (12,977,056) | |||||||||||||
| Operating margin |
3,665,504 | (459,610 | ) | 3,205,894 | 3,261,554 | 190,855 | 3,452,409 | |||||||||||||||
| General and administrative expenses |
(2,470,934 | ) | (395,704 | ) | (2,866,638) | (2,829,153 | ) | (159,951 | ) | (2,989,104) | ||||||||||||
| Income before income taxes |
1,194,570 | (855,314 | ) | 339,256 | 432,401 | 30,904 | 463,305 | |||||||||||||||
| Income tax benefit (expense) |
(448,920 | ) | 309,956 | (138,964) | (273,475 | ) | 83,708 | (189,767) | ||||||||||||||
| Net income |
$ | 745,650 | $ | (545,358 | ) | $ | 200,292 | $ | 158,926 | $ | 114,612 | $ | 273,538 | |||||||||
| Basic earnings per share |
$ | 0.08 | $ | (0.06 | ) | $ | 0.02 | $ | 0.02 | $ | 0.01 | $ | 0.03 | |||||||||
| Basic weighted average common shares outstanding |
9,826,297 | 9,826,297 | 9,826,297 | 9,826,297 | 9,826,297 | 9,826,297 | ||||||||||||||||
| Diluted earnings per share |
$ | 0.08 | $ | (0.05 | ) | $ | 0.02 | $ | 0.02 | $ | 0.01 | $ | 0.03 | |||||||||
| Diluted weighted average common shares outstanding |
9,928,122 | 9,928,122 | 9,928,122 | 9,928,122 | 9,928,122 | 9,928,122 | ||||||||||||||||
Restatement adjustments are described in NOTE 2. RESTATEMENT OF PREVIOUSLY ISSUED CONSOLIDATED FINANCIAL STATEMENTS.
78
Table of Contents
ITEM 9. CHANGES IN AND DISAGREEMENTS WITH ACCOUNTANTS ON ACCOUNTING AND FINANCIAL DISCLOSURE
On February 6, 2009, we filed a Form 8-K which reported that on February 2, 2009, our Audit Committee of the Board of Directors (the “Audit Committee”) had dismissed Scott McElveen, LLP (“Scott McElveen”) as our independent registered accounting firm.
The audit reports of Scott McElveen on our Consolidated Financial Statements as of and for the years ended September 30, 2005 through 2007 did not contain an adverse opinion or a disclaimer of opinion, and were not qualified or modified as to uncertainty, audit scope or accounting principles. Except as described below, during the fiscal years ended September 30, 2005 through 2007 and subsequent interim periods through February 2, 2009 there were (1) no disagreements with Scott McElveen on any matter of accounting principles or practices, financial statement disclosure, or auditing scope or procedure, which disagreements, if not resolved to the satisfaction of Scott McElveen, would have caused it to make reference to the subject matter of the disagreement in connection with its reports and (2) no “reportable events” as defined in Item 304(a)(1)(v) of Regulation S-K.
In connection with discussions between Scott McElveen, our management and representatives of the Audit Committee regarding the preliminary findings and conclusions of the Audit Committee’s investigation team, Scott McElveen advised that it would likely need to significantly expand the scope of its audit to confirm whether it agreed with the preliminary findings and conclusions that such accounting irregularities had been limited to internal controls and transactions involving the safeguarding of assets, improper recording of certain fixed asset accounts and improper expense reimbursements. Although the Company, in consultation with representatives of the Audit Committee and its investigation team, expressed a difference of opinion with Scott McElveen regarding the necessity of some of the additional testing and procedures Scott McElveen had proposed to perform as part of the expanded scope of its audit, this difference of opinion was not a decisive factor, in the view of the Audit Committee, in its determination to dismiss Scott McElveen. Instead, the Audit Committee concluded, after consideration of numerous factors, that it was in the best interest of UCI Medical Affiliates, Inc. and its stockholders to engage a new independent registered public accounting firm.
On March 13, 2009 we engaged Elliott Davis as our independent registered public accounting firm. Under the terms of their engagement, Elliott Davis audited our 2008 consolidated financial statements and re-audited our 2007 and 2006 consolidated financial statements.
During the two most recent fiscal years through the date we engaged Elliott Davis, we have not consulted with Elliott Davis regarding either: (1) the application of accounting principles to any specific transaction, either completed or proposed, or the type of audit opinion that might be rendered on the Company’s financial statements, and neither a written report was provided to the Company nor oral advice was provided that Elliott Davis concluded was an important factor considered by the Company in reaching a decision as to the accounting, auditing or financial reporting issue; or, (2) any matter that was either subject of disagreement (as defined in Item 304(a)(1)(iv) of Regulation S-K and the related instructions to this item) or a reportable event (as described in Item 304(a)(1)(v) of Regulation S-K).
| ITEM 9A. | CONTROLS AND PROCEDURES |
Evaluation of Disclosure Controls and Procedures
We maintain “disclosure controls and procedures,” as defined in Rules 13a-15(e) and 15d-15(e) under the Securities Exchange Act of 1934, as amended (the “Exchange Act”), that are designed to ensure that information required to be disclosed by us in reports we file or submit under the Exchange Act is recorded, processed, summarized and reported within the time periods specified in the SEC’s rules and forms, and that such information is accumulated and communicated to our management, including our principal executive officer and principal financial officer, as appropriate, to allow timely decisions regarding required disclosure. In designing and evaluating our disclosure controls and procedures, our management recognized that disclosure controls and procedures, no matter how well conceived and operated, can provide only reasonable assurance of achieving the desired control objectives, and we necessarily are required to apply our judgment in evaluating the cost-benefit relationship of possible disclosure controls and procedures.
79
Table of Contents
Our management, including our principal executive officer and principal financial officer, evaluated the effectiveness of the design and operation of our disclosure controls and procedures as of September 30, 2008 and concluded that the disclosure controls and procedures were not effective because certain deficiencies involving our internal controls constituted material weaknesses, as discussed below. The material weaknesses identified resulted in the restatement of the previously reported financial statements and other related financial disclosures included in this Form 10-K.
Notwithstanding our conclusion concerning the ineffectiveness of our disclosure controls and procedures and the material weaknesses we have identified in our internal control over financial reporting, as discussed below, we believe that the consolidated financial statements in this Form 10-K fairly present, in all material respects, our financial position and results of operations and cash flows as of the dates and for the periods presented, in conformity with accounting principles generally accepted in the United States of America. Such belief is based on a number of factors, including the completion of our Audit Committee’s Investigation, our internal review that identified revisions to our previously issued financial statements, our efforts to remediate the material weaknesses in internal control over financial reporting, as described below, and the performance of additional procedures by our management designed to ensure the reliability of our financial reporting.
Management’s Report on Internal Control over Financial Reporting
Our management is responsible for establishing and maintaining adequate internal control over financial reporting, as such term is defined in Rules 13a-15(f) and 15d-15(f) of the Exchange Act. Our system of internal control over financial reporting was designed to provide reasonable assurance regarding the reliability of financial reporting and the preparation of financial statements for external purposes, in conformity with accounting principles generally accepted in the United States of America. Because of inherent limitations, a system of internal control over financial reporting may not prevent or detect misstatements. Also, projections of any evaluation of effectiveness to future periods are subject to the risk that controls may become inadequate due to a change in conditions, or that the degree of compliance with the policies or procedures may deteriorate.
Our management, including our principal executive officer and principal financial officer, conducted an evaluation of the effectiveness of our internal control over financial reporting using the criteria set forth by the Committee of Sponsoring Organizations of the Treadway Commission (COSO) in Internal Control—Integrated Framework. Based on the evaluation, our management concluded that our internal control over financial reporting was ineffective as of September 30, 2008, due to several material weaknesses in our internal control over financial reporting. A material weakness is a deficiency, or a combination of control deficiencies, in internal control over financial reporting such that there is a reasonable possibility that a material misstatement of the our annual or interim financial statements will not be prevented or detected on a timely basis. We have identified the following material weaknesses in our internal control over financial reporting as of September 30, 2008:
Control Environment
We did not maintain an effective control environment. The control environment, which is the responsibility of senior management, sets the tone of the organization, influences the control consciousness of its people, and is the foundation for all other components of internal control over financial reporting. Each of the material weaknesses in our control environment, as set forth below, contributed to the material weaknesses discussed below under the captions “Risk Assessment,” “Control Activities” and “Monitoring Activities.”
| • | Failure to Comply with Established Standards of Integrity and Ethical Values – Our former Chief Financial Officer, Jerry F. Wells, Jr., (our “former CFO” or Mr. Wells) failed to comply with our established standards of integrity and ethical values. The principles and standards of conduct for our senior financial officers are set forth in our “Senior Financial Officer Code of Ethics,” which Mr. Wells signed. As set forth in COSO, integrity and ethical values are essential elements of the control environment and affect the design and administration of internal controls, as well as other internal control components. Mr. Wells’ fraudulent activities, as evidenced by his theft of $2,967,382 and his knowingly signing false certifications required by the Sarbanes Oxley Act of 2002, demonstrate that he blatantly disregarded our policies concerning our standards of conduct. As our principal financial officer, Mr. Wells exercised significant influence over all aspects and components of our internal control over financial reporting; accordingly, we believe that Mr. Wells’ failure to comply with our established standards of conduct, as evidenced by his disregard of basic principles related to integrity and ethics, as well as his lack of commitment to competence, as discussed below, formed the basis of all the material internal control weaknesses addressed in this report. |
80
Table of Contents
| • | Lack of Commitment to Competence – We believe that our former CFO was not committed to competence and he failed to supervise properly the application of our accounting policies. As a result, certain established accounting policies were not applied correctly and resulted in inaccuracies that led to the restatement of our previously issued financial information as described in this Form 10-K. |
Risk Assessment
| • | Failure to Specify Financial Reporting Objectives and Risks – We failed to adequately specify our financial reporting objectives related to revenue recognition and contractual adjustments, recognition of capital lease assets and liabilities, recognition of bad debt expense and the recognition of other assets and liabilities. Accordingly, we were unable to adequately identify the risks associated with the proper valuation and presentation of certain accounts and account classifications in our financial statements. As a result, control activities were not designed and implemented in a manner that permitted us to manage the risks of not achieving reliable financial reporting. See also comments under the above caption, “Lack of Commitment to Competence.” |
| • | Failure to Perform a Comprehensive Fraud Risk Assessment – We failed to adequately assess the potential for misstatement of our financial statements due to fraud. See also comments under the above caption, “Failure to Comply with Established Standards of Integrity and Ethical Values.” |
Control Activities
| • | Failure to Develop Appropriate Control Activities – We did not develop adequate control activities to mitigate and control the risks associated with properly valuing and presenting certain accounts and account classifications in our financial statements. As a result, our financial statements required restatement in part due to inadequate controls over the timing of the recognition of contractual adjustments which affects the recognition of our revenues, the failure to properly analyze leases for proper classification, the failure to consider relevant information regarding the recognition of bad debt expense and the failure to adequately evaluate the characteristics of other assets and liabilities for proper classification and recording in our financial statements. See also comments under the above caption, “Failure to Specify Financial Reporting Objectives and Risks.” |
| • | Failure to Adequately Communicate Policies and Procedures – Mr. Wells’ embezzlement was facilitated by his ability to circumvent certain controls involving our policies which required that cash disbursements and other transactions be supported by adequate documentation. Our investigation of Mr. Wells’ embezzlement indicated he used his position to induce certain employees to believe that his authority extended beyond the limits of his actual authority. This lack of understanding by certain employees of the limitations on Mr. Wells’ authority enabled Mr. Wells to circumvent these controls. See also comments under the above caption, “Failure to Comply with Established Standards of Integrity and Ethical Values.” |
Monitoring Activities
| • | Failure to Adequately Monitor the Functioning of Internal Control Components – We placed reliance on Mr. Wells, during his tenure as our principal financial officer, to design and implement a self-assessment plan to monitor our internal control over financial reporting. Consistent with his failure to comply with our established standards of integrity and ethical values (see comments under the above caption, “Failure to Comply with Established Standards of Integrity and Ethical Values”), Mr. Wells failed to design and implement an adequate and comprehensive self-assessment plan and program and falsely reported the status of our internal controls, including our monitoring program, to our Audit Committee. As a result, we failed to detect Mr. Wells’ embezzlement and failed to identify other deficiencies in our internal control over financial reporting that contributed in part to the restatement of our financial information as described in this Form 10-K. |
81
Table of Contents
Remedial Measures
We have devoted substantial resources to improving our internal control over financial reporting in order to remediate the material weaknesses disclosed herein. We also are committed to achieving and maintaining a strong control environment, as well as an setting an overall tone within our Company that encourages and empowers our employees to act in accordance with the highest standards of honest and ethical conduct. Moreover, we believe that any system of internal control requires active and continual management and we expect to further improve our internal control over financial reporting in the future. The following are measures we have taken to improve our internal control over financial reporting:
Control Environment
| • | Upon discovering the embezzlement by our former CFO, our Board of Directors immediately terminated his employment. |
| • | Our executive management has met with each member (individually and as a group) of our accounting and finance staff (“Financial Staff”) and emphasized our commitment to the highest levels of ethics and integrity. Additionally, we have developed a formal “Code of Ethics for Financial Staff” which is consistent with our “Senior Financial Officer Code of Ethics” and which supports our executive management’s emphasis of promoting the highest levels of ethics and integrity. The Code of Ethics for Financial Staff, among other things, specifies that our Financial Staff are expected to: |
| o | Act with honesty and integrity. |
| o | Avoid conflicts of interest. |
| o | Comply with laws, rules and applicable regulations. |
| o | Act with due care, competence and diligence and not allow independent judgment to be subordinated. |
| o | Share knowledge and maintain skills necessary and relevant to our needs. |
| o | Proactively promote ethical and honest behavior. |
| o | Assure responsible use and control of our assets and resources. |
| o | Report violations of the Code of Ethics for Financial Staff to executive management, or if such violation involves executive management, to the Chairman of our Audit Committee. |
Risk Assessment and Control Activities
| • | In conjunction with our Audit Committee’s investigation of the fraudulent activities of Mr. Wells, our Audit Committee also directed our new Chief Financial Officer (“New CFO”) to review the Company’s critical accounting policies (“Accounting Policy Review”) and to determine the proper application of those policies. In accordance with the Accounting Policy Review we found that there were additional material weaknesses in our internal control over financial reporting and, as described above, such weaknesses, in part, caused the restatement of our previously issued financial statements as described in this Form 10-K. |
As part of the Accounting Policy Review we identified the key risks to the achievement of our financial reporting objectives and have implemented certain additional control activities, the most significant of which are as follows:
| o | Corporate credit cards are no longer issued to executive officers. For other corporate credit card users all statements are received at the corporate office, opened and reviewed by our accounts payable staff. Supporting documentation is then obtained and reviewed by our accounts payable department for sufficiency. All documentation is then reviewed by our Treasurer and approved. After approval by our Treasurer, the documentation is forwarded to the Assistant Controller for further approval before a check is prepared for payment. |
82
Table of Contents
| o | Control activities related to other employee expense reimbursement requests and invoice processing have also been expanded to include at least two levels of review before we disburse funds for payment. |
| o | All check requests and invoices submitted by executive management now require two approval signatures. Invoices approved by our CEO are also approved by our New CFO. Invoices approved by our New CFO are also approved by our CEO or Controller, depending on the nature of the item (i.e. routine invoices are approved by our New CFO and then the Controller). |
| o | Our New CFO is now directly and integrally involved in our closing processes and we have improved our analysis and investigation of variances in our revenues and expenses and the formulation of our estimates. |
| o | All leases which we enter are evaluated and tested on a timely basis for proper classification. |
| o | Contractual adjustments are evaluated on a timely basis and we have developed procedures and processes to refine our estimates of the timing of the adjustments related to the recognition of revenues and valuation of accounts receivable. |
| o | Other control activities have been implemented that generally involve: the timely analysis of the adequacy of our allowance for doubtful accounts; additional management review of expense accruals and other asset and liability accounts for proper classification and valuation; and, enhanced reconciliation procedures of certain accounts, including accounts affected by our recognition of income tax expense. |
Monitoring Activities
| o | We have hired an additional resource, a certified public accountant, who will perform financial and operational audits, including the testing of our internal control over financial reporting. |
| o | Our New CFO is integrally involved in and closely monitors our financial and accounting operations, including the preparation of our financial statements. Our New CFO also closely supervises the identification and resolution of accounting matters and issues and timely reviews our cash operations, including our disbursements. |
Management’s report on our internal control over financial reporting was not subject to, and this Form 10-K does not include, an attestation report of our independent registered public accounting firm regarding our internal control over financial reporting pursuant to temporary rules of the SEC that permit us to provide only Management’s report in this Form 10-K.
Changes in Internal Control over Financial Reporting
Although there were no changes in our internal control over financial reporting that occurred during the quarter ended September 30, 2008, as discussed above, we detected material weaknesses in our internal control over financial reporting subsequent to that date that materially affected our internal control over financial reporting during the quarter and year ended September 30, 2008 and in previous periods, as well as in periods subsequent to September 30, 2008 prior to the detection of these material weaknesses and implementation of related remedial measures.
None.
83
Table of Contents
PART III
ITEM 10. DIRECTORS, EXECUTIVE OFFICERS AND CORPORATE GOVERNANCE
Board of Directors
The following table identifies the names, ages, Board term expirations, and committee memberships of our current Board members:
| Name |
Age | Term Expiring In |
Audit Committee |
Compensation Committee |
Nominating Committee | |||||
| Harold H. Adams, Jr. |
62 | 2009 | * | ** | ||||||
| Joseph A. Boyle, CPA |
55 | 2011 | ||||||||
| Ann T. Burnett |
56 | 2010 | ||||||||
| Jean E. Duke, CPA |
54 | 2010 | ** | * | ||||||
| Thomas G. Faulds |
68 | 2011 | * | * | ||||||
| John M. Little, Jr., M.D. |
59 | 2011 | * | |||||||
| Charles M. Potok |
60 | 2009 | ** | |||||||
| Timothy L. Vaughn, CPA |
45 | 2010 | * | |||||||
| * | Member |
** Chairman
Harold H. Adams, Jr. has served as one of our directors since June 1994 and since November 2006, has served as the Area President, Adams & Associates International – Arthur J. Gallagher Risk Management Services (A&AI – AJG). Prior to this, he was Chairman and owner of Adams & Associates International (A&AI) and Southern Insurance Managers (SIM) since June 1992. Additionally, Mr. Adams is Chairman and part owner of Custom Assurance Placements, Ltd., since its inception in February 2005. He served as President of Adams Eaddy and Associates, an independent insurance agency, from 1980 to 1992. In November 2006, Mr. Adams’ firms, A&AI and SIM, merged with Arthur J. Gallagher Risk Management Services, Inc. He remains on as Area President of this division. Mr. Adams has been awarded the Chartered Property Casualty Underwriter designation and is currently a member of the President’s Board of Visitors of Charleston Southern University in Charleston, South Carolina. He has received numerous professional awards as the result of over 39 years of involvement in the insurance industry and is a member of many professional and civic organizations. Mr. Adams was most recently reelected as a director at the annual meeting of stockholders in 2006.
Joseph A. Boyle, CPA has served as our Executive Vice President and Chief Financial Officer since December 17, 2008. He has served as the President and Chief Executive Officer of Affinity Technology Group, Inc. since January 2000 and as its Chairman since March 2001. Mr. Boyle served as Affinity’s Senior Vice President and Chief Financial Officer from September 1996 until January 2000 and as Chairman and Chief Executive Officer of Surety Mortgage, Inc., a wholly owned subsidiary of Affinity, from December 1997 until December 2001. In August 2008, Affinity filed a voluntary petition in the United States Bankruptcy Court for the District of South Carolina under the provisions of Chapter 11 of the United States Bankruptcy Code. Mr. Boyle is a certified public accountant and from January 2005 until June 2006 served as Chief Operating Officer of Community Resource Mortgage, Inc., a wholly owned subsidiary of Community Bancshares, Inc. From April 2003 to August 2004, Mr. Boyle was a partner in the accounting firm of Elliott Davis, LLC. From June 1982 until August 1996, Mr. Boyle was employed by Price Waterhouse, LLP and from 1993 until 1996 was a partner in its Kansas City, Missouri office where he specialized in the financial services industry. Mr. Boyle was most recently reelected as a director at the annual meeting of stockholders in 2008.
84
Table of Contents
Ann T. Burnett currently serves as Vice President of the Health Network Services division of BlueChoice HealthPlan of South Carolina, Inc. (“BlueChoice”), a Subsidiary of Blue Cross and Blue Shield of South Carolina. Ms. Burnett has been employed by BlueChoice since 1986. Ms. Burnett was appointed to our Board of Directors on April 20, 2007.
Jean E. Duke, CPA has been a financial consultant since February 2008. From October 2006 until February 2008 she served as the Chief Financial Officer of SRC, an Aetna Company. From December 2004 until October 2006, she owned a consulting business providing services primarily for insurance and financial organizations. Prior to that, Ms. Duke was affiliated with Colonial Life & Accident Insurance Company, serving in the roles of Senior Vice President, Customer & Information Services, and President & Chief Financial Officer, from August 2002 to December 2004. Ms. Duke is a certified public accountant. A graduate of Leadership Columbia, she was named the Financial Executive of the Year by the Columbia chapter of the Institute of Management Accountants, the Distinguished Young Alumni by the Moore School of Business, and was honored with the Tribute to Women and Industry award by the Young Women’s Christian Association. Ms. Duke has held leadership and board positions with many professional and business organizations as well as continuing to be active in numerous community organizations. Ms. Duke was elected as a director at the annual meeting of stockholders in 2007.
Thomas G. Faulds served as President and Chief Operating Officer of the Blue Cross Blue Shield Division of Blue Cross and Blue Shield of South Carolina (“BCBS”) from 1998 until his retirement on May 1, 2007, and also served as the senior officer responsible for six subsidiaries: BlueChoice HealthPlan, Planned Administrators, Inc., Companion Benefits Alternatives, Inc., Alpine Agency, Inc., Thomas H. Cooper & Company and CIMR. He was employed by BCBS since March, 1972. Mr. Faulds previously served as one of our directors between August 1996 and June 2003. On December 13, 2005, the Board of Directors appointed Mr. Faulds to our Board of Directors to fill a vacancy on the board. Mr. Faulds was most recently reelected as a director at the annual meeting of stockholders in 2008.
John M. Little, Jr., M.D., MBA has served as one of our directors since August 1998 and is currently the Vice President for HealthCare Services and Chief Medical Officer for Blue Cross Blue Shield of South Carolina. Dr. Little also served in the same position at BlueChoice HealthPlan (formerly known as Companion HealthCare Corporation) from 1994 to 2000. Prior to joining BlueChoice HealthPlan in 1994, Dr. Little served as Assistant Chairman for Academic Affairs, Department of Family Practice, Carolinas Medical Center, Charlotte, North Carolina from 1992 to 1994. Dr. Little was most recently reelected as a director at the annual meeting of stockholders in 2008.
Charles M. Potok has served as our Chairman of the Board since February 2003, and has served as one of our directors since September 1995. He has served as Executive Vice President and Chief Operating Officer of Companion Property and Casualty Company, a wholly-owned subsidiary of Blue Cross Blue Shield of South Carolina, since March 1984 and, as President of The Companion Property Casualty Group since April 2002. Mr. Potok is an Associate of the Casualty Actuarial Society and a member of the American Academy of Actuaries. Mr. Potok serves on many business and civic boards and is past President of the Indian Waters Council of the Boy Scouts of America. Mr. Potok was most recently reelected as a director at the annual meeting of stockholders in 2006.
Timothy L. Vaughn, CPA has served as Chief Financial Officer of BlueChoice HealthPlan (formerly known as Companion HealthCare Corporation) since January 2000, and Vice President of Underwriting of BlueChoice HealthPlan since October 2005. He served as TRICARE Contracts Manager for Blue Cross Blue Shield of South Carolina from 1997 to 2000. This federal program provided healthcare benefits administration for military dependents and retirees across the nation. Mr. Vaughn is a certified public accountant and has been named a Fellow in both the Academy of Healthcare Management and Life Management Institute and is currently serving as Corporate Secretary and Treasurer of EAP Alliance, Inc. in Columbia, South Carolina. He is a member of numerous professional and civic organizations. Mr. Vaughn was most recently elected as a director at the annual meeting of stockholders in 2007.
85
Table of Contents
Executive Officers and Code of Ethics
Executive Officers
The following individuals constitute our current executive officers:
| Name |
Age |
Offices Held |
||||||
| D. Michael Stout, M.D. |
64 | President and Chief Executive Officer |
||||||
| Joseph A. Boyle, CPA |
55 | Executive Vice President and Chief Financial Officer |
||||||
D. Michael Stout, M.D. has served as Executive Vice President of Medical Affairs of UCI and Doctors Care, P.A. (“DC-SC”) since 1985 and as President and Chief Executive Officer of UCI, UCI-SC, DC-SC and Doctors Care of Tennessee, P.C. since November 1, 2002, and of COSM since April 5, 2005. He is Board Eligible in Emergency Medicine and is a member of the American College of Emergency Physicians, the Columbia Medical Society, and the American College of Physician Executives. He graduated from Brown University Medical School in 1980 and practiced medicine for Doctors Care since 1983. Dr. Stout is the Treasurer of the Board of Directors of the South Carolina Campaign to Prevent Teen Pregnancy and serves on the Board of Directors for the local chapter of Habitat for Humanity.
Joseph A. Boyle, CPA has served as our Executive Vice President and Chief Financial Officer since March 16, 2009. From December 17, 2008 until March 16, 2009, Mr. Boyle served as our Interim Chief Financial Officer. Mr. Boyle also serves as a member of our Board of Directors and further information concerning his background and business experience is discussed above in this ITEM 10 under the caption, “ DIRECTORS, EXECUTIVE OFFICERS AND CORPORATE GOVERNANCE – Board of Directors.”
See “PART I – ITEM 1. – BUSINESS – Recent Developments – Audit Committee Investigation of Former Chief Financial Officer” for information regarding the results of the Investigation and the related federal court criminal charges against Jerry F. Wells, Jr., our former Executive Vice-President of Finance, Chief Financial Officer, and Secretary.
Code of Ethics
We adopted a Code of Ethics that applies to our principal executive officer, principal financial officer, principal accounting officer or controller, or persons performing similar functions. We have filed a copy of this Code as Exhibit 14 to this Form 10-K by incorporating by reference to such Code as filed with the Securities and Exchange Commission on December 5, 2003 as Exhibit 14 to our Annual Report on Form 10-K for the year ended September 30, 2003.
Corporate Governance
The Board has standing Audit, Compensation and Nominating Committees.
Audit Committee. The Audit Committee operates under a written Charter. The Board has determined that all of the members of the Audit Committee as of September 30, 2008 met the independence criteria prescribed by the Securities and Exchange Commission and the Nasdaq Stock Market for service on the Audit Committee and that the current members of the Audit Committee continue to meet such independence criteria. The Board of Directors has determined that as of September 30, 2008, Mr. Boyle and Ms. Duke were financial experts, as that term is defined in Item 401(h)(2) of Regulation S-K under the Exchange Act. Mr. Boyle resigned from the Audit Committee on December 17, 2008 to become our Interim Chief Financial Officer and was replaced by Mr. Faulds. The Audit Committee met 4 times during the fiscal year ended September 30, 2008.
Compensation Committee. The Compensation Committee establishes and oversees the design and functionality of the Company’s executive compensation program. The Board has determined that all of the members of the Compensation Committee are not independent within the meaning of the Nasdaq Stock Market regulations because members of the Compensation Committee are associated with BCBS. The Compensation Committee does not operate under a written Charter. The Compensation Committee met 2 times during the fiscal year ended September 30, 2008.
86
Table of Contents
Nominating Committee. The Nominating Committee makes recommendations to the Board with respect to the size and composition of the Board, reviews the qualifications of potential candidates for election as director, and recommends director nominees to the Board. The Board has determined that all of the members of the Nominating Committee are independent within the meaning of the Nasdaq Stock Market regulations. The Nominating Committee operates under a written Charter. The Nominating Committee did not meet during the fiscal year ended September 30, 2008.
The Nominating Committee considers candidates for Board membership suggested by its members and other Board members, as well as management and stockholders. As set forth in our Bylaws, any stockholder entitled to vote for the election of Directors at an annual meeting of stockholders may nominate persons for election as Directors only if written notice of such stockholder’s intent to make such nomination is given, by certified mail, postage prepaid, to the Secretary of the Corporation and received at the principal offices of the Corporation at the address not less than sixty days nor more than ninety days prior to the anniversary date of the immediately preceding annual meeting of stockholders. However, if the annual meeting is not held within thirty days before or after the anniversary date of the immediately preceding annual meeting of stockholders, then for the notice by the stockholder to be timely, it must be received by our Secretary of our principal offices not later than the close of business on the tenth day following the date on which the notice of the annual meeting was actually mailed. As set forth in our Bylaws, any stockholder entitled to vote for the election of Directors may nominate persons for election of Directors to be held at a special meeting of stockholders only if written notice of such stockholder’s intent to make such nomination is given, by certified mail, postage prepaid, to the Secretary of the Corporation and received at the principal offices of the Corporation not less than ten days following the date on which notice of such special meeting of stockholders is first given to the stockholders.
Each such notice shall set forth: (a) the name and address of the stockholder who intends to make the nomination, as they appear on our books, (b) the class and number of shares beneficially owned by such stockholder, (c) a representation that such stockholder is a holder of record of our stock entitled to vote at such meeting and intends to appear in person or by proxy at the meeting to nominate the person or persons specified in the notice, (d) a description of all arrangements or understandings between such stockholder and each nominee and any other person or persons (naming such person or persons) pursuant to which the nomination or nominations are to be made by such stockholder, (e) with respect to each nominee, (i) the nominee’s name and age, (ii) the nominee’s occupation and business address and telephone number, (iii) the nominee’s residence address and telephone number, (iv) the number of shares of each class of our stock held directly or beneficially by the nominee, and (v) any other information relating to such person that is required to be disclosed in solicitations of proxies for election of Directors, or is otherwise required, in each case pursuant to Regulation 14A under the Securities Exchange Act of 1934, as amended, and (f) the consent of each nominee to serve as a Director of the Corporation if elected. At the request of the Board of Directors, any person nominated by the Board of Directors for election as a Director shall furnish to our Secretary that information required to be set forth in a stockholder’s notice of nomination which pertains to the nominee. No person shall be eligible for election as a Director of the Company unless nominated in accordance with the procedures set forth in our Bylaws.
Once the Nominating Committee has identified a prospective nominee, the Nominating Committee makes an initial determination as to whether to conduct a full evaluation of the candidate. The Committee bases this initial determination on whatever information is provided to the Committee with the recommendation of the prospective candidate, as well as the Committee’s own knowledge of the prospective candidate, which may be supplemented by inquiries to the person making the recommendation or others. The Committee also bases this initial determination primarily on the need for additional Board members to fill vacancies and the likelihood that the prospective nominee can satisfy the evaluation factors described below.
If the Committee determines, in consultation with the Chairman of the Board and other Board members as appropriate, that additional consideration is warranted, it may gather additional information about the prospective nominee’s background and experience. The Committee then evaluates the prospective nominee against the standards and qualifications set out in its Charter, including without limitation independence, strength of character, business or financial expertise, current or recent experience as an officer or leader of another business, experience as a director of another public company, regulatory compliance knowledge, industry trend knowledge, product/service expertise, practical wisdom, mature judgment, time availability (including the number of other boards he or she sits on in the context of the needs of the board and the company and including time to develop and/or maintain sufficient knowledge of the company and its industry), geography, age, and gender and ethnic diversity on the Board.
87
Table of Contents
In connection with this evaluation, the Committee determines whether to interview the prospective nominee, and if warranted, one or more members of the Committee, and others as appropriate, interview prospective nominees in person or by telephone. After completing this evaluation and interview, if warranted, the Committee makes a recommendation to the Board as to the persons who should be nominated by the Board. The Board determines the nominees after considering the recommendation and report of the Committee.
The chairman of the meeting of stockholders shall, if the facts warrant, determine and declare to the meeting that a nomination was not made in accordance with the procedures prescribed by the Bylaws, and should he or she so determine, he or she shall so declare to the meeting and the defective nomination shall be disregarded.
Section 16(a) Beneficial Ownership Reporting Compliance
Based upon a review of filings with the Securities and Exchange Commission and written representations that no other reports were required, we believe that all of our directors and officers complied during our fiscal year ended September 30, 2008 with the filing requirements under Section 16(a) of the 1934 Act.
ITEM 11. EXECUTIVE COMPENSATION
Compensation Discussion and Analysis
General Overview of Executive Compensation
The Board of Directors is charged with the responsibility of administering our executive officer compensation program and determining the appropriate levels of executive compensation based on recommendations it receives from the Compensation Committee (the “Committee”). Our executive officers have not entered into employment agreements or change in control agreements with the Company. Over the last few years, the Board has followed an informal policy of providing our executive officers with a total compensation package that consists of a base salary, cash bonus, deferred compensation, and various other insurance and retirement benefits. During the fiscal year ended September 30, 2008, the Board also made use of stock-based equity awards in addition to each officer’s salary, bonus, and other benefits as part of their total compensation package.
In developing its compensation recommendations for the Board, the Committee considers the overall goals of the Company’s executive compensation program. The first primary goal of our compensation program is to reward our executive officers appropriately on a performance basis. To that extent, our compensation program is designed to reward our officers both for their personal performance and also for the performance of the Company with respect to growth in assets and earnings, expansion and increases in stockholder value. Another primary goal of our program is to attract and retain competent management personnel. To that end, the Committee’s objective in setting compensation is fixing salaries and other benefits at a level that is competitive enough to enable our Company to not only attract, but also to motivate, reward and retain the management talent necessary for our continued success. The final goal of the compensation program is to encourage each of our executive officers to perform. In order to accomplish this goal, the Committee sets salaries and awards bonuses and other equity awards in a manner that encourages our executive officers to perform at their highest levels in order to increase earnings and value for our stockholders.
The Committee ultimately makes all decisions about allocations between long-term and current compensation, cash and non-cash compensation, and allocations among the various forms of non-cash compensation. The members of the Committee make these decisions in their professional discretion based upon their subjective assessment of how each officer’s respective allocation would best meet the overall compensation goals outlined above. In addition to our three basic compensation objectives, the Committee and Board always consider what allocation structures and compensation levels are in the overall best interests of the Company.
Elements of the Compensation Program
The Company’s executive officer compensation program consists of four components: (i) base salary, (ii) incentive cash compensation and cash bonuses; (iii) stock option grants or other forms of equity awards; and (iv) deferred compensation.
88
Table of Contents
The Committee utilizes these four elements in their efforts to structure executive officer compensation in a way that appropriately rewards past performance, encourages future performance and provides a standard of living appropriate to each officer’s experience, responsibility and accomplishments. In addition to these main elements, each executive officer also receives additional compensation through our standard benefit plans that are available to all employees of the Company. The Committee reviews base salaries from time to time and adjusts them appropriately. The Committee believes that each element of our executive compensation program is an integral part of the program and, further, that each element is necessary to achieve a proper balance of incentive and reward.
A more detailed discussion of each of these elements of executive compensation, the reasons for awarding such types of compensation, the considerations in setting the amounts of each element of compensation and the amounts actually awarded is set forth in the sections below.
Base Salary
We include base salary as a part of our executive compensation program because we believe that our executive officers are entitled to receive a level of assured cash compensation that is sufficient in light of each officer’s own professional status and personal accomplishments. The base salary of each executive officer is determined by the Committee and is based in large part on the Committee’s subjective assessment of the executive officer’s performance (which is considered in light of their particular responsibilities and position within the Company) and our overall Company performance during prior periods. Other factors considered by the Committee in setting base salary are described below.
As noted above, the Committee primarily focuses on the Company’s financial performance for the relevant period (as measured by operating income and revenue growth) in making its evaluation of each executive officer’s overall performance. In addition, the Committee also considers the following factors: (i) salary norms for officers with a similar level of experience in comparable positions at comparable companies; (ii) the relative experience and skills of the particular executive officer; (iii) the level of responsibilities assigned to that officer; and (iv) the officer’s historical performance in light of our corporate objectives.
For 2008, the Committee set each named executive officer’s base salary as follows:
| Name |
2008 Base Salary | |
| D. Michael Stout, M.D. |
$348,964 | |
| Jerry F. Wells, Jr., CPA |
$222,068 |
In setting our chief executive officer’s salary for 2008, the Committee considered the fact that (i) our chief executive officer has continued to provide the personal leadership and business acumen that is necessary for our continued success; and (ii) the growth of the Company. The Committee also considered the salary levels of other chief executive officers at similar institutions in the Southeast and set a salary level the Committee believed to be fair, both to Dr. Stout and to the Company itself.
In setting our chief financial officer’s salary for 2008, the Committee took into consideration (i) the time and expertise required to comply with the complex financial regulatory and reporting requirements applicable to all reporting companies, and (ii) the growth of the Company. In addition to the above mentioned factors, the Committee also considered the salary levels of other chief financial officers at similar institutions in the Southeast and set a salary level the Committee believed to be fair, both to Mr. Wells and to the Company itself.
Incentive Cash Compensation and Cash Bonuses
We include incentive cash bonuses as part of each executive officer’s compensation as a mechanism for rewarding our executive officers for the Company’s (or any applicable subsidiary or business unit’s) achievement of certain performance objectives. Although it does operate mainly as a reward to our executive officers, the incentive cash bonuses are designed to promote the interests of the Company and its stockholders by providing our executives with financial rewards and helping to attract and retain key executives.
89
Table of Contents
After the commencement of each fiscal year, the Committee determines, and informs the executive officer, of a range of incentive cash bonus, if any, which may be awarded at the conclusion of the fiscal year to such executive officer. In setting the ranges of incentive cash bonuses which could be earned, the Committee takes into account each executive officer’s base salary, duties and responsibilities, as well as management’s estimated revenue and pre-tax income of the Company for such fiscal year.
The Committee determines the amount of any incentive cash bonus that an executive officer receives and awards such bonuses only when the Committee deems a bonus to be appropriate, in its discretion, based on the Company’s and individual executive’s performance. At the conclusion of the fiscal year, the Committee determines the amount of cash incentive compensation earned by each executive officer, if any, based upon the Company’s overall success, growth, and financial performance (measured in large part by the Company’s revenues and pre-tax income) for the year.
The amount of the cash incentive compensation earned by Dr. Stout and Mr. Wells in 2008 is set forth in the “Non-Equity Incentive Plan Compensation” column of the 2008 Summary Compensation Table. Consistent with past practice, Mr. Wells and Dr. Stout received advances of $45,000 and $42,000, respectively, on the anticipated cash incentive compensation each would be due for the year ended September 30, 2008. We anticipate that the remaining balance of the cash incentive bonus due Dr. Stout will be paid shortly after the filing of this Form 10-K.
In addition to the above described cash incentive compensation, the Company on October 6, 2008 awarded to Mr. Wells and Dr. Stout $35,350 and $44,188, respectively, as a cash bonus to reward them for their leadership of the Company during the recent reorganization of the Company.
Stock Options and Equity Awards
During the recent reorganization of the Company, stock options and other stock-based equity awards were not utilized in the compensation of executive officers, due in part to the financial position of the Company at the time. However, following improvements in the financial health of the Company, a new equity incentive plan was adopted by the stockholders during our 2007 Annual Meeting. On October 6, 2008, the Company awarded Mr. Wells and Dr. Stout 11,400 and 14,250 shares, respectively, of the common stock of the Company pursuant to the Company’s 2007 Equity Incentive Plan. The 11,400 shares awarded to Mr. Wells were transferred to the Company on June 11, 2009, in partial satisfaction of the judgment owed by Mr. Wells to the Company. At the time of such transfer, such shares had an aggregate value of $31,350.
The Committee’s use of equity awards as another form of incentive compensation is designed to focus management’s attention on the future of the Company and also on the long-term interests of stockholders. The Company believes that equity awards are instrumental in attracting and retaining the services of outstanding personnel and in encouraging such employees to have a greater financial investment in the Company.
Deferred Compensation Plans
During June 1997, the Company’s Board of Directors approved the UCI/Doctors Care Deferred Compensation Plan (the “Plan”) for key employees of the Company with an effective date of June 1998. The Plan was amended and restated effective January 1, 2005. Eligibility to participate in the Plan is determined at the discretion of the Company’s Board of Directors. Under the Plan, key employees may defer up to 30% of their pre-tax earnings. The Company may match up to three times the employee’s contribution percentage up to a limit of 10% of the employee’s pre-tax earnings. Employees with at least 5 years of service vest immediately in the Company’s matching contribution. Distributions from the Plan to the employee or their beneficiaries may occur if the employee resigns or is terminated, becomes disabled or deceased, reaches the normal retirement age of 65, or if there is a change of control of the Company. Participating employees may elect a lump-sum payment or be paid in annual installments; however, in no event may the employee receive the first payment until six months after the event which precipitated the distribution. For fiscal year 2008, the Company’s matching contributions for Dr. Stout and Mr. Wells were $137,418 and $106,316, respectively. The Company establishes and maintains investment accounts to fund the Deferred Compensation Plan. The deferred compensation liability increases or decreases based on the amounts deferred plus or minus earnings or losses on the deemed investment selections of the participants less any payments to participants.
90
Table of Contents
Other Benefits
We provide our executive officers with the same standard benefits and vacation package that all employees of the Company receive. This package includes the provision to our executive officers of the same healthcare, life and disability insurance benefits that we provide all other employees of the Company. It also includes making contributions to our 401(k) plan on each officer’s behalf pursuant to our standard 401(k) matching plan.
REPORT OF COMPENSATION COMMITTEE
The Compensation Committee establishes and oversees the design and functionality of the Company’s executive compensation program. We have reviewed and discussed the foregoing Compensation Discussion and Analysis (“CD&A”) with management of the Company. Based on this review and discussion, we recommended to the Board of Directors that the CD&A be included in this Report.
Submitted by the members of the Compensation Committee of the Board of Directors:
Charles M. Potok (Chair)
John M. Little, Jr., M.D.
Timothy L. Vaughn, CPA
Compensation Committee Interlocks and Insider Participation
None of the members of the Compensation Committee is or has been our executive officer or employee or an executive officer or employee of any of our subsidiaries. None of the members of the Compensation Committee is or has been a member of the compensation committees of another entity. None of our executive officers are or have been a member of the compensation committee, or a director, of another entity.
SUMMARY COMPENSATION TABLE
| Name and Principal Position | Year | Salary | Bonus | Stock Award | Non-Equity Incentive Plan Compensation |
All Other Compensation (1) |
Total | ||||||||||||||
| D. Michael Stout, MD |
2008 | $ | 348,964 | $ | 44,188 | $ | 32,062 | $ | 113,413 | $ | 163,079 | $ | 701,706 | ||||||||
| President and Chief |
2007 | 338,800 | - | - | 84,022 | 167,742 | 590,564 | ||||||||||||||
| Executive Officer |
|||||||||||||||||||||
| Jerry F. Wells , CPA |
2008 | 222,068 | 35,350 | 25,650 | 58,293 | (2) | 121,816 | 463,177 | |||||||||||||
| Former Executive Vice |
2007 | 215,600 | - | - | 44,845 | 129,308 | 389,753 | ||||||||||||||
| President and Chief |
|||||||||||||||||||||
| Financial Officer and |
|||||||||||||||||||||
| Corporate Secretary |
|||||||||||||||||||||
| (1) | Amounts set for the under the caption, “All Other Compensation” represent the Company’s contribution to the respective executives’ deferred compensation plan account. See the table below under the caption “NON-QUALIFIED DEFERRED COMPENSATION” for additional information. In addition, the amounts include payments for automobile allowances paid in lieu of mileage reimbursements, health insurance supplements and for Dr. Stout, reimbursement for long-term disability insurance. Automobile allowances totaled $12,350 for Dr. Stout and Mr. Wells in 2008 and 2007. Health insurance supplements totaled $3,150 for Dr. Stout and $3,350 for Mr. Wells in 2008. In 2007, Dr. Stout and Mr. Wells received health insurance supplements of $3,250. Dr. Stout was reimbursed $10,161 and $11,342 in 2008 and 2007, respectively, for long-term disability insurance premiums. |
| (2) | Mr. Wells’ employment was terminated on December 17, 2008 as a result of the discovery of improper expense reimbursements he claimed and other fraudulent activities in which he engaged. Prior to the date of the discovery of theses matters, Mr. Wells was paid $45,000 under the Company’s Non-Equity Incentive Plan. The remaining $13,293 was not paid to Mr. Wells. |
91
Table of Contents
2008 OPTION EXERCISES AND STOCK VESTED
| Option Awards | Stock Awards | |||||||
| Name | Number of Shares Acquired on Exercise |
Value Realized on Exercise |
Number of Shares Acquired on Vesting |
Value Realized on Vesting | ||||
| D. Michael Stout, MD |
- | - | - | - | ||||
| Jerry F. Wells, CPA |
- | - | - | - | ||||
NON-QUALIFIED DEFERRED COMPENSATION (1)
| Name | Executive FY (2) |
Registrant FY (3) |
Aggregate Earnings in Last FY |
Aggregate Withdrawals/ Distributions |
Aggregate Balance at Last FYE |
|||||||||||
| D. Michael Stout, MD |
$ | 45,806 | $ | 137,418 | $ | (247,650 | ) | - | $ | 1,001,550 | ||||||
| Jerry F. Wells, CPA |
35,799 | 106,316 | (206,719 | ) | - | 763,719 | (4) | |||||||||
| (1) | The significant provisions of the Company’s Deferred Compensation Plan are discussed in this Form 10-K under the caption, Part III – Item 11. – EXECUTIVE COMPENSATION – Compensation Discussion and Analysis – Elements of Compensation Program – Deferred Compensation Plans.” |
| (2) | These amounts are included in the respective Executive’s 2008 “Salary” column of the Summary Compensation Table above. |
| (3) | These amounts are included in the respective Executive’s 2008 “All Other Compensation” column of the Summary Compensation Table above. |
| (4) | On February 20, 2009, our Board of Directors passed a resolution declaring a forfeiture of Mr. Wells’ interest in our deferred compensation plan. On February 23, 2009, Mr. Wells signed a voluntary relinquishment of his interest in our deferred compensation plan. The liability at the date of forfeiture, the reversal of which we will recognize in the second quarter of 2009, approximated $600,000. |
2008 GRANTS OF PLAN-BASED AWARDS
| Name | Grant Date | Estimated Future Payouts Under Non Equity Incentive Plan Awards (1) |
Estimated Future Payouts Under Equity Incentive Plan Awards |
All Other Stock Awards: Number of Shares of Stock or Units (2) |
All Other Option Awards: Number of Securities Underlying Options |
Exercise or Base Price of Option Awards ($/Sh) |
Grant Date Fair Value of Stock and Option Awards (3) | |||||||||||||||||||
| Threshold | Target | Maximum | Threshold | Target | Maximum | |||||||||||||||||||||
| ($) | ($) | ($) | ($) | ($) | ($) | (#) | (#) | ($/Sh) | ||||||||||||||||||
| D. Michael Stout, MD |
Oct. 6, 2008 | $ | 4,886 | $ | 72,585 | $ | 181,461 | - | - | - | 14,250 | - | - | $ | 32,062 | |||||||||||
| Jerry F. Wells, CPA |
Oct. 6, 2008 | 2,443 | 37,307 | 93,269 | - | - | - | 11,400 | - | - | 25,650 | |||||||||||||||
| (1) | This represents the annual cash incentive opportunity for 2008 under the 2008 Incentive Program. The actual amounts paid out under this plan for 2008 are reported in the Summary Compensation Table. The threshold reflects the amount that would be payable under the plan if the minimum performance goals (with respect to bonus qualification) were achieved for both revenue and pre-tax income. If the minimum performance goal for either revenue or pre-tax income goals were not achieved, no bonus would be payable under the plan. |
| (2) | These amounts were fully vested upon grant. |
| (3) | Computed in accordance with SFAS 123R. |
92
Table of Contents
DIRECTOR COMPENSATION
Currently, members of our Board receive the following retainer fees: $6,000 per fiscal year for the Chairman, $5,000 per year for Committee members, and $4,000 per year for all other members of the Board. We also reimburse directors for out-of-pocket expenses reasonably incurred by them in the discharge of their duties as directors. Compensation we paid to our Directors for the year ended September 30, 2008 is as follows:
| Name | Fees Earned or (1) |
Stock Awards ($) |
Option Awards ($) |
Non-Equity Incentive Plan Compensation ($) |
Change in Pension Value and Nonqualified Deferred Compensation Earnings ($) |
Other Compensation ($) |
Total ($) | |||||||||
| Harold H. Adams, Jr. |
$ | 5,000 | - | - | - | - | - | $ | 5,000 | |||||||
| Joseph A. Boyle, CPA |
$ | 5,000 | - | - | - | - | - | $ | 5,000 | |||||||
| Ann T. Burnett |
$ | 4,000 | - | - | - | - | - | $ | 4,000 | |||||||
| Jean E. Duke, CPA |
$ | 5,000 | - | - | - | - | - | $ | 5,000 | |||||||
| Thomas G. Faulds |
$ | 4,000 | - | - | - | - | - | $ | 4,000 | |||||||
| John M. Little, Jr., MD. |
$ | 5,000 | - | - | - | - | - | $ | 5,000 | |||||||
| Charles M. Potok |
$ | 6,000 | - | - | - | - | - | $ | 6,000 | |||||||
| Timothy L. Vaughn, CPA |
$ | 5,000 | - | - | - | - | - | $ | 5,000 | |||||||
| (1) | Amounts in this column reflect amounts paid in cash in fiscal 2008. |
93
Table of Contents
ITEM 12. SECURITY OWNERSHIP OF CERTAIN BENEFICIAL OWNERS AND MANAGEMENT AND
RELATED STOCKHOLDER MATTERS
The following table sets forth certain information known to us regarding the beneficial ownership of our common stock as of December 31, 2009. Information is presented for (i) stockholders owning more than five percent of the outstanding common stock as indicated in their respective Schedule 13D filings as filed with the Securities and Exchange Commission as of December 31, 2009, (ii) each of our directors, each nominee for director, and each of our executive officers individually, and (iii) all of our directors and executive officers, as a group. The percentages are calculated based on 9,934,072 shares of common stock outstanding on December 31, 2009.
| Name | Shares Beneficially Owned (1) |
Percentage | |||||
| Blue Cross and Blue Shield of South Carolina (2) |
6,726,019 | 67.71 | % | ||||
| Bandera Partners LLC (3) |
1,323,357 | 13.32 | % | ||||
| Harold H. Adams, Jr. |
2,500 | * | |||||
| Joseph A. Boyle, CPA |
0 | 0 | |||||
| Ann T. Burnett |
0 | 0 | |||||
| Jean E. Duke, CPA |
2,000 | * | |||||
| Thomas G. Faulds |
5,000 | * | |||||
| John M. Little, Jr., M.D. |
0 | 0 | |||||
| Charles M. Potok |
5,000 | * | |||||
| Timothy L. Vaughn, CPA |
0 | 0 | |||||
| D. Michael Stout, M.D. |
307,310 | 3.09 | % | ||||
| Jerry F. Wells, Jr., CPA |
0 | 0 | |||||
| All current directors and executive officers As a group (10 persons) |
321,810 | 3.24 | % |
| * | Amount represents less than 1.0 percent. |
| (1) | Beneficial ownership reflected in the table is determined in accordance with the rules and regulations of the SEC and generally includes voting or investment power with respect to securities. Shares of common stock issuable upon the exercise of options currently exercisable or convertible, or exercisable or convertible within 60 days, are deemed outstanding for computing the percentage ownership of the person holding such options, but are not deemed outstanding for computing the percentage ownership of any other person. Except as otherwise specified, each of the stockholders named in the table has indicated to us that such stockholder has sole voting and investment power with respect to all shares of common stock beneficially owned by that stockholder. |
| (2) | The business address of the named beneficial owner is I-20 at Alpine Road, Columbia, SC 29219. The shares reflected in the table are held of record by BlueChoice HealthPlan (“BlueChoice”) [formerly known as Companion HealthCare Corporation ‘CHC’] 6,107,838 shares and Companion Property & Casualty Corporation (“CP&C”) 618,181 shares, wholly owned subsidiaries of Blue Cross Blue Shield of South Carolina. |
| (3) | This information is based on a Schedule 13D filed with the SEC on January 9, 2009 (the “Schedule 13D”). The business address of the named beneficial owner is 26 Broadway, Suite 1607, New York, New York 10004. The named beneficial holder has indicated in filings with the Securities Exchange Commission that the shares are indirectly beneficially owned by Bandera Partners, LLC, Gregory Bylinsky and Jefferson Gramm (the “Master Fund Shares”) are directly owned by Bandera Master Fund L.P., a Cayman Islands exempted limited partnership (“Bandera Master Fund”). Bandera Partners LLC is the investment manager of Bandera Master Fund and may be deemed to have beneficiary ownership of the Master Fund Shares by virtue of the sole and exclusive authority granted to Bandera Partners LLC by Bandera Master Fund to vote and dispose of the Master Fund Shares. Mr. Bylinsky and Mr. Gramm may be deemed to have beneficial ownership of the Master Fund Shares in their capacities as Managing Partners, Managing Directors and Portfolio Managers of Bandera Partners LLC. Mr. Bylinsky also has reported direct ownership of an additional 15,001 shares and Mr. Gramm has reported direct ownership of an additional 20,500 shares. |
The Schedule 13D states that Bandera Master Fund intends to seek representation on the Company’s Board of Directors, and that it or its affiliates may hold discussions with or otherwise communicate with the Company’s management and the Board or Directors and other representatives of the Company, or other stockholders and relevant parties, regarding these matters. The Schedule 13D further states that one or more members of Bandera Master Fund or its affiliates may also hold discussions or otherwise communicate with such Company parties regarding any one or more of the following: the acquisition or disposition of additional securities of the Company; an extraordinary corporate transaction, such as a merger, reorganization or liquidation involving the Company or any of its subsidiaries; a sale or transfer of a material amount of assets of the Company or any of its
94
Table of Contents
subsidiaries; a change in the present Board of Directors or management of the Company, including any plans or proposals to change the number or term of directors or to fill any existing vacancies on the Board; any material change in the present capitalization or dividend policy of the Company; any other material change to the Company’s business or corporate structure; any changes to the Company’s Certificate of Incorporation, Bylaws, or comparable instruments or other actions that may impede the acquisition of control of the Company by any person; causing a class of Company securities (to the extent then listed or quoted) to be delisted from a national securities exchange or cease to be authorized to be quoted on an inter-dealer quotation system; the eligibility for termination of registration of the Company’s equity securities pursuant to Section 12(g)(4) of the Exchange Act; or any action similar to the foregoing. The Schedule 13D further advises that the Bandera Master Fund or any of its affiliates may purchase from time to time in the open market or privately negotiated purchases additional Company securities, options or derivatives related thereto, and may dispose of all or a portion of its shares of the Company’s Common Stock at any time.
ITEM 13. CERTAIN RELATIONSHIPS AND RELATED TRANSACTIONS AND DIRECTOR INDEPENDENCE
Administrative Services Agreements
As used herein, the term UCI-SC refers to UCI Medical Affiliates of South Carolina, Inc., our wholly-owned subsidiary; the term DC-SC refers to Doctors Care P.A., a professional corporation affiliated with us; the term DC-TN refers to Doctor’s Care of Tennessee, P.C., a professional corporation affiliated with us; the term PPT refers to Progressive Physical Therapy, P.A., a professional corporation affiliated with us; the term COSM refers to Carolina Orthopedic & Sports Medicine, P.A., a professional corporation affiliated with us; and the term P.A. refers collectively to DC-SC, DC-TN, PPT and COSM.
UCI-SC has entered into Administrative Services Agreements with each P.A. Under these Administrative Services Agreements, which have an initial term of forty years, UCI-SC performs all non-medical management for the P.A. and has exclusive authority over all aspects of the business of the P.A. (other than those directly related to the provision of patient medical services or as otherwise prohibited by state law). The non-medical management provided by UCI-SC includes, among other functions, treasury and capital planning, financial reporting and accounting, pricing decisions, patient acceptance policies, setting office hours, contracting with third-party payers, and all administrative services. UCI-SC provides all of the resources (systems, procedures and staffing) to bill third-party payers or patients, and provides all of the resources (systems, procedures and staffing) for cash collection and management of accounts receivables, including custody of the lockbox where cash receipts are deposited. From the cash receipts, UCI-SC pays all physician and physical therapist salaries, and all other operating expenses of the centers and of UCI-SC. UCI-SC sets compensation guidelines for the licensed medical professionals at the P.A. and establishes guidelines for establishing, selecting, hiring, and firing of the licensed medical professionals. UCI-SC also negotiates and executes substantially all of the provider contracts with third-party payers, with the P.A. executing certain of the contracts at the request of a minority of payers. UCI-SC does not loan or otherwise advance funds to any P.A. for any purpose.
During our fiscal years ended September 30, 2008 and 2007, the P.A. received an aggregate of approximately $77,045,000 and $71,646,000, respectively, in fees prior to deduction by the P.A. of their payroll and other related deductible costs covered under the Administrative Services Agreements. For accounting purposes, we combine the operations of the P.A. with our operations, as reflected in our consolidated financial statements.
D. Michael Stout, M.D. is the sole shareholder of DC-SC, DC-TN and COSM, and since November 1, 2002, has served as the President and Chief Executive Officer of UCI, UCI-SC, DC-SC and DC-TN. Since its incorporation on April 1, 2005, Dr. Stout has served as the President of COSM. Prior to November 1, 2002, Dr. Stout was the Executive Vice President of Medical Affairs for UCI and UCI-SC, and was the President of DC-SC and DC-TN. Barry E. Fitch, P.T. is the sole shareholder of PPT and has served as its President since the incorporation of PPT on April 5, 2005.
Other Transactions with Related Parties
As of September 30, 2009, BlueChoice HealthPlan (“BlueChoice”) [formerly known as Companion Healthcare Corporation ‘CHC’], a wholly owned subsidiary of Blue Cross Blue Shield of South Carolina (“BCBS”), owns 6,107,838 shares of our common stock and Companion Property and Casualty Insurance Company (“CP&C”), another wholly owned subsidiary of BCBS, owns 618,181 shares of our common stock, which combine to approximately 67.71 percent of our outstanding common stock. The following is a historical summary of purchases of our common stock by BCBS subsidiaries from us.
95
Table of Contents
| Date Purchased |
Blue Cross Blue Shield of South Carolina Subsidiary |
Number of Shares |
Price per Share |
Total Purchase Price | ||||||
| 12/10/93 | BlueChoice HealthPlan |
* | 333,333 | $1.50 | $ 500,000 | |||||
| 06/08/94 | BlueChoice HealthPlan |
* | 333,333 | 3.00 | 1,000,000 | |||||
| 01/16/95 | BlueChoice HealthPlan |
* | 470,588 | 2.13 | 1,000,000 | |||||
| 05/24/95 | BlueChoice HealthPlan |
* | 117,647 | 2.13 | 250,000 | |||||
| 11/03/95 | BlueChoice HealthPlan |
* | 218,180 | 2.75 | 599,995 | |||||
| 12/15/95 | BlueChoice HealthPlan |
* | 218,180 | 2.75 | 599,995 | |||||
| 03/01/96 | BlueChoice HealthPlan |
* | 315,181 | 2.75 | 866,748 | |||||
| 06/04/96 | Companion Property and Casualty |
218,181 | 2.75 | 599,998 | ||||||
| 06/23/97 | Companion Property and Casualty |
400,000 | 1.50 | 600,000 | ||||||
*BlueChoice HealthPlan (“BlueChoice”) [formerly known as Companion HealthCare Corporation ‘CHC’].
Our common stock acquired by BlueChoice and CP&C was purchased pursuant to exemptions from the registration requirements of federal securities laws available under Section 4(2) of the 1933 Act. Consequently, the ability of the holders to resell such shares in the public market is subject to certain limitations and conditions. BlueChoice and CP&C purchased these shares at share prices below market value at the respective dates of purchase in part as a consequence of the lower issuance costs incurred by us in the sale of these unregistered securities and in part as consequence of the restricted nature of the shares. BlueChoice and CP&C have the right to require registration of the stock under certain circumstances as described in the respective stock purchase agreements.
From time to time, BlueChoice has purchased additional shares of our common stock directly from other stockholders of the company. We were not a party to those transactions.
BlueChoice and CP&C have the option to purchase as many shares from us as may be necessary for BCBS and its subsidiaries in the aggregate to obtain and maintain ownership of 48 percent of the outstanding common stock. To the extent either of these BCBS subsidiaries exercises its right in conjunction with a sale of voting stock by us, the price to be paid by such entity is the average price to be paid by the other purchasers in that sale. Otherwise, the price is the average closing bid price of our voting stock on the ten trading days immediately preceding the election by a BCBS subsidiary to exercise its purchase rights. Consequently, to the extent either of the BCBS subsidiaries elects to exercise any or a portion of its rights under these anti-dilution agreements, the sale of shares of common stock to a BCBS subsidiary will have the effect of reducing the percentage voting interest in us represented by a share of the common stock.
During the fiscal year ended September 30, 1998, UCI-SC entered into a capital lease purchase agreement with BCBS for a new billing and accounts receivable system, which includes computer equipment, for an aggregate purchase price of $1,253,000. UCI-SC has the option to purchase the equipment at the end of the lease term for $1. The lease obligation recorded at September 30, 2008 is $184,000, which includes lease addenda. We believe the terms of the lease purchase agreement to be no more or less favorable to UCI-SC than the terms that would have been obtainable through arm’s-length negotiations with unrelated third parties for a similar billing and accounts receivable system, which includes computer equipment.
During the fiscal year ended September 30, 1994, UCI-SC entered into an agreement with CP&C pursuant to which UCI-SC, through DC-SC, acts as the primary care provider for injured workers of firms carrying worker’s compensation insurance through CP&C. Additionally, during the fiscal year ended September 30, 1995, UCI-SC executed a $400,000 note payable to CP&C payable in monthly installments of $4,149 (including 11 percent interest) from April 1, 1995 to March 1, 2010. The note was paid in full in January 2009. We believe the terms of the agreement with CP&C to be no more or less favorable to UCI-SC than those that would have been obtainable through arm’s-length negotiations with unrelated third parties for similar arrangements.
96
Table of Contents
UCI-SC, through DC-SC, provides services to members of a health maintenance organization operated by BlueChoice who have selected DC-SC as their primary care provider. We believe the terms of the agreement with BlueChoice to be no more or less favorable to UCI-SC than those that would have been obtainable through arm’s-length negotiations with unrelated third parties for similar arrangements.
Director Independence
The Board has determined that Harold H. Adams, Jr., Jean E. Duke, CPA and Thomas G. Faulds meet the independence criteria prescribed by the Nasdaq Stock Market. Joseph A. Boyle, CPA is not considered independent because he now serves as the Company’s Executive Vice President and Chief Financial Officer. Ann T. Burnett, John M. Little, Jr., M.D., Charles M. Potok and Timothy L. Vaughn, CPA are not considered independent because each is associated with BCBS, the majority stockholder of the Company.
ITEM 14. PRINCIPAL ACCOUNTING FEES AND SERVICES
As discussed in this Form 10-K under the caption, “PART II – ITEM 9. - CHANGES IN AND DISAGREEMENTS WITH ACCOUNTANTS ON ACCOUNTING AND FINANCIAL DISCLOSURE,” we dismissed Scott McElveen on February 2, 2009, after Scott McElveen had substantially completed the audit of our consolidated financial statements as of and for the year ended September 30, 2008, but before the issuance of their audit opinion. We engaged Elliott Davis to perform an audit of our consolidated financial statements as of and for the year ended September 30, 2008, and to re-audit our consolidated financial statements as of and for the two years ended September 30, 2007. The tables below set forth the fees we paid to Scott McElveen for the two years ended September 30, 2008 and the fees we paid to Elliott Davis associated with the re-audit of our consolidated financial statements for the three-year period ended September 30, 2008. All the fees paid to Elliott Davis are categorized as fees paid in fiscal year 2008.
The following table presents fees for professional services rendered by Elliott Davis for the audit of our annual financial statements for fiscal years 2008, 2007 and 2006, together with fees for audit-related services, tax services and other services rendered by Elliott Davis for those periods.
| Fiscal Year 2008 |
|||||
| Audit Fees (1) |
$ | 305,000 | |||
| Tax Fees (2) |
19,100 | ||||
| Audit-related Fees (3) |
64,125 | ||||
| All Other Fees (4) |
13,850 | ||||
| $ | 402,075 | ||||
The following table presents fees charged by Scott McElveen for the audit of our annual financial statements for fiscal years 2008 and 2007, together with fees for audit-related services and tax services rendered by Scott McElveen for fiscal years ending September 30, 2008 and 2007.
| Fiscal Year 2008 |
Fiscal Year 2007 |
|||||||
| Audit Fees (1) |
$ | 107,500 | $ | 96,000 | ||||
| Tax Fees (2) |
16,000 | 15,500 | ||||||
| Audit-related Fees (5) |
- | 9,500 | ||||||
| $ | 123,500 | $ | 121,000 | |||||
| (1) | Audit fees consisted primarily of the audit of the Company’s annual financial statements and for reviews of the consolidated financial statements included in the Company’s annual report on Form 10-K and quarterly reports on Form 10-Q. These fees include amounts paid or expected to be paid for each year’s respective audit. |
| (2) | Tax fees include fees for the preparation of the Company’s income tax returns. |
97
Table of Contents
| (3) | Audit-related fees include fees for the audit of the Company’s 401(k) plan for 2008, fees related to reading and commenting on the Company’s regulatory filings, including fees incurred by Elliott Davis’ National Office resource and services rendered in connection with assisting the Company, under the direction of management, with preliminary compliance associated with the Sarbanes Oxley act of 2002. |
| (4) | All other fees include fees for services rendered in connection with a tax segregation study and in connection with an analysis of medical insurance contract processes. |
| (5) | Audit-related fees include fees for the audit of the Company’s 401(k) plan for 2007. |
All audit, audit-related and tax services were pre-approved by the Audit Committee, which concluded that provision of such services by the respective Independent registered accounting firm was compatible with the maintenance of the firms’ independence in the conduct of its auditing functions.
98
Table of Contents
PART IV
ITEM 15. EXHIBITS, FINANCIAL STATEMENT SCHEDULES
| (a)(1) |
Consolidated Financial Statements | |
| The Consolidated Financial Statements listed on the Index to the Consolidated Financial Statements on page 47 are filed as part of this Form 10-K. | ||
| (a)(2) |
Financial Statement Schedules Required by Item 8 | |
| (a)(3) |
Exhibits | |
| A listing of the exhibits to the Form 10-K is set forth on the Exhibit Index that immediately precedes such exhibits in this Form 10-K. | ||
99
Table of Contents
Pursuant to the requirements of Section 13 or 15(d) of the Securities Exchange Act of 1934, the registrant, UCI Medical Affiliates, Inc., has duly caused this Report to be signed on its behalf by the undersigned, thereunto duly authorized.
| UCI MEDICAL AFFILIATES, INC. | Date | |||
| /s/ D. Michael Stout, M.D. D. Michael Stout, M.D. |
February 2, 2010 | |||
| Its: President and Chief Executive Officer |
||||
Pursuant to the requirements of the Securities Exchange Act of 1934, this Report has been signed below by the following persons on behalf of the registrant and in the capacities and on the dates indicated.
| Signature |
Title |
Date | ||
|
/s/ D. Michael Stout, M.D. D. Michael Stout, M.D. |
President and Chief Executive Officer (principal executive officer) |
February 2, 2010 | ||
|
/s/ Joseph A. Boyle, CPA Joseph A. Boyle, CPA |
Executive Vice President and Chief Financial Officer, Director (principal financial and accounting officer) |
February 2, 2010 | ||
| /s/ Harold H. Adams, Jr., CPCU Harold H. Adams, Jr., CPCU |
Director |
February 2, 2010 | ||
| /s/ Charles M. Potok Charles M. Potok |
Director |
February 2, 2010 | ||
| /s/ Thomas G. Faulds Thomas G. Faulds |
Director |
February 2, 2010 | ||
| /s/ John M. Little, Jr., M.D., MBA John M. Little, Jr., M.D., MBA |
Director |
February 2, 2010 | ||
| /s/ Timothy L. Vaughn, CPA Timothy L. Vaughn, CPA |
Director |
February 2, 2010 | ||
| /s/ Jean E. Duke, CPA Jean E. Duke, CPA |
Director |
February 2, 2010 | ||
| /s/ Ann Thomas Burnett Ann Thomas Burnett |
Director |
February 2, 2010 | ||
100
Table of Contents
UCI MEDICAL AFFILIATES, INC.
EXHIBIT INDEX
| Exhibit Number |
Description | |
| 2.1 | Order of Confirmation of UCI Medical Affiliates, Inc. (“UCI”) Dated August 7, 2002 (Incorporated by reference to Exhibit 2.1 on the Form 8-K filed August 16, 2002) | |
| 2.2 | Order of Confirmation of UCI Medical Affiliates of South Carolina Dated August 5, 2002 (Incorporated by reference to Exhibit 2.2 on the Form 8-K filed August 16, 2002) | |
| 2.3 | Order of Confirmation of UCI Medical Affiliates of Georgia, Inc. Dated August 7, 2002 (Incorporated by reference to Exhibit 2.3 on the Form 8-K filed August 16, 2002) | |
| 2.4 | Order of Confirmation of Doctors Care, P.A. Dated August 8, 2002 (Incorporated by reference to Exhibit 2.4 on the Form 8-K filed August 16, 2002) | |
| 2.5 | Order of Confirmation of Doctors Care of Tennessee, P.C. Dated August 6, 2002 (Incorporated by reference to Exhibit 2.5 on the Form 8-K filed August 16, 2002) | |
| 2.6 | Order of Confirmation of Doctors Care of Georgia, P.C. Dated August 7, 2002 (Incorporated by reference to Exhibit 2.6 on the Form 8-K filed August 16, 2002) | |
| 2.7 | Plan of Reorganization for UCI (Incorporated by reference to Exhibit 2.7 on the Form 8- K filed August 16, 2002) | |
| 2.8 | Plan of Reorganization for UCI Medical Affiliates of South Carolina, Inc. (Incorporated by reference to Exhibit 2.8 on the Form 8-K filed August 16, 2002) | |
| 2.9 | Plan of Reorganization of UCI Medical Affiliates of Georgia, Inc. (Incorporated by reference to Exhibit 2.9 on the Form 8-K filed August 16, 2002) | |
| 2.10 | Plan of Reorganization of Doctors Care, P.A. (Incorporated by reference to Exhibit 2.10 on the Form 8-K filed August 16, 2002) | |
| 2.11 | Plan of Reorganization of Doctors Care of Tennessee, P.C. (Incorporated by reference to Exhibit 2.11 on the Form 8-K filed August 16, 2002) | |
| 2.12 | Plan of Reorganization for Doctors Care of Georgia, P.C. (Incorporated by reference to Exhibit 2.12 on the Form 8-K filed August 16, 2002) | |
| 2.13 | Joint Disclosure Statement Filed as of May 3, 2002 (Incorporated by reference to Exhibit 2.13 on the Form 8-K filed August 16, 2002) | |
| 2.14 | Addendum to Joint Disclosure Statement and Plans of Reorganization Filed as of June 14, 2002 (Incorporated by reference to Exhibit 2.14 on the Form 8-K filed August 16, 2002) | |
| 2.15 | Second Addendum to Plans of Reorganization Filed as of July 29, 2002 (Incorporated by reference to Exhibit 2.15 on the Form 8-K filed August 16, 2002) | |
| 3.1 | Amended and Restated Certificate of Incorporation of UCI filed with the Delaware Secretary of State as of July 27, 1994 (Incorporated by reference to the exhibit of same number on the Form 10-K filed for fiscal year 2003) | |
| 3.2 | Amended and Restated Bylaws of UCI dated as of November 23, 1993 (Incorporated by reference to the exhibit of same number on the Form 10-K filed for fiscal year 2003) | |
| 3.3 | Amendment to Amended and Restated Bylaws of UCI dated as of August 21, 1996 (Incorporated by reference to the exhibit of same number on the Form 10-K filed for fiscal year 2003) | |
| 3.4 | Amendment to Amended and Restated Bylaws of UCI dated as of August 15, 2002 (Incorporated by reference to Exhibit 3.4 on the Form 8-K filed as of October 28, 2002) | |
| 3.5 | Certificate of Amendment of Certificate of Incorporation filed with the Delaware Secretary of State as of February 24, 1999 (Exhibit 3.5 on the Form 10-K filed for fiscal year 2002) | |
| 4.1 | The rights of security holders of the registrant are set forth in the registrant’s Certificate of Incorporation and Bylaws, as amended, included as Exhibits 3. 1 through 3. 5 | |
| 10.17 | Administrative Services Agreement dated April 24, 1998 by and between Doctors Care of Georgia, P.C. and UCI Medical Affiliates of Georgia, Inc. (Incorporated by reference to the exhibit of same number on the Form 10-K filed for fiscal year 2003) | |
| 10.18 | Administrative Services Agreement dated April 24, 1998 by and between Doctors Care of Tennessee, P.C. and UCI Medical Affiliates of Georgia, Inc. (Incorporated by reference to the exhibit of same number on the Form 10-K filed for fiscal year 2003) |
101
Table of Contents
| 10.19 | Administrative Services Agreement dated August 11, 1998 between UCI Medical Affiliates of South Carolina, Inc. and Doctors Care, P.A. (Incorporated by reference to the exhibit of same number on the Form 10-K filed for fiscal year 2003) | |
| 10.21 | Stock Purchase Option and Restriction Agreement dated September 1, 1998 by and among D. Michael Stout, M.D.; UCI Medical Affiliates of Georgia, Inc. and Doctors Care of Georgia, P.C. (Incorporated by reference to the exhibit of same number on the Form 10-K filed for fiscal year 2003) | |
| 10.22 | Stock Purchase Option and Restriction Agreement dated July 15, 1998 by and among D. Michael Stout, M.D.; UCI Medical Affiliates of Georgia, Inc.; and Doctors Care of Georgia, P.C. (Incorporated by reference to the exhibit of same number on the Form 10-K filed for fiscal year 2003) | |
| 10.31 | Stock Purchase Option and Restriction Agreement dated as of October 31, 2002 by and among D. Michael Stout, M.D.; UCI Medical Affiliates of South Carolina, Inc.; and Doctors Care, P.A. (Incorporated by reference to Exhibit 10.31 filed on Form 10-K for fiscal year 2002) | |
| 10.32* | UCI Medical Affiliates, Inc. 2007 Equity Incentive Plan (Incorporated by reference to Exhibit 10.32 filed on Form 10-K for fiscal year 2007) | |
| 10.33* | The Executive Nonqualified Excess Plan (Incorporated by reference to Exhibit 10.33 filed on Form 10-K for fiscal year 2007) | |
| 10.34* | The Executive Nonqualified Excess Plan Adoption Agreement (Incorporated by reference to Exhibit 10.34 filed on Form 10-K for fiscal year 2007) | |
| 10.35 | BB&T Promissory Note (Incorporated by reference to Exhibit 10.35 filed on Form 10-Q for quarter ended June 30, 2008) | |
| 10.36 | Carolina First Promissory Note (Incorporated by reference to Exhibit 10.36 filed on Form 10-Q for quarter ended June 30, 2008) | |
| 10.37* | Employment Agreement of Joseph A. Boyle dated March 16, 2009 (Incorporated by reference to Exhibit 10.37 filed on Form 8-K on March 18, 2009) | |
| 10.38 | First Amended and Restated Loan Agreement dated November 23, 2009, by and among UCI Medical Affiliates, Inc.; UCI Medical Affiliates of South Carolina, Inc.; Doctors Care, P.A.; Doctor’s Care of Tennessee, P.C.; Progressive Physical Therapy, P.A.; Carolina Orthopedic & Sports Medicine, P.A.; and Branch Banking and Trust Company (Incorporated by reference to Exhibit 10.38 filed on Form 8-K on December 2, 2009). | |
| 10.39 | Second Amendment and Modification to Loan Agreement dated November 23, 2009, by and between UCI Properties, LLC and Branch Banking and Trust Company (Incorporated by reference to Exhibit 10.39 filed on Form 8-K on December 2, 2009). | |
| 14 | Code of Ethics dated as of November 25, 2003 (Incorporated by reference to the exhibit of same number on the Form 10-K filed for fiscal year 2003) | |
| 21 | Subsidiaries of the Registrant (Incorporated by reference to Exhibit 21 filed on Form 10- K for fiscal year 2007) | |
| 23# | Consent of Independent Auditors | |
| 31.1# | Rule 13a-14(a)/15d-14(a) Certification of D. Michael Stout, M.D. | |
| 31.2# | Rule 13a-14(a)/15d-14(a) Certification of Joseph A. Boyle, CPA | |
| 32# | Section 1350 Certification | |
| 99# | Press Release dated February 2, 2010 |
#Filed herewith
* Denotes a management contract or compensatory plan or arrangement.
102