Attached files
| file | filename |
|---|---|
| 8-K - 8-K - MARKWEST ENERGY PARTNERS L P | a10-2700_38k.htm |
Exhibit 99.1
|
|
Credit Suisse 2010 Energy Summit February 2, 2010 |
|
|
Forward-Looking Statements This presentation contains forward-looking statements and information. These forward-looking statements, which in many instances can be identified by words like “could,” “may,” “will,” “should,” “expects,” “plans,” “project,” “anticipates,” “believes,” “planned,” “proposed,” “potential,” and other comparable words, regarding future or contemplated results, performance, transactions, or events, are based on MarkWest Energy Partners, L.P. (“MarkWest” and “Partnership”) current information, expectations and beliefs, concerning future developments and their potential effects on MarkWest. Although we believe that the expectations reflected in the forward-looking statements are reasonable, we can give no assurance that such expectations will prove to be correct, and actual results, performance , distributions , events or transactions could vary significantly from those expressed or implied in such statements and are subject to a number of uncertainties and risks. Among the factors that could cause results, performance, distributions, events or transactions to differ materially from those expressed or implied, are those risks discussed in our Annual Report on Form 10-K for the year ended December 31, 2008, and our Quarterly Report on Form 10-Q for the quarter ended September 30, 2009, as filed with the SEC. You are urged to carefully review and consider the cautionary statements and other disclosures, including those under the heading “Risk Factors,” made in those documents. If any of the uncertainties or risks develop into actual events or occurrences, or if underlying assumptions prove incorrect, it could cause actual results to vary significantly from those expressed in the presentation, and our business, financial condition, or results of operations could be materially adversely affected. Key uncertainties and risks that may directly affect MarkWest’s performance, future growth, results of operations, and financial condition, include, but are not limited to: Fluctuations and volatility of natural gas, NGL products, and oil prices; A reduction in natural gas or refinery off-gas production which we gather, transport, process, and/or fractionate; A reduction in the demand for the products we produce and sell; Financial credit risks / failure of customers to satisfy payment or other obligations under our contracts; Effects of our debt and other financial obligations, access to capital, or our future financial or operational flexibility or liquidity; Construction, procurement, and regulatory risks in our development projects; Hurricanes, fires, and other natural and accidental events impacting our operations, and adequate insurance coverage; Terrorist attacks directed at our facilities or related facilities; Changes in and impacts of laws and regulations affecting our operations; and Failure to integrate recent or future acquisitions. |
|
|
Non-GAAP Measures Distributable Cash Flow and Adjusted EBITDA are not measures of performance calculated in accordance with GAAP, and should not be considered separately from or as a substitute for net income, income from operations, or cash flow as reflected in our financial statements. The GAAP measure most directly comparable to Distributable Cash Flow and Adjusted EBITDA is net income (loss) attributable to the Partnership. In general, we define Distributable Cash Flow as net income (loss) attributable to the Partnership adjusted for (i) depreciation, amortization, accretion and impairment expense; (ii) amortization of deferred financing costs, (iii) non-cash (earnings) loss from unconsolidated affiliates; (iv) distributions from (contributions to) unconsolidated affiliates (net of affiliate’s growth capital expenditures); (v) non-cash compensation expense; (vi) non-cash derivative activity; (vii) losses (gains) on the disposal of property, plant and equipment (“PP&E”); (viii) provision for deferred income taxes; (ix) adjustments for non-controlling interest in consolidated subsidiaries; (x) losses (gains) relating to other miscellaneous non-cash amounts affecting net income for the period; and (xi) maintenance capital expenditures. We define Adjusted EBITDA as net income (loss) attributable to the Partnership adjusted for (i) depreciation, amortization, accretion, and impairment expense; (ii) interest expense; (iii) amortization of deferred financing costs; (iv) losses (gains) on the disposal of PP&E; (v) non-cash derivative activity; (vi) non-cash compensation expense; (vii) provision for income taxes; (viii) adjustments for cash flow from unconsolidated investments; (ix) adjustment for non-controlling interest of consolidated subsidiaries; and (x) losses (gains) relating to other miscellaneous non-cash amounts affecting net income for the period. Distributable Cash Flow is a financial performance measure used by management as a key component in the determination of cash distributions paid to unitholders. We believe distributable cash flow is an important financial measure for unitholders as an indicator of cash return on investment and to evaluate whether the Partnership is generating sufficient cash flow to support quarterly distributions. In addition, distributable cash flow is commonly used by the investment community because the market value of publicly traded partnerships is based, in part, on distributable cash flow and cash distributions paid to unitholders. Adjusted EBITDA is a financial performance measure used by management, industry analysts, investors, lenders, and rating agencies to assess the financial performance and operating results of the Partnership’s ongoing business operations. Additionally, we believe Adjusted EBITDA provides useful information to investors for trending, analyzing, and benchmarking our operating results from period to period as compared to other companies that may have different financing and capital structures. Please see the Appendix and Slide 26 for a reconciliation of Adjusted EBITDA to net income (loss) attributable to the Partnership. |
|
|
Topics for Discussion Overview of MarkWest Unconventional Resource Strategy Marcellus Joint Venture Financial Summary and Guidance Keys to Success |
|
|
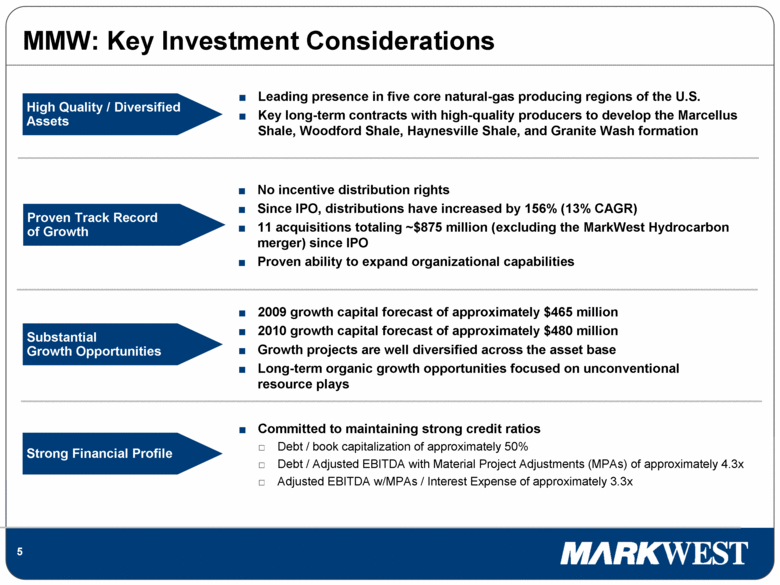
MMW: Key Investment Considerations Committed to maintaining strong credit ratios Debt / book capitalization of approximately 50% Debt / Adjusted EBITDA with Material Project Adjustments (MPAs) of approximately 4.3x Adjusted EBITDA w/MPAs / Interest Expense of approximately 3.3x No incentive distribution rights Since IPO, distributions have increased by 156% (13% CAGR) 11 acquisitions totaling ~$875 million (excluding the MarkWest Hydrocarbon merger) since IPO Proven ability to expand organizational capabilities 2009 growth capital forecast of approximately $465 million 2010 growth capital forecast of approximately $480 million Growth projects are well diversified across the asset base Long-term organic growth opportunities focused on unconventional resource plays High Quality / Diversified Assets Proven Track Record of Growth Strong Financial Profile Leading presence in five core natural-gas producing regions of the U.S. Key long-term contracts with high-quality producers to develop the Marcellus Shale, Woodford Shale, Haynesville Shale, and Granite Wash formation Substantial Growth Opportunities |
|
|
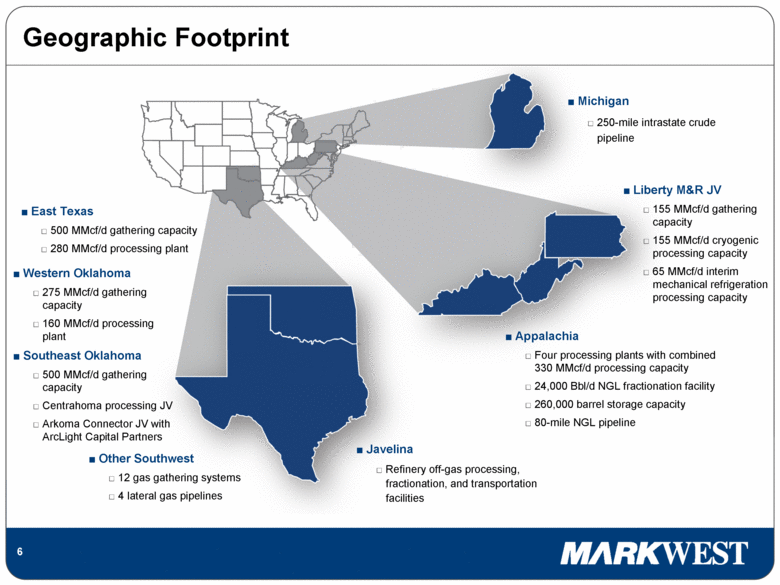
Geographic Footprint Michigan 250-mile intrastate crude pipeline Western Oklahoma 275 MMcf/d gathering capacity 160 MMcf/d processing plant Southeast Oklahoma 500 MMcf/d gathering capacity Centrahoma processing JV Arkoma Connector JV with ArcLight Capital Partners Appalachia Four processing plants with combined 330 MMcf/d processing capacity 24,000 Bbl/d NGL fractionation facility 260,000 barrel storage capacity 80-mile NGL pipeline Javelina Refinery off-gas processing, fractionation, and transportation facilities East Texas 500 MMcf/d gathering capacity 280 MMcf/d processing plant Other Southwest 12 gas gathering systems 4 lateral gas pipelines Liberty M&R JV 155 MMcf/d gathering capacity 155 MMcf/d cryogenic processing capacity 65 MMcf/d interim mechanical refrigeration processing capacity |
|
|
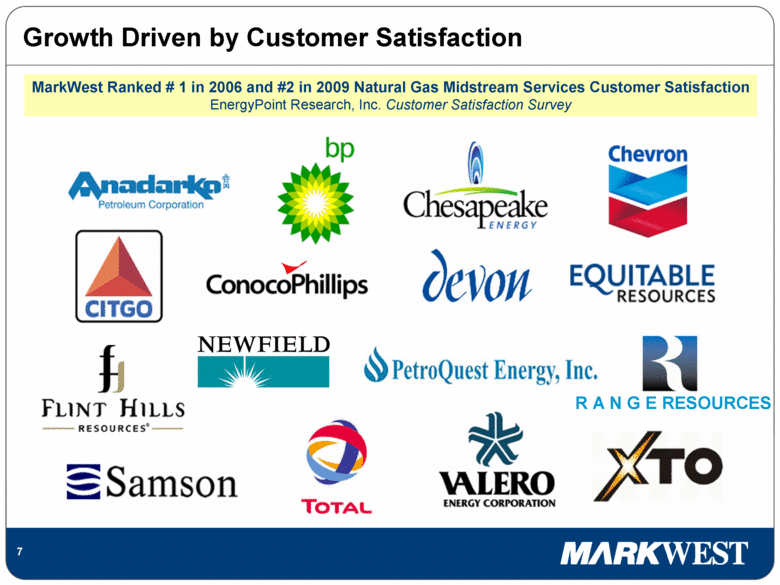
Growth Driven by Customer Satisfaction R A N G E RESOURCES MarkWest Ranked # 1 in 2006 and #2 in 2009 Natural Gas Midstream Services Customer Satisfaction EnergyPoint Research, Inc. Customer Satisfaction Survey |
|
|
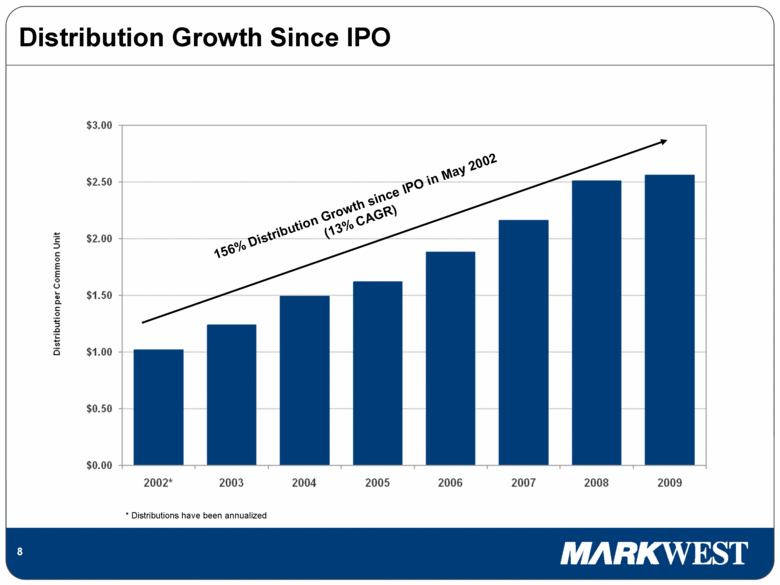
Distribution Growth Since IPO 156% Distribution Growth since IPO in May 2002 (13% CAGR) * Distributions have been annualized |
|
|
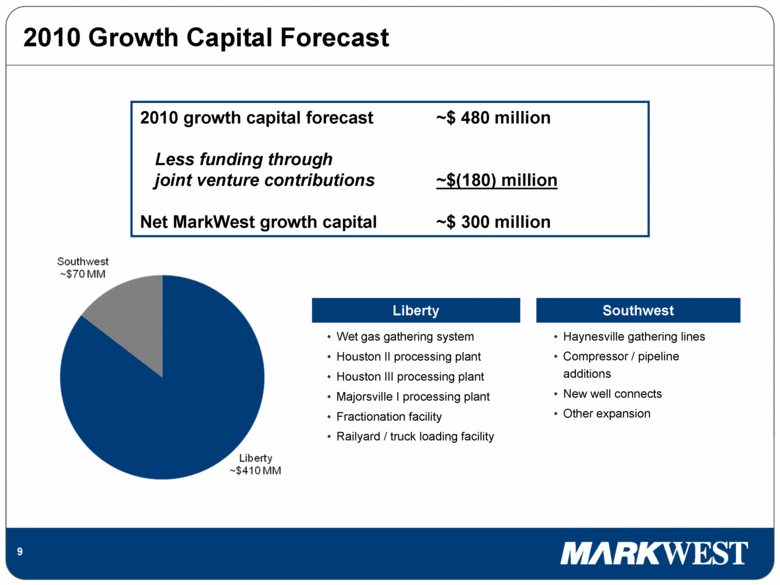
2010 Growth Capital Forecast 2010 growth capital forecast ~$ 480 million Less funding through joint venture contributions ~$(180) million Net MarkWest growth capital ~$ 300 million Southwest Haynesville gathering lines Compressor / pipeline additions New well connects Other expansion Liberty Wet gas gathering system Houston II processing plant Houston III processing plant Majorsville I processing plant Fractionation facility Railyard / truck loading facility |
|
|
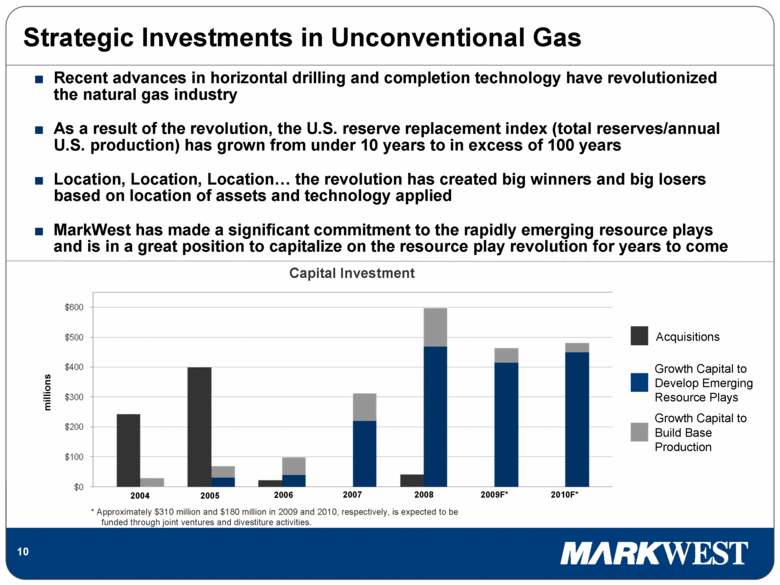
Strategic Investments in Unconventional Gas Acquisitions Growth Capital to Develop Emerging Resource Plays Growth Capital to Build Base Production Recent advances in horizontal drilling and completion technology have revolutionized the natural gas industry As a result of the revolution, the U.S. reserve replacement index (total reserves/annual U.S. production) has grown from under 10 years to in excess of 100 years Location, Location, Location... the revolution has created big winners and big losers based on location of assets and technology applied MarkWest has made a significant commitment to the rapidly emerging resource plays and is in a great position to capitalize on the resource play revolution for years to come Capital Investment millions * Approximately $310 million and $180 million in 2009 and 2010, respectively, is expected to be funded through joint ventures and divestiture activities. 2004 2005 2006 2007 2008 2009F* 2010F* |
|
|
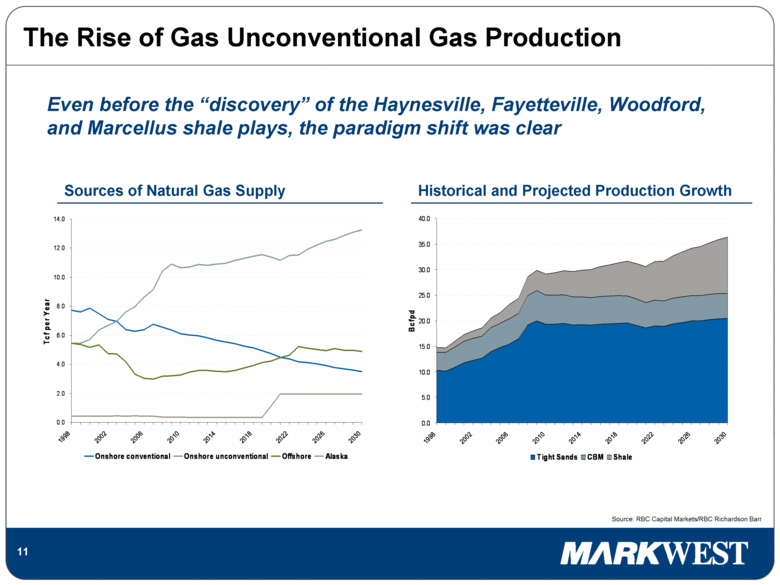
The Rise of Gas Unconventional Gas Production Sources of Natural Gas Supply Historical and Projected Production Growth Source: RBC Capital Markets/RBC Richardson Barr Even before the “discovery” of the Haynesville, Fayetteville, Woodford, and Marcellus shale plays, the paradigm shift was clear 0.0 2.0 4.0 6.0 8.0 10.0 12.0 14.0 1998 2002 2006 2010 2014 2018 2022 2026 2030 Tcf per Year Onshore conventional Onshore unconventional Offshore Alaska |
|
|
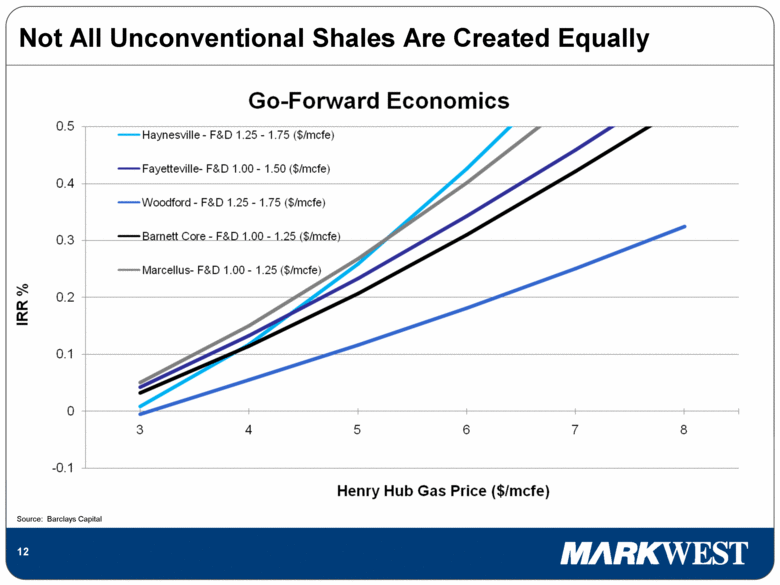
Source: Barclays Capital Not All Unconventional Shales Are Created Equally |
|
|
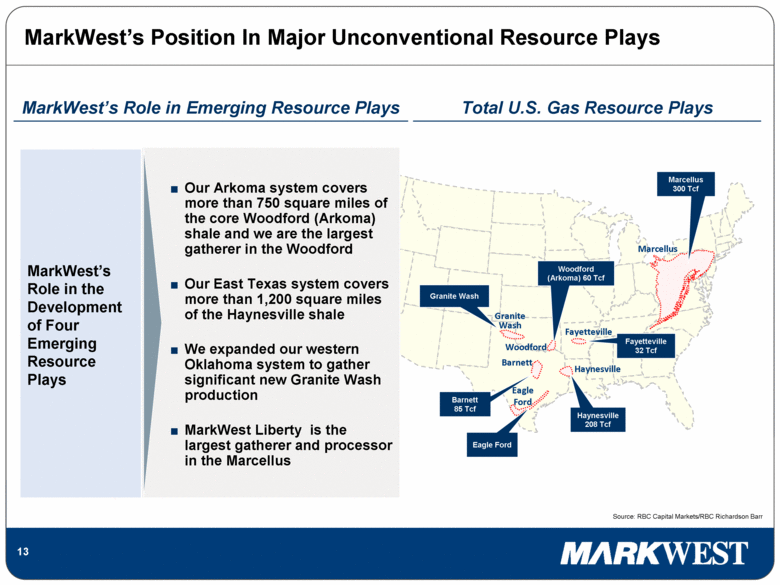
MarkWest’s Position In Major Unconventional Resource Plays Marcellus Barnett Haynesville Marcellus 300 Tcf Fayetteville 32 Tcf Fayetteville Woodford (Arkoma) 60 Tcf Granite Wash Barnett 85 Tcf Eagle Ford Haynesville 208 Tcf Woodford Eagle Ford Total U.S. Gas Resource Plays MarkWest’s Role in Emerging Resource Plays Source: RBC Capital Markets/RBC Richardson Barr Granite Wash Our Arkoma system covers more than 750 square miles of the core Woodford (Arkoma) shale and we are the largest gatherer in the Woodford Our East Texas system covers more than 1,200 square miles of the Haynesville shale We expanded our western Oklahoma system to gather significant new Granite Wash production MarkWest Liberty is the largest gatherer and processor in the Marcellus MarkWest’s Role in the Development of Four Emerging Resource Plays |
|
|
Unconventional Resource Plays Demand a Different Midstream Model “Insourcing” is the new “Outsourcing” Producers and gatherers must rethink their historical relationship – MarkWest has led the way in this revolution Preparing for the wave Gatherers must prepare for the dramatic changes in gas volumes Varying gas composition More flexible gathering design Capital investment changes the equation Significant first mover advantage and fewer overlapping gathering systems New investment opportunities over the full life of the play MarkWest operations are designed to support the unconventional resource plays |
|
|
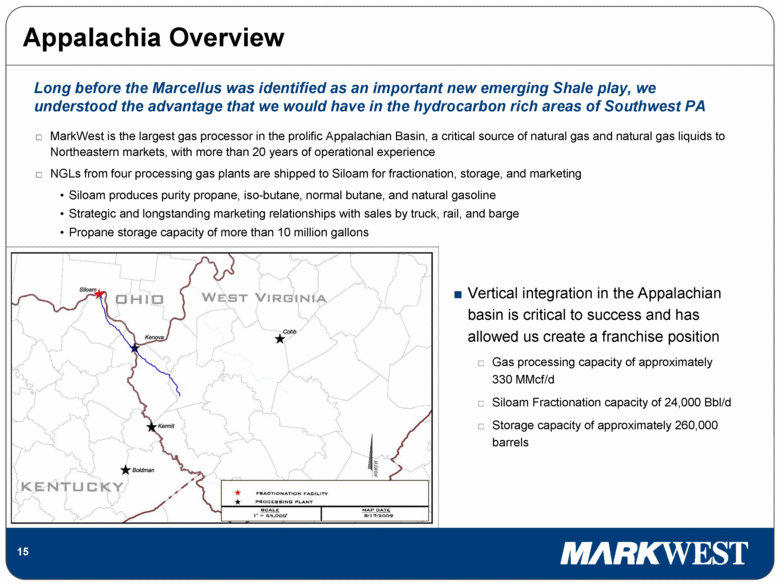
Appalachia Overview MarkWest is the largest gas processor in the prolific Appalachian Basin, a critical source of natural gas and natural gas liquids to Northeastern markets, with more than 20 years of operational experience NGLs from four processing gas plants are shipped to Siloam for fractionation, storage, and marketing Siloam produces purity propane, iso-butane, normal butane, and natural gasoline Strategic and longstanding marketing relationships with sales by truck, rail, and barge Propane storage capacity of more than 10 million gallons Long before the Marcellus was identified as an important new emerging Shale play, we understood the advantage that we would have in the hydrocarbon rich areas of Southwest PA Vertical integration in the Appalachian basin is critical to success and has allowed us create a franchise position Gas processing capacity of approximately 330 MMcf/d Siloam Fractionation capacity of 24,000 Bbl/d Storage capacity of approximately 260,000 barrels |
|
|
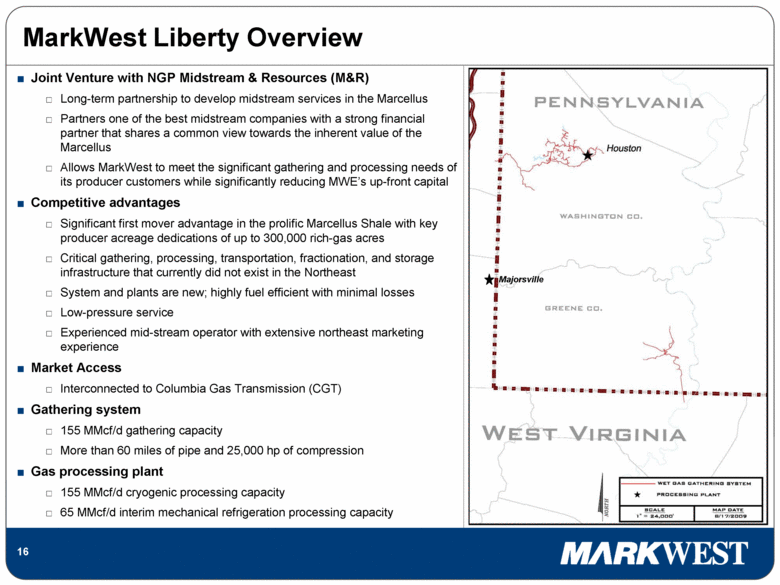
MarkWest Liberty Overview Joint Venture with NGP Midstream & Resources (M&R) Long-term partnership to develop midstream services in the Marcellus Partners one of the best midstream companies with a strong financial partner that shares a common view towards the inherent value of the Marcellus Allows MarkWest to meet the significant gathering and processing needs of its producer customers while significantly reducing MWE’s up-front capital Competitive advantages Significant first mover advantage in the prolific Marcellus Shale with key producer acreage dedications of up to 300,000 rich-gas acres Critical gathering, processing, transportation, fractionation, and storage infrastructure that currently did not exist in the Northeast System and plants are new; highly fuel efficient with minimal losses Low-pressure service Experienced mid-stream operator with extensive northeast marketing experience Market Access Interconnected to Columbia Gas Transmission (CGT) Gathering system 155 MMcf/d gathering capacity More than 60 miles of pipe and 25,000 hp of compression Gas processing plant 155 MMcf/d cryogenic processing capacity 65 MMcf/d interim mechanical refrigeration processing capacity Majorsville |
|
|
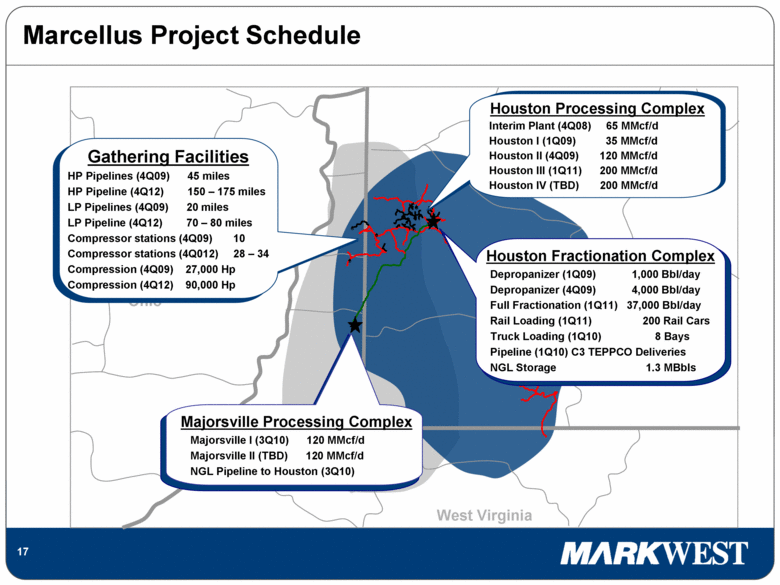
Marcellus Project Schedule Ohio West Virginia c c c c c c c c Majorsville Processing Complex Majorsville I (3Q10) 120 MMcf/d Majorsville II (TBD) 120 MMcf/d NGL Pipeline to Houston (3Q10) Houston Processing Complex Interim Plant (4Q08) 65 MMcf/d Houston I (1Q09) 35 MMcf/d Houston II (4Q09) 120 MMcf/d Houston III (1Q11) 200 MMcf/d Houston IV (TBD) 200 MMcf/d Houston Fractionation Complex Depropanizer (1Q09) 1,000 Bbl/day Depropanizer (4Q09) 4,000 Bbl/day Full Fractionation (1Q11) 37,000 Bbl/day Rail Loading (1Q11) 200 Rail Cars Truck Loading (1Q10) 8 Bays Pipeline (1Q10) C3 TEPPCO Deliveries NGL Storage 1.3 MBbls Gathering Facilities HP Pipelines (4Q09) 45 miles HP Pipeline (4Q12) 150 – 175 miles LP Pipelines (4Q09) 20 miles LP Pipeline (4Q12) 70 – 80 miles Compressor stations (4Q09) 10 Compressor stations (4Q012) 28 – 34 Compression (4Q09) 27,000 Hp Compression (4Q12) 90,000 Hp |
|
|
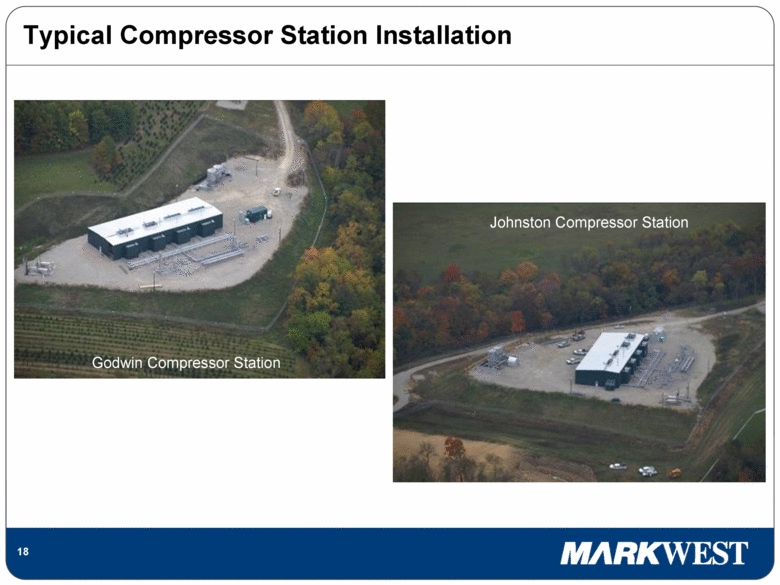
Typical Compressor Station Installation Johnston Compressor Station Godwin Compressor Station |
|
|
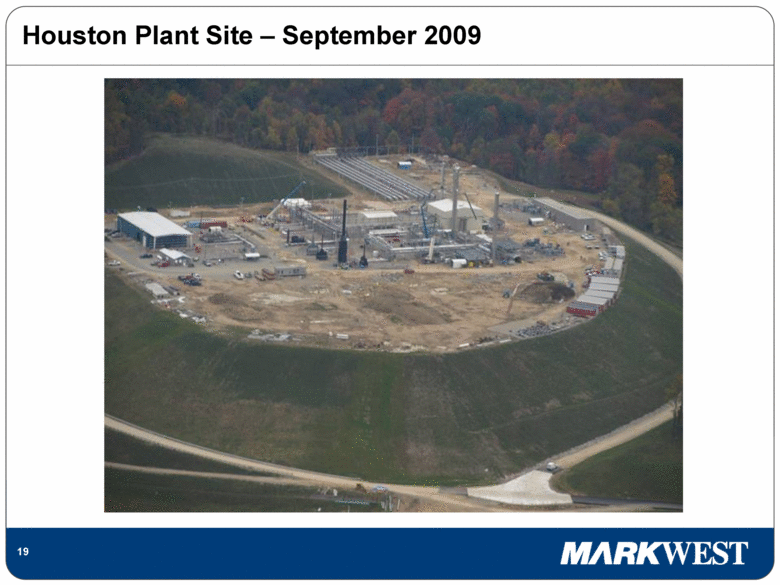
Houston Plant Site – September 2009 |
|
|
MarkWest completed one private placement of senior notes and two public offerings of common units in 2009 May 2009 – $150 million of 6.875% senior unsecured notes due 2014 Priced at 12.59% yield to maturity Net proceeds of approximately $113.8 million June 2009 – 3.3 million common unit offering at $18.15 Net proceeds of approximately $57.9 million August 2009 – 6.0 million common unit offering at $20.95 Net proceeds of approximately $121.0 million In addition, MarkWest executed two joint ventures in 2009 January 2009 – joint venture with NGP Midstream & Resources Dedicated to the construction and operation of natural gas midstream services in the Marcellus Shale May 2009 – joint venture with ArcLight Capital Partners Dedicated to the Arkoma Connector pipeline, a 50-mile interstate pipeline that provides Woodford Shale takeaway capacity and interconnects with Midcontinent Express Pipeline and Gulf Crossing Pipeline In September 2009, MarkWest sold to Air Products and Chemicals, Inc. the steam methane reformer (SMR) facility currently being constructed at its Javelina processing facility 2009 Capital Markets and Liquidity Update |
|
|
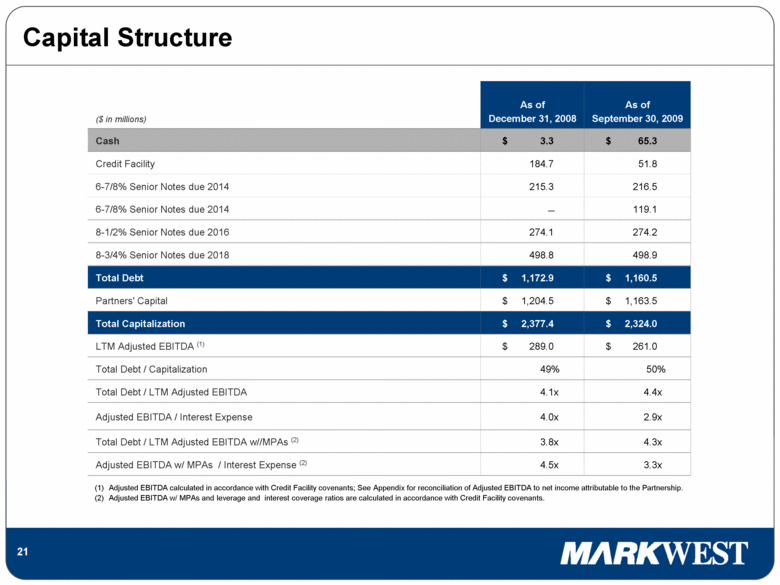
Capital Structure ($ in millions) As of December 31, 2008 As of September 30, 2009 Cash $ 3.3 $ 65.3 Credit Facility 184.7 51.8 6-7/8% Senior Notes due 2014 215.3 216.5 6-7/8% Senior Notes due 2014 – 119.1 8-1/2% Senior Notes due 2016 274.1 274.2 8-3/4% Senior Notes due 2018 498.8 498.9 Total Debt $ 1,172.9 $ 1,160.5 Partners' Capital $ 1,204.5 $ 1,163.5 Total Capitalization $ 2,377.4 $ 2,324.0 LTM Adjusted EBITDA (1) $ 289.0 $ 261.0 Total Debt / Capitalization 49% 50% Total Debt / LTM Adjusted EBITDA 4.1x 4.4x Adjusted EBITDA / Interest Expense 4.0x 2.9x Total Debt / LTM Adjusted EBITDA w//MPAs (2) 3.8x 4.3x Adjusted EBITDA w/ MPAs / Interest Expense (2) 4.5x 3.3x Adjusted EBITDA calculated in accordance with Credit Facility covenants; See Appendix for reconciliation of Adjusted EBITDA to net income attributable to the Partnership. Adjusted EBITDA w/ MPAs and leverage and interest coverage ratios are calculated in accordance with Credit Facility covenants. |
|
|
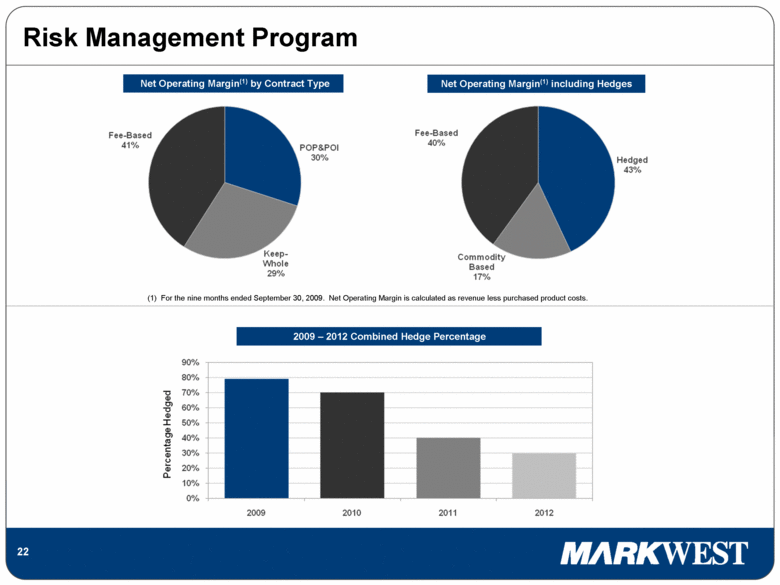
Risk Management Program Net Operating Margin(1) by Contract Type Net Operating Margin(1) including Hedges 2009 – 2012 Combined Hedge Percentage (1) For the nine months ended September 30, 2009. Net Operating Margin is calculated as revenue less purchased product costs. |
|
|
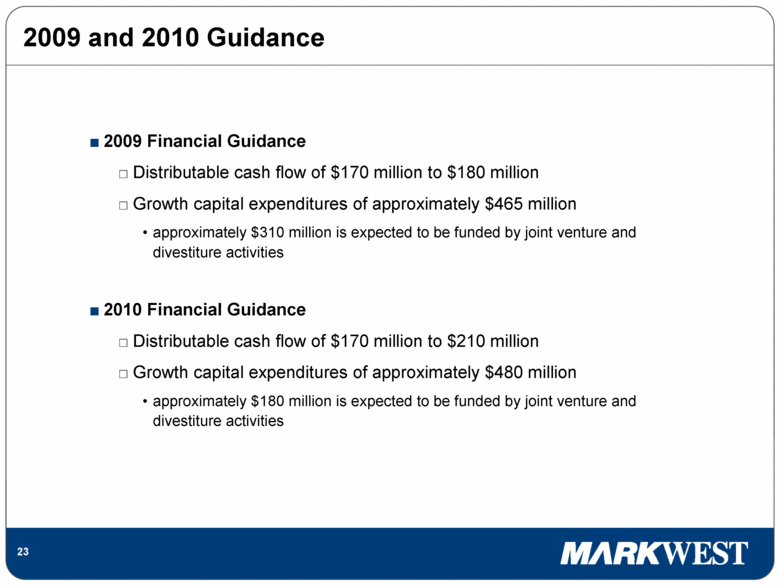
2009 and 2010 Guidance 2009 Financial Guidance Distributable cash flow of $170 million to $180 million Growth capital expenditures of approximately $465 million approximately $310 million is expected to be funded by joint venture and divestiture activities 2010 Financial Guidance Distributable cash flow of $170 million to $210 million Growth capital expenditures of approximately $480 million approximately $180 million is expected to be funded by joint venture and divestiture activities |
|
|
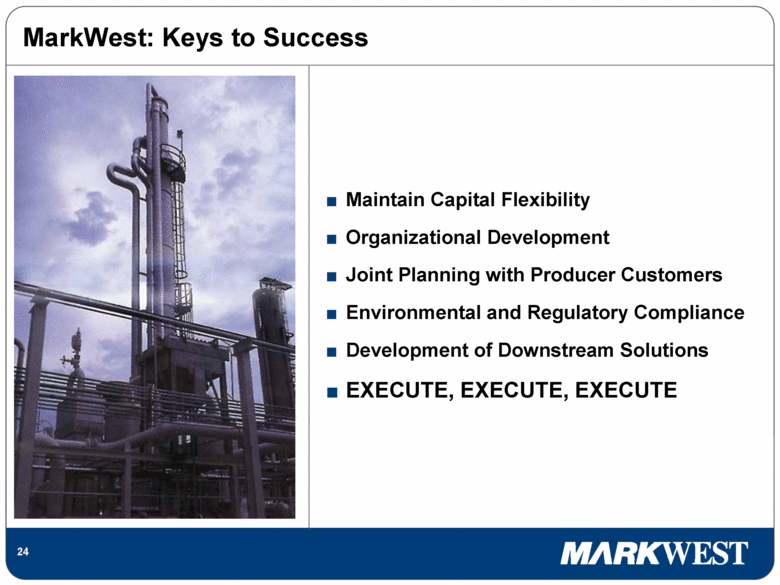
MarkWest: Keys to Success Maintain Capital Flexibility Organizational Development Joint Planning with Producer Customers Environmental and Regulatory Compliance Development of Downstream Solutions EXECUTE, EXECUTE, EXECUTE |
|
|
Appendix |
|
|
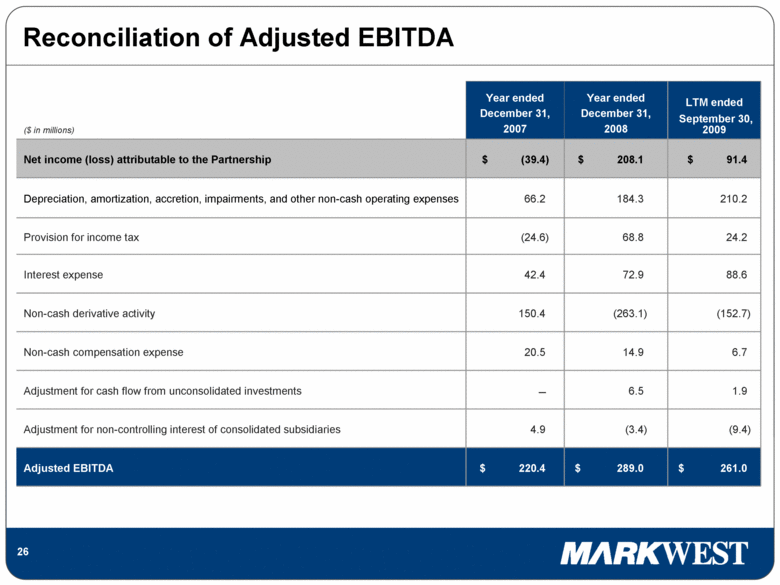
($ in millions) Year ended December 31, 2007 Year ended December 31, 2008 LTM ended September 30, 2009 Net income (loss) attributable to the Partnership $ (39.4) $ 208.1 $ 91.4 Depreciation, amortization, accretion, impairments, and other non-cash operating expenses 66.2 184.3 210.2 Provision for income tax (24.6) 68.8 24.2 Interest expense 42.4 72.9 88.6 Non-cash derivative activity 150.4 (263.1) (152.7) Non-cash compensation expense 20.5 14.9 6.7 Adjustment for cash flow from unconsolidated investments – 6.5 1.9 Adjustment for non-controlling interest of consolidated subsidiaries 4.9 (3.4) (9.4) Adjusted EBITDA $ 220.4 $ 289.0 $ 261.0 Reconciliation of Adjusted EBITDA |
|
|
1515 Arapahoe Street Tower 2 Suite 700 Denver, CO 80202 Phone: 303-925-9200 Investor Relations: 866-858-0482 Email: investorrelations@markwest.com Website: www.markwest.com |