Attached files
| file | filename |
|---|---|
| 8-K - FORM 8-K - EXELON GENERATION CO LLC | d8k.htm |
 1 Exhibit 99.1 William A. Von Hoene, Jr., EVP Finance and Legal Credit Suisse 2010 Energy Summit February 3, 2010 |
 2 Forward-Looking Statements This presentation includes forward-looking statements within the meaning of the
Private Securities Litigation Reform Act of 1995, that are subject to risks
and uncertainties. The factors that could cause actual results to differ
materially from these forward-looking statements include those discussed
herein as well as those discussed in (1) Exelon’s 2008 Annual Report on
Form 10-K in (a) ITEM 1A. Risk Factors, (b) ITEM 7. Management’s Discussion and Analysis of Financial Condition and Results of Operations and (c) ITEM 8.
Financial Statements and Supplementary Data: Note 18; (2) Exelon’s
Third Quarter 2009 Quarterly Report on Form 10-Q in (a) Part II, Other
Information, ITEM 1A. Risk Factors and (b) Part I, Financial Information,
ITEM 1. Financial Statements: Note 14 and (3) other factors discussed in
filings with the Securities and Exchange Commission (SEC) by Exelon Corporation, Commonwealth Edison Company, PECO Energy Company and Exelon Generation Company, LLC (Companies). Readers are cautioned not to place undue reliance on these forward-looking statements, which apply only as of the date of
this presentation. None of the Companies undertakes any obligation to publicly release any revision to its forward-looking statements to reflect events or circumstances after
the date of this presentation. |
 3 Protect Today’s Value • Deliver superior operating performance • Advance competitive markets • Exercise financial discipline and maintain financial flexibility • Build healthy, self-sustaining delivery companies Grow Long-Term Value • Drive the organization to the next level of performance • Adapt and advance Exelon 2020 • Rigorously evaluate and pursue new growth opportunities in clean technologies and transmission • Build the premier, enduring competitive generation company + Exelon’s Strategic Direction Excel in managing the elements of our business we can control, while being strategic, thoughtful and disciplined with the elements we cannot control
|
 4 Exelon Generation Consistently Delivers Top-Tier Results Nuclear Reliability 30 Longest Continuous US Runs Exelon Power Fleet Availability Exelon Generation’s nuclear fleet has 16 of the 30 longest continuous US runs…evidence of its ability to replicate best practices on a large scale Source: Platts News Flashes and Company Press Releases, 11/3/09 90.7% 93.5% 91.2% 89.1% 93.7% 92.9% 94.8% 95.8% 97.5% 93.8% 80% 85% 90% 95% 100% 2005 2006 2007 2008 2009 Fossil Fleet Commercial Availability Hydro Equivalent Availability 0 200 400 600 800 Byron 1 Limerick 2 Byron 2 Braidwood 2 Quad Cities 1 Clinton Three Mile Island 1 Three Mile Island 1 Three Mile Island 1 LaSalle 1 Three Mile Island 1 Three Mile Island 1 Peach Bottom-3 Peach Bottom-3 LaSalle 2 LaSalle 1 (Days) |
 5 Retiring Cromby Station and Eddystone Units 1&2 • Cromby Station – Placed in service in 1954-55 – 144 MW coal and 201 MW oil/gas • Eddystone Station Units 1&2 – Placed in service in 1960 – 588 MW of coal capacity at units 1&2 – Units 3&4 (760 MW oil/gas) and 4 peaking units (60 MW) will continue to operate • Retirements yield ~$165-200 million incremental NPV vs. continuing to operate the
units – Avoids ongoing operating and capital costs on aging units – Cromby and Eddystone have not cleared in the past two RPM capacity auctions (2011/12 and 2012/13) – Anticipates more stringent environmental regulations and avoids related capital
investment • Working with PJM to ensure reliability is maintained when units are retired $80 $85 $40 Capital Expenditure Reduction $40 $18 $24 Incremental Pre-Tax Operating Income 45 22 0 Depreciation Savings 75 46 24 Operating O&M Savings $(80) $(50) $0 Revenue Net Fuel 2012 2011 2010 ($ in millions) Smaller, less efficient coal plants are challenged by economic and environmental considerations Ongoing Savings Impact |
 6 ComEd Building Strength Earned ROE 4% 6% 8% 10% 2008 2009 2010E ComEd executing on regulatory recovery plan resulting in healthy increases in earned ROE • Anticipate electric distribution rate filing in 2010 • ICC approved Illinois Power Agency’s 2010 procurement plan order; annual procurement event expected to take place in Spring 2010 • Significant improvement in earned ROE, from 5.5% in 2008 to 8.5% in 2009, targeting at least 10% in 2010 • Uncollectibles expense rider tariff approved by ALJ on January 14, with ICC approval expected in February 2010 |
 7 PECO Executing on Transition Plan • Targeting earned ROE of approximately 11% in 2010; 9-11% post- transition • Anticipate electric and gas distribution rate filings by end of 1Q10 • Selected as 1 of 6 utilities to receive maximum Federal stimulus award of $200 million for smart grid/smart meter investment • Act 129 Smart Meter Plan approved by the ALJ in January, approval expected by the PA PUC in 1Q10 • Two procurement events for post-2010 have been conducted, including 49% of residential 2011 load; next procurement in May 2010 PECO is managing through its transition period and is positioned for continued strong financial performance post-2010 |
 8 Nuclear Uprates - 1,300–1,500 MW of new Exelon nuclear capacity by 2017, the equivalent of a new nuclear plant at roughly half the cost of a new plant and no incremental operating costs - Approximately $725 million in investments to build smart grid infrastructure over the coming years with a regulated return on investment - Lowest carbon intensity in the sector, significant upside if and when legislation enacted or regulations promulgated, and enhancing industry-leading position with Exelon 2020 - Positioned to benefit from our fundamental view of recovery in natural gas and coal prices, heat rates, and demand growth - Leveraging transmission expertise to build Exelon Transmission Company with the goal of improving reliability, reducing congestion and moving renewable energy to population centers Deploying Capital for Shareholder Value Smart Grid Environmental Price Recovery Transmission |
 9 Midwest Price Recovery Update 9 • Last fall, we saw about $3-6/MWh of upside over NiHub ATC forward prices • Since then, we have seen an expansion in market implied heat rates, with NiHub prices
rising slightly despite small declines in gas prices – We have also seen a reduction in the NiHub-ADHub spread • Holding natural gas prices at current levels, we expect some additional increase in
NiHub ATC forward prices as the economy/load recovers and transmission
enhancements are completed Exelon will benefit as Midwest prices increase, moving closer to our fundamental view...2012 gross margin increases by ~$275 million for a $5/MWh increase in NiHub ATC NiHub Market Implied Heat Rate 4.75 5.00 5.25 5.50 5.75 6.00 6/30/09 7/30/09 8/30/09 9/30/09 10/30/09 11/30/09 12/30/09 Cal 2011 Cal 2012 Cal 2013 AEP-Dayton / NiHub ATC Energy Basis 0.00 2.00 4.00 6.00 8.00 10.00 12.00 14.00 16.00 2007 2008 2009 2010 2011 2012 2013 2014 Actuals PJM Oct '09 FTR Auction 6/30/2009 9/30/2009 12/31/2009 |
 10 2010 Events of Interest Q1 Q2 Q3 Q4 RPM Auction (May) Uncollectibles rider tariff (March) Illinois Power Agency RFP (spring) Illinois Primaries (2/2) Pennsylvania Primaries (5/18) Electric and gas distribution rate case filings (March) Procurement RFP (May, results in June) Procurement RFP (Sep., results in Oct.) Electric distribution rate case filing (tbd) |
 11 Appendix (As disclosed on January 22, 2010) |
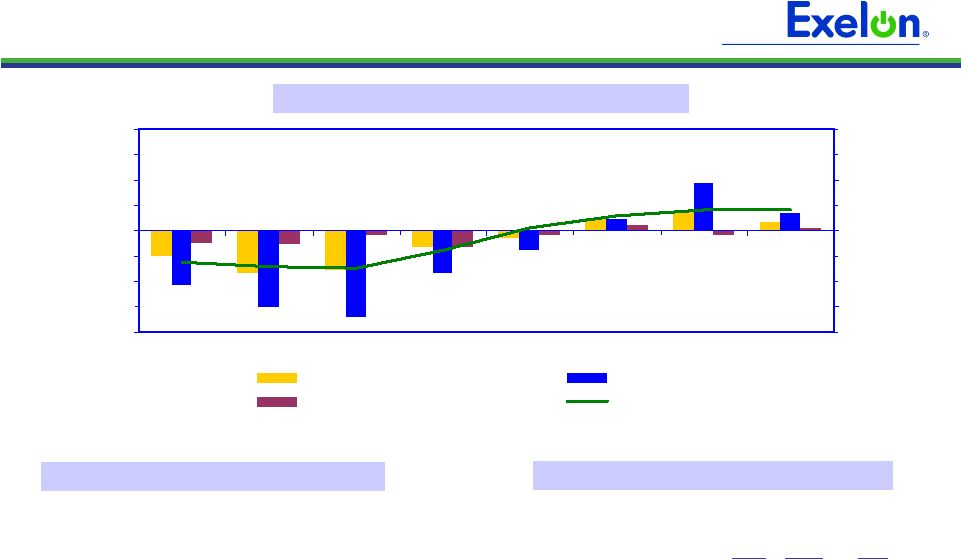 12 -10.0% -7.5% -5.0% -2.5% 0.0% 2.5% 5.0% 7.5% 10.0% 1Q09 2Q09 3Q09 4Q09 1Q10E 2Q10E 3Q10E 4Q10E -10.0% -7.5% -5.0% -2.5% 0.0% 2.5% 5.0% 7.5% 10.0% All Customer Classes Large C&I Residential Gross Metro Product ComEd Load Trends Weather-Normalized Load Key Economic Indicators Note: C&I = Commercial & Industrial Weather-Normalized Load Year-over-Year (4) Chicago U.S. Unemployment rate (1) 10.9% 10.0% 2009 annualized growth in gross domestic/metro product (2) (3.1)% (2.5)% 10/09 Home price index (3) (10.1)% (7.3)% (1) Source: Illinois Dept. of Employment Security (November 2009) and U.S.
Dept. of Labor (December 2009) (2) Source: Moody’s Economy.com (December 2009) (3) Source: S&P Case-Shiller Index (4) Not adjusted for leap year effect 4Q09 2009 (4) 2010E Customer Growth (0.5)% (0.4)% 0.1% Average Use-Per-Customer (1.1)% (1.0)% 0.0% Total Residential (1.6)% (1.4)% 0.0% Small C&I 0.1% (2.2)% 0.8% Large C&I (4.0)% (6.7)% 1.5% All Customer Classes (1.6)% (3.3)% 0.8% |
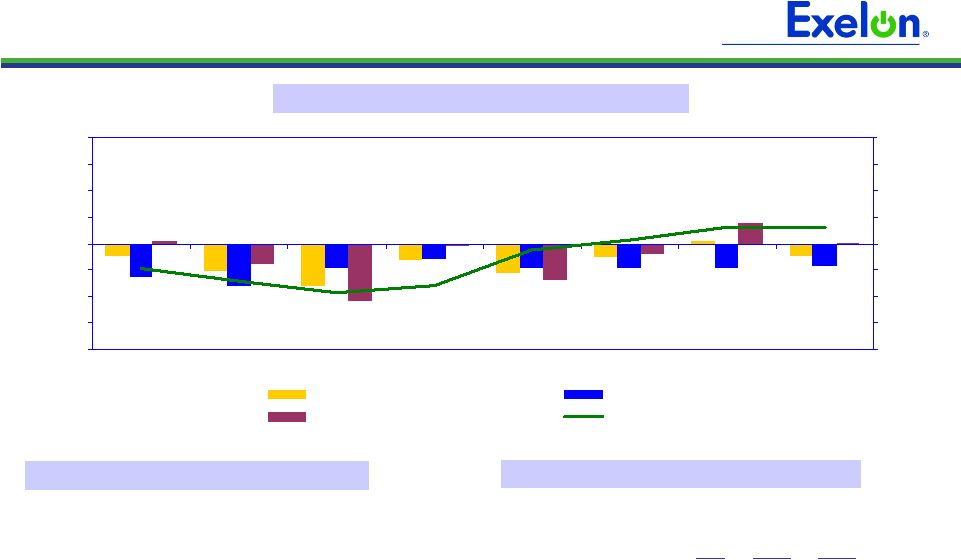 13 PECO Load Trends Weather-Normalized Electric Load Key Economic Indicators Weather-Normalized Load Year-over-Year (3) Philadelphia U.S. Unemployment rate (1) 8.5%
10.0% 2009 annualized growth in gross domestic/metro product (2) (3.6)%
(2.5)% (1) Source: U.S Dept. of Labor (PHL - November 2009, US – December 2009) (2) Source: Moody’s Economy.com (December 2009) (3) Not adjusted for leap year effect -10.0% -7.5% -5.0% -2.5% 0.0% 2.5% 5.0% 7.5% 10.0% 1Q09 2Q09 3Q09 4Q09 1Q10E 2Q10E 3Q10E 4Q10E -10.0% -7.5% -5.0% -2.5% 0.0% 2.5% 5.0% 7.5% 10.0% All Customer Classes Large C&I Residential Gross Metro Product Note: C&I = Commercial & Industrial 4Q09 2009 (3) 2010E Customer Growth (0.4)% (0.2)% (0.1)% Average Use-Per-Customer 0.2% (2.1)% (1.2)% Total Residential (0.2)% (2.3)% (1.3)% Small C&I (2.5)% (2.7)% (0.7)% Large C&I (1.4)% (3.0)% (2.4)% All Customer Classes (1.3)% (2.6)% (1.5)% |
 14 (1) Reflects operating O&M data and excludes decommissioning effect. ComEd and PECO operating O&M
exclude energy efficiency and smart meter costs recoverable under a rider. (2) Exelon Consolidated includes operating O&M expense from Holding Company. $4,500 $4,300 $4,350 $450 $415 $245 2008A 2009A 2010E Total O&M Pension/OPEB Expense Delivering on Cost Savings Commitments Holding O&M below 2008 levels for second consecutive year Committed to 2010 O&M target of $4.35 billion, offsetting inflation and $35 million
of higher pension and OPEB expense with additional cost savings • Reduced positions by 500 (400 in corporate support and 100 at ComEd) in 2009 • Freezing executive salaries and reducing other compensation benefits for 2010
Note: Data contained on this slide is rounded. $0.7 $0.6 PECO (1) $1.0 $1.0 ComEd (1) $2.7 $2.7 Generation 2010E 2009A $ billions ($ millions) (2) (2) (2) O&M Expense (1) |
 15 15 15 Exelon Generation Hedging Disclosures (As disclosed on January 22, 2010) |
 16 16 Important Information The following slides are intended to provide additional information regarding the hedging program at Exelon Generation and to serve as an aid for the purposes of modeling Exelon Generation’s gross margin (operating revenues less purchased power and fuel expense). The information on the following slides is not intended to represent earnings guidance or a forecast of future events. In fact, many of the factors that ultimately will determine Exelon Generation’s
actual gross margin are based upon highly variable market factors outside of our control.
The information on the following slides is as of December 31, 2009. Going forward, we plan to
update the information on a quarterly basis. Certain information on the following slides is based upon an internal simulation model that incorporates assumptions regarding future market conditions, including power and commodity prices, heat rates, and demand conditions, in addition to operating performance and dispatch characteristics of our generating fleet. Our simulation model and the assumptions therein are
subject to change. For example, actual market conditions and the dispatch profile of our
generation fleet in future periods will likely differ – and may differ significantly – from
the assumptions underlying the simulation results included in the slides. In addition, the
forward- looking information included in the following slides will likely change over time due
to continued refinement of our simulation model and changes in our views on future market
conditions. |
 17 17 Portfolio Management Objective Align Hedging Activities with Financial Commitments • Power Team utilizes several product types and channels to market • Wholesale and retail sales • Block products • Load-following products and load auctions • Put/call options • Exelon’s hedging program is designed to protect the long-term value of our generating fleet and maintain an investment-grade balance sheet • Hedge enough commodity risk to meet future cash requirements if prices drop • Consider: financing policy (credit rating objectives, capital structure, liquidity); spending (capital and O&M); shareholder value return policy • Consider market, credit, operational risk • Approach to managing volatility • Increase hedging as delivery approaches • Have enough supply to meet peak load • Purchase fossil fuels as power is sold • Choose hedging products based on generation portfolio – sell what we own • Heat rate options • Fuel products • Capacity • Renewable credits % Hedged High End of Profit Low End of Profit Open Generation with LT Contracts Portfolio Optimization Portfolio Management Portfolio Management Over Time |
 18 18 18 Percentage of Expected Generation Hedged • How many equivalent MW have been hedged at forward market prices; all hedge products used are converted to an equivalent average MW volume • Takes ALL hedges into account whether they are power sales or financial products Equivalent MWs Sold Expected Generation = • Our normal practice is to hedge commodity risk on a ratable basis over the three years leading to the spot market • Carry operational length into spot market to manage forced outage and
load-following risks • By using the appropriate product mix, expected generation hedged approaches the mid-90s percentile as the delivery period approaches • Participation in larger procurement events, such as utility auctions, and some
flexibility in the timing of hedging may mean the hedge program is not
strictly ratable from quarter to quarter Exelon Generation Hedging Program |
 19 19 19 2010 2011 2012 Estimated Open Gross Margin ($ millions) (1,2) $5,900 $5,800 $5,750 Open gross margin assumes all expected generation is sold at the Reference Prices listed below Reference Prices (1) Henry Hub Natural Gas ($/MMBtu) NI-Hub ATC Energy Price ($/MWh) PJM-W ATC Energy Price ($/MWh) ERCOT North ATC Spark Spread ($/MWh) (3) $5.79 $33.83 $48.04 $(0.53) $6.33 $34.75 $49.42 $(0.44) $6.53 $36.13 $50.43 $0.89 (1) Based on December 31, 2009 market conditions. (2) Gross margin is defined as operating revenues less fuel expense and purchased power
expense, excluding the impact of decommissioning and other incidental revenues. Open gross margin is estimated based upon an internal model that is developed by dispatching
our expected generation to current market power and fossil fuel prices. Open gross margin assumes there is no hedging in place other than fixed assumptions for capacity cleared in the RPM auctions and uranium costs for nuclear power plants. Open gross margin contains assumptions for other gross margin line items such as various ISO bill and
ancillary revenues and costs and PPA capacity revenues and payments. The estimation of open gross margin incorporates management discretion and modeling assumptions that are
subject to change. (3) ERCOT North ATC spark spread using Houston Ship Channel Gas, 7,200 heat rate, $2.50
variable O&M. Exelon Generation Open Gross Margin and Reference Prices |
 20 20 20 2010 2011 2012 Expected Generation (GWh) (1) 167,100 163,000 162,600 Midwest 99,000 98,400 97,400 Mid-Atlantic 59,600 57,200 56,600 South 8,500 7,400 8,600 Percentage of Expected Generation Hedged (2) 91-94% 69-72% 37-40% Midwest 89-92 71-74 43-46 Mid-Atlantic 93-96 65-68 25-28 South 97-100 66-69 39-42 Effective Realized Energy Price ($/MWh) (3) Midwest $46.50 $45.00 $46.00 Mid-Atlantic $35.50 $60.00 $53.50 ERCOT North ATC Spark Spread $(1.00) $(0.50) $(7.00) Generation Profile (1) Expected generation represents the amount of energy estimated to be generated or purchased through owned or
contracted for capacity. Expected generation is based upon a simulated dispatch model
that makes assumptions regarding future market conditions, which are calibrated to market quotes for power, fuel, load following products, and options. Expected generation assumes 10 refueling outages in 2010 and 11 refueling outages in 2011 and 2012 at
Exelon-operated nuclear plants and Salem. Expected generation assumes capacity factors of 93.5%, 92.8% and 92.8% in 2010, 2011 and 2012 at Exelon-operated nuclear plants. These
estimates of expected generation in 2011 and 2012 do not represent guidance or a forecast of
future results as Exelon has not completed its planning or optimization processes for those years. (2) Percent of expected generation hedged is the amount of equivalent sales divided by the expected
generation. Includes all hedging products, such as wholesale and retail sales of power, options, and swaps. Uses expected value on options. Reflects decision to permanently retire Cromby
Station and Eddystone Units 1&2 as of May 31, 2011, pending PJM approval. (3) Effective realized energy price is representative of an all-in hedged price, on a per MWh basis, at
which expected generation has been hedged. It is developed by considering the energy revenues and costs associated with our hedges and by considering the fossil fuel that has been purchased to
lock in margin. It excludes uranium costs and RPM capacity revenue, but includes the
mark-to-market value of capacity contracted at prices other than RPM clearing prices including our load obligations. It can be compared with the reference prices used to calculate open gross margin in order to determine the mark-to-market value of Exelon Generation's
energy hedges. |
 21 21 21 Gross Margin Sensitivities with Existing Hedges ($ millions) Henry Hub Natural Gas + $1/MMBtu - $1/MMBtu NI-Hub ATC Energy Price +$5/MWH -$5/MWH PJM-W ATC Energy Price +$5/MWH -$5/MWH Nuclear Capacity Factor +1% / -1% 2010 $40 $(40) $30 $(25) $20 $(15) +/- $50 2011 $190 $(160) $165 $(155) $135 $(130) +/- $50 2012 $395 $(395) $275 $(270) $230 $(230) +/- $50 Exelon Generation Gross Margin Sensitivities (with Existing Hedges) (1) Based on December 31, 2009 market conditions and hedged position. Gas price sensitivities are based on an
assumed gas-power relationship derived from an internal model that is updated
periodically. Power prices sensitivities are derived by adjusting the power price assumption while keeping all other prices inputs constant. Due to correlation of the various assumptions, the hedged gross margin impact calculated by
aggregating individual sensitivities may not be equal to the hedged gross margin impact
calculated when correlations between the various assumptions are also considered. (1) |
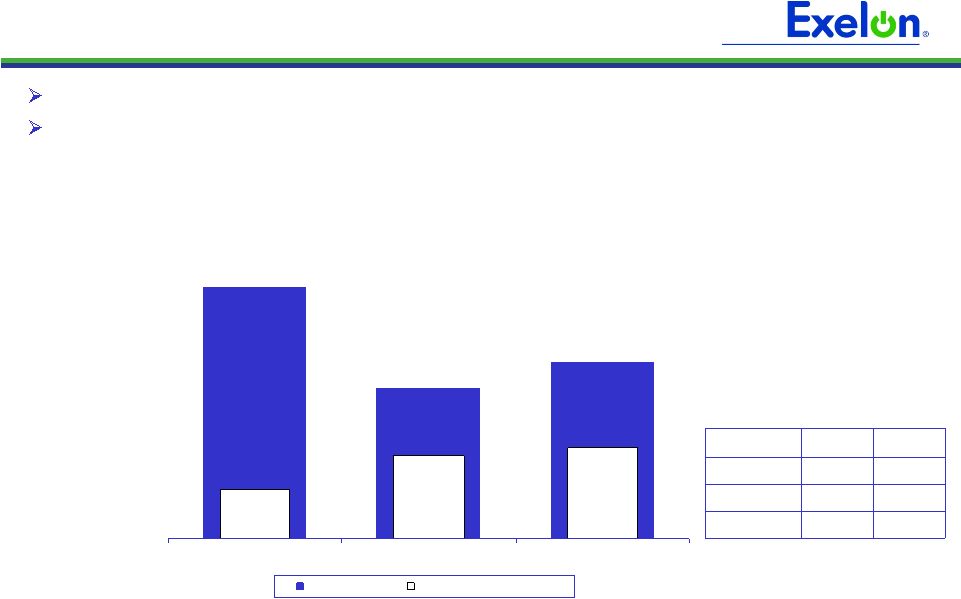
 22 22 22 95% case 5% case $6,500 $6,100 $4,800 $7,800 $6,200 $8,000 Exelon Generation Gross Margin Upside / Risk (with Existing Hedges) $3,000 $4,000 $5,000 $6,000 $7,000 $8,000 $9,000 2010 2011 2012 (1) Represents an approximate range of expected gross margin, taking into account hedges in place, between the
5th and 95th percent confidence levels assuming all unhedged supply is sold into the spot
market. Approximate gross margin ranges are based upon an internal simulation model and are subject to change based upon market inputs, future transactions and potential modeling changes. These ranges of approximate gross margin in 2011 and 2012 do not represent
earnings guidance or a forecast of future results as Exelon has not completed its planning or
optimization processes for those years. The price distributions that generate this range are calibrated to market quotes for power, fuel, load following products, and options as of December 31, 2009. |
 23 23 23 Midwest Mid-Atlantic ERCOT Step 1 Start with fleetwide open gross margin $5.90 billion Step 2 Determine the mark-to-market value of energy hedges 99,000GWh * 90% * ($46.50/MWh-$33.83/MWh) = $1.13 billion 59,600GWh * 94% * ($35.50/MWh-$48.04/MWh) = $(0.70 billion) 8,500GWh * 98% * ($(1.00)/MWh- $(0.53)/MWh) = $0.00 billion Step 3 Estimate hedged gross margin by adding open gross margin to mark-to- market value of energy hedges Open gross
margin: $5.90 billion MTM value of energy
hedges: $1.13 billion + $(0.70 billion) + $0.00 billion Estimated hedged gross margin:
$6.33 billion Illustrative Example of Modeling Exelon Generation 2010 Gross Margin (with Existing Hedges) |
 24 24 24 24 24 24 50 55 60 65 70 75 80 85 90 1/09 2/09 3/09 4/09 5/09 6/09 7/09 8/09 9/09 10/09 11/09 12/09 1/10 20 25 30 35 40 45 50 55 1/09 2/09 3/09 4/09 5/09 6/09 7/09 8/09 9/09 10/09 11/09 12/09 1/10 35 40 45 50 55 60 65 70 75 80 85 1/09 2/09 3/09 4/09 5/09 6/09 7/09 8/09 9/09 10/09 11/09 12/09 1/10 5 5.5 6 6.5 7 7.5 8 8.5 9 1/09 2/09 3/09 4/09 5/09 6/09 7/09 8/09 9/09 10/09 11/09 12/09 1/10 24 Market Price Snapshot Forward NYMEX Natural Gas PJM-West and Ni-Hub On-Peak Forward Prices PJM-West and Ni-Hub Wrap Forward Prices 2011 $6.14 2012 $6.33 Rolling 12 months, as of January 28, 2010. Source: OTC quotes and electronic trading
system. Quotes are daily. Forward NYMEX Coal 2011 $65.24 2012 $72.30 2011 Ni-Hub $42.77 2012 Ni-Hub $43.25 2012 PJM-West $57.40 2011 PJM-West $56.92 2011 Ni-Hub $24.01 2012 Ni-Hub $26.25 2012 PJM-West $40.64 2011 PJM-West $39.95 |
 25 25 25 25 25 25 5.5 6.5 7.5 8.5 9.5 10.5 11.5 12.5 13.5 1/09 2/09 3/09 4/09 5/09 6/09 7/09 8/09 9/09 10/09 11/09 12/09 1/10 8 8.2 8.4 8.6 8.8 9 9.2 9.4 9.6 9.8 10 1/09 2/09 3/09 4/09 5/09 6/09 7/09 8/09 9/09 10/09 11/09 12/09 1/10 40 45 50 55 60 65 70 75 80 1/09 2/09 3/09 4/09 5/09 6/09 7/09 8/09 9/09 10/09 11/09 12/09 1/10 5 5.5 6 6.5 7 7.5 8 8.5 9 1/09 2/09 3/09 4/09 5/09 6/09 7/09 8/09 9/09 10/09 11/09 12/09 1/10 25 Market Price Snapshot 2012 $9.00 2011 $8.71 2011 $52.44 2012 $55.98 2011 $6.02 2012 $6.22 Houston Ship Channel Natural Gas Forward Prices ERCOT North On-Peak Forward Prices ERCOT North On-Peak v. Houston Ship Channel Implied Heat Rate 2011 $6.49 2012 $8.62 ERCOT North On Peak Spark Spread Assumes a 7.2 Heat Rate, $1.50 O&M, and $.15 adder Rolling 12 months, as of January 28, 2010. Source: OTC quotes and electronic trading
system. Quotes are daily. |
 26 Exelon Investor Relations Contacts Exelon Investor Relations 10 South Dearborn Street Chicago, Illinois 60603 312-394-2345 312-394-4082 (Fax) For copies of other presentations, annual/quarterly reports, or to be added to our email distribution list please contact: Martha Chavez, Executive Admin Coordinator 312-394-4069 Martha.Chavez@ExelonCorp.com Investor Relations Contacts: Karie Anderson, Vice President 312-394-4255 Karie.Anderson@ExelonCorp.com Stacie Frank, Director 312-394-3094 Stacie.Frank@ExelonCorp.com Paul Mountain, Manager 312-394-2407 Paul.Mountain@ExelonCorp.com Marybeth Flater, Manager 312-394-8354 Marybeth.Flater@ExelonCorp.com |