Attached files
| file | filename |
|---|---|
| 8-K - DYNEGY INC. | presentation8k.htm |

2010
Credit Suisse Energy Summit
February
2, 2010
Investor
Relations | Norelle Lundy,
Vice
President | Laura
Hrehor,
Senior Director | 713-507-6466 | ir@dynegy.com

• This presentation
contains statements reflecting assumptions, expectations, projections,
intentions or beliefs
about future events that are intended as “forward-looking statements.” You can identify these statements,
including those relating to Dynegy’s 2009 and 2010 financial estimates, by the fact that they do not relate
strictly to historical or current facts. Management cautions that any or all of Dynegy’s forward-looking
statements may turn out to be wrong. Please read Dynegy’s annual, quarterly and current reports under the
Securities Exchange Act of 1934, including its 2008 Form 10-K, as supplemented, and first, second and third
quarter 2009 Forms 10-Q for additional information about the risks, uncertainties and other factors affecting
these forward-looking statements and Dynegy generally. Dynegy’s actual future results may vary materially
from those expressed or implied in any forward-looking statements. All of Dynegy’s forward-looking
statements, whether written or oral, are expressly qualified by these cautionary statements and any other
cautionary statements that may accompany such forward-looking statements. In addition, Dynegy disclaims
any obligation to update any forward-looking statements to reflect events or circumstances after the date
hereof.
• Non-GAAP Financial
Measures: This
presentation contains non-GAAP financial measures including EBITDA,
Adjusted EBITDA, Adjusted Cash Flow from Operations, Adjusted Free Cash Flow, Net Debt and Adjusted
Gross Margin. Reconciliations of these measures to the most directly comparable GAAP measures to the
extent available without unreasonable effort are contained herein. To the extent required, statements
disclosing the utility and purposes of these measures are set forth in Item 2.02 to our Current Report on
Form 8-K filed with the SEC on November 5, 2009, which is available on our website free of charge,
www.dynegy.com.
Forward-looking
Statements
2
3
Dynegy
at a Glance
|
Generation
Capacity
|
~12,500
MW
|
|
2010
Adjusted EBITDA (2)
|
$ 425 - 550
MM
|
|
2010
Adjusted Cash Flow from Ops (2)
|
$ (15) - 110
MM
|
|
2010
Adjusted Free Cash Flow (2)
|
$ (360) -
(235) MM
|
|
Market Cap
(1)
|
$ 1.07
B
|
|
Share price
(1)
|
$
1.81
|
|
Shares
outstanding
|
~595
MM
|
|
(1)
As of December 31, 2009. (2) Forecasted estimates provided on November 5,
2009.
|
|
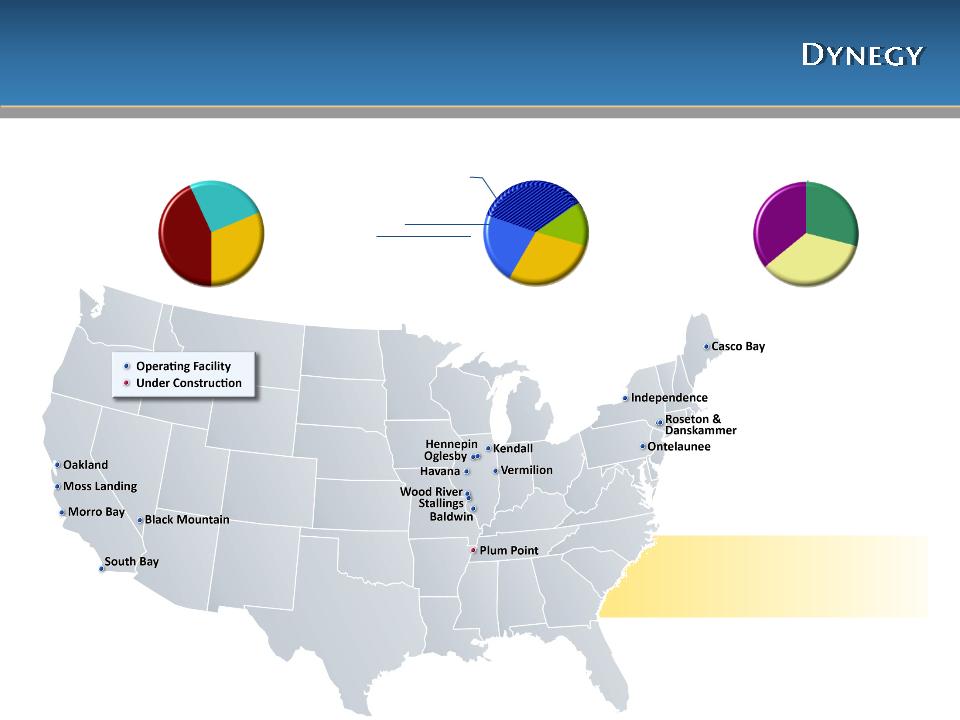
Dynegy
provides wholesale power, capacity and ancillary
services to utilities,
cooperatives, municipalities and other energy companies in key U.S. regions
cooperatives, municipalities and other energy companies in key U.S. regions
Midwest
5,575
MW
10
facilities
Regional
Overview
4
Dynegy’s
~12,500 MW portfolio is focused in 3 regions
Primarily
low-cost baseload coal and efficient CCGTs
well-positioned in generation dispatch order
well-positioned in generation dispatch order
Dynegy’s Midwest
region represents
~40% of generation capacity, but
contributes ~65% of Adjusted EBITDA
~40% of generation capacity, but
contributes ~65% of Adjusted EBITDA
West
Diverse
fuels and dispatch type
Primarily
natural gas-fired facilities
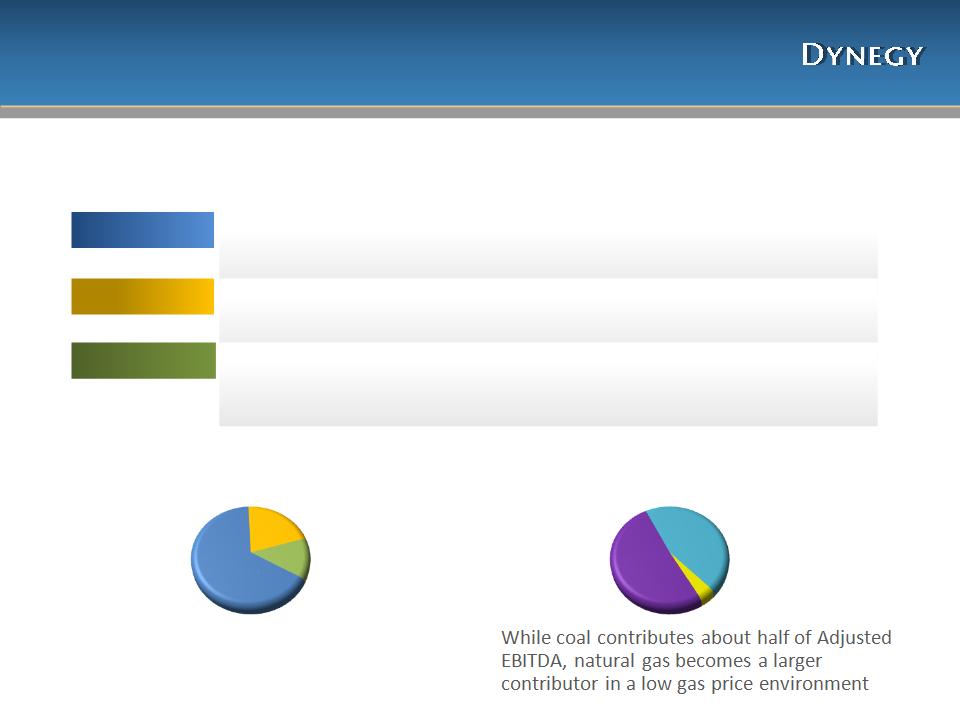
Adjusted
EBITDA by Region
Northeast
~15%
West
~20%
Midwest
~65%
Adjusted
EBITDA by Fuel Type
Other
~5%
Gas
~45%
Coal
~50%
3,696
MW
5
facilities
3,282
MW
4
facilities
Northeast

5
We
Believe Long Term Industry
Fundamentals Remain Strong
Fundamentals Remain Strong
§ Power markets
should tighten
§ Natural gas prices
should rise,
increasing power prices
increasing power prices
§ Newer, more
efficient units could push
older generation into retirement
older generation into retirement
§ Development trends
point to emphasis
on renewables - however, cost is high
and grid infrastructure remains an issue
on renewables - however, cost is high
and grid infrastructure remains an issue
§ Industry
consolidation could provide
synergies leading to shareholder value
synergies leading to shareholder value
§ Power prices
remain weak
§ Natural gas prices
remain volatile
§ New power
generation will come online
at a slower rate due to barriers to entry
such as:
at a slower rate due to barriers to entry
such as:
– Depressed capital
markets
– Uncertainty around
Cap & Trade and other
environmental regulation & legislation
environmental regulation & legislation
– Low power prices,
making it difficult to
justify returns
justify returns
Near
Term Expectations
Long
Term Expectations
Power
generation remains cyclical - the recent downward trend is
expected to reverse over time as supply/demand tightens
expected to reverse over time as supply/demand tightens
•Near
term,
Dynegy will continue to focus on operating and commercializing well
and on maintaining ample liquidity
and on maintaining ample liquidity
•Longer
term,
Dynegy’s ability to harvest value will center around capitalizing on
expected stronger power prices and demand
expected stronger power prices and demand
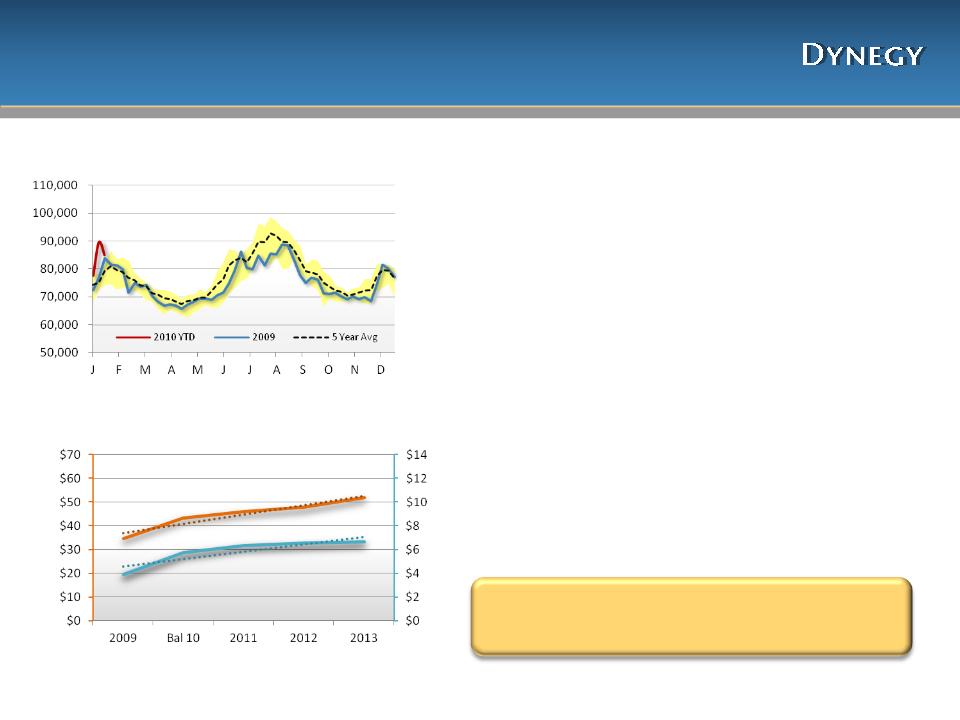
• 2009 U.S. electric
demand was down ~4%, but
remained within the 5 year average range
remained within the 5 year average range
• 2010 may continue
to be a challenging business
environment with commodity prices
remaining volatile as markets begin to recover
environment with commodity prices
remaining volatile as markets begin to recover
• Weather spikes, as
seen in January 2010,
represent opportunities to capture
incremental value
represent opportunities to capture
incremental value
• U.S. electricity
demand is projected to increase
over the next two years
over the next two years
• Despite ongoing
volatility, commodity prices
are beginning to trend upward
are beginning to trend upward
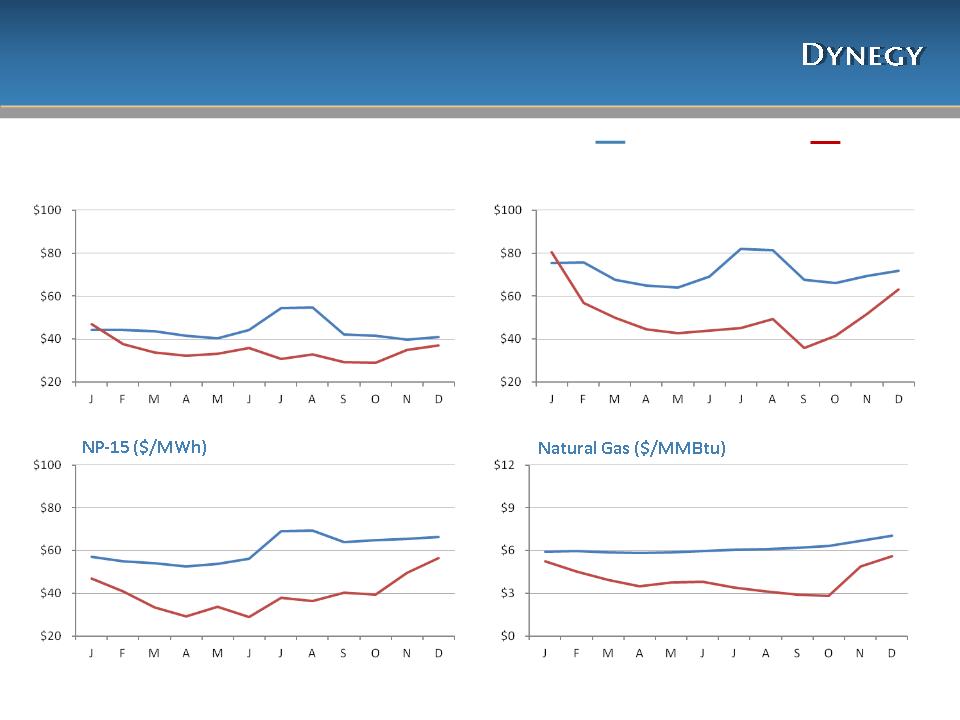
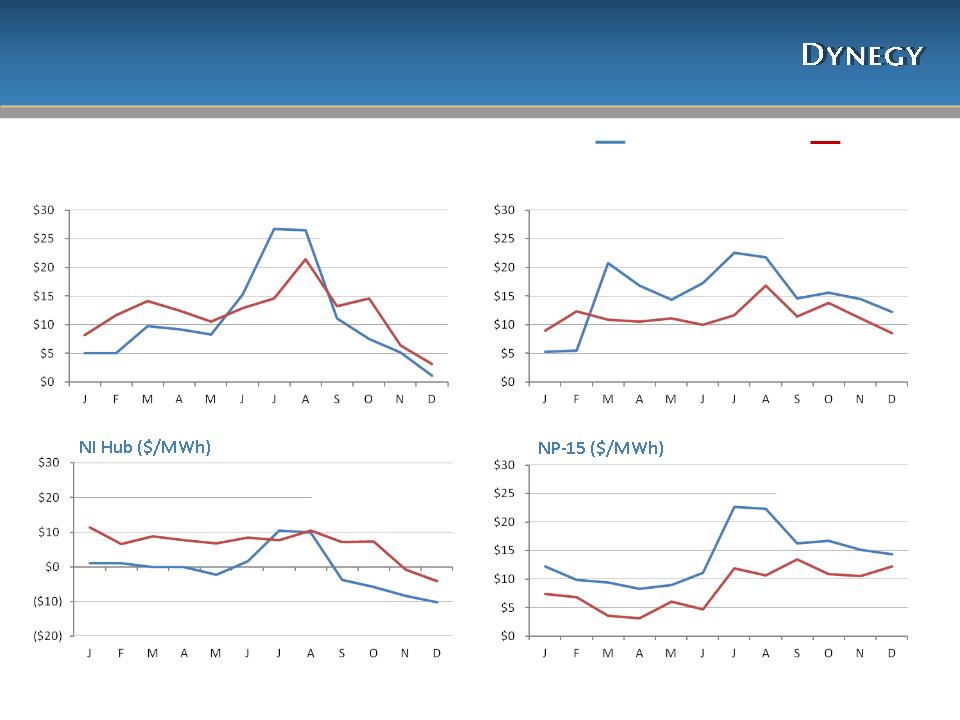
Dynegy
Expects Commodity Prices
to Rise Long Term
to Rise Long Term
6
Natural
Gas & Power Prices
CIN
Hub On-Peak ($/MWh)
Natural
Gas ($/MMBtu)
Note:
Generation
as of 1/16/10 from EEI.
Pricing
as of 1/11/10, reflect actual day ahead on-peak settlement prices and quoted
forward on-peak monthly prices.
Source:
Brokered market indicators
U.S.
Electric Generation (GWh)
We
believe long term power industry
fundamentals remain strong
fundamentals remain strong
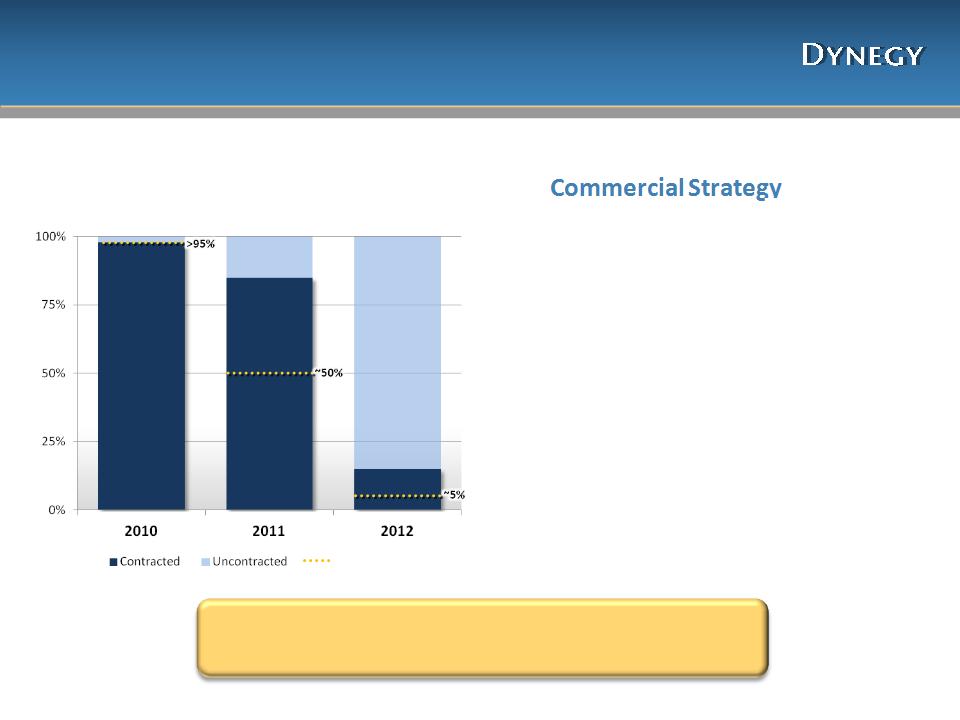
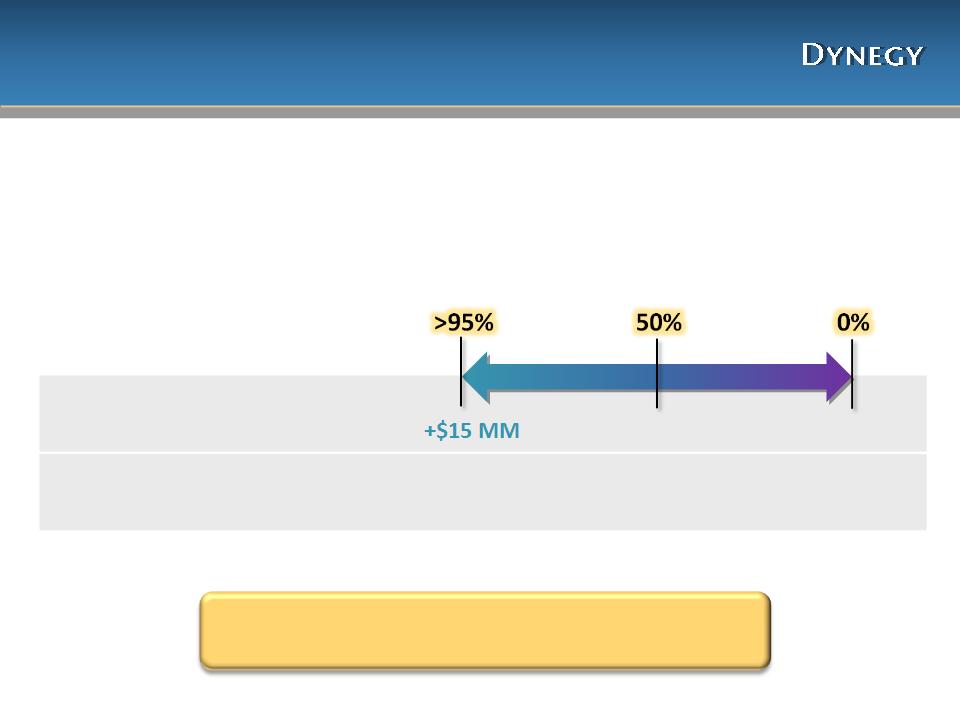
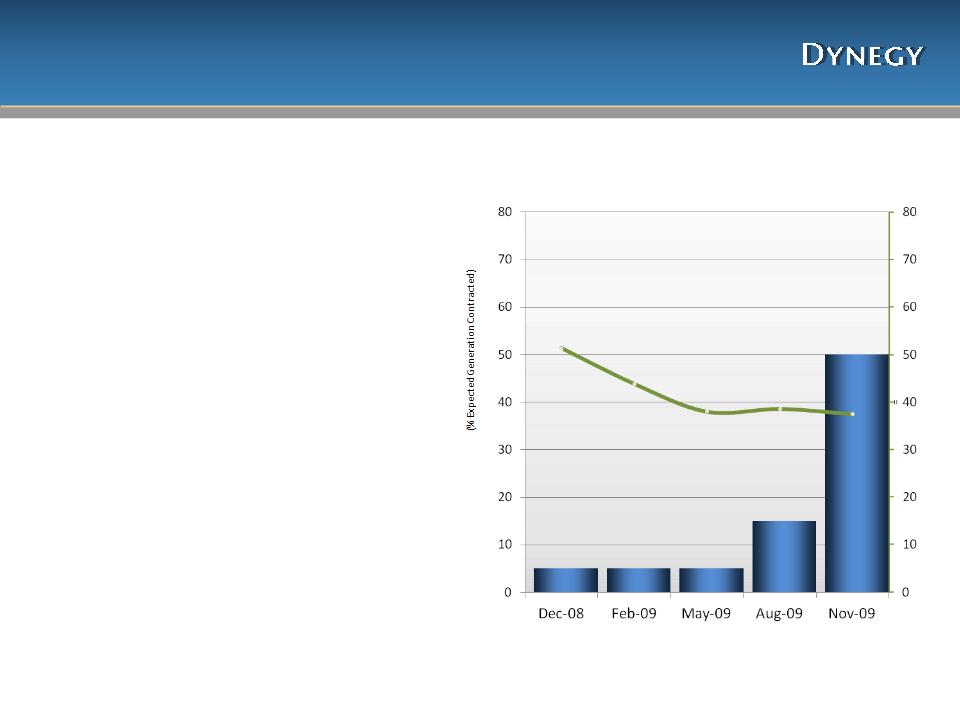
Contracted
Percentage of Expected
Generation Volumes (% of MWh)
Generation Volumes (% of MWh)
~85%
>95%
7
Near
to intermediate term view:
• Dynegy is focused
on increased
predictability of earnings and cash
flow while also protecting against
downside risk
predictability of earnings and cash
flow while also protecting against
downside risk
Long
term view:
• Staying relatively
uncontracted in
outer years should provide
opportunities to capture value in a
fundamentally rising price
environment as supply/demand
tightens
outer years should provide
opportunities to capture value in a
fundamentally rising price
environment as supply/demand
tightens
Dynegy’s Commercial Strategy
Reflects Long Term Industry Fundamentals
Maintaining
long term market upside potential
while protecting against downside risks
while protecting against downside risks
Note:
As
of 1/11/10 and reflects the impact of assets sold to LS Power.
~15%
Level
as of 11/5/09
Beyond
“Current +1/+2”, results will be more sensitive to commodity price
movements as these years are less hedged
movements as these years are less hedged
Commercial
Strategy Works
to Capture Value around Assets
to Capture Value around Assets
8
%
Expected Generation Contracted:
+$70
MM
+$165
MM
Impact
to Adjusted EBITDA of
+$1.00/MMBtu Natural Gas:
+$1.00/MMBtu Natural Gas:
$(15)
MM
$(70)
MM
$(165)
MM
Impact
to Adjusted EBITDA of
-$1.00/MMBtu
Natural Gas:
Note:
Other
events and variables can impact results materially. See
Appendix for other sensitivities.
Baseload
and intermediate assets positioned
to capture the most value as markets recover
to capture the most value as markets recover
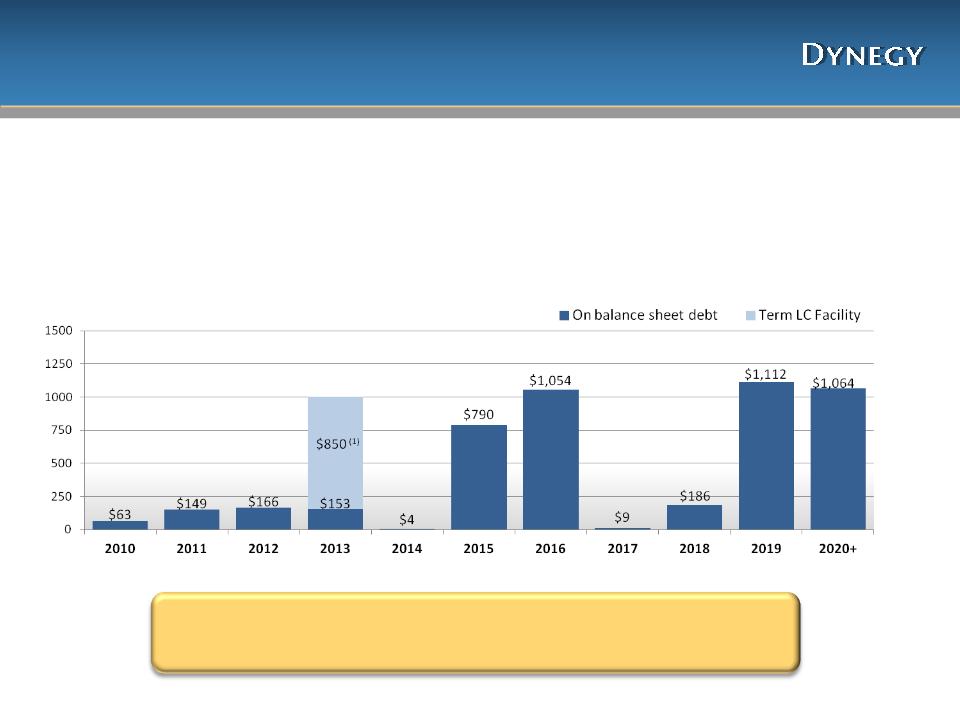
Dynegy’s
Capital Structure
Complements Our Commercial Strategy
Complements Our Commercial Strategy
9
Debt
Maturity Profile (As of 12/31/09,
$MM)
Total
balance sheet debt = ~$5.6 B
$1,003
(1)
Synthetic
Letter of Credit facility is supported by $850 million of restricted
cash.
Dynegy
has minimal near-term debt maturities and
sufficient liquidity to commercialize positions
sufficient liquidity to commercialize positions
In
2009, Dynegy successfully executed our Liability Management Plan
•Reducing debt by
$830 million with no significant maturities until 2015
•Maintaining
liquidity of ~$2.0 billion to support our commercial
strategy
10
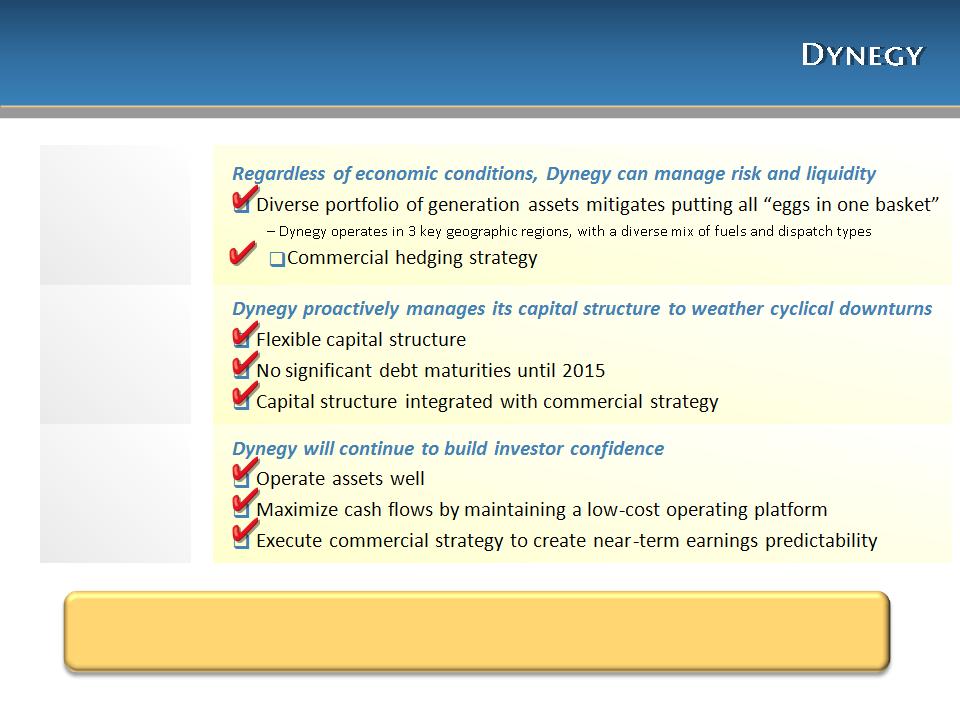
What
Makes a Long-Term Value Play?
|
Ability
to
manage risk |
|
|
|
Prudent
financial management |
|
|
|
Investor
confidence |
|
By
operating and commercializing well today, Dynegy believes it will
be
positioned to capture value as markets improve over the longer term
positioned to capture value as markets improve over the longer term

Appendix
12,553
MW
Dynegy’s
Diversified Asset Portfolio
Note:
Plum Point is currently under construction.
Dispatch
Diversity
Peaking
36%
Intermediate
35%
Baseload
29%
Geographic
Diversity
Midwest
44%
Northeast
26%
West
30%
Fuel
Diversity
Combined
Cycle
35%
Peaking
22%
Total
Gas-fired
57%
Coal
29%
Fuel
Oil
14%
12

2010
Commodity Pricing Assumptions
13
*
Represents annual average based on 10/6/09 pricing.
|
|
2010E*
|
|
|
Natural
Gas - Henry Hub
($/MMBtu)
|
$
6.15
|
|
|
|
|
|
|
On-Peak
Power
($/MWh)
|
|
Facilities
|
|
NI Hub /
ComEd
|
$42.95
|
Kendall
|
|
PJM
West
|
$59.25
|
Ontelaunee
|
|
Cinergy
|
$44.32
|
Midwest
Coal
|
|
NY - Zone
C
|
$53.62
|
Independence
|
|
NY - Zone
G
|
$71.24
|
Roseton,
Danskammer
|
|
NE - Mass
Hub
|
$66.11
|
Casco
Bay
|
|
NP-15 -
California
|
$60.65
|
Moss
Landing, Morro Bay, Oakland
|
|
SP-15 -
California
|
$58.90
|
South
Bay
|
|
|
|
|
|
Coal
($/MMBtu)
|
|
|
|
Powder River
Basin (PRB) delivered
|
$1.49
|
Baldwin
|
|
South
American delivered to Northeast
|
$3.55
|
Danskammer
|
|
|
|
|
|
Fuel
Oil #6 delivered to Northeast
($/MMBtu)
|
$10.97
|
Roseton
|
As
presented November 5, 2009

14
Tax
and Other Assumptions
Tax
Assumptions
–Tax expense
accrues at ~40%; expect to pay
state cash tax payments of ~$2 million
state cash tax payments of ~$2 million
–Dynegy not
expected to become a
significant cash tax payer until well into the
future
significant cash tax payer until well into the
future
Other
Assumptions
– Commodity pricing
assumes
$6.15/MMBtu natural gas
$6.15/MMBtu natural gas
– ~$50 million
annual amortization
expense included in Northeast Adjusted
EBITDA through 2014 related to ConEd
contract; annual capacity payment
received of ~$100 million
expense included in Northeast Adjusted
EBITDA through 2014 related to ConEd
contract; annual capacity payment
received of ~$100 million
– Shares outstanding
~595 MM
As
presented November 5, 2009

2010
Guidance Estimates
15
Note:
Guidance estimates are forward-looking in nature; actual results may vary
materially from these estimates. (1)
Based on 2010 forward natural gas prices of $6.15/MMBtu as of 10/6/09.
(2)
Interest
payments could change based on outcome of ultimate Liability Management Program.
payments could change based on outcome of ultimate Liability Management Program.
|
($MM)
|
|
11/5/2009
Guidance(1)
|
|
Adjusted
Gross Margin
|
|
$
1,055 - 1,180
|
|
Operating
Expenses
|
|
(495)
|
|
G&A /
Interest income / Other
|
|
(135)
|
|
Adjusted
EBITDA
|
|
$ 425
- 550
|
|
Interest
payments (2)
|
|
(380)
|
|
Working
capital / Non-cash adjustments / Cash taxes / Other
|
|
(60)
|
|
Adjusted
cash flow from operations
|
|
$ (15)
- 110
|
|
Maintenance
capital expenditures
|
|
(120)
|
|
Environmental
capital expenditures
|
|
(200)
|
|
Capitalized
Interest
|
|
(25)
|
|
Adjusted
free cash flow
|
|
$ (360)
- (235)
|
|
Table
above is not intended as a GAAP reconciliation; reconciliation located in
the Appendix.
|
|
|
|
2010
Guidance - GAAP Measures
|
($MM)
|
||
|
Net
loss
|
|
$
|
(250) -
(175)
|
|
Net cash
used and provided by operating activities
|
|
$
|
(15) -
110
|
|
Net cash
used by investing activities
|
|
$
|
(345)
|
|
Net cash
used by financing activities
|
|
$
|
(65)
|
As
presented November 5, 2009
($/MMBtu)
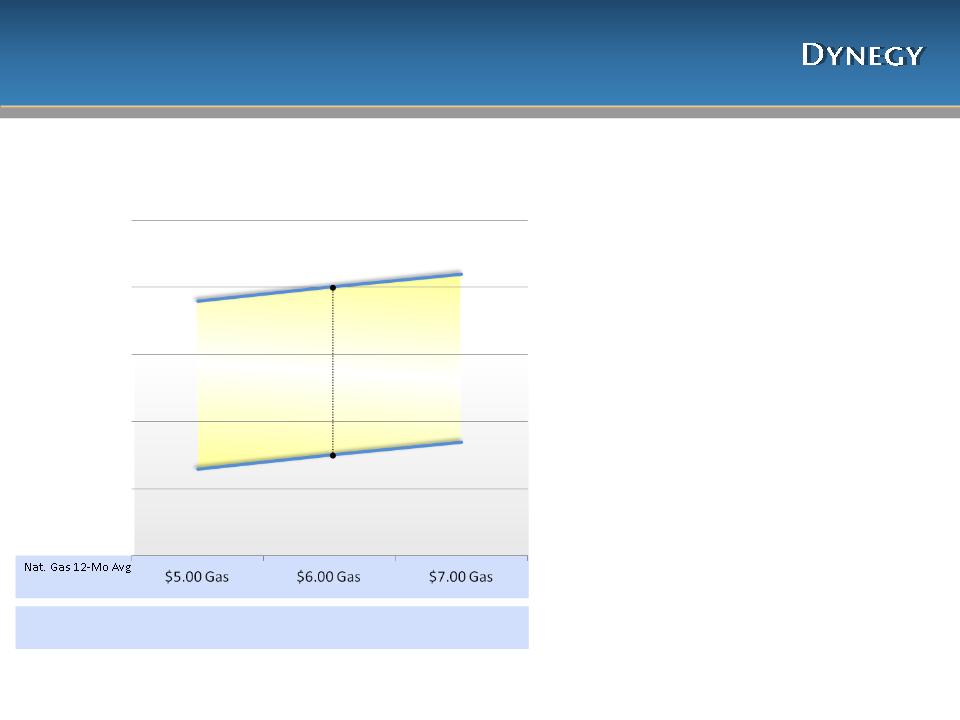
Adjusted
2010 EBITDA Sensitivities
16
Note:
Sensitivities reflect >95% of expected generation contracted on a
consolidated basis. 11/5/09
guidance ranges based on 2010 forward natural gas prices of $6.15/MMBtu as of
10/6/09.
$550
MM
$425
MM
• Expected range of
Adjusted EBITDA
for 2010 continues to be sensitive to
several factors
for 2010 continues to be sensitive to
several factors
• The horizontal
X-axis represents possible
changes in natural gas prices
changes in natural gas prices
– As percentage of
expected generation
contracted goes up, sensitivity decreases
contracted goes up, sensitivity decreases
• The vertical
Y-axis represents the possible
impacts of various other factors:
impacts of various other factors:
– Volatility of
commodity prices
– Basis
differentials
– Capacity
prices
– Unplanned
outages
• Often events and
variables are
interrelated and individual sensitivities
are not always additive
interrelated and individual sensitivities
are not always additive
$35.00
$42.00
$49.00
CIN
Hub On-Peak
($/MWh)
$600
$550
$500
$450
$400
Anticipated
Range for
2010
Adjusted EBITDA ($MM)
$6.15 Gas
As
presented November 5, 2009

Natural
Gas Sensitivity
Primarily Impacts Baseload Coal
Primarily Impacts Baseload Coal
17
• Sensitivities
based on full-year estimates and assume natural gas price change
occurs for the entire year and entire portfolio
occurs for the entire year and entire portfolio
– On-peak power
prices are adjusted by holding the spark spread constant to a
7,000 Btu/KWh heat rate
7,000 Btu/KWh heat rate
– Off-peak prices
are adjusted holding the market implied heat rate constant
Note:
Uncontracted
portfolio for longer term assumed for illustrative purposes only.
|
|
Adjusted
EBITDA Sensitivity ($MM)
|
|
|
Change in
Cost of Natural Gas
($/MMBtu) |
2010 >95%
Contracted
|
Longer Term
Uncontracted
|
|
+
$2.00
|
$
30
|
$
340
|
|
+
$1.00
|
$
15
|
$
165
|
|
-
$1.00
|
$
(15)
|
$
(165)
|
As
presented November 5, 2009

18
|
2010
with >95% Contracted
|
|||
|
Market
Implied
Heat Rate Movement (Btu/KWh) |
Generation
Adjusted EBITDA Sensitivity
($MM) |
||
|
Coal/Fuel
Oil
|
Natural
Gas
|
TOTAL
|
|
|
+
1,000
|
$-
|
$20
|
$20
|
|
+
500
|
$-
|
$10
|
$10
|
|
-
500
|
$-
|
$(5)
|
$(5)
|
• Sensitivities
based on “on-peak” power price changes and full-year estimates
• Assumes constant
natural gas price of ~$6.15/MMBtu and heat rate changes are for a full
year
• Increased run-time
will result in increased maintenance costs, which are not included in
sensitivities
sensitivities
Market
Implied Heat Rate
Sensitivities Impact Entire Fleet
Sensitivities Impact Entire Fleet
Note:
Spark
spread value changes depend on natural gas price assumptions. Uncontracted
portfolio for longer term assumed for illustrative purposes only.
|
Longer-Term:
Uncontracted
|
|||
|
Market
Implied
Heat Rate Movement (Btu/KWh) |
Generation
Adjusted EBITDA Sensitivity
($MM) |
||
|
Coal/Fuel
Oil
|
Natural
Gas
|
TOTAL
|
|
|
+
1,000
|
$15
|
$120
|
$135
|
|
+
500
|
$5
|
$60
|
$65
|
|
-
500
|
$(5)
|
$(55)
|
$(60)
|
As
presented November 5, 2009

• Midwest
– 2010 Plan assumes
average generation to CIN Hub basis of
$(5.50)/MWh
$(5.50)/MWh
– 2010 Plan assumes
Midwest volumes of ~25 MM MWh
– +/- $1.00/MWh
change in basis = +/- $25 million impact to Adjusted
EBITDA on a full year basis
EBITDA on a full year basis
• Northeast
– 2010 Plan assumes
average Casco Bay generation to Mass Hub basis of
$(4.50)/MWh on peak and $(2.75)/MWh off peak
$(4.50)/MWh on peak and $(2.75)/MWh off peak
– 2010 Plan assumes
Casco Bay volumes of ~2 MM MWh
– +/- $1.00/MWh
change in basis = +/- $2 million impact to Adjusted
EBITDA on a full year basis
EBITDA on a full year basis
Basis Sensitivities
19
As
presented November 5, 2009

• 2010 Guidance
assumes:
– As of 10/6/09, the
weighted average unsold MISO capacity of 2,066 MW
– Average capacity
price of $0.58/KW-Mo (using 10/6/09 pricing)
– Current value of
unsold MISO capacity in 2010 Plan = ~$14 million
– Change in price
and volumes can alter capacity revenue
Midwest
Capacity Price Sensitivities
20
As
presented November 5, 2009
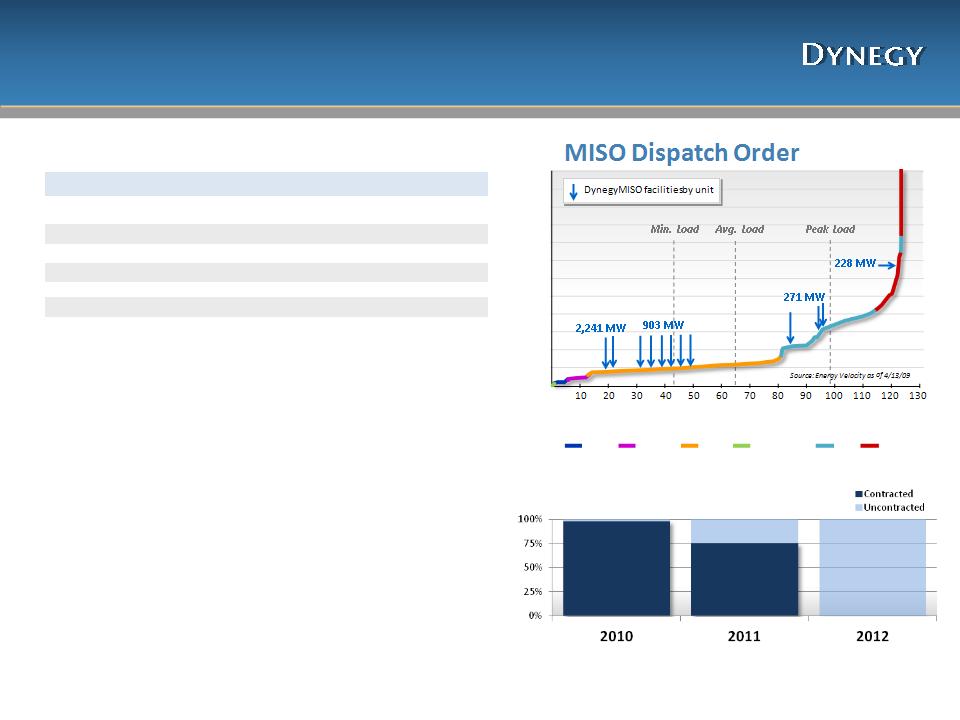
21
Midwest
- Well-Positioned
Baseload Coal & Efficient CCGTs
Baseload Coal & Efficient CCGTs
|
Generation
Volumes
|
~25 MM
MWh
|
|
($MM)
|
|
|
Adjusted
Gross Margin (1)
|
$
585 - 680
|
|
Operating
Expenses (2)
|
(215)
|
|
Adjusted
EBITDA(1)
|
$
370 - 465
|
|
|
|
|
Operating
Income
|
$
30 - 125
|
|
Price:
|
• CIN Hub
power price for MISO fleet
• Spark
spreads for Kendall and Ontelaunee
• Coal
generally has been setting the marginal price of
power in MISO ~80-85% of the time in a low natural gas environment and reduced demand • Natural gas
sets the marginal price of power in PJM
|
|
Cost:
|
• Low cost PRB
coal and rail contracts 100% contracted/
priced for 2010 • 2010 Average
Delivered PRB to Baldwin is
$1.49/MMBtu • Operating
expense incorporates impact of investing in
pollution control equipment |
|
Watch:
|
• Track CIN
Hub to IL Hub basis differentials
• Capacity
markets in MISO
• Potential
carbon and other new environmental
regulation |
>95%
~75%
~0%
Note:
Additional
regional data provided in the Appendix. (1)
Adjusted Gross Margin and
Adjusted EBITDA are non-GAAP financial measures. Reconciliations of these measures to
the most directly comparable GAAP measure are included in the Appendix. (2) Operating
Expenses exclude depreciation and amortization.
Adjusted EBITDA are non-GAAP financial measures. Reconciliations of these measures to
the most directly comparable GAAP measure are included in the Appendix. (2) Operating
Expenses exclude depreciation and amortization.
Hedging
Profile as of
1/11/10
Hydro
Nuclear
Coal
Renewables
Gas
Oil
$240
220
200
180
160
140
120
100
80
60
40
20
0
Cumulative
Capacity GW
Regional
Performance Drivers
Regional
Estimates as of
11/5/09 2010E
$/MWh
22
Midwest
Generation - Primarily Baseload Coal
Midwest
Forecast ($MM)
2010
Coal
$ 250
- 325
Combined
Cycle
105 -
120
Peaking/Other
(1)
15 -
20
Adjusted
EBITDA
$ 370
- 465
Operating
Income
$ 30
- 125
Forecasted
Fundamentals 2010
Volumes
(MM
MWh)
24.9
Fleet
Heat
Rate (2)
Rate (2)
(Nameplate
Btu/KWh)
Btu/KWh)
Baseload
10,000 -
11,000
CC
7,000
- 8,000
Peaking
10,000 -
12,000
Delivered PRB Coal
(Baldwin)
$1.49/MMBtu
Delivered Natural
Gas
(TET M-3 + $0.05)
(TET M-3 + $0.05)
$6.96/MMBtu
Delivered Natural
Gas
(CHI CG + $0.10)
(CHI CG + $0.10)
$6.31/MMBtu
Power
Prices
(Average on
peak
prices $/MWh)
prices $/MWh)
CIN
Hub
$44.32
PJM
West
$59.25
NI
Hub
$42.95
Avg.
Spark Spread (PJM West vs TET
M-3 @ 7HR)
$10.90
Avg.
Spark Spread (NI Hub vs CHI CG @
7HR) ($.54)
Annual
Average
Capacity
Factors
Baseload
70% -
90%
CC
10% -
20%
Peaking
0% -
10%
Average
Capacity
Price
(KW-Mo)
(KW-Mo)
MISO
$0.58
PJM
RTO/MAAC
$4.38/$5.52
Avg
Gen to
CIN Hub Basis
($/MWh)
CIN Hub Basis
($/MWh)
On-Peak
$(5.70)
Off-Peak
$(5.30)
Note:
Pricing
as of 10/6/09.
(1) Other
comprised of ancillary services, emission credit sales and
amortization of intangibles and trading. (2) Nameplate Heat Rate is after adjustment for
generating starts & stops, weather, fuel types, efficiencies and other operational components.
amortization of intangibles and trading. (2) Nameplate Heat Rate is after adjustment for
generating starts & stops, weather, fuel types, efficiencies and other operational components.
Other
noteworthy items:
•Unlike PJM, the
MISO capacity market is
not liquid in the outer years
not liquid in the outer years
As
presented November 5, 2009

|
Revenue
Contracts: |
• Contracting
activity primarily centers on the Midwest coal fleet
– ~600 MW CIN
Hub On-Peak at an average price of ~$45/MWh, ~2,000MW CIN Hub
Off-Peak
at an average price of $32/MWh; – ~600 MW IL
Hub On-Peak at an average price of ~$42/MWh; ~600MW IL Hub Off-Peak at
an
average price of ~$28/MWh • ~ 280 MW
under tolling agreement to 2017 for ~$20 million in 2010
• Term
capacity sales in place
– PJM capacity
auctions:
– MISO
capacity sales:
§ ~900 MW
bilateral capacity sales in place for 2010
|
|
|
|
|
Fuel
Contracts:
|
• 100% of PRB
coal supply is contracted and priced through 2010
• Ten year
transportation agreement with Burlington Northern through 2013 at
attractive rates – 2010 Average
delivered coal cost at Baldwin is forecasted to be
$1.49/MMBtu
|
|
|
Midwest
- Key Contracts
23
|
Auction
Year
|
DYN
MW cleared
|
Auction
Price
(~$/MW-day) |
|
2009/2010
|
~800
|
$
102
|
|
|
~515
|
$
191
|
|
2010/2011
|
~1,300
|
$
174
|
|
2011/2012
|
~1,300
|
$
110
|
|
2012/2013
|
~820
|
$16
|
|
|
~490
|
$133
|
As
presented November 5, 2009
Significant
Environmental Progress
24
On
target to further reduce emissions in the Midwest
Major
Assumptions
• Estimate of
remaining spend is ~$470 million for a total
investment of $960 million
investment of $960 million
• Approximately 25%
of remaining costs are firm
• Labor and material
prices are assumed to escalate at 4%
annually
annually
• All projects
include installing baghouses and scrubbers
with the exception of Hennepin and Vermilion, which
have baghouses only
with the exception of Hennepin and Vermilion, which
have baghouses only
Labor
56%
Rental
Equipment
& Other 8%
& Other 8%
Cost
Composition
Materials
36%
2008
2010
2009
2011
2012
2007
Vermilion
Hennepin
Baldwin
3
Baldwin
1
Baldwin
2
Havana
As
presented November 5, 2009
25
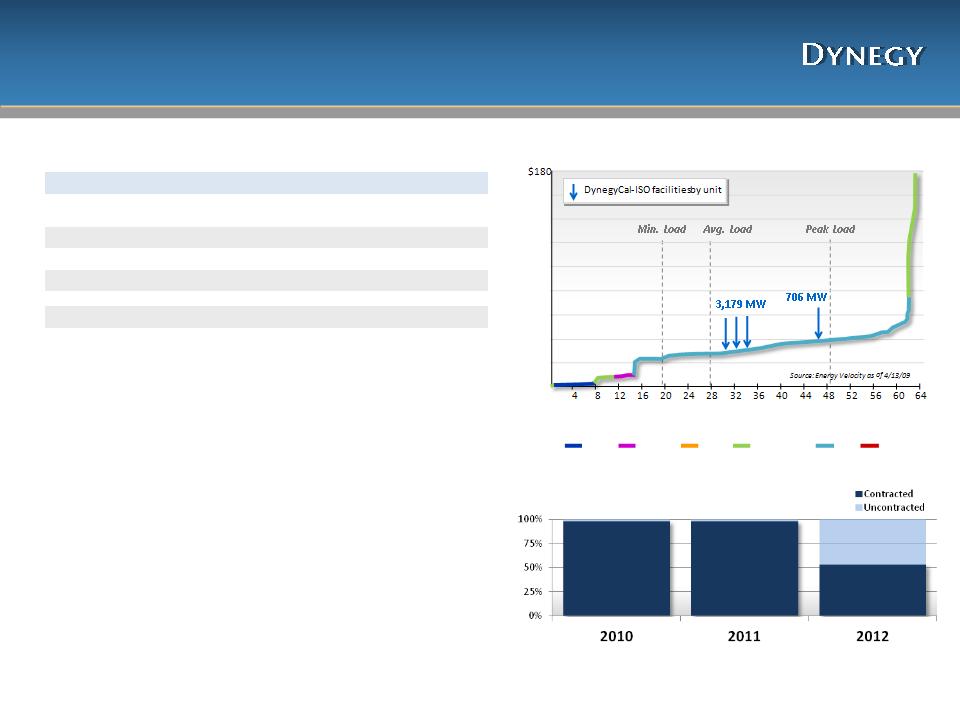
West
- Primarily Natural Gas
|
Generation
Volumes
|
~7 MM
MWh
|
|
($MM)
|
|
|
Adjusted
Gross Margin (1)
|
$
245 - 255
|
|
Operating
Expenses (2)
|
(115)
|
|
Adjusted
EBITDA (1)
|
$
130 - 140
|
|
|
|
|
Operating
Income
|
$
70 - 80
|
Regional
Performance Drivers
>95%
>95%
>95%
>95%
~50%
~50%
Cal-ISO
Dispatch Order
Hedging
Profile as of
1/11/10
|
Price:
|
• ~70% of
Adjusted Gross Margin is derived through
tolling agreements in the near-term • Regional
spark spreads
• Natural gas
sets the marginal price of power
|
|
Cost:
|
• Tolling
counterparties take financial and delivery risk
for fuel during tolled periods • Fuel is
purchased as needed at index related prices
|
|
Watch:
|
• Operational
performance since the majority of the
plants operate under tolling contracts • Weather can
affect volumes of uncontracted CCGT
fleet • Spread
variability mitigated by toll contracts
• Potential
once-through cooling regulations
|
Note:
Additional
regional data provided in the Appendix. (1)
Adjusted Gross Margin and
Adjusted EBITDA are non-GAAP financial measures. Reconciliations of these measures to
the most directly comparable GAAP measure are included in the Appendix. (2) Operating
Expenses exclude depreciation and amortization.
Adjusted EBITDA are non-GAAP financial measures. Reconciliations of these measures to
the most directly comparable GAAP measure are included in the Appendix. (2) Operating
Expenses exclude depreciation and amortization.
Cumulative
Capacity GW
Hydro
Nuclear
Coal
Renewables
Gas
Oil
160
140
120
100
80
60
40
20
0
Regional
Estimates as of
11/5/09 2010E
$/MWh
26
West
Generation - Primarily Natural Gas
Forecasted
Fundamentals 2010
Volumes
(MM
MWh)
6.8
Fleet
Heat Rate (2)
(Nameplate, Btu/KWh)
(Nameplate, Btu/KWh)
Baseload
n/a
CC
7,000
- 7,200
Peaking
9,500
- 10,500
Delivered Natural
Gas (PG&E +
$0.30)
$6.67/MMBtu
Power
Prices (Average
on
-peak prices $/MWh)
-peak prices $/MWh)
NP-15
$60.65
Avg.
Spark Spread (NP15 vs PG&E @
7HR)
$16.04
Annual
Average
Capacity
Factors
Baseload
n/a
CC
30% -
60%
Peaking
0% -
20%
Avg.
Capacity Price
(KW-Mo)
(KW-Mo)
System RA $0.40 -
$1.25
|
West
Forecast ($MM) 2010
|
|
|
Combined
Cycle
|
$ 110
- 115
|
|
Peaker/RMR/Other
(1)
|
20
- 25
|
|
Adjusted
EBITDA
|
$ 130
- 140
|
|
Operating
Income
|
$ 70 -
80
|
NOTE: Pricing
as of 10/6/09.
(1) Other
comprised of ancillary services, emission credit sales, equity earnings/losses
and amortization of intangibles and trading. (2)
Nameplate
Heat Rate is after adjustment
for generating starts & stops, weather, fuel types, efficiencies and other operational components.
for generating starts & stops, weather, fuel types, efficiencies and other operational components.
Other
noteworthy items:
•~70% toll/RMR
contracts
As
presented November 5, 2009

|
Revenue
Contracts:
|
• Tolling,
RMR, Heat Rate Call Options
– Morro Bay:
650
MW Toll
thru Sep 2013
– Moss Landing
1 & 2: 750
MW Heat
rate call option thru Sept 2010
– Moss Landing
6 & 7: 1,500
MW Year
round toll through 2010; 2011 - 2013
– Oakland:
RMR
year-to-year
– South Bay 1
& 2: RMR
year-to-year
|
|
|
|
|
Fuel
Contracts:
|
• Gas is
transported to Moss Landing via firm and interruptible
transportation agreements with PG&E , pass-through costs on units 6 & 7 to tolling counterparty • Tolling
counterparty assumes fuel delivery risk associated with gas
requirements during tolled periods for tolled capacity |
|
|
West
- Key Contracts
27
As
presented November 5, 2009, except Moss Landing 6 & 7 toll
update
28
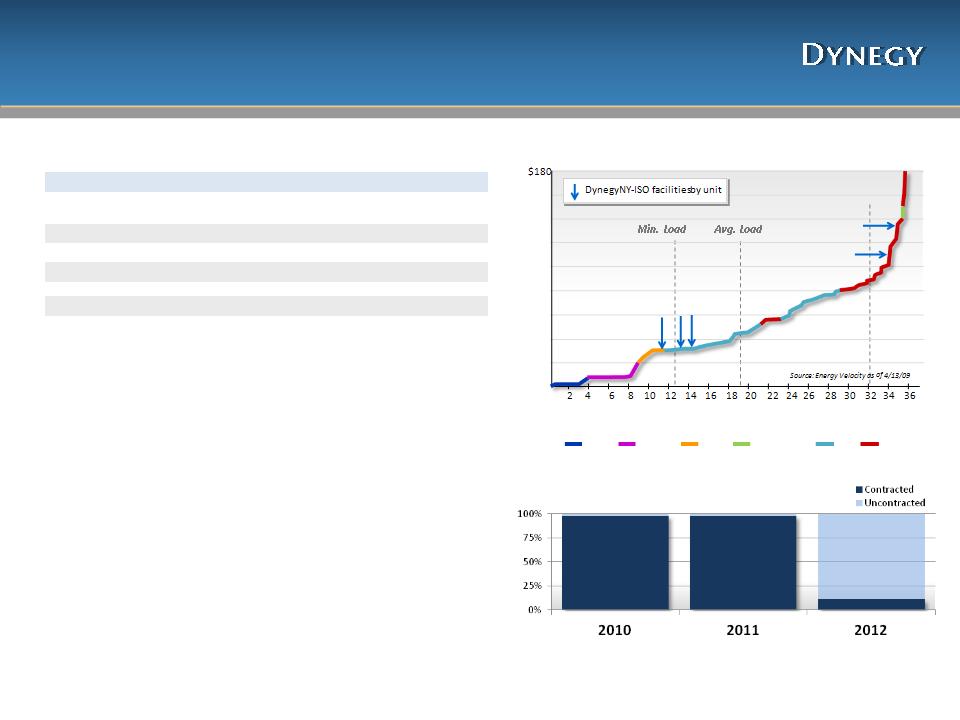
Northeast
- Diverse Fuel and Dispatch Type
|
Generation
Volumes
|
~6 MM
MWh
|
|
($MM)
|
|
|
Adjusted
Gross Margin (1)
(2)
|
$
225 - 245
|
|
Operating
Expenses (3)
|
(165)
|
|
Adjusted
EBITDA (2)
|
$
60 - 80
|
|
|
|
|
Operating
Income
|
$
20 - 40
|
Regional
Performance Drivers
>95%
>95%
>95%
>95%
~10%
NY-ISO
Dispatch Order
Hedging
Profile as of
1/11/10
Note:
Additional
regional data provided in the Appendix. (
1) Adjusted
Gross Margin includes
contract amortization from the Independence ConEd contract. See Appendix for more detail.
(2) Adjusted Gross Margin and Adjusted EBITDA are non-GAAP financial measures.
Reconciliations of these measures to the most directly comparable GAAP measure are included
in the Appendix. (3) Operating Expenses include effects of Central Hudson lease expense and
exclude depreciation and amortization.
|
Price:
|
• New York
Zone G power price for Danskammer and
New York Zone G spark spread for Roseton • Spark
spreads for New York Zone C for Independence
and Mass Hub for Casco Bay • Natural gas
sets the marginal price of power
|
|
Cost:
|
• 2010
delivered South American coal 80% contracted/
priced at $3.55/MMBtu • Natural gas
purchased as needed
• RGGI
allowance cost at market rates
|
|
Watch:
|
• Weather can
affect volumes of uncontracted CCGT
fleet and Roseton facility • Coal
delivery
• New
environmental regulations/enforcement
|
Cumulative
Capacity GW
Hydro
Nuclear
Coal
Renewables
Gas
Oil
160
140
120
100
80
60
40
20
0
1,185
MW
1,974
MW
123
MW
Peak
Load
Regional
Estimates as of
11/5/09 2010E
$/MWh
Northeast
Generation -
Coal, Fuel Oil & Natural Gas
Coal, Fuel Oil & Natural Gas
29
Other
noteworthy items:
• Operating expense
includes $50 million of
Central Hudson lease expense, and Operating
Cash Flow includes cash lease payments of $95
million in 2010
Central Hudson lease expense, and Operating
Cash Flow includes cash lease payments of $95
million in 2010
• Independence under
capacity agreement with
ConEd expiring 11/2014
ConEd expiring 11/2014
– Adjusted EBITDA
includes approximately $50 million
net earnings, however Adjusted Cash Flow from
Operations will include cash receipt of approximately
$100 million in 2010
net earnings, however Adjusted Cash Flow from
Operations will include cash receipt of approximately
$100 million in 2010
• Carbon emissions
include a cost assumption of
~$2.33/MT for CO2 allowances associated with
RGGI
~$2.33/MT for CO2 allowances associated with
RGGI
Forecasted
Fundamentals 2010
Volumes
(MM
MWh)
6.2
Fleet
Heat Rate (2)
(Nameplate,
Btu/KWh)
Baseload
10,000 -
11,000
CC
7,000
- 8,000
Peaking
9,500
- 10,500
Delivered
Fuel
Fuel
Oil #6
$10.97/MMBtu
SA
Coal
$3.55/MMBtu
Power
Prices
(Average on
peak
prices $/MWh)
prices $/MWh)
NY
Zone G
$71.24
NY
Zone C
$53.62
Mass
Hub
$66.11
Delivered Natural
Gas (Dawn +
$0.25)
$6.72/MMBtu
Delivered Natural
Gas (Tran Z6 -
NY)
$7.29/MMBtu
Avg.
Spark
Spread
Spread
Fuel
Oil (NY-G vs #6 Oil
@11HR)
($49.42)
Gas
(NY
Zone C vs Dawn @ 7HR)
$6.59
Gas
(Mass
Hub vs TRAN Z6-NY @ 7HR)
$15.11
Annual
Average
Capacity
Factors
Baseload
75% -
85%
CC
20% -
50%
Peaking
0% -
10%
Average
Capacity
Price
(KW-Mo)
(KW-Mo)
NYISO
$2.42
New
England
$4.33
Average Casco
to
Mass Hub Basis
($/MWh)
Mass Hub Basis
($/MWh)
On-Peak
$(4.50)
Off-Peak
$(2.75)
Northeast
Forecast ($MM)
2010
Coal
$ 25
- 30
Combined
Cycle
50 -
60
Peaking/Other
(1)
(15) -
(10)
Adjusted
EBITDA
$ 60
- 80
Operating
Income
$ 20
- 40
NOTE:
Pricing
as of 10/6/09. (1)
Other
comprised of ancillary services, emission credit sales and amortization of
intangibles and trading. (2)
Nameplate Heat Rate is after adjustment for generating starts &
stops, weather, fuel types, efficiencies and other operational components.
stops, weather, fuel types, efficiencies and other operational components.
As
presented November 5, 2009

|
Revenue
Contracts:
|
• Independence
has a 740 MW capacity contract with ConEd (‘A-’ Rated) through
2014; receive ~$100 million, net in cash but offset by $50 million contract amortization in Adjusted Gross Margin • Danskammer
has ~100 MW on-peak and ~300 MW off-peak in power swaps at
an average price of ~$80/MWh on-peak and ~$52/MWh off-peak • NYISO has
~850 MW capacity sales in place for 2010
• Casco Bay
receives Forward
Capacity Market (FCM) payments from New New England ISO – 2010
Guidance includes ~445 MW of
capacity sold • Heat Rate
Call Options - Casco
Bay, 100 MW for ~$3/KW-Mo
|
|
|
|
|
Fuel
Contracts:
|
• Coal
(Danskammer):
– One- to
two-year contracts primarily sourced from South America
– 80% of coal
supply priced for 2010, including delivery
• Natural gas:
Purchased on an as-needed basis
• Fuel Oil
(Roseton): Due to on-site storage availability of 1 MMBbls, fuel oil
is
purchased on an opportunistic basis |
|
|
Northeast
- Key Contracts
30
|
ISO
New England Capacity Auction
|
||
|
Auction
Year
|
DYN
MW
cleared |
Auction
Price
(~$/KW-mo)
|
|
2009/2010
|
~440
|
$
3.75
|
|
2010/2011
|
~450
|
$
4.50
|
|
2011/2012
|
~425
|
$
3.60
|
As
presented November 5, 2009

|
($MM)
|
2009
|
2010
|
2011
|
2012
|
2013
|
|
Maintenance
- Coal facilities
|
$
85
|
$
85
|
$
70
|
$
70
|
$
65
|
|
Maintenance
- Gas facilities
|
100
|
25
|
55
|
20
|
70
|
|
Environmental
|
280
|
200
|
140
|
95
|
50
|
|
Corporate
|
10
|
10
|
10
|
10
|
10
|
|
Capitalized
Interest
|
25
|
25
|
20
|
10
|
5
|
|
Discretionary
|
30
|
-
|
-
|
-
|
-
|
|
TOTAL
Cap Ex
|
$
530
|
$
345
|
$
295
|
$
205
|
$
200
|
Anticipated
Capital Expenditures (2009
- 2013)
31
• “Environmental”
primarily consists of Consent Decree and mercury reduction
expenditures
• Coal facility
maintenance is relatively stable over time
• Maintenance for
“Gas facilities” is largely a function of run-time and also includes
expenditures for Roseton
expenditures for Roseton
As
presented November 5, 2009
2010
Commodity Pricing
32
Cin
Hub/Cinergy ($/MWh)
New
York Zone G ($/MWh)
2010
Forward : $44.32
2009A/F(Oct): $34.43
(1)
Pricing as of 10/6/09, which was the basis for estimates as presented 11/5/09.
Prices reflect quoted forward on-peak monthly prices for 1/1/2010 -
12/31/10.
2009A/F(Oct)
2010
Forward as of 10/6/09(1)
2010
Forward : $60.65
2009A/F(Oct): $39.44
2010
Forward : $71.24
2009A/F(Oct): $50.46
2010
Forward : $6.15
2009A/F(Oct): $3.97
As
presented November 5, 2009
2010
Spark Spreads
33
PJM
West ($/MWh)
Mass
Hub ($/MWh)
2010
Forward : $10.90
2009A/F(Oct): $11.94
2009A/F(Oct)
2010
Forward as of 10/6/09(1)
2010
Forward : $(0.54)
2009A/F(Oct): $6.46
2010
Forward : $15.11
2009A/F(Oct): $11.43
2010
Forward : $13.94
2009A/F(Oct): $8.44
(1)
Pricing as of 10/6/09, which was the basis for estimates as presented 11/5/09.
Prices reflect quoted forward on-peak monthly prices for 1/1/10 -
12/31/10.
As
presented November 5, 2009
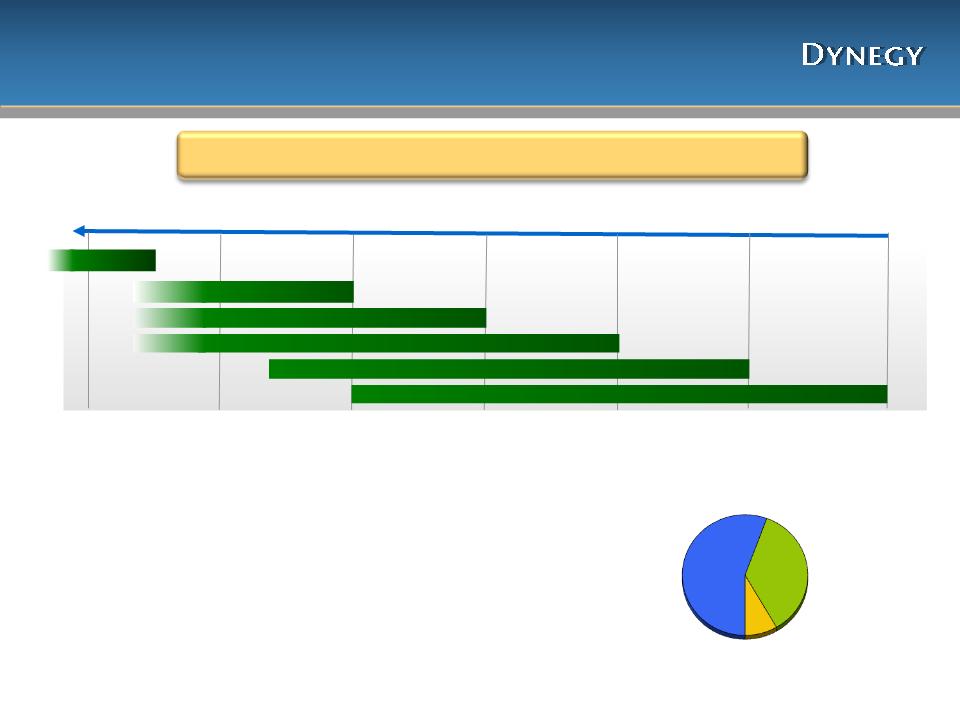
Understanding DYN’s 2011 Hedge Profile
34
Approximating
Hedge Value
• As the contracted
percentage of
expected generation is provided at
various periods, an average price can
be applied to the incremental
percentage contracted
expected generation is provided at
various periods, an average price can
be applied to the incremental
percentage contracted
• For
example:
─ Between May and
August in the
Midwest, Dynegy contracted an
additional ~10% of expected generation
Midwest, Dynegy contracted an
additional ~10% of expected generation
─ The average CIN
Around-the-Clock (ATC)
price for that time period was
~$39/MWh
price for that time period was
~$39/MWh
─ If Dynegy’s annual
expected generation
in the Midwest is ~25MM MWh, you can
estimate ~2.5MM MWh was contracted
at $39/MWh
in the Midwest is ~25MM MWh, you can
estimate ~2.5MM MWh was contracted
at $39/MWh
• In addition to
contracting expected
generation, Dynegy uses options to
mitigate some of the risk of potentially
low commodity prices
generation, Dynegy uses options to
mitigate some of the risk of potentially
low commodity prices
CIN
ATC Power Price (Cal 2011)
~5%
~5%
~5%
~15%
Midwest
Region Example
($/MWh)
~50%
As
presented November 5, 2009

Collar
Option Example
35
Call
Option:
Dynegy sells a 100
MW on-peak call option for the 2011
calendar year at a $65 strike price at a premium of $0.85/MWh
calendar year at a $65 strike price at a premium of $0.85/MWh
•Dynegy receives
and realizes a premium payment in current period
from buyer for the call option (See Calculation 1)
from buyer for the call option (See Calculation 1)
•Option gives buyer
right to buy 100 MW on-peak from Dynegy for
2011 calendar year at $65 if buyer strikes the option on the option
expiration date
2011 calendar year at $65 if buyer strikes the option on the option
expiration date
•Buyer will strike
option if 2011 calendar prices exceed $65 in order to
sell the 100 MW at a higher price
sell the 100 MW at a higher price
•Commitment sets a
potential price on the sale of the 100 MW for
Dynegy at $65 which is realized during option period if buyer strikes
option
Dynegy at $65 which is realized during option period if buyer strikes
option
•If prices are
below $65 on the option expiration date, option expires
Put
Option:
Dynegy buys a 100
MW on-peak put option for the 2011
calendar year at a $35 strike price at a premium of $0.45/MWh
calendar year at a $35 strike price at a premium of $0.45/MWh
•Dynegy pays and
realizes a premium expense in current period to
seller for the put option (See Calculation 2)
seller for the put option (See Calculation 2)
•Option gives
Dynegy right to sell 100 MW to seller for 2011 calendar
year at $35 if Dynegy strikes the option on the option expiration date
year at $35 if Dynegy strikes the option on the option expiration date
•Dynegy will strike
option if 2011 calendar prices go below $35 in
order to sell the 100 MW at a higher price
order to sell the 100 MW at a higher price
•Commitment sets a
potential price on the sale of the 100 MW for
Dynegy at $35 which is realized during option period if Dynegy strikes
option
Dynegy at $35 which is realized during option period if Dynegy strikes
option
•If prices are
above $35 on the option expiration date, option expires
Combining
Put & Call Options creates a
“Collar” Option
“Collar” Option
•Collars provide
earnings certainty and reduce exposure to power
price volatility
price volatility
- If market price
clears at $70, buyer will strike call option. Maximum
revenue on 100 MW will be $27MM versus $29MM had power been
sold at market price (See Calculations 3 & 4)
revenue on 100 MW will be $27MM versus $29MM had power been
sold at market price (See Calculations 3 & 4)
- If market price
clears at $30, Dynegy will strike put option. Maximum
gross margin on 100 MW will be $14MM versus $12MM had power
been sold at market price (See Calculations 5 & 6)
gross margin on 100 MW will be $14MM versus $12MM had power
been sold at market price (See Calculations 5 & 6)
•Option impact on
Revenue:
- Premium revenue
and expenses are realized in period options were
sold/purchased
sold/purchased
- Exercised option
value realized during the option period
Calculations
Premium
Calculations:
1) 4,080 on-peak
hours/year x $0.85/MWh x 100 MW
=
$346,800
2) 4,080 on-peak
hours/year x $0.45/MWh x 100 MW
=
$183,600
Sales
Calculations:
3) 4,080 on-peak
hours/year x $65/MWh x 100 MW
=
~$27
MM
4) 4,080
on-peak hours/year x $70/MWh x 100 MW
=
~$29
MM
5) 4,080 on-peak
hours/year x $35/MWh x 100 MW
=
~$14
MM
6) 4,080 on-peak
hours/year x $30/MWh x 100 MW
=
~$12
MM
As
presented November 5, 2009
Capital Structure
36
(1)
Represents drawn amounts under the revolver; actual amount of revolver was $1.08
Billion as of 9/30/09 .
(2)
Represents PV (10%) of future lease payments. Central Hudson lease payments are
unsecured obligations of
Dynegy Inc., but are a secured obligation of an unrelated third party (“lessor”) under the lease. DHI has
guaranteed the lease payments on a senior unsecured basis.
Dynegy Inc., but are a secured obligation of an unrelated third party (“lessor”) under the lease. DHI has
guaranteed the lease payments on a senior unsecured basis.
|
TOTALS ($
Million)
|
12/31/09
|
|
Secured
|
$918
|
|
Secured
Non-Recourse
|
$1,032
|
|
Unsecured
|
$4,276
|
Debt
& Other Obligations as of 12/31/09
Dynegy
Power Corp.
Central Hudson(2) $626
Dynegy
Holdings Inc.
$1,080
Million Revolver(1) $0
Term
L/C Facility $850
Tranche B Term $68
Sr.
Unsec. Notes/Debentures
$3,450
Sub.Cap.Inc.Sec
(“SKIS”) $200
Dynegy
Inc.
Senior
Debentures $287
PP
1st Lien $645
Tax
Exempt 100
Gross
Debt $745
Less:
Restricted Cash (19)
Total,
Net Debt $726
Sithe
Energies
Plum
Point Energy Assoc.
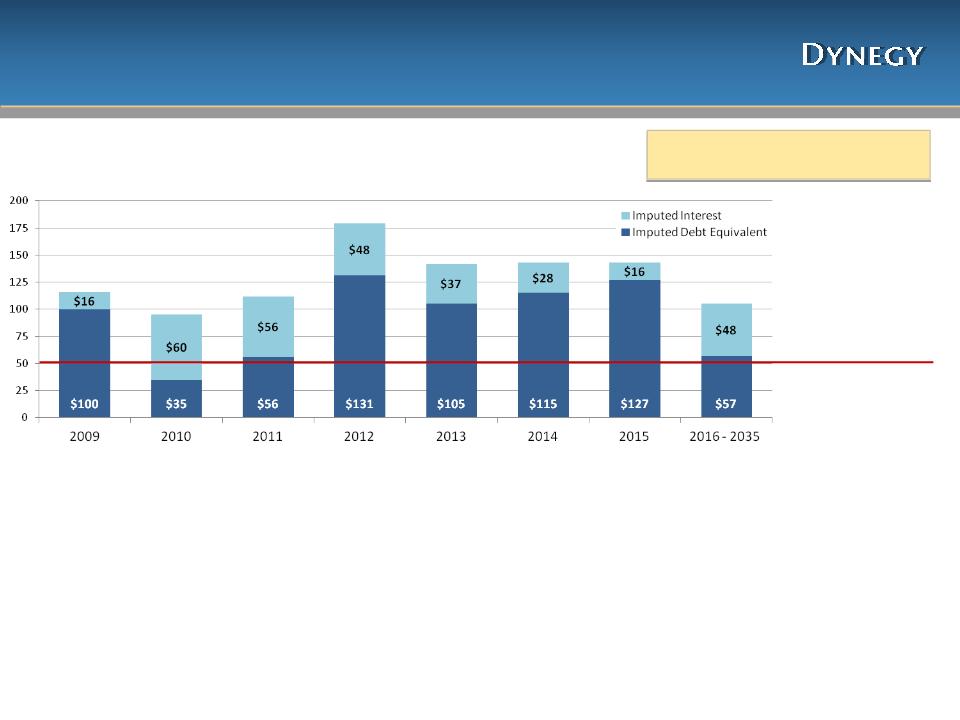
Central
Hudson Lease - Northeast Segment
37
Accrual
Lease Expense
Central
Hudson treated as Debt
(would require the following adjustments to GAAP financials):
(would require the following adjustments to GAAP financials):
•Income Statement -
Add back $50 million lease expense to Adjusted EBITDA; add $16 million
imputed interest expense to Interest Expense; add $23 million estimated depreciation &
amortization expense; adjust tax expense for net difference
imputed interest expense to Interest Expense; add $23 million estimated depreciation &
amortization expense; adjust tax expense for net difference
• Depreciation &
Amortization calculated using purchase price of $920 million divided by 40
years
•Cash Flow
Statement - Add back $100 million of imputed principal to Operating Cash
Flows
• $116 million cash
payment split between $16 million imputed interest payment (Operating
Cash
Flows) and $100 million imputed principal payment (Financing Cash Flows)
Flows) and $100 million imputed principal payment (Financing Cash Flows)
•Balance Sheet -
Include $725 million total PV (10%) of future lease payments
Central
Hudson treated as Lease
(as currently shown in GAAP financials):
(as currently shown in GAAP financials):
• Income Statement -
$50 million lease expense included in
Adjusted EBITDA; no interest expense or depreciation &
amortization expense
Adjusted EBITDA; no interest expense or depreciation &
amortization expense
• Cash Flow
Statement - $116 million cash payment included in
Operating Cash Flows
Operating Cash Flows
• Balance Sheet -
lease obligation not included in debt balance
Central
Hudson Cash Payments (remaining
as of 9/30/09, $MM)
$95
$112
$179
$142
$143
$105
Imputed Debt
Equivalent at PV (10%) of
future lease payments = $725MM(1)
future lease payments = $725MM(1)
(1)
PV of payments calculated as of 9/30/09
• Chart represents
total cash lease payments, which are included in Operating Cash
Flows
• Lease expense is
approximately $50 million per year and included in Operating
Expense
$143
$116
As
presented November 5, 2009
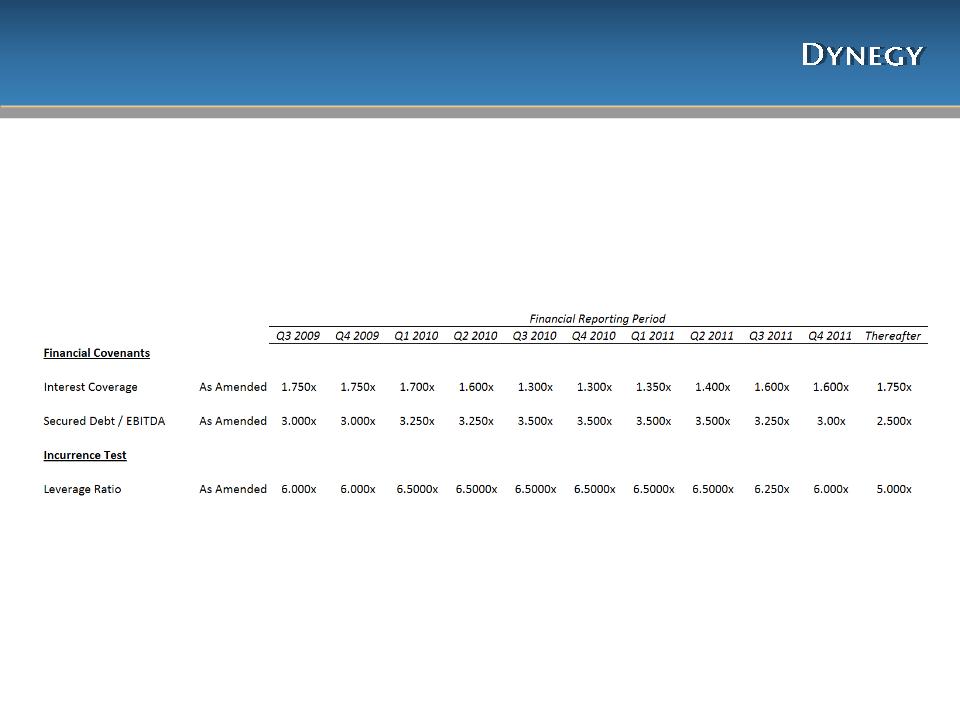
Financial
Covenant Ratios
38
Covenant ratios
are requirements of the DHI Credit Agreement covenants and are calculated
based
on trailing four quarters
on trailing four quarters
As
presented November 5, 2009

39
|
Dynegy
Generation Facilities (as of
12/31/09)
|
|||||
|
Region/Facility(1)
|
Location
|
Net
Capacity(2)
|
Primary
Fuel
|
Dispatch
Type
|
NERC
Region
|
|
MIDWEST
|
|
|
|
|
|
|
Baldwin
|
Baldwin,
IL
|
1,800
|
Coal
|
Baseload
|
MISO
|
|
Havana
|
Havana,
IL
|
|
|
|
|
|
Units
1-5
|
|
228
|
Oil
|
Peaking
|
MISO
|
|
Unit
6
|
|
441
|
Coal
|
Baseload
|
MISO
|
|
Hennepin
|
Hennepin,
IL
|
293
|
Coal
|
Baseload
|
MISO
|
|
Oglesby
|
Oglesby,
IL
|
63
|
Gas
|
Peaking
|
MISO
|
|
Stallings
|
Stallings,
IL
|
89
|
Gas
|
Peaking
|
MISO
|
|
Vermilion
|
Oakwood,
IL
|
|
|
|
|
|
Units
1-2
|
|
164
|
Coal/Gas
|
Baseload
|
MISO
|
|
Unit
3
|
|
12
|
Oil
|
Peaking
|
MISO
|
|
Wood
River
|
Alton,
IL
|
|
|
|
|
|
Units
1-3
|
|
119
|
Gas
|
Peaking
|
MISO
|
|
Units
4-5
|
|
446
|
Coal
|
Baseload
|
MISO
|
|
Kendall
|
Minooka,
IL
|
1,200
|
Gas -
CCGT
|
Intermediate
|
PJM
|
|
Ontelaunee
|
Ontelaunee
Township, PA
|
580
|
Gas -
CCGT
|
Intermediate
|
PJM
|
|
Plum
Point (3)
|
Osceola,
AR
|
140
|
Coal
|
Baseload
|
SERC
|
|
Midwest
TOTAL
|
|
5,575
|
|
|
|
|
NORTHEAST
|
|
|
|
|
|
|
Independence
|
Scriba,
NY
|
1,064
|
Gas -
CCGT
|
Intermediate
|
NYISO
|
|
Roseton (4)
|
Newburgh,
NY
|
1,185
|
Gas/Oil
|
Intermediate
|
NYISO
|
|
Casco
Bay
|
Veazie,
ME
|
540
|
Gas -
CCGT
|
Intermediate
|
ISO-NE
|
|
Danskammer
|
Newburgh,
NY
|
|
|
|
|
|
Units
1-2
|
|
123
|
Gas/Oil
|
Peaking
|
NYISO
|
|
Units 3-4
(4)
|
|
370
|
Coal/Gas
|
Baseload
|
NYISO
|
|
Northeast
TOTAL
|
|
3,282
|
|
|
|
|
WEST
|
|
|
|
|
|
|
Moss
Landing
|
Monterey
County, CA
|
|
|
|
|
|
Units
1-2
|
|
1,020
|
Gas -
CCGT
|
Intermediate
|
CAISO
|
|
Units
6-7
|
|
1,509
|
Gas
|
Peaking
|
CAISO
|
|
Morro
Bay (5)
|
Morro Bay,
CA
|
650
|
Gas
|
Peaking
|
CAISO
|
|
South
Bay (6)
|
Chula Vista,
CA
|
309
|
Gas
|
Peaking
|
CAISO
|
|
Oakland
|
Oakland,
CA
|
165
|
Oil
|
Peaking
|
CAISO
|
|
Black
Mountain
(7) |
Las Vegas,
NV
|
43
|
Gas
|
Baseload
|
WECC
|
|
West
TOTAL
|
|
3,696
|
|
|
|
|
TOTAL
GENERATION
|
12,553
|
|
|||
NOTES:
1)Dynegy owns 100% of
each unit
listed except as otherwise indicated.
For each unit in which Dynegy owns
less than a 100% interest, the Total
Net Capacity set forth in this table
includes only Dynegy’s proportionate
share of such unit’s gross generating
capacity.
listed except as otherwise indicated.
For each unit in which Dynegy owns
less than a 100% interest, the Total
Net Capacity set forth in this table
includes only Dynegy’s proportionate
share of such unit’s gross generating
capacity.
2)Unit capabilities
are based on winter
capacity.
capacity.
3)Under construction.
Represents net
ownership of 21%.
ownership of 21%.
4)Dynegy entered into
a $920 MM sale
-leaseback transaction for the Roseton
facility and units 3 and 4 of the
Danskammer facility in 2001. Cash
lease payments extend until 2029 and
include $108 MM in 2007, $144 MM in
2008, $141 MM in 2009, $95 MM in
2010 and $112 MM in 2011. GAAP
lease payments are $50.5 MM through
2030 and decrease until last GAAP
lease payment in 2035.
5)Represents
operating capacity of
Units 3 & 4. Units 1 & 2, with a
combined net generating capacity of
352 MW, are currently in layup status
and out of operation.
Units 3 & 4. Units 1 & 2, with a
combined net generating capacity of
352 MW, are currently in layup status
and out of operation.
6)Represents
operating capacity of
Units 1 & 2. Units 3 & 4, with a
combined net generating capacity of
397 MW, did not receive RMR status
from CAISO for 2010 and are currently
out of operation and in the process of
being decommissioned.
Units 1 & 2. Units 3 & 4, with a
combined net generating capacity of
397 MW, did not receive RMR status
from CAISO for 2010 and are currently
out of operation and in the process of
being decommissioned.
7)Dynegy owns a 50%
interest in this
facility and the remaining 50% interest
is held by Chevron.
facility and the remaining 50% interest
is held by Chevron.

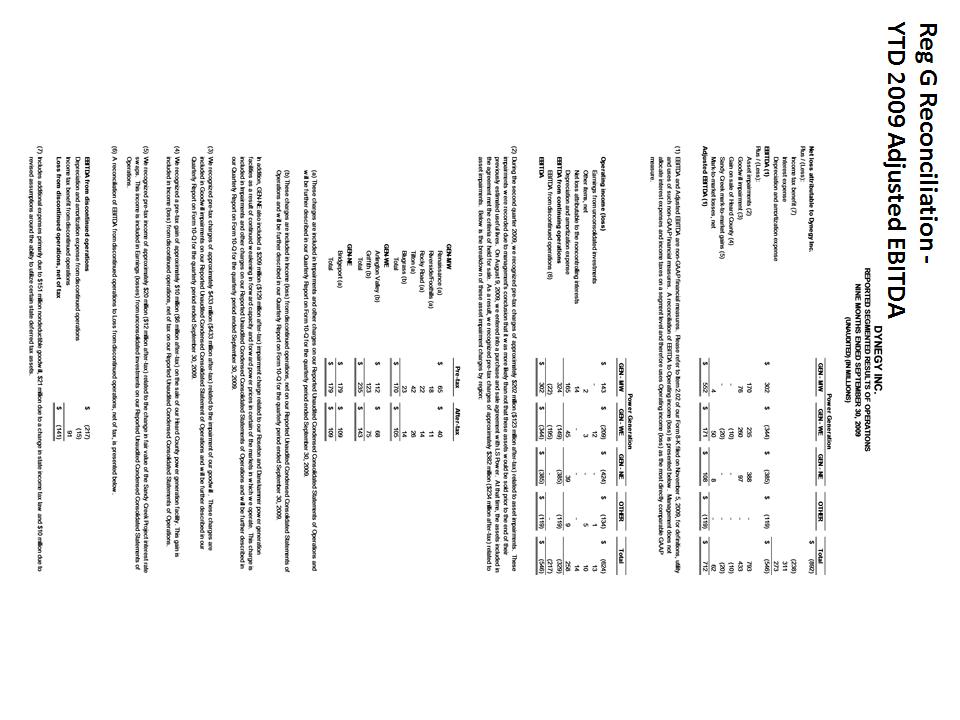
Appendix
- Reg G Reconciliations

Debt
Measures: We believe that
our debt measures are useful because we consider these
measures as a way to re-evaluate our progress toward our strategic corporate objective of
reducing our overall indebtedness. In addition, many analysts and investors use these measures
for valuation analysis purposes. The most directly comparable GAAP financial measure to the
below measures is GAAP debt.
– “Net Debt” - We
define “Net Debt” as total GAAP debt less cash and cash equivalents and
restricted cash.
Restricted cash in this case consists only of collateral posted for the credit facility at the end of each
period, and cash associated with the Sandy Creek letter of credit, the Sithe debt reserve and Plum Point
debt, at the end of each period where applicable.
Restricted cash in this case consists only of collateral posted for the credit facility at the end of each
period, and cash associated with the Sandy Creek letter of credit, the Sithe debt reserve and Plum Point
debt, at the end of each period where applicable.
– “Net Debt and
Other Obligations” - We define “Net Debt and Other Obligations” as total GAAP
debt plus
certain operating lease commitments less cash and cash equivalents and restricted cash. Restricted cash in
this case consists only of collateral posted for the credit facility at the end of each period, and cash
associated with the Sandy Creek letter of credit and Plum Point debt, at the end of each period where
applicable.
– “Net Debt and
Other Obligations Associated with Operating Assets” - We believe that this
measure is
useful for of the purpose of evaluating our operating assets. We define “Net Debt and Other Obligations
Associated with Operating Assets” as “Net Debt and Other Obligations” less GAAP debt associated with
assets under construction.
useful for of the purpose of evaluating our operating assets. We define “Net Debt and Other Obligations
Associated with Operating Assets” as “Net Debt and Other Obligations” less GAAP debt associated with
assets under construction.
Debt
Definitions
41
42
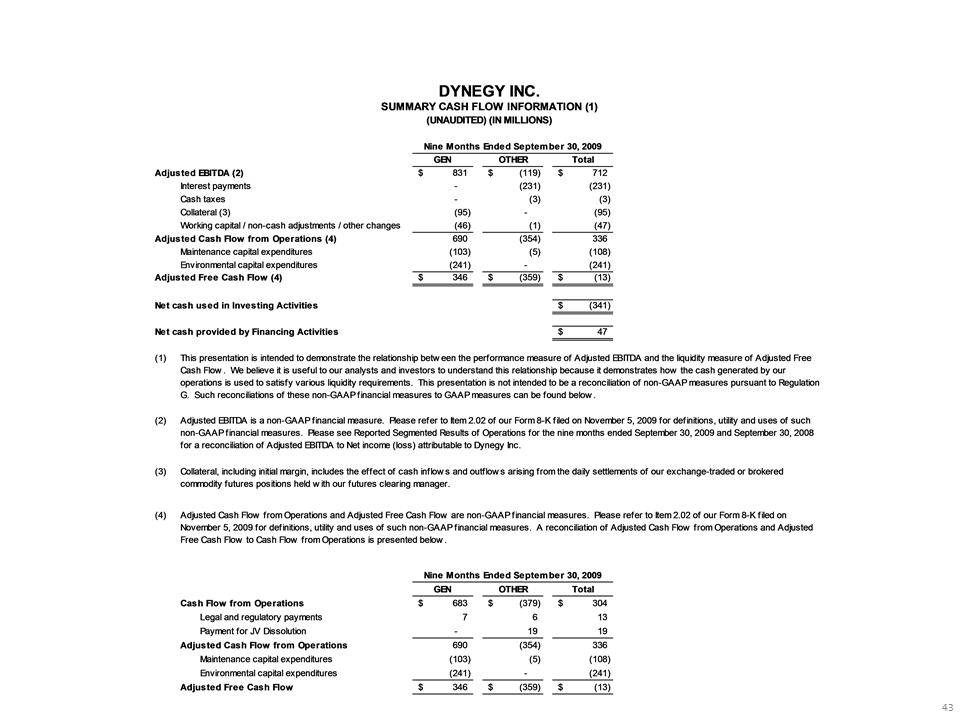
Reg
G Reconciliation - YTD Cash Flow 2009
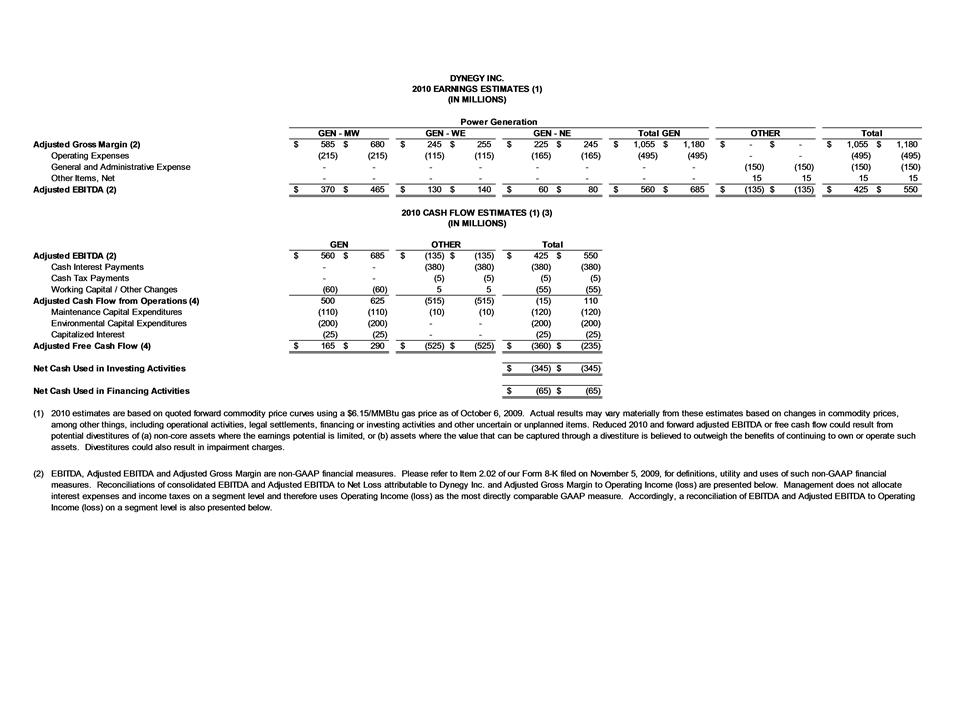
44
Reg
G Reconciliation - 2010 Guidance
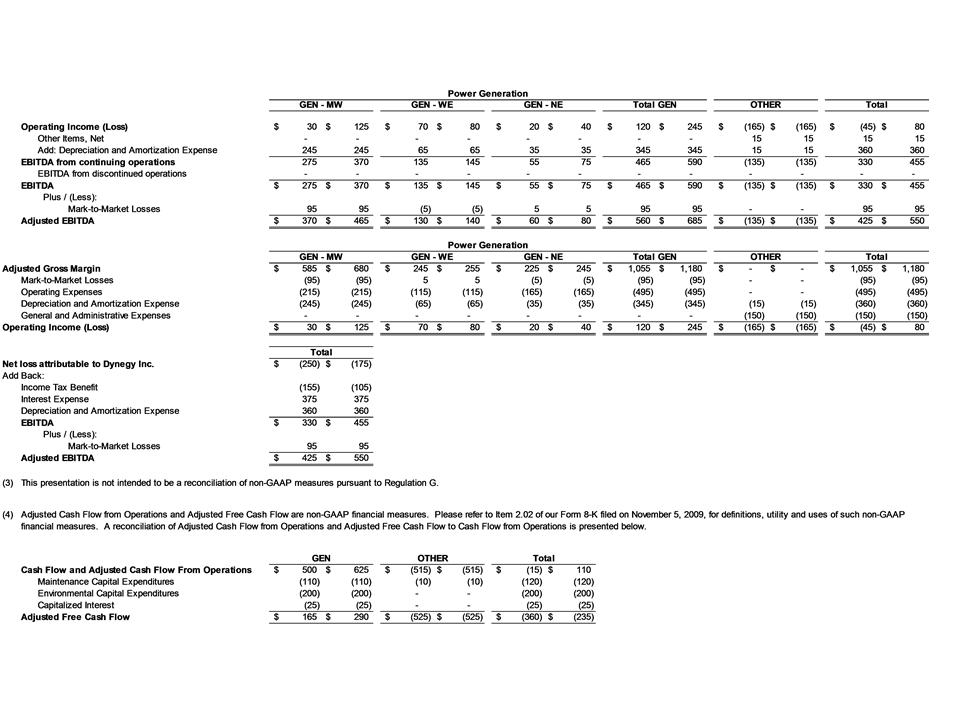
45
Reg
G Reconciliation - 2010 Guidance, continued