Attached files
| file | filename |
|---|---|
| EX-99.3 - EXHIBIT 99.3 - OCCIDENTAL PETROLEUM CORP /DE/ | ex99_3-20100128.htm |
| EX-99.1 - EXHIBIT 99.1 - OCCIDENTAL PETROLEUM CORP /DE/ | ex99_1-20100128.htm |
| EX-99.2 - EXHIBIT 99.2 - OCCIDENTAL PETROLEUM CORP /DE/ | ex99_2-20100128.htm |
| EX-99.5 - EXHIBIT 99.5 - OCCIDENTAL PETROLEUM CORP /DE/ | ex99_5-20100128.htm |
| 8-K - FORM 8-K - OCCIDENTAL PETROLEUM CORP /DE/ | form8k-20100128.htm |
Fourth
Quarter 2009
Fourth
Quarter 2009
Earnings Conference
Call
Earnings Conference
Call
January
28, 2010
January
28, 2010
1

2
Fourth
Quarter 2009 Earnings - Highlights
• Core
Results - $1.1 Billion vs. $957 Million in 4Q08
– Core
EPS $1.30 (diluted) vs. $1.18 in 4Q08.
• Net Income - $938
Million vs. $443 Million in 4Q08
– EPS $1.15 (diluted)
vs. $0.55 in 4Q08.
– 4Q09 net income
includes after-tax non-core charges
mostly consisting of a $115 mm impairment of certain
Argentine producing properties.
mostly consisting of a $115 mm impairment of certain
Argentine producing properties.
2
3
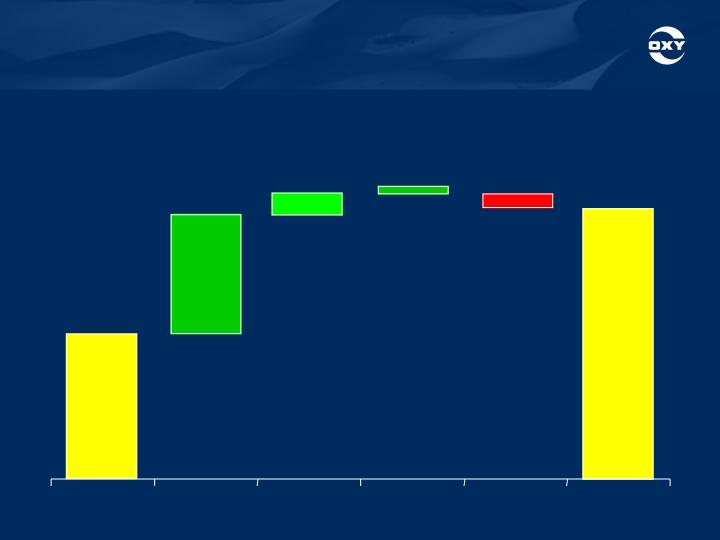
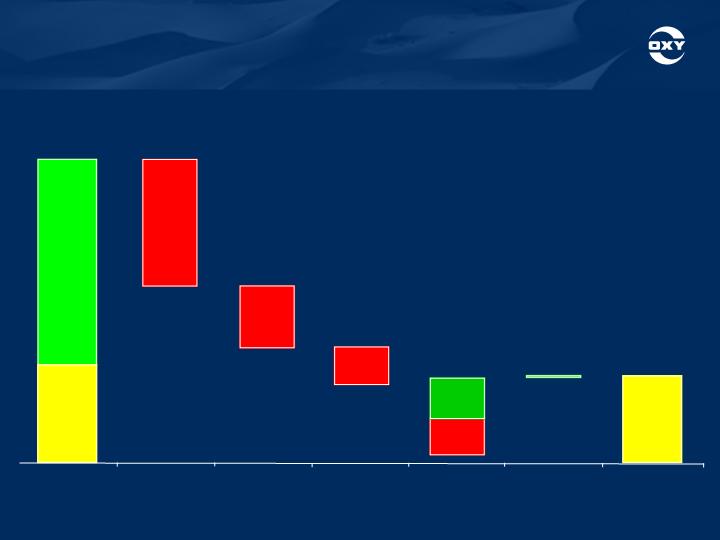
($
in millions)
($
in millions)
4Q
08
Sales
Price
Sales
Volume
Exploration
Expense
All
Others*
4Q
09
$996
$1,813
$746
$83
$35
$47
*All
Others include: Lower FX gains and higher DD&A rate partially offset by
lower operating costs.
Fourth
Quarter 2009 Earnings - Oil & Gas
Segment Variance Analysis - 4Q09 vs. 4Q08
Segment Variance Analysis - 4Q09 vs. 4Q08
• Core
Results for 4Q09 of $1.8 B vs. $1.0 B in 4Q08
– The increase was due
to higher crude oil prices and sales volumes and lower
operating expenses.
operating expenses.
3

4
4Q09 4Q08
4Q09 4Q08
Reported Segment
Earnings ($ mm) $1,643 $339
Reported Segment
Earnings ($ mm) $1,643 $339
WTI Oil
Price ($/bbl) $76.19 $58.73
WTI Oil
Price ($/bbl) $76.19 $58.73
NYMEX
Gas Price ($/mcf) $4.29 $6.97
NYMEX
Gas Price ($/mcf)
$4.29 $6.97
Oxy’s
Realized Prices
Oxy’s
Realized Prices
Worldwide
Oil ($/bbl) $69.39 $53.52
Worldwide
Oil ($/bbl) $69.39 $53.52
US
Natural Gas ($/mcf) $4.37 $4.67
US
Natural Gas ($/mcf) $4.37 $4.67
Fourth
Quarter 2009 Earnings -
Oil & Gas Segment
Oil & Gas Segment
4

5
Fourth
Quarter 2009 Earnings -
Oil & Gas Segment - Production
Oil & Gas Segment - Production
Fourth
Quarter 2009 Earnings -
Oil & Gas Segment - Production
Oil & Gas Segment - Production
4Q09 4Q08
• Oil and Gas Sales
Volumes (mboe/d) 650 620
– +
4.8% year-over-year or 30 mboe/d.
• Year-over-year sales
volume increase includes:
– + 23 mboe/d from
Oman and Bahrain;
– + 6 mboe/d from
Argentina, and;
– + 13 mboe/d from
California operations, excluding Long Beach;
– partially offset by
- 7 mboe/d of volumes in the Middle East caused
by higher oil prices affecting our PSCs.
by higher oil prices affecting our PSCs.
5

6
Fourth
Quarter 2009 Earnings -
Oil & Gas Segment - Production
Oil & Gas Segment - Production
Fourth
Quarter 2009 Earnings -
Oil & Gas Segment - Production
Oil & Gas Segment - Production
4Q09 3Q09
• Oil and Gas Sales
Volumes (mboe/d) 650 628
– +
3.5% quarter-over-quarter or 22 mboe/d.
• Sequential sales
volume increase includes:
– Bahrain production
and development activities began on 12/1/09;
– Argentina volumes
increased by 8 mboe/d. 3Q09
included a 9
mboe/d loss due to the Santa Cruz strike;
mboe/d loss due to the Santa Cruz strike;
– California volumes,
excluding Long Beach, increased by 3 mboe/d;
– Oman volumes
increased by 4 mboe/d from the Mukhaizna field.
• Exploration expense
was $99 million in 4Q09.
6
7
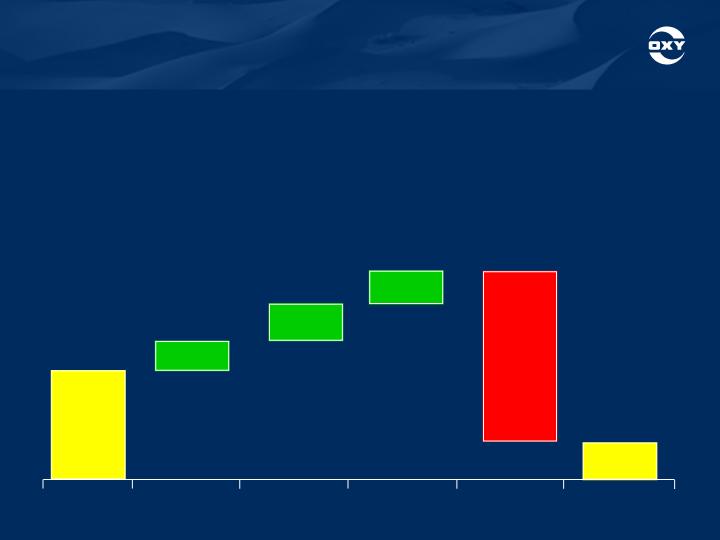
4Q
08
Sales
Volume
/ Mix
All
Others
Operations/
Manufacturing*
Sales
Price
4Q
09
$217
$33
$27
$42
$35
$288
($
in millions)
*Lower
energy costs.
Fourth
Quarter 2009 Earnings - Chemical
Segment Variance Analysis - 4Q09 vs. 4Q08
Segment Variance Analysis - 4Q09 vs. 4Q08
Fourth
Quarter 2009 Earnings - Chemical
Segment Variance Analysis - 4Q09 vs. 4Q08
Segment Variance Analysis - 4Q09 vs. 4Q08
• Core
Results for 4Q09 of $33 mm vs. $217 mm in 4Q08
• Core
Results for 4Q09 of $33 mm vs. $217 mm in 4Q08
– Reflects the
continued weakness in most domestic markets, but in particular U.S.
housing, durable goods and agricultural sectors.
housing, durable goods and agricultural sectors.
– Reflects the
continued weakness in most domestic markets, but in particular U.S.
housing, durable goods and agricultural sectors.
housing, durable goods and agricultural sectors.
7
8
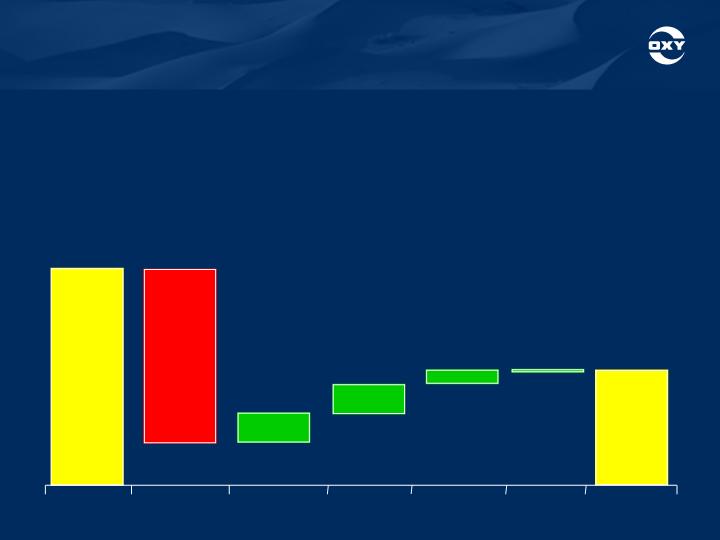
4Q
08
Marketing
Gas
Processing
Power
Generation
All
Others
4Q
09
$170
$81
$132
$18
$6
$1
($
in millions)
$18
Dolphin
Pipeline
Fourth
Quarter 2009 Earnings - Midstream
Segment Variance Analysis - 4Q09 vs. 4Q08
Segment Variance Analysis - 4Q09 vs. 4Q08
Fourth
Quarter 2009 Earnings - Midstream
Segment Variance Analysis - 4Q09 vs. 4Q08
Segment Variance Analysis - 4Q09 vs. 4Q08
• Core
Results for 4Q09 of $81 mm vs. $170 mm in 4Q08
• Core
Results for 4Q09 of $81 mm vs. $170 mm in 4Q08
– The decrease was due
to lower year-over-year margins in the marketing
business, partially offset by improved NGL margins resulting from lower
maintenance expenses, energy costs and property taxes in the gas processing
business and higher income from the Dolphin Pipeline.
business, partially offset by improved NGL margins resulting from lower
maintenance expenses, energy costs and property taxes in the gas processing
business and higher income from the Dolphin Pipeline.
8

9
Fourth
Quarter 2009 Earnings -
Full Year 2009 Results
Full Year 2009 Results
YTD2009 YTD2008
• Net Income ($
mm)
$2,915 $6,857
EPS (diluted) $3.58 $8.34
• Core Results ($
mm) $3,083 $7,348
EPS
(diluted) $3.78 $8.94
• Oil and Gas Sales
Volumes (mboe/d)
645 601
– +7.3%
year-over-year
• Oil and gas cash
production costs, excluding production and property taxes, were
$10.37 p/boe for 2009, a 15% decline from 2008 full year costs of $12.13 p/boe.
$10.37 p/boe for 2009, a 15% decline from 2008 full year costs of $12.13 p/boe.
• Taxes - other than
on income were $1.77 p/boe for 2009 compared to $2.62 p/boe
for all of 2008. These costs, which are sensitive to product prices, reflect lower
crude oil and gas prices in 2009.
for all of 2008. These costs, which are sensitive to product prices, reflect lower
crude oil and gas prices in 2009.
• Capex for 2009 was
$3.6 billion.
– Capital expenditures
by segment were 79% in Oil and Gas, 6% in Chemical and 15% in
Midstream.
Midstream.
– The Oil and Gas
expenditures were 56% in foreign operations and 44%
domestically.
9
10
$7,600
$40
$1,065
$1,750
$1,230
Available
Cash
Capex
Net
Debt
Issuance
Dividends
Acquisitions
&
Foreign
Bonuses
Ending
Cash
Balance
12/31/09
Cash
Flow
From
Operations
$5,800
($
in millions)
Beginning
Cash
$1,800
12/31/08
$3,600
Other
$5
Debt
Issuance
$740
Debt
Reduction
$700
Fourth
Quarter 2009 Earnings -
Full Year 2009 Cash Flow
Full Year 2009 Cash Flow
10

11
Fourth
Quarter 2009 Earnings -
Shares Outstanding, Debt and Returns
Shares Outstanding, Debt and Returns
Shares Outstanding
(mm) 2009 12/31/09
Weighted
Average Basic
811.3
Weighted
Average Diluted
813.8
Basic
Shares Outstanding 812.0
Diluted
Shares Outstanding
814.4
2009
Debt/Capital
9%
ROE 10.3%
ROCE 9.6%
11

12
Fourth
Quarter 2009 Earnings -
2010 Reporting Changes
2010 Reporting Changes
Fourth
Quarter 2009 Earnings -
2010 Reporting Changes
2010 Reporting Changes
• Beginning
in 2010, we are making three reporting changes
which will impact comparability between years.
which will impact comparability between years.
• Beginning
in 2010, we are making three reporting changes
which will impact comparability between years.
which will impact comparability between years.
• #1
—
Historically,
our production volumes have been reported
as a mix of pre-tax and after tax volumes while our revenues
have reflected only pre-tax sales.
as a mix of pre-tax and after tax volumes while our revenues
have reflected only pre-tax sales.
• #1
—
Historically,
our production volumes have been reported
as a mix of pre-tax and after tax volumes while our revenues
have reflected only pre-tax sales.
as a mix of pre-tax and after tax volumes while our revenues
have reflected only pre-tax sales.
– Difference is caused
by our PSCs in the Middle East and North Africa
where production is immediately taken and sold to pay the local income
tax.
where production is immediately taken and sold to pay the local income
tax.
– Difference is caused
by our PSCs in the Middle East and North Africa
where production is immediately taken and sold to pay the local income
tax.
where production is immediately taken and sold to pay the local income
tax.
– We have treated this
as additional revenues but not additional
production.
production.
– We have treated this
as additional revenues but not additional
production.
production.
– To simplify our
reporting and to conform with industry practice, our
production and our revenues will now be tied.
production and our revenues will now be tied.
– To simplify our
reporting and to conform with industry practice, our
production and our revenues will now be tied.
production and our revenues will now be tied.
– Beginning this year
we will refer to production on this more accurate and
consistent basis.
consistent basis.
– Beginning this year
we will refer to production on this more accurate and
consistent basis.
consistent basis.
– All references to
growth and volume comparisons will be against these
reformatted production volumes.
reformatted production volumes.
– All references to
growth and volume comparisons will be against these
reformatted production volumes.
reformatted production volumes.
– For example, the
production from last year will be referred to as 714
mboe/d rather than 645 mboe/d for the year.
mboe/d rather than 645 mboe/d for the year.
– For example, the
production from last year will be referred to as 714
mboe/d rather than 645 mboe/d for the year.
mboe/d rather than 645 mboe/d for the year.
– This change will
have no effect on the company's financial statements.
– This change will
have no effect on the company's financial statements.
12

13
Fourth
Quarter 2009 Earnings -
2010 Reporting Changes
2010 Reporting Changes
Fourth
Quarter 2009 Earnings -
2010 Reporting Changes
2010 Reporting Changes
• #2
— We have combined most of our gas production in the mid
-continental regions of the US into a single business unit called
Midcontinent Gas.
-continental regions of the US into a single business unit called
Midcontinent Gas.
• #2
— We have combined most of our gas production in the mid
-continental regions of the US into a single business unit called
Midcontinent Gas.
-continental regions of the US into a single business unit called
Midcontinent Gas.
– This was done in
order to take advantage of common development
methods and production optimization opportunities.
methods and production optimization opportunities.
– This was done in
order to take advantage of common development
methods and production optimization opportunities.
methods and production optimization opportunities.
– This business unit
will include:
– This business unit
will include:
• the Hugoton
field;
• the Hugoton
field;
• the Piceance
basin;
• the Piceance
basin;
• and the bulk of
the Permian basin non-associated gas assets, which had
been reported as part of the Permian business unit through the end of 2009.
been reported as part of the Permian business unit through the end of 2009.
• and the bulk of
the Permian basin non-associated gas assets, which had
been reported as part of the Permian business unit through the end of 2009.
been reported as part of the Permian business unit through the end of 2009.
– Starting in 2010,
these assets will be reported in Midcontinent Gas.
– Starting in 2010,
these assets will be reported in Midcontinent Gas.
– As a result,
Midcontinent Gas unit's production will be approximately
75% gas and 25% liquids.
75% gas and 25% liquids.
– As a result,
Midcontinent Gas unit's production will be approximately
75% gas and 25% liquids.
75% gas and 25% liquids.
– Permian's production
will go from 84% liquids and 16% gas, to 89%
liquids and 11%, mostly associated, gas.
liquids and 11%, mostly associated, gas.
– Permian's production
will go from 84% liquids and 16% gas, to 89%
liquids and 11%, mostly associated, gas.
liquids and 11%, mostly associated, gas.
13

14
Fourth
Quarter 2009 Earnings -
2010 Reporting Changes
2010 Reporting Changes
Fourth
Quarter 2009 Earnings -
2010 Reporting Changes
2010 Reporting Changes
• #3
— Capitalized CO2
• #3
— Capitalized CO2
– Oxy's policy
regarding tertiary recovery is to capitalize costs, such as
CO2, when they support development of proved reserves and generally
expense these costs when they support current production.
CO2, when they support development of proved reserves and generally
expense these costs when they support current production.
– In 2009, we
capitalized approximately 50% of the CO2 injected in the
Permian basin.
Permian basin.
– In 2009, we
capitalized approximately 50% of the CO2 injected in the
Permian basin.
Permian basin.
– As the CO2 program matures, a larger
portion of the injected gas
supports current production.
supports current production.
– As the CO2 program matures, a larger
portion of the injected gas
supports current production.
supports current production.
– Beginning in 2010,
we will be expensing 100% of the CO2 injected, in
order to simplify the process of determining the portion that should be
capitalized versus expensed.
order to simplify the process of determining the portion that should be
capitalized versus expensed.
– Beginning in 2010,
we will be expensing 100% of the CO2 injected, in
order to simplify the process of determining the portion that should be
capitalized versus expensed.
order to simplify the process of determining the portion that should be
capitalized versus expensed.
– In 2009, $69 million
of CO2 costs were
capitalized.
– In 2009, $69 million
of CO2 costs were
capitalized.
14

15
Fourth
Quarter 2009 Earnings - 1Q10 Outlook
• We expect oil and
gas sales volumes to increase from the
reformatted 4Q09 amount of 722 mboe/d to about 730 to 740
mboe/d in 1Q10 at about current oil prices.
reformatted 4Q09 amount of 722 mboe/d to about 730 to 740
mboe/d in 1Q10 at about current oil prices.
– Production
increases will come from California, Bahrain and Oman.
• Commodity Price
Sensitivity - Earnings
– At current market
prices, a $1.00 per barrel change in oil prices impacts oil
and gas quarterly earnings before income taxes by about $36 mm;
and gas quarterly earnings before income taxes by about $36 mm;
– A swing of $0.50
per mm BTU in domestic gas prices has a $24 mm impact
on quarterly earnings before income taxes;
on quarterly earnings before income taxes;
• We expect 1Q10
exploration expense to be about $75 mm
for seismic and drilling for our exploration programs.
for seismic and drilling for our exploration programs.
15

16
Fourth
Quarter 2009 Earnings - 1Q10 Outlook
Fourth
Quarter 2009 Earnings - 1Q10 Outlook
• For the Chemical
segment:
– The international
markets remain solid;
– In the U.S., we have
a competitive advantage against foreign
products; however, the housing and construction markets remain
weak, which will limit improvement in sales volumes and margins.
products; however, the housing and construction markets remain
weak, which will limit improvement in sales volumes and margins.
– Chemical earnings
for 1Q10 are expected to be in the range of $30
mm to $50 mm.
mm to $50 mm.
• We expect our
combined worldwide tax rate in 1Q10 to be in
the range of 42 to 43 percent depending on the split between
domestic and foreign sourced income.
the range of 42 to 43 percent depending on the split between
domestic and foreign sourced income.
16

17
Fourth
Quarter 2009 Earnings -
2010 Capital Spending and DD&A
2010 Capital Spending and DD&A
Fourth
Quarter 2009 Earnings -
2010 Capital Spending and DD&A
2010 Capital Spending and DD&A
• We expect capital
spending for the total year of 2010 to be
about $4.3 billion.
about $4.3 billion.
• We expect capital
spending for the total year of 2010 to be
about $4.3 billion.
about $4.3 billion.
– Our capital program
will continue to focus on ensuring that our returns
remain well above our cost of capital.
remain well above our cost of capital.
– Our capital program
will continue to focus on ensuring that our returns
remain well above our cost of capital.
remain well above our cost of capital.
– The additional
capital from 2009's $3.6 billion level will be allocated to
the Oil and Gas segment.
the Oil and Gas segment.
– The additional
capital from 2009's $3.6 billion level will be allocated to
the Oil and Gas segment.
the Oil and Gas segment.
– Of this
increase:
– Of this
increase:
• about a quarter
each will go to California and Iraq;
• about a quarter
each will go to California and Iraq;
• about 15% to
Bahrain and 10% to Midcontinent Gas.
• about 15% to
Bahrain and 10% to Midcontinent Gas.
– As a result, the
capital allocation will be approximately 82% in Oil and
Gas with the remainder being spent in Midstream and Chemical.
Gas with the remainder being spent in Midstream and Chemical.
– As a result, the
capital allocation will be approximately 82% in Oil and
Gas with the remainder being spent in Midstream and Chemical.
Gas with the remainder being spent in Midstream and Chemical.
• Our Oil and Gas
DD&A expense for 2010 should be
approximately $10.75 p/boe.
approximately $10.75 p/boe.
• Our Oil and Gas
DD&A expense for 2010 should be
approximately $10.75 p/boe.
approximately $10.75 p/boe.
• Depreciation for the
other two segments should be
approximately $450 million.
approximately $450 million.
• Depreciation for the
other two segments should be
approximately $450 million.
approximately $450 million.
17
18
Fourth
Quarter 2009 Earnings -
California Exploration
California Exploration
Fourth
Quarter 2009 Earnings -
California Exploration
California Exploration
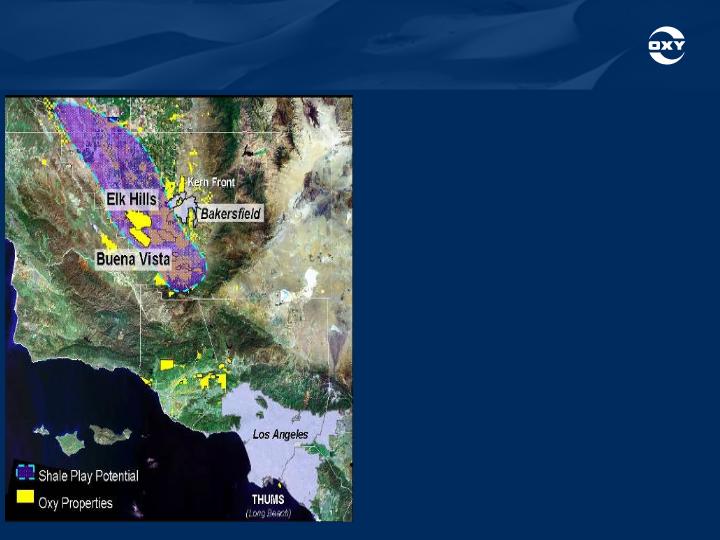
• Excluding
the Kern County
discovery:
discovery:
• Excluding
the Kern County
discovery:
discovery:
– Over the course of
a couple of
years, we have drilled 39 exploration
wells seeking non-traditional
hydrocarbon bearing zones in
California.
years, we have drilled 39 exploration
wells seeking non-traditional
hydrocarbon bearing zones in
California.
– Over the course of
a couple of
years, we have drilled 39 exploration
wells seeking non-traditional
hydrocarbon bearing zones in
California.
years, we have drilled 39 exploration
wells seeking non-traditional
hydrocarbon bearing zones in
California.
– Of these wells, 12
are commercial
and 10 are currently being
evaluated;
and 10 are currently being
evaluated;
– Of these wells, 12
are commercial
and 10 are currently being
evaluated;
and 10 are currently being
evaluated;
– Oxy holds 1.3 mm
acres of net fee
minerals and leasehold in CA, which
have been acquired in the last few
years to exploit these opportunities.
Discoveries similar to the Kern
County discovery are possible in this
net acre position.
minerals and leasehold in CA, which
have been acquired in the last few
years to exploit these opportunities.
Discoveries similar to the Kern
County discovery are possible in this
net acre position.
– Additionally, we
continue to pursue
shale production which is expected
to produce oil on this acreage.
shale production which is expected
to produce oil on this acreage.
– Additionally, we
continue to pursue
shale production which is expected
to produce oil on this acreage.
shale production which is expected
to produce oil on this acreage.
18

19
*Production and
producing wells as of each of the quarterly earnings disclosure
dates.
Fourth
Quarter 2009 Earnings -
California Exploration - Kern County Discovery
California Exploration - Kern County Discovery
Fourth
Quarter 2009 Earnings -
California Exploration - Kern County Discovery
California Exploration - Kern County Discovery
KERN
COUNTY DISCOVERY AREA
KERN
COUNTY DISCOVERY AREA
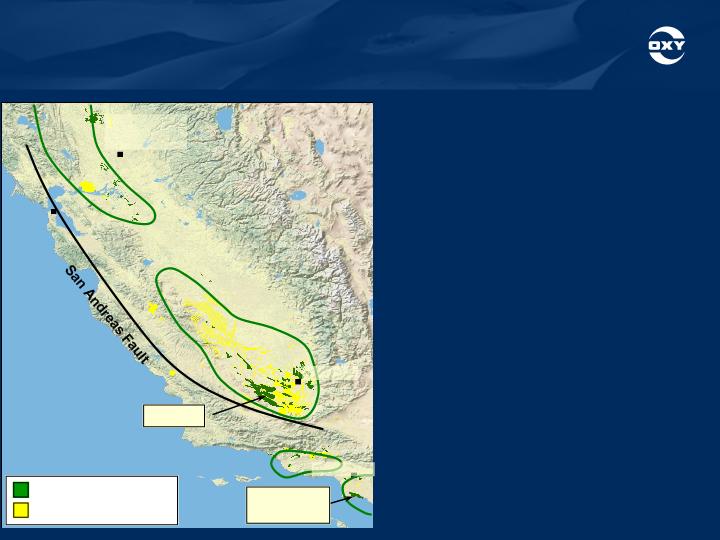
The
discovery, which is near Elk Hills, is not below any
producing zones.
producing zones.
The
discovery, which is near Elk Hills, is not below any
producing zones.
producing zones.
4Q09 3Q09 2Q09 1Q09
4Q09 3Q09 2Q09 1Q09
Gross
Production*
Gross
Production*
– Natural Gas
(mmcf/d) 145 105 74 28
– Natural Gas
(mmcf/d) 145 105 74 28
– Liquids (mb/d) 7.5 8.5 5 3
– Liquids (mb/d) 7.5 8.5 5 3
– Total mboe/d 31.7 26.0 17.3 7.7
– Total mboe/d 31.7 26.0 17.3 7.7
Number
of producing wells* 15 10 6 4
Number
of producing wells* 15 10 6 4
19
20
San
Joaquin
Valley
OXY
Producing Properties
Exploration
Acreage
Elk
Hills
Long
Beach
&
Tidelands
San
Francisco
Sacramento
Bakersfield
Los
Angeles
Sacramento
Valley
Fourth
Quarter 2009 Earnings -
California Exploration - Kern County Discovery
California Exploration - Kern County Discovery
Fourth
Quarter 2009 Earnings -
California Exploration - Kern County Discovery
California Exploration - Kern County Discovery
• Cumulative gross
production
since the start of production
through 12/31/09 has been 19.4
bcf of gas and 1.5 mm barrels of
liquids;
since the start of production
through 12/31/09 has been 19.4
bcf of gas and 1.5 mm barrels of
liquids;
• Cumulative gross
production
since the start of production
through 12/31/09 has been 19.4
bcf of gas and 1.5 mm barrels of
liquids;
since the start of production
through 12/31/09 has been 19.4
bcf of gas and 1.5 mm barrels of
liquids;
• We expect to drill 8
wells in the
first half of 2010 focusing on oil
drilling and exploring the limits of
the field;
first half of 2010 focusing on oil
drilling and exploring the limits of
the field;
• We expect to drill 8
wells in the
first half of 2010 focusing on oil
drilling and exploring the limits of
the field;
first half of 2010 focusing on oil
drilling and exploring the limits of
the field;
• We also expect to
add skid
mounted gas processing facilities
by 2Q10;
mounted gas processing facilities
by 2Q10;
• We also expect to
add skid
mounted gas processing facilities
by 2Q10;
mounted gas processing facilities
by 2Q10;
• We expect to add to
our gas
production once these facilities
are installed.
production once these facilities
are installed.
• We expect to add to
our gas
production once these facilities
are installed.
production once these facilities
are installed.
20

21
21