Attached files
 Fourth Quarter 2009 Earnings Conference Call January 27, 2010 Sunoco Logistics Partners L.P. Exhibit 99.3 |
 Forward-Looking Statement You should review this slide presentation in conjunction with the fourth
quarter 2009 earnings conference call for Sunoco Logistics
Partners L.P., held on January 27 at 9:00 a.m. EDT. You may listen to the audio portion of the conference call on our website at www.sunocologistics.com or by dialing (USA toll- free) 1-877-297-3442. International callers should dial
1-706-643-1335. Please enter Conference ID #49826444. Audio replays of the conference call will be available for two weeks after the
conference call beginning approximately two hours following the
completion of the call. To access the replay, dial 1-800-642-1687. International callers should dial 1-706-645-9291. Please
enter Conference ID # 49826444. During the call, those statements
we make that are not historical facts are forward-looking statements. Although we believe the assumptions underlying these
statements are reasonable, investors are cautioned that such
forward-looking statements involve risks that may affect our business prospects and performance, causing actual results to differ from those discussed during the
conference call. Such risks and uncertainties include, among
other things: our ability to successfully consummate announced acquisitions and organic growth projects and integrate them into existing business operations; the ability of announced acquisitions to be cash-flow accretive; increased competition;
changes in the demand both for crude oil that we buy and sell, as
well as for crude oil and refined products that we store and distribute; the loss of a major customer; changes in our tariff rates; changes in throughput
of third-party pipelines that connect to our pipelines and
terminals; changes in operating conditions and costs; changes in the level of environmental remediation spending; potential equipment malfunction; potential
labor relations problems; the legislative or regulatory
environment; plant construction/repair delays; and political and economic conditions, including the impact of potential terrorist acts and international hostilities. These and other applicable risks and uncertainties are described more fully in our Form 10-Q, filed with the Securities and Exchange Commission on November 4, 2009. We undertake no obligation to update publicly any forward-looking statements whether as a result of new
information or future events. 2 |
 Q4 2009 Assessment Record net income for 2009 of $250.4 million compared to $214.5 million in
the prior year; Record performance in all three business
segments for 2009 Record performance in all three business
segments for 2009 Quarterly net income of $54.4 million or $1.30
per diluted LP unit Distributable cash flow for 2009 increased to
$265.9 million, a 12.2% increase from 2008 Increased total distribution to $1.09 ($4.36 annualized) per unit, a 10.1
percent increase over the prior year’s distribution
– Represents the twenty-sixth distribution increase in the past
twenty-seven quarters Debt to EBITDA ratio of 2.5 for the last twelve months 3 |
 Incentive Distribution Repurchase 4 Cancelled Incentive Distribution Rights Exchanged Incentive Distribution Rights Marginal Percentage Marginal Percentage Interest in Distributions Interest in Distributions Total Quarterly Distribution Target Amount General Partner (1) Unitholders Total Quarterly Distribution Target Amount General Partner (1) Unitholders Minimum Quarterly Distribution $0.450 2% 98% First Target Distribution up to $0.500 2% 98% No Change Second Target Distribution above $0.500 up to $0.575 15% 85% Third Target Distribution above $0.575 up to $0.700 25% 75% above $0.575 up to $1.5825 37% 63% Thereafter above $0.700 50% 50% above $1.5825 50% 50% (1) Marginal IDR percentage interest is inclusive of Sunoco Partners LLC's 2% general partner interest. |
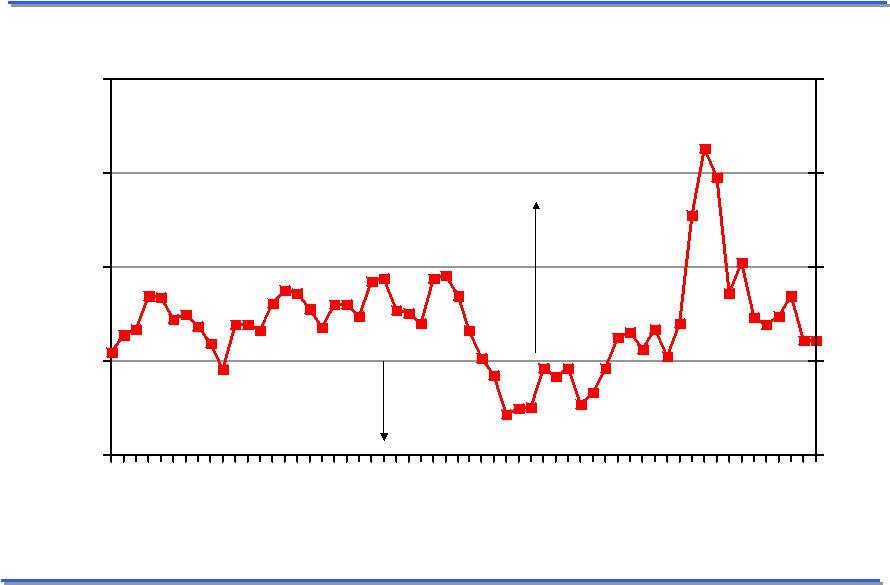 WTI NYMEX Month 2 vs Month 1 -2 0 2 4 6 2005 2006 2007 2008 2009 -2 0 2 4 6 MB contango backwardation 5 |
 Q4 2009 Financial Highlights ($ in millions, unaudited) Three Months Ended Twelve Months Ended December 31, December 31, 2009 2008 2009 2008 Sales and operating revenue 1,661.0 $ 1,573.0 $ 5,401.8 $ 10,112.3 $ Other income 6.6 4.4 27.9 24.3 Total revenues 1,667.6 1,577.4 5,429.7 10,136.6 Cost of products sold and other operating expenses 1,572.8 1,469.3 5,023.3 9,786.0 Depreciation and amortization 12.7 10.5 48.0 40.0 Selling, general and administrative expenses 15.7 14.5 63.3 59.3 Impairment Charges - - - 5.7 Total costs and expenses 1,601.2 1,494.3 5,134.6 9,891.0 Operating income 66.4 83.1 295.1 245.6 Interest cost and debt expense, net 12.7 9.0 49.0 35.0 Capitalized interest (0.7) (1.2) (4.3) (3.9) Net Income 54.4 $ 75.3 $ 250.4 $ 214.5 $ 6 |
 Q4 2009 Financial Highlights 7 (amounts in millions, except unit and per share unit amounts, unaudited)
Three Months Ended Twelve Months Ended December 31, December 31, 2009 2008 2009 2008 Calculation of Limited Partners' interest: Net Income 54.4 $ 75.3 $ 250.4 $ 214.5 $ Less: General Partners' interest (13.8) (10.9) (52.7) (37.1) Limited Partners' interest in Net Income 40.6 $ 64.4 $ 197.7 $ 177.4 $ Net Income per Limited Partner unit: Basic (1) 1.31 $ 2.25 $ 6.52 $ 6.19 $ Diluted (1) 1.30 $ 2.23 $ 6.48 $ 6.15 $ Weighted Average Limited Partners' units outstanding (in thousands): Basic 30,981 28,657 30,311 28,650 Diluted 31,199 28,854 30,518 28,837 (1) Effective January 1, 2009, the Partnership adopted a new
pronuncement , “Application of the Two-Class Method
under an existing standard to Master Limited
Partnerships.” The new pronouncement requires undistributed
earnings to be allocated to the limited partner and general
partner interests in accordance with the Partnership
agreement. Prior period amounts have been restated for
comparative purposes. This change resulted in an increase in net
income per diluted LP unit of $0.61 and $1.17 for the three and
twelve months ended December 31, 2009, respectively.
|
 Q4 2009 Financial Highlights ( $ in millions, unaudited) Three Months Ended Twelve Months Ended December 31, December 31, 2009 2008 2009 2008 Capital Expenditure Data: Maintenance capital expenditures 16.8 $
10.0 $
32.2 $
25.7 $
Expansion capital expenditures 49.0 232.2 193.6 305.6 Total 65.8 $
242.2 $ 225.8 $ 331.3 $ December 31, December 31, 2009 2008 Balance Sheet Data (at period end): Cash and cash equivalents 2.0 $
2.0 $
Total debt 868.4 747.6 Total Partners' Capital 861.6 669.9 8 |
 Q4 2009 Financing Update ($ in millions, unaudited) Balance as of: December 31, 2009 December 31, 2008 Revolving Credit Facilities (1): $400 million - due November 2012 (2) 268,973 $
323,385 $
$62.5 million - due September 2011 - - Senior Notes: 7.25% Senior Notes - due 2012 250,000 250,000 6.125% Senior Notes - due 2016 175,000 175,000 8.75% Senior Notes - due 2014 175,000 - Less: unamortized bond discount (549) (754) Total Debt 868,424 $
747,631 $
(1) As of
December 31, 2009, the Partnership has unutilized borrowing capacity of $188.5 million under its revolving credit facilities. (2) On April 17, 2009, the Partnership issued 2.2 million common units
representing a limited partnership interest in Sunoco Logistics
Partners LP. Net proceeds of approximately $109.5 million were used to reduce outstanding borrowings under the $400 million revolving
credit facility. 9 |
 Refined Products Pipeline System 10 (amounts in millions, unless otherwise noted, unaudited) Three Months Ended Twelve Months Ended December 31, December 31, 2009 (4) 2008 (3) 2009 (4) 2008 (3) Financial Highlights Sales and operating revenue 33.1 $ 29.9 $ 127.7 $ 103.5 $ Other income 3.4 2.0 12.6 8.5 Total revenues 36.5 31.9 140.3 112.0 Operating expenses 16.4 14.8 60.1 48.4 Depreciation and amortization 4.1 2.7 13.7 9.4 Selling, general and administrative expenses 5.8 4.7 21.8 19.8 Operating income 10.2 $ 9.7 $ 44.7 $ 34.4 $ Operating Highlights (1) Total shipments (mm barrel miles per day) (2) 56.5 55.0 57.7 46.9 Revenue per barrel mile (cents) 0.636 0.590 0.606 0.603 (1) Excludes amounts attributable to equity ownership interests in the
corporate joint ventures. (2) Represents total average daily
pipeline throughput multiplied by the number of miles of pipeline through which each barrel has been shipped. (3) On January 1, 2009 the reporting segments were realigned. All prior
period reporting segment results were recast for comparative purposes. (4) Includes results from the Partnership's purchase of the MagTex refined products terminals from the date of acquisition. |
 Terminal Facilities 11 (amounts in millions, unless otherwise noted, unaudited) Three Months Ended Twelve Months Ended December 31, December 31, 2009 2008 2009 2008 Financial Highlights Sales and operating revenue 51.9 $ 43.1 $ 191.2 $ 162.5 $ Other income 0.4 0.0 1.9 0.8 Total revenues 52.3 43.1 193.1 163.3 Operating expenses 22.7 18.7 71.1 64.3 Depreciation and amortization 4.4 4.3 18.9 16.4 Selling, general and administrative expenses 4.7 4.5 19.4 18.4 Impairment charge - - - 5.7 Operating income 20.5 $ 15.6 $ 83.7 $ 58.5 $ Operating Highlights Terminal throughput (000's bpd) Refined product terminals (2), (3) 466.2 460.2 462.2 436.2 Nederland terminal 531.4 479.6 597.1 526.0 Refinery terminals (1) 573.3 669.5 591.2 653.3 (1) Consists of the Partnership Fort Mifflin Terminal Complex, the Marcus
Hook Tank Farm and the Eagle Point Dock. (2) Includes results
from the Partnership's purchase of the MagTex refined products
terminals from the date of acquisition. (3) Includes results
from the Partnership's purchase of a refined products terminal in Romulus, MI from the acquisition date. |
 Crude Oil Pipeline System 12 (amounts in millions, unless otherwise noted, unaudited) Three Months Ended Twelve Months Ended December 31, December 31, 2009 2008 (3) 2009 2008 (3) Financial Highlights Sales and operating revenue 1,576.0 $ 1,500.0 $ 5,082.8 $ 9,846.4 $ Other income 2.7 2.4 13.4 14.9 Total revenues 1,578.7 1,502.4 5,096.2 9,861.3 Cost of products sold and other operating expenses 1,533.7 1,435.7 4,892.0 9,673.2 Depreciation and amortization 4.1 3.6 15.4 14.3 Selling, general and administrative expenses 5.2 5.3 22.1 21.1 Operating income 35.7 $ 57.8 $ 166.7 $ 152.7 $ Operating Highlights (1) Terminal throughput (000's bpd) Crude oil pipeline throughput (000's bpd) 687.1 711.6 658.0 682.6 Crude oil purchases at wellhead (000's bpd) 177.2 185.0 181.6 177.7 Gross margin per barrel of pipeline throughput (cents) (2) 60.4 93.4 73.0 63.0 (1) Excludes amounts attributable to equity ownership interests in the
corporate joint ventures. (2) Represents total segment sales and
other operating revenue minus cost of products sold and operating expenses and depreciation and amortization divided by crude oil pipeline throughput. (3) On January 1, 2009 the reporting segments were realigned. All prior
period reporting segment results were recast for comparative purposes. |
 Appendix Sunoco Logistics Partners L.P. 13 |
 Non-GAAP Financial Measures ($ in thousands, unaudited) 14 Three Months Ended Twelve Months Ended December 31, December 31, 2009 2008 2009 2008 Net Income 54,353 $ 75,320 $ 250,362 $ 214,480 $ Add: Interest cost and debt expense, net 12,729 9,063 49,007 34,967 Less: Capitalized Interest (696) (1,242) (4,325) (3,855) Add: Depreciation and amortization 12,337 10,555 47,665 40,054 Add: Impairment charge - - - 5,674 EBITDA 78,723 $ 93,696 $ 342,709 $ 291,320 $ Less: Interest expense 12,033 7,821 44,682 31,112 Less: Maintenance capital 16,846 9,998 32,172 25,652 Add: Sunoco reimbursements - - - 2,426 Distributable Cash Flow ("DCF") 49,844 $ 75,877 $ 265,855 $ 236,982 $ Non-GAAP Financial Measures (1) In this release, the Partnership’s EBITDA and DCF references are
not presented in accordance with generally accepted accounting principles (“GAAP”) and are not intended to be used in lieu of GAAP presentations of net income.
Management of the Partnership believes EBITDA and DCF information enhance an investor's understanding of a business’ ability to generate cash for payment of distributions
and other purposes. In addition, EBITDA is also used as a measure in the Partnership's revolving credit facilities in determining its compliance with certain covenants.
However, there may be contractual, legal, economic or other reasons which may prevent the Partnership from satisfying principal and interest obligations with respect to indebtedness
and may require the Partnership to allocate funds for other purposes. EBITDA and DCF do not represent and should not be considered an alternative to net income or
operating income as determined under United States GAAP and may not be comparable to other similarly titled measures of other businesses.
|
 Non-GAAP Financial Measures ($ in thousands, unaudited) 15 Earnings before interest, taxes, depreciation Twelve Months Ended and amortization ("EBITDA") December 31, 2009 Net Income 250,362 $
Add: Interest
cost and debt expense 49,007 Less: Capitalized interest (4,325) Add: Depreciation and amortization 47,665 EBITDA 342,709 $
Total Debt as of
December 31, 2009 868,424 $
Total Debt to
EBITDA Ratio 2.5 Non-GAAP Financial Measures (1) In this release, the Partnership’s EBITDA and DCF references are
not presented in accordance with generally accepted accounting principles (“GAAP”) and are not intended to be used in lieu of GAAP presentations of net income.
Management of the Partnership believes EBITDA and DCF information enhance an investor's understanding of a business’ ability to generate cash for payment of distributions
and other purposes. In addition, EBITDA is also used as a measure in the Partnership's revolving credit facilities in determining its compliance with certain covenants.
However, there may be contractual, legal, economic or other reasons which may prevent the Partnership from satisfying principal and interest obligations with respect to indebtedness
and may require the Partnership to allocate funds for other purposes. EBITDA and DCF do not represent and should not be considered an alternative to net income or
operating income as determined under United States GAAP and may not be comparable to other similarly titled measures of other businesses.
|
 Refined Products Pipeline System Recast (amounts in millions, unless otherwise noted, unaudited) 43.1 0.601 45.5 0.587 Total shipments (mm barrel miles per day) (3) Revenue per barrel mile (cents) Operating Highlights (1)(2) 10.9 2.2 4.9 $ 8.6 11.6 2.2 5.1 $ 6.7 Operating expenses Depreciation and amortization Selling, general and administrative expenses Operating income $ 23.6 3.0 26.6 $ 24.3 1.3 25.6 Sales and other operating revenue Other income Total revenues Financial Highlights (1) Q2 2008 Q1 2008 (1) On January 1, 2009 the reporting segments were realigned. All
prior period reporting segment results were recast for comparative purposes. (2) Excludes amounts attributable to equity ownership interests in the
corporate joint ventures. (3) Represents total average daily
pipeline throughput multiplied by the number of miles of pipeline through which each barrel has been shipped. Q3 2008 $ 25.7 2.3 27.9 11.1 2.2 5.1 $ 9.5 Q4 2008 14.8 2.7 4.7 $ 9.7 $ 29.9 2.0 31.9 43.8 0.638 55.0 0.590 16 |
 Crude Oil Pipeline System Recast (amounts in millions, unless otherwise noted, unaudited) 694.1 177.4 51.2 675.5 171.5 48.5 Crude oil pipeline throughput (000’s bpd) Crude oil purchases at wellhead (000’s bpd) Gross margin per barrel of pipeline throughput (cents) (3) Operating Highlights (1)(2) 3,216.1 3.6 5.0 $ 32.8 2,298.0 3.5 5.5 $ 27.3 Operating expenses Depreciation and amortization Selling, general and administrative expenses Operating income $ 3,252.5 5.0 3,257.5 $2,330.7 3.6 2,334.3 Sales and other operating revenue Other income Total revenues Financial Highlights (1) Q2 2008 Q1 2008 (1) On January 1, 2009 the reporting segments were realigned. All
prior period reporting segment results were recast for comparative purposes. (2) Excludes amounts attributable to equity ownership interests in the
corporate joint ventures. (3) Represents total segment sales and
other operating revenue minus cost of products sold and operating expenses and depreciation and amortization divided by crude oil pipeline throughput. Q3 2008 $ 2,763.2 4.0 2,767.2 2,723.6 3.6 5.4 $ 34.6 Q4 2008 1,435.7 3.6 5.3 $ 57.8 $ 1,500.0 2.4 1,502.4 649.3 176.7 57.2 711.6 184.9 93.4 17 |