Attached files
| file | filename |
|---|---|
| 8-K - FORM 8-K - FIDELITY SOUTHERN CORP | g21786e8vk.htm |
| EX-99.2 - EX-99.2 - FIDELITY SOUTHERN CORP | g21786exv99w2.htm |
| EX-99.7 - EX-99.7 - FIDELITY SOUTHERN CORP | g21786exv99w7.htm |
| EX-99.6 - EX-99.6 - FIDELITY SOUTHERN CORP | g21786exv99w6.htm |
| EX-99.3 - EX-99.3 - FIDELITY SOUTHERN CORP | g21786exv99w3.htm |
| EX-99.5 - EX-99.5 - FIDELITY SOUTHERN CORP | g21786exv99w5.htm |
| EX-99.4 - EX-99.4 - FIDELITY SOUTHERN CORP | g21786exv99w4.htm |
| EX-99.8 - EX-99.8 - FIDELITY SOUTHERN CORP | g21786exv99w8.htm |
Exhibit 99.1

FOR IMMEDIATE RELEASE
| Contacts: | Martha Fleming, Steve Brolly Fidelity Southern Corporation (404) 240-1504 |
FIDELITY SOUTHERN CORPORATION
REPORTS FOURTH QUARTER NET INCOME; LOSS FOR YEAR;
DECREASED NONPERFORMING ASSETS, INCREASED CAPITAL RATIOS
AND LIQUIDITY LEVELS
REPORTS FOURTH QUARTER NET INCOME; LOSS FOR YEAR;
DECREASED NONPERFORMING ASSETS, INCREASED CAPITAL RATIOS
AND LIQUIDITY LEVELS
ATLANTA, GA (January 21, 2010) — Fidelity Southern Corporation (“Fidelity” or “the Company”)
(NASDAQ:LION), holding company for Fidelity Bank (the “Bank”), reported net income of $1.9 million
for the fourth quarter of 2009 compared to a net loss of $7.6 million for the fourth quarter of
2008 and a net income of $398,000 for the third quarter of 2009. For the year ended December 31,
2009, the net loss was $3.9 million compared to a net loss of $12.2 million for the year ended
December 31, 2008. Basic and diluted income per share for the fourth quarter of 2009 were each
$.11 compared to a loss per share of $.78 for the fourth quarter of 2008 and a loss per share of
$.04 for the third quarter in 2009. Basic and diluted loss per share for the year ended December
31, 2009, were $.71 compared to a loss per share of $1.27 for 2008.
| For the quarter ended | ||||||||||||||||||||
| (dollars in thousands) | 12/31/2008 | 3/31/2009 | 6/30/2009 | 9/30/2009 | 12/31/2009 | |||||||||||||||
Net (Loss) Income |
$ | (7,569 | ) | $ | (3,376 | ) | $ | (2,805 | ) | $ | 398 | $ | 1,928 | |||||||
Taxes |
(5,101 | ) | (2,434 | ) | (2,095 | ) | (346 | ) | 920 | |||||||||||
Provision |
14,700 | 9,600 | 7,200 | 4,500 | 7,500 | |||||||||||||||
Pre-Tax, Pre-Provision Earnings |
2,030 | 3,790 | 2,300 | 4,552 | 10,348 | |||||||||||||||
Less Security Gains |
— | — | — | (519 | ) | (4,789 | ) | |||||||||||||
Core Operating Earnings |
$ | 2,030 | $ | 3,790 | $ | 2,300 | $ | 4,033 | $ | 5,559 | ||||||||||
We show core operating earnings which remove taxes, provisions, and security gains
because we believe that helps show a view of more normalized net revenues. The measure allows
better comparability with prior periods, as well as with peers in the industry who also provide a
similar presentation.
Chairman James B. Miller, Jr. said, “We believe the recession which began in 2007 will
continue through 2010 with a slow improvement going forward. Despite this environment, Palmer
Proctor and our team have worked to reposition our Company. We believe interest rates are subject
to increase this year. Because of this interest rate risk, we have begun repositioning our
investment portfolio resulting in substantial gains in addition to improving core earnings.
Fidelity Southern Corporation
Fourth Quarter Earnings Release
January 21, 2010
Fourth Quarter Earnings Release
January 21, 2010
Our real estate capital exposure continued its rapid decline to 77% at year-end 2009 from 124%
at year-end 2008 for construction and to 144% from 172% for all real estate subject to the 100% and
300% regulations, while we are one of the few banks continuing to lend for home construction. The
most dramatic change was that mortgage loans originated for single family homes increased to $872
million in 2009 from $20 million in 2008. Transaction deposit accounts (including savings)
increased a very substantial 56% in 2009 reflecting the continuing movement of deposits from other
area banks. These results are in part because employment following receipt of TARP has increased
to 500 year-end 2009 from 373 at year-end 2008 giving us additional reach and strength in all
lending areas and in deposit generation. This repositioning, margin improvements, and other
significant changes are explained in some detail in this report.”
CAPITAL
Fidelity reported a total risk based capital ratio for the Bank of 13.44% at December 31,
2009, compared to 12.92% at December 31, 2008. The Leverage Capital ratio at the Bank was 9.24% at
December 31, 2009, compared to 9.97% at December 31, 2008. Both ratios exceeded required
regulatory minimums for well-capitalized institutions. At December 31, 2009, the total risk based
capital ratio increased 25 basis points from September 30, 2009, and the leverage ratio increased
19 basis points from September 30, 2009.
LIQUIDITY
The Company’s net liquid asset ratio, defined as federal funds sold, investments maturing
within 30 days, unpledged securities, available unsecured federal funds lines of credit, FHLB
borrowing capacity and available brokered certificates of deposit divided by total assets increased
from 13.1% at December 31, 2008, to 18.8% at December 31, 2009.
DEPOSITS
Total deposits were $1.551 billion at December 31, 2009, compared to $1.444 billion at
December 31, 2008. The designed change to the deposit mix and reduction in the interest rate paid
on deposit accounts during the period demonstrates the Company’s commitment to improved net
interest margin and liquidity.
| December 31, | September 30, | December 31, | ||||||||||||||||||||||
| 2009 | 2009 | 2008 | ||||||||||||||||||||||
| ($ in thousands) | $ | % | $ | % | $ | % | ||||||||||||||||||
Pure deposits |
$ | 850.6 | 54.9 | % | $ | 822.3 | 51.2 | % | $ | 546.8 | 37.9 | % | ||||||||||||
Core deposits |
$ | 1,194.3 | 77.0 | % | $ | 1,203.8 | 74.9 | % | $ | 936.4 | 64.9 | % | ||||||||||||
Time Deposits > $100,000 |
$ | 257.4 | 16.6 | % | $ | 294.7 | 18.3 | % | $ | 317.5 | 22.0 | % | ||||||||||||
Brokered deposits |
$ | 99.0 | 6.4 | % | $ | 109.0 | 6.8 | % | $ | 189.8 | 13.1 | % | ||||||||||||
Total deposits |
$ | 1,550.7 | 100.0 | % | $ | 1,607.5 | 100.0 | % | $ | 1,443.7 | 100.0 | % | ||||||||||||
Quarterly rate on deposits |
2.01% | 2.37% | 3.15% | |||||||||||||||||||||
2
Fidelity Southern Corporation
Fourth Quarter Earnings Release
January 21, 2010
Fourth Quarter Earnings Release
January 21, 2010
Pure deposits are all transactional and savings deposits (excludes all time deposits) and
Core deposits are transactional, savings, and time deposits under $100,000. The Bank has
aggressively marketed its non-certificate of deposit products in 2009. As a result, demand, money
market and savings accounts increased $303.8 million or 56% compared to December 31, 2008.
ALLOWANCE AND PROVISION
The provision for loan losses for the fourth quarter of 2009 was $7.5 million compared to
$14.7 million for the same period in 2008. In 2008, management increased reserves more than the
net charge-offs as the credit crisis was growing. By the fourth quarter of 2009, non-performing
assets continued to decrease from the 2008 levels.
| (dollars in millions) | 12/31/2008 | 3/31/2009 | 6/30/2009 | 9/30/2009 | 12/31/2009 | |||||||||||||||
Non-performing assets |
$ | 115.2 | $ | 123.5 | $ | 118.1 | $ | 106.3 | $ | 92.9 | ||||||||||
Net charge-offs for the fourth quarter of 2008 were $7.0 million. In the fourth quarter
of 2009 charge-offs were $13.0 million which reflected charge-offs of specific reserves previously
provided for certain construction loans. The provision for loan losses for the year ended December
31, 2009, was $28.8 million compared to $36.6 million for 2008. For the year ended December 31,
2009, net charge-offs were $32.4 million compared to $19.4 million for 2008. The ratio of net
charge-offs to average loans outstanding was 2.44% for the year ended December 31, 2009, compared
to 1.36% for 2008. Fidelity reported an allowance for loan losses of $30.1 million or 2.33% of
total loans at December 31, 2009, compared to $33.7 million or 2.43% of total loans at December 31,
2008, as a result of a decrease in loan outstandings and improving nonaccrual and nonperforming
trends in the indirect portfolio. During the recession of the past two years, the Bank has charged
off a total of $51.8 million in loans while at the same time providing a substantial $65.4 million,
or 126% of charge-offs, in provision for loan losses.
NONPERFORMING ASSETS
Nonperforming loans, repossessions and other real estate (“ORE”) totaled $92.9 million at the
end of the fourth quarter of 2009, a decrease of $13.4 million from September 30, 2009, and a
decrease of $22.3 million from December 31, 2008.
Nonperforming residential construction and development loans at December 31, 2009, included
150 houses and 538 lots and land totaling approximately $56.0 million. During the fourth quarter,
approximately $5.5 million of nonperforming construction loans were paid down by our customers
while approximately $4.3 million in construction loans were moved to nonperforming.
During the fourth quarter, $4.5 million of ORE assets were sold while $5.0 million were added
to ORE. ORE consists of 39 houses, representing 28% of the total ORE balance, 282 lots and four
commercial properties. ORE remained relatively unchanged at $21.8 million at December 31, 2009,
compared to $21.2 million at September 30, 2009. It was $15.1 million at December 31, 2008.
3
Fidelity Southern Corporation
Fourth Quarter Earnings Release
January 21, 2010
Fourth Quarter Earnings Release
January 21, 2010
REAL ESTATE
New residential construction loan advances made during the quarter totaled $5.1 million, while
the payoffs of construction loans totaled $24.0 million. Residential construction and A&D loans
totaled $156.7 million at December 31, 2009, which was down 12.6% from $179.2 million at September
30, 2009. There were 375 houses and 1,617 lots financed at December 31, 2009, compared to 523
houses and 1,939 lots at December 31, 2008.
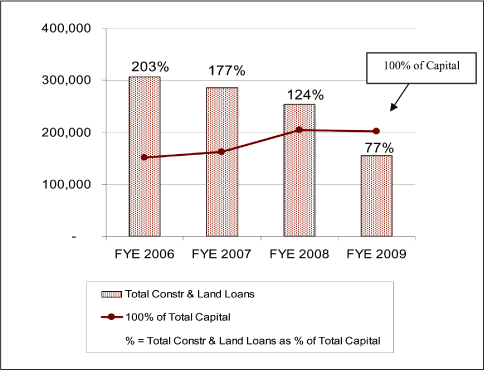
Total residential and commercial construction and land loans decreased to $154.8 million
or 12.0% of loans from $187.2 million or 14.2% of loans at September 30, 2009, and $245.2 million
or 17.7% of loans at December 31, 2008, and as a percentage of capital decreased from 94% at
September 30, 2009, to 77% at December 31, 2009. The regulatory guideline is a maximum of 100%.
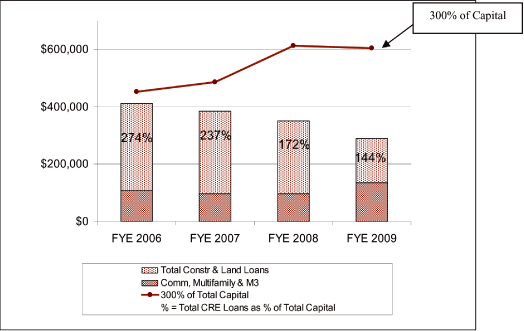
All real estate loans, excluding owner-occupied properties, as a percentage of capital
decreased to 144% at December 31, 2009, from 147% at September 30, 2009. The regulatory guideline
is a maximum of 300%.
4
Fidelity Southern Corporation
Fourth Quarter Earnings Release
January 21, 2010
Fourth Quarter Earnings Release
January 21, 2010
NET INTEREST INCOME
Net interest income for the fourth quarter increased $4.0 million or 37.7% when compared to
the same period in 2008, and increased $928,000 or 6.7% compared to third quarter of 2009. Net
interest margin increased 69 basis points to 3.31% in the fourth quarter of 2009 compared to 2.62%
in the fourth quarter of 2008 and 3.10% in the third quarter of 2009. In addition, average total
interest earning assets increased $136.9 million or 8.3% for the quarter, ended December 31, 2009,
compared to the same quarter in 2008. Net interest income for the year ended December 31, 2009,
increased $5.2 million or 11.1% over the same period in 2008. The net interest margin increased 11
basis points to 2.95% for the year ended December 31, 2009, compared to 2.84% for the same period
in 2008. The increase in net interest income for the quarter and year to date is a result of a
greater reduction in the cost of funds than the decrease in the yield on earning assets and the
increase in earning assets.
INTEREST INCOME
Total interest income for the fourth quarter of 2009 increased $140,000 or .6% compared to the
same period in 2008. The decrease of 45 basis points in the yield on average interest-earning
assets was more than offset by growth in average interest-earning assets for the fourth quarter
2009, which increased $136.9 million or 8.3%. Total interest income for the year ended December
31, 2009, decreased $6.5 million or 6.2% compared to the same period in 2008. The decrease in
interest income in 2009 was the result of a decrease of 77 basis points in the yield on average
interest-earning assets offset in part by the growth in average interest-earning assets in 2009,
which increased $110.9 million or 6.7%. The decrease in yield was primarily the result of the
lower prime lending rate in 2009 compared to 2008.
5
Fidelity Southern Corporation
Fourth Quarter Earnings Release
January 21, 2010
Fourth Quarter Earnings Release
January 21, 2010
INTEREST EXPENSE
Interest expense for the fourth quarter of 2009 decreased $3.9 million or 28.5% compared to
the same period in 2008. The decrease in interest expense was attributable to a 117 basis point
decrease in the cost of interest-bearing liabilities somewhat offset by an increase in average
interest-bearing liabilities of $79.1 million or 5.3%. For the year ended December 31, 2009,
interest expense decreased $11.6 million or 20.2% compared to the same period in 2008. The
decrease in interest expense was attributable to a 92 basis point decrease in the cost of
interest-bearing liabilities somewhat offset by an increase in average interest-bearing liabilities
of $71.6 million or 4.8%. In addition to the general decrease in general deposit rates, the Bank’s
shift in deposit mix toward core demand and savings accounts contributed to the reduction in the
cost of funds. During 2009, high cost time deposits matured and the replacement cost was
significantly lower. In addition, with the additional retail deposits and increasing liquidity
during 2009 compared to 2008, management was able to reduce high cost brokered deposits by $91
million or 48%. The reduction in brokered deposits is expected to continue in 2010.
NONINTEREST INCOME
Noninterest income increased $8.4 million and $16.3 million or 225.7% and 92.7% to $12.2
million and $34.0 million for the fourth quarter and year ended December 31, 2009, respectively,
compared to the same periods in 2008. This increase in noninterest income was a result of higher
mortgage banking activities due to the expansion of the mortgage division in 2009 and higher
investment securities gains. Revenue from mortgage banking activities increased to $3.6 million
and $15.0 million for the fourth quarter and year ended December 31, 2009, respectively, compared
to $95,000 and $340,000 for the same periods in 2008. Mortgage production increased from $20
million in 2008 to $872 million in 2009. Securities gains increased to $4.8 million and $5.3
million for the fourth quarter and year ended December 31, 2009, respectively. The gains are a
result of the Bank repositioning the investment portfolio as part of the interest rate, cash flow,
and capital risk rating strategies. The increase for the year ended December 31, 2009, was
partially offset by lower Indirect lending income, which decreased $998,000 or 19.1% to $4.2
million and lower other income. Indirect lending revenues were hindered by the lack of liquidity
in the financial markets resulting in fewer sales which resulted in lower gains on sales.
Secondary markets in the last several months, however, have begun to show increased buyer interest
and better premiums.
NONINTEREST EXPENSE
Noninterest expense for the fourth quarter increased $4.2 million or 33.5% to $16.6 million
compared to the same period in 2008. The increase is a result of higher salaries and employee
benefits of $2.3 million or 37.3% to $8.3 million as the Bank increased the number of employees as
a result of the expansion of the mortgage division and an increase in lenders in the SBA,
Commercial, Private Banking and Indirect Auto Lending divisions. Additionally, the increase was
due to higher other operating expense, which increased $827,000 or 33.8% to $3.3 million due
primarily to higher foreclosure expense. Noninterest expense for the year ended December 31, 2009,
increased $15.7 million or 32.2% to $64.6 million compared to 2008. The increase is a result of
higher salaries and employee benefits due to an increase in headcount which increased $7.4 million
or 28.8% to $33.3 million, and higher operating expenses, which
6
Fidelity Southern Corporation
Fourth Quarter Earnings Release
January 21, 2010
Fourth Quarter Earnings Release
January 21, 2010
increased $4.1 million or 52.9% to $11.9 million due primarily to higher ORE related expenses and
foreclosure expenses. FDIC insurance premiums increased $2.6 million or 257.7% compared to 2008 as
a result of the FDIC special assessment and deposit growth. Also, during 2008 the Company reversed
a Visa litigation accrual of $415,000 which did not reoccur in 2009.
Fidelity Southern Corporation, through its operating subsidiaries Fidelity Bank and LionMark
Insurance Company, provides banking services and credit related insurance products through 23
branches in Atlanta, Georgia, a branch in Jacksonville, Florida, and an insurance office in
Atlanta, Georgia. SBA and mortgage loans are provided through employees located throughout the
Southeast. For additional information about Fidelity’s products and services, please visit the
website at www.FidelitySouthern.com.
This news release contains forward-looking statements, as defined by Federal Securities Laws,
including statements about financial outlook and business environment. These statements are
provided to assist in the understanding of future financial performance and such performance
involves risks and uncertainties that may cause actual results to differ materially from those in
such statements. Any such statements are based on current expectations and involve a number of
risks and uncertainties. For a discussion of some factors that may cause such forward-looking
statements to differ materially from actual results, please refer to the section entitled “Forward
Looking Statements” on page 3 of Fidelity Southern Corporation’s 2008 Annual Report filed on Form
10-K with the Securities and Exchange Commission.
-end-
7
FIDELITY SOUTHERN CORPORATION
CONSOLIDATED STATEMENTS OF OPERATIONS
(UNAUDITED)
CONSOLIDATED STATEMENTS OF OPERATIONS
(UNAUDITED)
| QUARTER ENDED | YEAR ENDED | |||||||||||||||
| DECEMBER 31, | DECEMBER 31, | |||||||||||||||
| (DOLLARS IN THOUSANDS, EXCEPT PER SHARE DATA) | 2009 | 2008 | 2009 | 2008 | ||||||||||||
INTEREST INCOME |
||||||||||||||||
LOANS, INCLUDING FEES |
$ | 21,797 | $ | 22,468 | $ | 86,909 | $ | 96,398 | ||||||||
INVESTMENT SECURITIES |
2,615 | 1,835 | 10,511 | 7,441 | ||||||||||||
FEDERAL FUNDS SOLD AND BANK DEPOSITS |
57 | 26 | 163 | 215 | ||||||||||||
TOTAL INTEREST INCOME |
24,469 | 24,329 | 97,583 | 104,054 | ||||||||||||
INTEREST EXPENSE |
||||||||||||||||
DEPOSITS |
7,973 | 11,518 | 38,621 | 48,722 | ||||||||||||
SHORT-TERM BORROWINGS |
195 | 385 | 617 | 2,065 | ||||||||||||
SUBORDINATED DEBT |
1,123 | 1,307 | 4,650 | 5,284 | ||||||||||||
OTHER LONG-TERM DEBT |
449 | 419 | 2,121 | 1,565 | ||||||||||||
TOTAL INTEREST EXPENSE |
9,740 | 13,629 | 46,009 | 57,636 | ||||||||||||
NET INTEREST INCOME |
14,729 | 10,700 | 51,574 | 46,418 | ||||||||||||
PROVISION FOR LOAN LOSSES |
7,500 | 14,700 | 28,800 | 36,550 | ||||||||||||
NET INTEREST INCOME AFTER
PROVISION FOR LOAN LOSSES |
7,229 | (4,000 | ) | 22,774 | 9,868 | |||||||||||
NONINTEREST INCOME |
||||||||||||||||
SERVICE CHARGES ON DEPOSIT ACCOUNTS |
1,149 | 1,168 | 4,413 | 4,757 | ||||||||||||
OTHER FEES AND CHARGES |
519 | 470 | 2,005 | 1,944 | ||||||||||||
MORTGAGE BANKING ACTIVITIES |
3,623 | 95 | 14,961 | 340 | ||||||||||||
INDIRECT LENDING ACTIVITIES |
992 | 1,040 | 4,229 | 5,227 | ||||||||||||
SBA LENDING ACTIVITIES |
515 | 86 | 1,099 | 1,250 | ||||||||||||
SECURITIES GAINS |
4,789 | — | 5,308 | 1,306 | ||||||||||||
BANK OWNED LIFE INSURANCE |
332 | 374 | 1,280 | 1,278 | ||||||||||||
OTHER OPERATING INCOME |
271 | 510 | 683 | 1,534 | ||||||||||||
TOTAL NONINTEREST INCOME |
12,190 | 3,743 | 33,978 | 17,636 | ||||||||||||
NONINTEREST EXPENSE |
||||||||||||||||
SALARIES AND EMPLOYEE BENEFITS |
8,292 | 6,040 | 33,261 | 25,827 | ||||||||||||
FURNITURE AND EQUIPMENT |
666 | 672 | 2,721 | 2,949 | ||||||||||||
NET OCCUPANCY |
1,125 | 1,071 | 4,421 | 4,137 | ||||||||||||
COMMUNICATION EXPENSES |
422 | 401 | 1,617 | 1,654 | ||||||||||||
PROFESSIONAL AND OTHER SERVICES |
1,288 | 1,031 | 4,916 | 3,823 | ||||||||||||
ADVERTISING AND PROMOTION |
150 | 236 | 738 | 645 | ||||||||||||
STATIONERY, PRINTING AND SUPPLIES |
169 | 137 | 624 | 647 | ||||||||||||
INSURANCE EXPENSES |
276 | 79 | 688 | 344 | ||||||||||||
FDIC INSURANCE EXPENSE |
910 | 300 | 3,666 | 1,025 | ||||||||||||
OTHER OPERATING EXPENSES |
3,273 | 2,446 | 11,910 | 7,788 | ||||||||||||
TOTAL NONINTEREST EXPENSE |
16,571 | 12,413 | 64,562 | 48,839 | ||||||||||||
INCOME (LOSS) BEFORE INCOME TAX EXPENSE (BENEFIT) |
2,848 | (12,670 | ) | (7,810 | ) | (21,335 | ) | |||||||||
INCOME TAX EXPENSE (BENEFIT) |
920 | (5,101 | ) | (3,955 | ) | (9,099 | ) | |||||||||
NET INCOME (LOSS) |
1,928 | (7,569 | ) | (3,855 | ) | (12,236 | ) | |||||||||
PREFERRED STOCK DIVIDENDS |
(824 | ) | (106 | ) | (3,293 | ) | (106 | ) | ||||||||
NET INCOME (LOSS) AVAILABLE TO COMMON EQUITY |
$ | 1,104 | $ | (7,675 | ) | $ | (7,148 | ) | $ | (12,342 | ) | |||||
EARNINGS (LOSS) PER SHARE: |
||||||||||||||||
BASIC EARNINGS (LOSS) PER SHARE |
$ | 0.11 | $ | (0.78 | ) | $ | (0.71 | ) | $ | (1.27 | ) | |||||
DILUTED EARNINGS (LOSS) PER SHARE |
$ | 0.11 | $ | (0.78 | ) | $ | (0.71 | ) | $ | (1.27 | ) | |||||
WEIGHTED AVERAGE COMMON
SHARES OUTSTANDING-BASIC |
10,058,061 | 9,799,336 | 10,002,610 | 9,717,238 | ||||||||||||
WEIGHTED AVERAGE COMMON
SHARES OUTSTANDING-FULLY DILUTED |
10,212,455 | 9,799,336 | 10,002,610 | 9,717,238 | ||||||||||||
FIDELITY SOUTHERN CORPORATION
CONSOLIDATED BALANCE SHEETS
(UNAUDITED)
CONSOLIDATED BALANCE SHEETS
(UNAUDITED)
| (DOLLARS IN THOUSANDS) | DECEMBER 31, | DECEMBER 31, | ||||||
| 2009 | 2008 | |||||||
ASSETS |
||||||||
CASH AND DUE FROM BANKS |
$ | 170,692 | $ | 68,841 | ||||
FEDERAL FUNDS SOLD |
428 | 23,184 | ||||||
CASH AND CASH EQUIVALENTS |
171,120 | 92,025 | ||||||
INVESTMENTS AVAILABLE-FOR-SALE |
136,917 | 128,749 | ||||||
INVESTMENTS HELD-TO-MATURITY |
19,326 | 24,793 | ||||||
INVESTMENT IN FHLB STOCK |
6,767 | 5,282 | ||||||
LOANS HELD-FOR-SALE |
131,231 | 55,840 | ||||||
LOANS |
1,289,859 | 1,388,022 | ||||||
ALLOWANCE FOR LOAN LOSSES |
(30,072 | ) | (33,691 | ) | ||||
LOANS, NET |
1,259,787 | 1,354,331 | ||||||
PREMISES AND EQUIPMENT, NET |
18,092 | 19,311 | ||||||
OTHER REAL ESTATE |
21,780 | 15,063 | ||||||
ACCRUED INTEREST RECEIVABLE |
7,832 | 8,092 | ||||||
BANK OWNED LIFE INSURANCE |
29,058 | 27,868 | ||||||
OTHER ASSETS |
49,610 | 31,759 | ||||||
TOTAL ASSETS |
$ | 1,851,520 | $ | 1,763,113 | ||||
LIABILITIES |
||||||||
DEPOSITS: |
||||||||
NONINTEREST-BEARING DEMAND |
$ | 157,511 | $ | 138,634 | ||||
INTEREST-BEARING DEMAND/
MONEY MARKET |
252,493 | 208,723 | ||||||
SAVINGS |
440,596 | 199,465 | ||||||
TIME DEPOSITS, $100,000 AND OVER |
257,450 | 317,540 | ||||||
OTHER TIME DEPOSITS |
442,675 | 579,320 | ||||||
TOTAL DEPOSIT LIABILITIES |
1,550,725 | 1,443,682 | ||||||
SHORT-TERM BORROWINGS |
41,870 | 55,017 | ||||||
SUBORDINATED DEBT |
67,527 | 67,527 | ||||||
OTHER LONG-TERM DEBT |
50,000 | 47,500 | ||||||
ACCRUED INTEREST PAYABLE |
4,504 | 7,038 | ||||||
OTHER LIABILITIES |
7,209 | 5,745 | ||||||
TOTAL LIABILITIES |
1,721,835 | 1,626,509 | ||||||
SHAREHOLDERS’ EQUITY |
||||||||
PREFERRED STOCK |
44,696 | 43,813 | ||||||
COMMON STOCK |
53,314 | 51,886 | ||||||
ACCUMULATED OTHER COMPREHENSIVE
(LOSS) INCOME |
(64 | ) | 1,333 | |||||
RETAINED EARNINGS |
31,739 | 39,572 | ||||||
TOTAL SHAREHOLDERS’ EQUITY |
129,685 | 136,604 | ||||||
TOTAL LIABILITIES AND SHARE-HOLDERS’ EQUITY |
$ | 1,851,520 | $ | 1,763,113 | ||||
BOOK VALUE PER SHARE |
$ | 8.44 | $ | 9.42 | ||||
SHARES OF COMMON STOCK OUTSTANDING |
10,064,502 | 9,854,572 | ||||||
FIDELITY SOUTHERN CORPORATION
LOANS, BY CATEGORY
(UNAUDITED)
LOANS, BY CATEGORY
(UNAUDITED)
| DECEMBER 31, | ||||||||||||
| (DOLLARS IN THOUSANDS) | 2009 | 2008 | PERCENT CHANGE | |||||||||
COMMERCIAL, FINANCIAL AND AGRICULTURAL |
$ | 113,604 | $ | 137,988 | (17.67 | )% | ||||||
TAX-EXEMPT COMMERCIAL |
5,350 | 7,508 | (28.74 | )% | ||||||||
REAL ESTATE MORTGAGE — COMMERCIAL |
287,354 | 202,516 | 41.89 | % | ||||||||
TOTAL COMMERCIAL |
406,308 | 348,012 | 16.75 | % | ||||||||
REAL ESTATE-CONSTRUCTION |
154,785 | 245,153 | (36.86 | )% | ||||||||
REAL ESTATE-MORTGAGE |
130,984 | 115,527 | 13.38 | % | ||||||||
CONSUMER INSTALLMENT |
597,782 | 679,330 | (12.00 | )% | ||||||||
LOANS |
1,289,859 | 1,388,022 | (7.07 | )% | ||||||||
LOANS HELD-FOR-SALE: |
||||||||||||
ORIGINATED RESIDENTIAL MORTGAGE LOANS |
80,869 | 967 | 8,262.87 | % | ||||||||
SBA LOANS |
20,362 | 39,873 | (48.93 | )% | ||||||||
INDIRECT AUTO LOANS |
30,000 | 15,000 | 100.00 | % | ||||||||
TOTAL LOANS HELD-FOR-SALE |
131,231 | 55,840 | 135.01 | % | ||||||||
TOTAL LOANS |
$ | 1,421,090 | $ | 1,443,862 | ||||||||
FIDELITY SOUTHERN CORPORATION
ANALYSIS OF THE ALLOWANCE FOR LOAN LOSSES
(UNAUDITED)
ANALYSIS OF THE ALLOWANCE FOR LOAN LOSSES
(UNAUDITED)
| YEAR ENDED | ||||||||
| DECEMBER 31, | ||||||||
| (DOLLARS IN THOUSANDS) | 2009 | 2008 | ||||||
BALANCE AT BEGINNING OF PERIOD |
$ | 33,691 | $ | 16,557 | ||||
CHARGE-OFFS: |
||||||||
COMMERCIAL, FINANCIAL AND AGRICULTURAL |
315 | 99 | ||||||
SBA |
730 | 220 | ||||||
REAL ESTATE-CONSTRUCTION |
20,217 | 9,083 | ||||||
REAL ESTATE-MORTGAGE |
416 | 332 | ||||||
CONSUMER INSTALLMENT |
11,622 | 10,841 | ||||||
TOTAL CHARGE-OFFS |
33,300 | 20,575 | ||||||
RECOVERIES: |
||||||||
COMMERCIAL, FINANCIAL AND AGRICULTURAL |
9 | 5 | ||||||
SBA |
31 | 215 | ||||||
REAL ESTATE-CONSTRUCTION |
76 | 43 | ||||||
REAL ESTATE-MORTGAGE |
20 | 14 | ||||||
CONSUMER INSTALLMENT |
745 | 882 | ||||||
TOTAL RECOVERIES |
881 | 1,159 | ||||||
NET CHARGE-OFFS |
32,419 | 19,416 | ||||||
PROVISION FOR LOAN LOSSES |
28,800 | 36,550 | ||||||
BALANCE AT END OF PERIOD |
$ | 30,072 | $ | 33,691 | ||||
RATIO OF NET CHARGE-OFFS DURING PERIOD TO AVERAGE
LOANS OUTSTANDING, NET |
2.44 | % | 1.36 | % | ||||
ALLOWANCE FOR LOAN LOSSES AS A PERCENTAGE OF LOANS |
2.33 | % | 2.43 | % | ||||
NONPERFORMING ASSETS
(UNAUDITED)
(UNAUDITED)
| DECEMBER 31, | SEPTEMBER 30, | |||||||||||
| (DOLLARS IN THOUSANDS) | 2009 | 2008 | 2009 | |||||||||
NONACCRUAL LOANS |
$ | 69,743 | $ | 98,151 | $ | 83,494 | ||||||
REPOSSESSIONS |
1,393 | 2,016 | 1,562 | |||||||||
OTHER REAL ESTATE |
21,780 | 15,063 | 21,239 | |||||||||
TOTAL NONPERFORMING ASSETS |
$ | 92,916 | $ | 115,230 | $ | 106,295 | ||||||
LOANS PAST DUE 90 DAYS OR MORE AND STILL ACCRUING |
$ | — | $ | — | $ | — | ||||||
RATIO OF LOANS PAST DUE 90 DAYS OR MORE AND
STILL ACCRUING TO TOTAL LOANS |
— | % | — | % | — | % | ||||||
RATIO OF NONPERFORMING ASSETS TO TOTAL LOANS,
OREO AND REPOSSESSIONS |
6.43 | % | 7.89 | % | 7.27 | % | ||||||
FIDELITY SOUTHERN CORPORATION
AVERAGE BALANCE, INTEREST AND YIELDS
(UNAUDITED)
AVERAGE BALANCE, INTEREST AND YIELDS
(UNAUDITED)
| YEAR ENDED | ||||||||||||||||||||||||
| December 31, 2009 | December 31, 2008 | |||||||||||||||||||||||
| Average | Income/ | Yield/ | Average | Income/ | Yield/ | |||||||||||||||||||
| (dollars in thousands) | Balance | Expense | Rate | Balance | Expense | Rate | ||||||||||||||||||
Assets |
||||||||||||||||||||||||
Interest-earning assets : |
||||||||||||||||||||||||
Loans, net of unearned income |
||||||||||||||||||||||||
Taxable |
$ | 1,444,423 | $ | 86,643 | 6.00 | % | $ | 1,472,573 | $ | 96,009 | 6.52 | % | ||||||||||||
Tax-exempt (1) |
6,817 | 395 | 5.93 | % | 8,493 | 581 | 6.97 | % | ||||||||||||||||
Total loans |
1,451,240 | 87,038 | 6.00 | % | 1,481,066 | 96,590 | 6.52 | % | ||||||||||||||||
Investment securities |
||||||||||||||||||||||||
Taxable |
227,731 | 9,901 | 4.35 | % | 139,391 | 6,867 | 4.93 | % | ||||||||||||||||
Tax-exempt (2) |
14,760 | 898 | 6.09 | % | 13,975 | 833 | 5.96 | % | ||||||||||||||||
Total investment securities |
242,491 | 10,799 | 4.47 | % | 153,366 | 7,700 | 5.05 | % | ||||||||||||||||
Interest-bearing deposits |
55,149 | 139 | 0.25 | % | 2,630 | 36 | 1.38 | % | ||||||||||||||||
Federal funds sold |
11,013 | 24 | 0.22 | % | 11,960 | 179 | 1.49 | % | ||||||||||||||||
Total interest-earning assets |
1,759,893 | 98,000 | 5.57 | % | 1,649,022 | 104,505 | 6.34 | % | ||||||||||||||||
Cash and due from banks |
25,900 | 22,239 | ||||||||||||||||||||||
Allowance for loan losses |
(33,632 | ) | (22,610 | ) | ||||||||||||||||||||
Premises and equipment, net |
18,725 | 19,537 | ||||||||||||||||||||||
Other real estate |
21,527 | 12,624 | ||||||||||||||||||||||
Other assets |
66,461 | 57,682 | ||||||||||||||||||||||
Total assets |
$ | 1,858,874 | $ | 1,738,494 | ||||||||||||||||||||
Liabilities and shareholders’ equity |
||||||||||||||||||||||||
Interest-bearing liabilities : |
||||||||||||||||||||||||
Demand deposits |
$ | 236,819 | $ | 2,794 | 1.18 | % | $ | 271,429 | $ | 6,226 | 2.29 | % | ||||||||||||
Savings deposits |
333,865 | 6,963 | 2.09 | % | 209,301 | 6,043 | 2.89 | % | ||||||||||||||||
Time deposits |
829,229 | 28,864 | 3.48 | % | 836,049 | 36,453 | 4.36 | % | ||||||||||||||||
Total interest-bearing deposits |
1,399,913 | 38,621 | 2.76 | % | 1,316,779 | 48,722 | 3.70 | % | ||||||||||||||||
Federal funds purchased |
— | — | — | 9,001 | 265 | 2.94 | % | |||||||||||||||||
Securities sold under agreements to
repurchase |
29,237 | 390 | 1.33 | % | 34,924 | 921 | 2.64 | % | ||||||||||||||||
Other short-term borrowings |
6,407 | 227 | 3.54 | % | 25,393 | 879 | 3.46 | % | ||||||||||||||||
Subordinated debt |
67,527 | 4,650 | 6.89 | % | 67,527 | 5,284 | 7.83 | % | ||||||||||||||||
Long-term debt |
66,096 | 2,121 | 3.21 | % | 43,948 | 1,565 | 3.56 | % | ||||||||||||||||
Total interest-bearing liabilities |
1,569,180 | 46,009 | 2.93 | % | 1,497,572 | 57,636 | 3.85 | % | ||||||||||||||||
Noninterest-bearing : |
||||||||||||||||||||||||
Demand deposits |
142,656 | 128,706 | ||||||||||||||||||||||
Other liabilities |
14,425 | 13,755 | ||||||||||||||||||||||
Shareholders’ equity |
132,613 | 98,461 | ||||||||||||||||||||||
Total liabilities and
shareholders’ equity |
$ | 1,858,874 | $ | 1,738,494 | ||||||||||||||||||||
Net interest income / spread |
$ | 51,991 | 2.64 | % | $ | 46,869 | 2.49 | % | ||||||||||||||||
Net interest margin |
2.95 | % | 2.84 | % | ||||||||||||||||||||
| (1) | Interest income includes the effect of taxable-equivalent adjustment for 2009 and 2008 of $129,000 and $192,000 respectively. | |
| (2) | Interest income includes the effect of taxable-equivalent adjustment for 2009 and 2008 of $288,000 and $259,000, respectively. |
FIDELITY SOUTHERN CORPORATION
AVERAGE BALANCE, INTEREST AND YIELDS
(UNAUDITED)
AVERAGE BALANCE, INTEREST AND YIELDS
(UNAUDITED)
| QUARTER ENDED | ||||||||||||||||||||||||
| December 31, 2009 | December 31, 2008 | |||||||||||||||||||||||
| Average | Income/ | Yield/ | Average | Income/ | Yield/ | |||||||||||||||||||
| (dollars in thousands) | Balance | Expense | Rate | Balance | Expense | Rate | ||||||||||||||||||
Assets |
||||||||||||||||||||||||
Interest-earning assets : |
||||||||||||||||||||||||
Loans, net of unearned income |
||||||||||||||||||||||||
Taxable |
$ | 1,426,348 | $ | 21,736 | 6.05 | % | $ | 1,452,376 | $ | 22,383 | 6.13 | % | ||||||||||||
Tax-exempt (1) |
5,897 | 90 | 6.26 | % | 7,631 | 128 | 6.73 | % | ||||||||||||||||
Total loans |
1,432,245 | 21,826 | 6.05 | % | 1,460,007 | 22,511 | 6.13 | % | ||||||||||||||||
Investment securities |
||||||||||||||||||||||||
Taxable |
237,112 | 2,491 | 4.20 | % | 142,913 | 1,679 | 4.70 | % | ||||||||||||||||
Tax-exempt (2) |
11,941 | 185 | 6.18 | % | 15,209 | 227 | 5.97 | % | ||||||||||||||||
Total investment securities |
249,053 | 2,676 | 4.31 | % | 158,122 | 1,906 | 4.85 | % | ||||||||||||||||
Interest-bearing deposits |
89,777 | 54 | 0.24 | % | 5,003 | 5 | 0.41 | % | ||||||||||||||||
Federal funds sold |
5,863 | 3 | 0.22 | % | 16,955 | 21 | 0.49 | % | ||||||||||||||||
Total interest-earning assets |
1,776,938 | 24,559 | 5.48 | % | 1,640,087 | 24,443 | 5.93 | % | ||||||||||||||||
Cash and due from banks |
24,384 | 22,239 | ||||||||||||||||||||||
Allowance for loan losses |
(31,844 | ) | (27,105 | ) | ||||||||||||||||||||
Premises and equipment, net |
18,285 | 19,752 | ||||||||||||||||||||||
Other real estate |
21,245 | 16,933 | ||||||||||||||||||||||
Other assets |
68,162 | 57,971 | ||||||||||||||||||||||
Total assets |
$ | 1,877,170 | $ | 1,729,877 | ||||||||||||||||||||
Liabilities and shareholders’ equity |
||||||||||||||||||||||||
Interest-bearing liabilities : |
||||||||||||||||||||||||
Demand deposits |
$ | 252,732 | $ | 606 | 0.95 | % | $ | 219,288 | $ | 945 | 1.71 | % | ||||||||||||
Savings deposits |
426,124 | 1,783 | 1.66 | % | 199,964 | 1,338 | 2.66 | % | ||||||||||||||||
Time deposits |
733,904 | 5,584 | 3.02 | % | 905,505 | 9,235 | 4.06 | % | ||||||||||||||||
Total interest-bearing deposits |
1,412,760 | 7,973 | 2.24 | % | 1,324,757 | 11,518 | 3.46 | % | ||||||||||||||||
Federal funds purchased |
— | — | — | 250 | 1 | 2.16 | % | |||||||||||||||||
Securities sold under agreements to
repurchase |
15,188 | 18 | 0.46 | % | 43,716 | 296 | 2.69 | % | ||||||||||||||||
Other short-term borrowings |
17,989 | 177 | 3.91 | % | 10,098 | 88 | 3.46 | % | ||||||||||||||||
Subordinated debt |
67,527 | 1,123 | 6.60 | % | 67,527 | 1,307 | 7.70 | % | ||||||||||||||||
Long-term debt |
59,511 | 449 | 2.99 | % | 47,500 | 419 | 3.52 | % | ||||||||||||||||
Total interest-bearing liabilities |
1,572,975 | 9,740 | 2.46 | % | 1,493,848 | 13,629 | 3.63 | % | ||||||||||||||||
Noninterest-bearing : |
||||||||||||||||||||||||
Demand deposits |
158,581 | 127,220 | ||||||||||||||||||||||
Other liabilities |
14,032 | 10,452 | ||||||||||||||||||||||
Shareholders’ equity |
131,582 | 98,357 | ||||||||||||||||||||||
Total liabilities and
shareholders’ equity |
$ | 1,877,170 | $ | 1,729,877 | ||||||||||||||||||||
Net interest income / spread |
$ | 14,819 | 3.02 | % | $ | 10,814 | 2.30 | % | ||||||||||||||||
Net interest margin |
3.31 | % | 2.62 | % | ||||||||||||||||||||
| (1) | Interest income includes the effect of taxable-equivalent adjustment for 2009 and 2008 of $29,000 and $43,000 respectively. | |
| (2) | Interest income includes the effect of taxable-equivalent adjustment for 2009 and 2008 of $61,000 and $71,000. |