Attached files
Exhibit 99.2
 FINANCIAL SUPPLEMENT TO FOURTH QUARTER 2009 EARNINGS RELEASE
Summary
Quarterly loss of $0.51 per diluted share reflects operating environment and continued actions to further improve the risk profile of the balance sheet; Regions continues to make progress in improving the fundamentals of the organization
| • | Significant fourth quarter drivers include: $1,179 million loan loss provision ($487 million above net charge-offs); $96 million loss on sale of primarily non-agency securities; stable net interest margin stable of 2.72%; 3 percent increase in average low-cost deposits |
| • | Pre-tax Pre-provision net revenue continues to be impacted by higher credit-related expenses |
Focus on growing customer relationships through service excellence
| • | Exceeded goal of opening one million new retail and business deposit checking accounts in 2009, a 27% increase versus 2008, including 246,000 new accounts opened in the fourth quarter |
| • | Average customer deposits grew 2% linked quarter, up 10% year-over-year |
| • | Continued success in growing average non-interest bearing deposits, up 5% linked-quarter, the fifth consecutive quarterly increase |
| • | According to 2009 FDIC deposit data, gained market share in 15 of the 16 states the company operates, driving rankings higher in 6 of the states |
Higher low-cost deposits and improved funding mix benefit margin; hedge maturity partially offsets
| • | Net interest margin remained steady at 2.72%, as the ongoing positive shift in funding mix was largely offset by the impact of maturing interest rate swaps |
| • | Third quarter net interest income increased 1% to $850 million; earning assets increased 1% with securities purchases more than offsetting a decline in average loans |
| • | Actively making loans to both businesses and consumers. In 2009, businesses received $65 billion in new and renewed loans from Regions. However, loan growth continues to be constrained by lack of demand, including low line utilization. |
| • | Improved new loan spreads and deposit pricing continue to aid the net interest margin. Margin expected to gradually improve throughout 2010. |
Solid non-interest income; managing for higher performance and efficiency
| • | Non-interest revenues declined 7% versus prior quarter, impacted by a $96 million loss on sale of primarily non-agency investment securities, as well as a $71 million leveraged lease termination gain which was more than offset in taxes. Excluding these items non-interest income was 3% lower than the third quarter. |
| • | Service charges income remained relatively unchanged from third to fourth quarter. Service charge revenue will be negatively impacted in 2010 by NSF/OD policy changes enacted in late 2009. |
| • | Brokerage income increased $5 million or 2% to $257 million, driven by higher fees from investment banking |
| • | Morgan Keegan’s revenue increased $4 million to $337 million, driven by strong fixed income sales and trading revenue |
| • | Mortgage income declined $30 million. MSR hedge activity caused $23 million of the decline but was partially offset by a $20 million linked quarter hedge benefit recorded in net interest income. |
| • | Non-interest expense declined 2% linked quarter, however, excluding branch consolidation and valuation write-down charges, non-interest expense remained relatively unchanged linked quarter. |
| • | Salaries and benefits expense continued to reflect reduced headcount, declining $12 million linked quarter to $566 million |
| • | Elevated recession-related costs, including other real estate owned and certain legal and professionals fees continue to drive the increase in core non-interest expenses |
Provision for loan losses of $1,179 million was $487 million above net charge-offs; Allowance for credit losses increased 62 basis points to 3.52%; Rate of NPA inflows decelerating
| • | Net charge-offs stabilized at 2.99% of loans in the fourth quarter, slight rise driven by an increase in residential-related consumer losses |
| • | Non-performing assets, excluding loans held for sale, increased $376 million in the fourth quarter, the lowest quarterly increase in 2009; down 43% versus the prior linked-quarter increase of $662 million |
| • | Gross inflows of non-performing assets totaling $1.4 billion continue on downward trend |
| • | Allowance coverage ratio (ALL/NPL, excluding loans held for sale) at 0.89x as of 12/3109, as compared to 0.82x at 9/30/09 |
| • | Credit-related costs, while remaining elevated, should decline in 2010 given the company’s proactive stance toward credit loss recognition and reserve build in 2009 |
Capital position remains strong (1)
| • | Tier 1 common ratio of 7.2% |
| • | Tier 1 capital ratio of 11.6% |
(1) - Current quarter ratios are estimated
FINANCIAL SUPPLEMENT TO
FOURTH QUARTER 2009 EARNINGS RELEASE
PAGE 2
Regions Financial Corporation and Subsidiaries
Consolidated Balance Sheets
(Unaudited)
| ($ amounts in millions) |
||||||||||||||||||||
| 12/31/09 | 9/30/09 | 6/30/09 | 3/31/09 | 12/31/08 | ||||||||||||||||
| Assets: |
||||||||||||||||||||
| Cash and due from banks |
$ | 2,052 | $ | 2,101 | $ | 2,363 | $ | 2,429 | $ | 2,643 | ||||||||||
| Interest-bearing deposits in other banks |
5,580 | 5,902 | 2,846 | 2,288 | 7,540 | |||||||||||||||
| Federal funds sold and securities purchased under agreements to resell |
379 | 366 | 3,221 | 418 | 790 | |||||||||||||||
| Trading account assets |
3,039 | 1,388 | 1,109 | 1,348 | 1,050 | |||||||||||||||
| Securities available for sale |
24,069 | 21,030 | 19,681 | 20,970 | 18,850 | |||||||||||||||
| Securities held to maturity |
31 | 39 | 43 | 45 | 47 | |||||||||||||||
| Loans held for sale |
1,511 | 1,470 | 1,932 | 1,956 | 1,282 | |||||||||||||||
| Loans, net of unearned income |
90,674 | 92,754 | 96,149 | 95,686 | 97,419 | |||||||||||||||
| Allowance for loan losses |
(3,114 | ) | (2,627 | ) | (2,282 | ) | (1,861 | ) | (1,826 | ) | ||||||||||
| Net loans |
87,560 | 90,127 | 93,867 | 93,825 | 95,593 | |||||||||||||||
| Other interest-earning assets |
734 | 839 | 829 | 849 | 897 | |||||||||||||||
| Premises and equipment, net |
2,668 | 2,694 | 2,789 | 2,808 | 2,786 | |||||||||||||||
| Interest receivable |
468 | 499 | 501 | 426 | 458 | |||||||||||||||
| Goodwill |
5,557 | 5,557 | 5,556 | 5,551 | 5,548 | |||||||||||||||
| Mortgage servicing rights (MSRs) |
247 | 216 | 202 | 161 | 161 | |||||||||||||||
| Other identifiable intangible assets |
503 | 535 | 568 | 603 | 638 | |||||||||||||||
| Other assets |
7,920 | 7,223 | 7,304 | 8,303 | 7,965 | |||||||||||||||
| Total Assets |
$ | 142,318 | $ | 139,986 | $ | 142,811 | $ | 141,980 | $ | 146,248 | ||||||||||
| Liabilities and Stockholders’ Equity: |
||||||||||||||||||||
| Deposits: |
||||||||||||||||||||
| Non-interest-bearing |
$ | 23,204 | $ | 21,226 | $ | 20,995 | $ | 19,988 | $ | 18,457 | ||||||||||
| Interest-bearing |
75,476 | 73,654 | 73,731 | 73,548 | 72,447 | |||||||||||||||
| Total deposits |
98,680 | 94,880 | 94,726 | 93,536 | 90,904 | |||||||||||||||
| Borrowed funds: |
||||||||||||||||||||
| Short-term borrowings: |
||||||||||||||||||||
| Federal funds purchased and securities sold under agreements to repurchase |
1,893 | 2,633 | 2,265 | 2,828 | 3,143 | |||||||||||||||
| Other short-term borrowings |
1,775 | 2,653 | 4,927 | 6,525 | 12,679 | |||||||||||||||
| Total short-term borrowings |
3,668 | 5,286 | 7,192 | 9,353 | 15,822 | |||||||||||||||
| Long-term borrowings |
18,464 | 18,093 | 18,238 | 18,762 | 19,231 | |||||||||||||||
| Total borrowed funds |
22,132 | 23,379 | 25,430 | 28,115 | 35,053 | |||||||||||||||
| Other liabilities |
3,625 | 3,235 | 3,918 | 3,512 | 3,478 | |||||||||||||||
| Total Liabilities |
124,437 | 121,494 | 124,074 | 125,163 | 129,435 | |||||||||||||||
| Stockholders’ equity: |
||||||||||||||||||||
| Preferred stock, Series A |
3,343 | 3,334 | 3,325 | 3,316 | 3,307 | |||||||||||||||
| Preferred stock, Series B |
259 | 278 | 278 | — | — | |||||||||||||||
| Common stock |
12 | 12 | 12 | 7 | 7 | |||||||||||||||
| Additional paid-in capital |
18,781 | 18,754 | 18,740 | 16,828 | 16,815 | |||||||||||||||
| Retained earnings (deficit) |
(3,235 | ) | (2,618 | ) | (2,169 | ) | (1,913 | ) | (1,869 | ) | ||||||||||
| Treasury stock, at cost |
(1,409 | ) | (1,411 | ) | (1,413 | ) | (1,415 | ) | (1,425 | ) | ||||||||||
| Accumulated other comprehensive income (loss), net |
130 | 143 | (36 | ) | (6 | ) | (22 | ) | ||||||||||||
| Total Stockholders’ Equity |
17,881 | 18,492 | 18,737 | 16,817 | 16,813 | |||||||||||||||
| Total Liabilities and Stockholders’ Equity |
$ | 142,318 | $ | 139,986 | $ | 142,811 | $ | 141,980 | $ | 146,248 | ||||||||||
FINANCIAL SUPPLEMENT TO
FOURTH QUARTER 2009 EARNINGS RELEASE
PAGE 3
Regions Financial Corporation and Subsidiaries
Consolidated Statements of Operations (1)
(Unaudited)
| ($ amounts in millions, except per share data) |
Quarter Ended | ||||||||||||||||||
| 12/31/09 | 9/30/09 | 6/30/09 | 3/31/09 | 12/31/08 | |||||||||||||||
| Interest income on: |
|||||||||||||||||||
| Loans, including fees |
$ | 981 | $ | 1,047 | $ | 1,073 | $ | 1,098 | $ | 1,328 | |||||||||
| Securities: |
|||||||||||||||||||
| Taxable |
256 | 232 | 239 | 239 | 212 | ||||||||||||||
| Tax-exempt |
1 | 6 | 5 | 7 | 9 | ||||||||||||||
| Total securities |
257 | 238 | 244 | 246 | 221 | ||||||||||||||
| Loans held for sale |
12 | 12 | 15 | 16 | 8 | ||||||||||||||
| Federal funds sold and securities purchased under agreements to resell |
1 | — | 1 | 1 | 2 | ||||||||||||||
| Trading account assets |
30 | 10 | 10 | 12 | 11 | ||||||||||||||
| Other interest-earning assets |
7 | 7 | 8 | 6 | 11 | ||||||||||||||
| Total interest income |
1,288 | 1,314 | 1,351 | 1,379 | 1,581 | ||||||||||||||
| Interest expense on: |
|||||||||||||||||||
| Deposits |
280 | 301 | 330 | 366 | 408 | ||||||||||||||
| Short-term borrowings |
9 | 9 | 16 | 20 | 69 | ||||||||||||||
| Long-term borrowings |
149 | 159 | 174 | 184 | 180 | ||||||||||||||
| Total interest expense |
438 | 469 | 520 | 570 | 657 | ||||||||||||||
| Net interest income |
850 | 845 | 831 | 809 | 924 | ||||||||||||||
| Provision for loan losses |
1,179 | 1,025 | 912 | 425 | 1,150 | ||||||||||||||
| Net interest income (loss) after provision for loan losses |
(329 | ) | (180 | ) | (81 | ) | 384 | (226 | ) | ||||||||||
| Non-interest income: |
|||||||||||||||||||
| Service charges on deposit accounts |
299 | 300 | 288 | 269 | 288 | ||||||||||||||
| Brokerage, investment banking and capital markets |
257 | 252 | 263 | 217 | 241 | ||||||||||||||
| Mortgage income |
46 | 76 | 64 | 73 | 34 | ||||||||||||||
| Trust department income |
48 | 49 | 48 | 46 | 52 | ||||||||||||||
| Securities gains (losses), net |
(96 | ) | 4 | 108 | 53 | — | |||||||||||||
| Other |
164 | 91 | 428 | 408 | 87 | ||||||||||||||
| Total non-interest income |
718 | 772 | 1,199 | 1,066 | 702 | ||||||||||||||
| Non-interest expense: |
|||||||||||||||||||
| Salaries and employee benefits |
566 | 578 | 586 | 539 | 562 | ||||||||||||||
| Net occupancy expense |
114 | 121 | 112 | 107 | 114 | ||||||||||||||
| Furniture and equipment expense |
74 | 83 | 78 | 76 | 79 | ||||||||||||||
| Impairment of MSR’s |
— | — | — | — | 99 | ||||||||||||||
| Goodwill impairment |
— | — | — | — | 6,000 | ||||||||||||||
| Other-than-temporary impairments (2) |
— | 3 | 69 | 3 | 13 | ||||||||||||||
| Other |
465 | 458 | 386 | 333 | 406 | ||||||||||||||
| Total non-interest expense |
1,219 | 1,243 | 1,231 | 1,058 | 7,273 | ||||||||||||||
| Income (loss) before income taxes from continuing operations |
(830 | ) | (651 | ) | (113 | ) | 392 | (6,797 | ) | ||||||||||
| Income taxes |
(287 | ) | (274 | ) | 75 | 315 | (579 | ) | |||||||||||
| Net income (loss) |
$ | (543 | ) | $ | (377 | ) | $ | (188 | ) | $ | 77 | $ | (6,218 | ) | |||||
| Income (loss) from continuing operations available to common shareholders |
$ | (606 | ) | $ | (437 | ) | $ | (244 | ) | $ | 26 | $ | (6,244 | ) | |||||
| Net income (loss) available to common shareholders |
$ | (606 | ) | $ | (437 | ) | $ | (244 | ) | $ | 26 | $ | (6,244 | ) | |||||
| Weighted-average shares outstanding–during quarter: |
|||||||||||||||||||
| Basic |
1,191 | 1,189 | 876 | 693 | 693 | ||||||||||||||
| Diluted |
1,191 | 1,189 | 876 | 694 | 693 | ||||||||||||||
| Actual shares outstanding-end of quarter |
1,193 | 1,188 | 1,188 | 695 | 691 | ||||||||||||||
| Earnings (loss) per common share (3): |
|||||||||||||||||||
| Basic |
$ | (0.51 | ) | $ | (0.37 | ) | $ | (0.28 | ) | $ | 0.04 | $ | (9.01 | ) | |||||
| Diluted |
$ | (0.51 | ) | $ | (0.37 | ) | $ | (0.28 | ) | $ | 0.04 | $ | (9.01 | ) | |||||
| Cash dividends declared per common share |
$ | 0.01 | $ | 0.01 | $ | 0.01 | $ | 0.10 | $ | 0.10 | |||||||||
| Taxable-equivalent net interest income from continuing operations |
$ | 857 | $ | 853 | $ | 840 | $ | 817 | $ | 933 | |||||||||
| (1) | Certain amounts in the prior periods have been classified to reflect current period presentation. |
| (2) | Includes $3 million and $260 million of gross charges, net of $0 and $191 million noncredit related portion recognized in other comprehensive income, in 3Q09 and 2Q09, respectively. |
| (3) | Includes preferred stock dividends. |
FINANCIAL SUPPLEMENT TO
FOURTH QUARTER 2009 EARNINGS RELEASE
PAGE 4
Regions Financial Corporation and Subsidiaries
Consolidated Statements of Operations (1)
(Unaudited)
| ($ amounts in millions, except per share data) |
Twelve Months Ended December 31 |
|||||||
| 2009 | 2008 | |||||||
| Interest income on: |
||||||||
| Loans, including fees |
$ | 4,199 | $ | 5,550 | ||||
| Securities: |
||||||||
| Taxable |
966 | 828 | ||||||
| Tax-exempt |
19 | 40 | ||||||
| Total securities |
985 | 868 | ||||||
| Loans held for sale |
55 | 35 | ||||||
| Federal funds sold and securities purchased under agreements to resell |
3 | 18 | ||||||
| Trading account assets |
62 | 63 | ||||||
| Other interest-earning assets |
28 | 29 | ||||||
| Total interest income |
5,332 | 6,563 | ||||||
| Interest expense on: |
||||||||
| Deposits |
1,277 | 1,724 | ||||||
| Short-term borrowings |
54 | 369 | ||||||
| Long-term borrowings |
666 | 627 | ||||||
| Total interest expense |
1,997 | 2,720 | ||||||
| Net interest income |
3,335 | 3,843 | ||||||
| Provision for loan losses |
3,541 | 2,057 | ||||||
| Net interest income (loss) after provision for loan losses |
(206 | ) | 1,786 | |||||
| Non-interest income: |
||||||||
| Service charges on deposit accounts |
1,156 | 1,148 | ||||||
| Brokerage, investment banking and capital markets |
989 | 1,027 | ||||||
| Mortgage income |
259 | 138 | ||||||
| Trust department income |
191 | 234 | ||||||
| Securities gains, net |
69 | 92 | ||||||
| Other |
1,091 | 434 | ||||||
| Total non-interest income |
3,755 | 3,073 | ||||||
| Non-interest expense: |
||||||||
| Salaries and employee benefits |
2,269 | 2,356 | ||||||
| Net occupancy expense |
454 | 442 | ||||||
| Furniture and equipment expense |
311 | 335 | ||||||
| Impairment of MSR’s |
— | 85 | ||||||
| Other-than-temporary impairments (2) |
75 | 23 | ||||||
| Goodwill impairment |
— | 6,000 | ||||||
| Other |
1,642 | 1,551 | ||||||
| Total non-interest expense (3) |
4,751 | 10,792 | ||||||
| Income (loss) before income taxes from continuing operations |
(1,202 | ) | (5,933 | ) | ||||
| Income taxes |
(171 | ) | (348 | ) | ||||
| Income (loss) from continuing operations |
(1,031 | ) | (5,585 | ) | ||||
| Discontinued operations: |
||||||||
| Loss from discontinued operations before income taxes |
— | (18 | ) | |||||
| Income tax benefit |
— | (7 | ) | |||||
| Loss from discontinued operations, net of tax |
— | (11 | ) | |||||
| Net income (loss) |
($1,031 | ) | ($5,596 | ) | ||||
| Income (loss) from continuing operations available to common shareholders |
($1,261 | ) | ($5,611 | ) | ||||
| Net income (loss) available to common shareholders |
($1,261 | ) | ($5,622 | ) | ||||
| Weighted-average shares outstanding–year-to-date: |
||||||||
| Basic |
989 | 695 | ||||||
| Diluted |
989 | 695 | ||||||
| Actual shares outstanding–end of period |
1,193 | 691 | ||||||
| Earnings (loss) per common share (4): |
||||||||
| Basic |
$ | (1.27 | ) | $ | (8.09 | ) | ||
| Diluted |
$ | (1.27 | ) | $ | (8.09 | ) | ||
| Cash dividends declared per common share |
$ | 0.13 | $ | 0.96 | ||||
| Taxable equivalent net interest income from continuing operations |
$ | 3,367 | $ | 3,880 | ||||
| (1) | Certain amounts in the prior periods have been classified to reflect current period presentation. |
| (2) | Includes $266 million of gross charges, net of $191 million noncredit related portion recognized in other comprehensive income, in 2009. |
| (3) | The securities for which noncredit other-than-temporary impairments were taken in 2Q09 and 3Q09 were sold in 4Q09. Realized losses on the sales are reported with securities gains (losses), net. |
| (4) | Merger-related charges totaled $201 million for the twelve months ended December 31, 2008. |
FINANCIAL SUPPLEMENT TO
FOURTH QUARTER 2009 EARNINGS RELEASE
PAGE 5
Regions Financial Corporation and Subsidiaries
Consolidated Average Daily Balances and Yield/Rate Analysis (1)
| ($ amounts in millions; yields on taxable-equivalent basis) |
||||||||||||||||||||||||||||||||||||||||||||||||||
| Quarter Ended | ||||||||||||||||||||||||||||||||||||||||||||||||||
| 12/31/09 | 9/30/09 | 6/30/09 | 3/31/09 | 12/31/08 | ||||||||||||||||||||||||||||||||||||||||||||||
| Average Balance |
Income/ Expense |
Yield/ Rate |
Average Balance |
Income/ Expense |
Yield/ Rate |
Average Balance |
Income/ Expense |
Yield/ Rate |
Average Balance |
Income/ Expense |
Yield/ Rate |
Average Balance |
Income/ Expense |
Yield/ Rate |
||||||||||||||||||||||||||||||||||||
| Assets |
||||||||||||||||||||||||||||||||||||||||||||||||||
| Interest-earning assets: |
||||||||||||||||||||||||||||||||||||||||||||||||||
| Federal funds sold and securities purchased under agreements to resell |
$ | 364 | $ | 1 | 0.35 | % | $ | 597 | $ | — | 0.42 | % | $ | 508 | $ | 1 | 0.49 | % | $ | 545 | $ | 1 | 0.80 | % | $ | 608 | $ | 2 | 1.37 | % | ||||||||||||||||||||
| Trading account assets |
2,827 | 31 | 4.33 | % | 1,101 | 10 | 3.59 | % | 1,221 | 11 | 3.58 | % | 1,234 | 13 | 4.21 | % | 1,334 | 12 | 3.50 | % | ||||||||||||||||||||||||||||||
| Securities: |
||||||||||||||||||||||||||||||||||||||||||||||||||
| Taxable |
23,061 | 256 | 4.41 | % | 19,177 | 232 | 4.79 | % | 19,453 | 239 | 4.92 | % | 19,160 | 239 | 5.06 | % | 17,081 | 212 | 4.92 | % | ||||||||||||||||||||||||||||||
| Tax-exempt |
135 | 2 | 7.42 | % | 463 | 8 | 6.52 | % | 562 | 8 | 6.30 | % | 687 | 11 | 6.34 | % | 800 | 14 | 7.15 | % | ||||||||||||||||||||||||||||||
| Loans held for sale |
1,494 | 12 | 2.99 | % | 1,522 | 12 | 3.25 | % | 1,790 | 16 | 3.41 | % | 1,819 | 15 | 3.45 | % | 823 | 8 | 4.17 | % | ||||||||||||||||||||||||||||||
| Loans, net of unearned income |
91,766 | 986 | 4.27 | % | 94,354 | 1,053 | 4.43 | % | 95,382 | 1,077 | 4.53 | % | 96,648 | 1,102 | 4.62 | % | 99,134 | 1,331 | 5.34 | % | ||||||||||||||||||||||||||||||
| Other interest-earning assets |
5,566 | 7 | 0.48 | % | 6,841 | 7 | 0.40 | % | 9,700 | 8 | 0.36 | % | 5,599 | 6 | 0.40 | % | 5,604 | 11 | 0.78 | % | ||||||||||||||||||||||||||||||
| Total interest-earning assets |
125,213 | $ | 1,295 | 4.10 | % | 124,055 | $ | 1,322 | 4.23 | % | 128,616 | $ | 1,360 | 4.24 | % | 125,692 | $ | 1,387 | 4.47 | % | 125,384 | $ | 1,590 | 5.05 | % | |||||||||||||||||||||||||
| Allowance for loan losses |
(2,772 | ) | (2,393 | ) | (1,917 | ) | (1,868 | ) | (1,456 | ) | ||||||||||||||||||||||||||||||||||||||||
| Cash and due from banks |
2,206 | 2,113 | 2,269 | 2,396 | 2,499 | |||||||||||||||||||||||||||||||||||||||||||||
| Other non-earning assets |
16,486 | 16,530 | 17,119 | 17,343 | 21,647 | |||||||||||||||||||||||||||||||||||||||||||||
| $ | 141,133 | $ | 140,305 | $ | 146,087 | $ | 143,563 | $ | 148,074 | |||||||||||||||||||||||||||||||||||||||||
| Liabilities and Stockholders’ Equity |
||||||||||||||||||||||||||||||||||||||||||||||||||
| Interest-bearing liabilities: |
||||||||||||||||||||||||||||||||||||||||||||||||||
| Savings accounts |
$ | 4,064 | $ | 1 | 0.14 | % | $ | 4,038 | $ | 1 | 0.13 | % | $ | 4,029 | $ | 1 | 0.11 | % | $ | 3,804 | $ | 1 | 0.12 | % | $ | 3,691 | $ | 1 | 0.12 | % | ||||||||||||||||||||
| Interest-bearing transaction accounts |
14,279 | 11 | 0.29 | % | 13,934 | 10 | 0.27 | % | 14,277 | 11 | 0.30 | % | 14,909 | 10 | 0.27 | % | 14,393 | 20 | 0.55 | % | ||||||||||||||||||||||||||||||
| Money market accounts |
23,808 | 38 | 0.63 | % | 23,107 | 35 | 0.61 | % | 22,138 | 43 | 0.78 | % | 21,204 | 67 | 1.28 | % | 20,565 | 93 | 1.79 | % | ||||||||||||||||||||||||||||||
| Time deposits |
32,046 | 230 | 2.84 | % | 32,584 | 255 | 3.10 | % | 33,442 | 275 | 3.30 | % | 32,894 | 288 | 3.55 | % | 31,849 | 293 | 3.65 | % | ||||||||||||||||||||||||||||||
| Other |
— | — | — | — | — | — | 728 | — | 0.14 | % | 530 | — | 0.07 | % | 1,262 | 1 | 0.42 | % | ||||||||||||||||||||||||||||||||
| Total interest-bearing deposits |
74,197 | 280 | 1.49 | % | 73,663 | 301 | 1.62 | % | 74,614 | 330 | 1.78 | % | 73,341 | 366 | 2.02 | % | 71,760 | 408 | 2.26 | % | ||||||||||||||||||||||||||||||
| Federal funds purchased and securities sold under agreements to repurchase |
3,089 | 5 | 0.60 | % | 2,649 | 1 | 0.11 | % | 3,734 | 3 | 0.33 | % | 3,199 | 3 | 0.41 | % | 4,458 | 12 | 1.08 | % | ||||||||||||||||||||||||||||||
| Other short-term borrowings |
1,849 | 4 | 0.91 | % | 2,721 | 8 | 1.26 | % | 7,427 | 13 | 0.71 | % | 9,023 | 17 | 0.73 | % | 14,260 | 57 | 1.59 | % | ||||||||||||||||||||||||||||||
| Long-term borrowings |
18,326 | 149 | 3.24 | % | 18,250 | 159 | 3.45 | % | 18,829 | 174 | 3.70 | % | 18,958 | 184 | 3.95 | % | 16,069 | 180 | 4.47 | % | ||||||||||||||||||||||||||||||
| Total interest-bearing liabilities |
97,461 | $ | 438 | 1.78 | % | 97,283 | $ | 469 | 1.91 | % | 104,604 | $ | 520 | 2.00 | % | 104,521 | $ | 570 | 2.21 | % | 106,547 | $ | 657 | 2.45 | % | |||||||||||||||||||||||||
| Net interest spread |
2.32 | % | 2.32 | % | 2.24 | % | 2.26 | % | 2.60 | % | ||||||||||||||||||||||||||||||||||||||||
| Non-interest-bearing deposits |
22,149 | 21,122 | 20,421 | 18,896 | 17,773 | |||||||||||||||||||||||||||||||||||||||||||||
| Other liabilities |
3,275 | 3,288 | 3,567 | 3,436 | 3,344 | |||||||||||||||||||||||||||||||||||||||||||||
| Stockholders’ equity |
18,248 | 18,612 | 17,495 | 16,710 | 20,410 | |||||||||||||||||||||||||||||||||||||||||||||
| $ | 141,133 | $ | 140,305 | $ | 146,087 | $ | 143,563 | $ | 148,074 | |||||||||||||||||||||||||||||||||||||||||
| Net interest income/margin FTE basis |
$ | 857 | 2.72 | % | $ | 853 | 2.73 | % | $ | 840 | 2.62 | % | $ | 817 | 2.64 | % | $ | 933 | 2.96 | % | ||||||||||||||||||||||||||||||
| (1) | Certain amounts in prior periods have been reclassified to reflect current period presentation. |
FINANCIAL SUPPLEMENT TO
FOURTH QUARTER 2009 EARNINGS RELEASE
PAGE 6
Regions Financial Corporation and Subsidiaries
Consolidated Average Daily Balances and Yield/Rate Analysis (1)
| ($ amounts in millions; yields on taxable equivalent basis) |
||||||||||||||||||||
| Twelve Months Ended December 31 | ||||||||||||||||||||
| 2009 | 2008 | |||||||||||||||||||
| Average Balance |
Revenue/ Expense |
Yield/ Rate |
Average Balance |
Revenue/ Expense |
Yield/ Rate |
|||||||||||||||
| Assets |
||||||||||||||||||||
| Interest-earning assets: |
||||||||||||||||||||
| Federal funds sold and securities purchased under agreements to resell |
$ | 503 | $ | 3 | 0.53 | % | $ | 868 | $ | 18 | 2.15 | % | ||||||||
| Trading account assets |
1,599 | 65 | 4.04 | % | 1,473 | 66 | 4.47 | % | ||||||||||||
| Securities: |
||||||||||||||||||||
| Taxable securities |
20,221 | 966 | 4.78 | % | 16,897 | 828 | 4.90 | % | ||||||||||||
| Tax-exempt |
460 | 29 | 6.45 | % | 754 | 61 | 8.10 | % | ||||||||||||
| Loans held for sale |
1,655 | 55 | 3.29 | % | 664 | 36 | 5.38 | % | ||||||||||||
| Loans, net of unearned income |
94,523 | 4,218 | 4.46 | % | 97,601 | 5,562 | 5.70 | % | ||||||||||||
| Other earning assets |
6,927 | 28 | 0.40 | % | 1,873 | 29 | 1.55 | % | ||||||||||||
| Total interest-earning assets |
125,888 | 5,364 | 4.26 | % | 120,130 | 6,600 | 5.49 | % | ||||||||||||
| Allowance for loan losses |
(2,240 | ) | (1,413 | ) | ||||||||||||||||
| Cash and due from banks |
2,245 | 2,522 | ||||||||||||||||||
| Other non-earning assets |
16,866 | 22,708 | ||||||||||||||||||
| $ | 142,759 | $ | 143,947 | |||||||||||||||||
| Liabilities and Stockholders’ Equity |
||||||||||||||||||||
| Interest-bearing liabilities: |
||||||||||||||||||||
| Savings accounts |
$ | 3,984 | $ | 5 | 0.12 | % | $ | 3,744 | $ | 4 | 0.12 | % | ||||||||
| Interest-bearing transaction accounts |
14,347 | 40 | 0.28 | % | 15,058 | 127 | 0.84 | % | ||||||||||||
| Money market accounts |
22,573 | 184 | 0.81 | % | 21,097 | 373 | 1.76 | % | ||||||||||||
| Time deposits |
32,739 | 1,047 | 3.20 | % | 30,384 | 1,174 | 3.86 | % | ||||||||||||
| Other |
312 | 1 | 0.11 | % | 2,074 | 46 | 2.23 | % | ||||||||||||
| Total interest-bearing deposits |
73,955 | 1,277 | 1.73 | % | 72,357 | 1,724 | 2.38 | % | ||||||||||||
| Federal funds purchased and securities sold under agreements to repurchase |
3,166 | 12 | 0.37 | % | 7,697 | 171 | 2.22 | % | ||||||||||||
| Other short-term borrowings |
5,229 | 42 | 0.81 | % | 8,704 | 198 | 2.28 | % | ||||||||||||
| Long-term borrowings |
18,588 | 666 | 3.59 | % | 13,510 | 627 | 4.64 | % | ||||||||||||
| Total interest-bearing liabilities |
100,938 | 1,997 | 1.98 | % | 102,268 | 2,720 | 2.66 | % | ||||||||||||
| Net interest spread |
2.28 | % | 2.83 | % | ||||||||||||||||
| Non-interest bearing deposits |
20,657 | 17,720 | ||||||||||||||||||
| Other liabilities |
3,391 | 4,020 | ||||||||||||||||||
| Stockholders’ equity |
17,773 | 19,939 | ||||||||||||||||||
| $ | 142,759 | $ | 143,947 | |||||||||||||||||
| Net interest income/margin FTE basis |
$ | 3,367 | 2.67 | % | $ | 3,880 | 3.23 | % | ||||||||||||
| (1) | Certain amounts in prior periods have been reclassified to reflect current period presentation. |
FINANCIAL SUPPLEMENT TO
FOURTH QUARTER 2009 EARNINGS RELEASE
PAGE 7
Regions Financial Corporation and Subsidiaries
Selected Ratios
| As of and for Quarter Ended | ||||||||||||||||||||
| 12/31/09 | 9/30/09 | 6/30/09 | 3/31/09 | 12/31/08 | ||||||||||||||||
| Return on average assets* |
(1.70 | %) | (1.24 | %) | (0.67 | %) | 0.07 | % | NM | |||||||||||
| Return on average common equity* |
(16.40 | %) | (11.55 | %) | (6.96 | %) | 0.77 | % | NM | |||||||||||
| Return on average tangible common equity* (non-GAAP) |
(28.03 | %) | (19.48 | %) | (12.34 | %) | 1.43 | % | NM | |||||||||||
| Common equity per share |
$ | 11.97 | $ | 12.53 | $ | 12.74 | $ | 19.43 | $ | 19.53 | ||||||||||
| Tangible common book value per share (non-GAAP) |
$ | 6.89 | $ | 7.40 | $ | 7.58 | $ | 10.57 | $ | 10.59 | ||||||||||
| Stockholders’ equity to total assets |
12.56 | % | 13.21 | % | 13.12 | % | 11.84 | % | 11.50 | % | ||||||||||
| Tangible common stockholders’ equity to tangible assets (non-GAAP) |
6.03 | % | 6.56 | % | 6.59 | % | 5.41 | % | 5.23 | % | ||||||||||
| Tier 1 Common risk-based ratio (non-GAAP) (1) |
7.2 | % | 7.9 | % | 8.1 | % | 6.5 | % | 6.6 | % | ||||||||||
| Tier 1 Capital (1) |
11.6 | % | 12.2 | % | 12.2 | % | 10.4 | % | 10.4 | % | ||||||||||
| Total Risk-Based Capital (1) |
15.8 | % | 16.3 | % | 16.2 | % | 14.6 | % | 14.6 | % | ||||||||||
| Allowance for credit losses as a percentage of loans, net of unearned income (2) |
3.52 | % | 2.90 | % | 2.43 | % | 2.02 | % | 1.95 | % | ||||||||||
| Allowance for loan losses as a percentage of loans, net of unearned income |
3.43 | % | 2.83 | % | 2.37 | % | 1.94 | % | 1.87 | % | ||||||||||
| Allowance for loan losses to non-performing loans |
0.89 | x | 0.82 | x | 0.87 | x | 1.13 | x | 1.74 | x | ||||||||||
| Net interest margin (FTE) |
2.72 | % | 2.73 | % | 2.62 | % | 2.64 | % | 2.96 | % | ||||||||||
| Loans, net of unearned income, to total deposits |
91.89 | % | 97.76 | % | 101.50 | % | 102.30 | % | 107.17 | % | ||||||||||
| Net charge-offs as a percentage of average loans* |
2.99 | % | 2.86 | % | 2.06 | % | 1.64 | % | 3.19 | % | ||||||||||
| Non-performing assets (excluding loans 90 days past due)as a percentage of loans and other real estate |
4.83 | % | 4.40 | % | 3.55 | % | 2.43 | % | 1.76 | % | ||||||||||
| Non-performing assets (excluding loans 90 days past due)as a percentage of loans and other real estate (3) |
4.49 | % | 3.99 | % | 3.17 | % | 2.02 | % | 1.33 | % | ||||||||||
| Non-performing assets (including loans 90 days past due)as a percentage of loans and other real estate |
5.59 | % | 5.08 | % | 4.18 | % | 3.24 | % | 2.33 | % | ||||||||||
| Non-performing assets (including loans 90 days past due)as a percentage of loans and other real estate (3) |
5.24 | % | 4.68 | % | 3.80 | % | 2.83 | % | 1.89 | % | ||||||||||
| * | Annualized |
| (1) | Current quarter Tier 1 Common, Tier 1 and Total Risk-based Capital ratios are estimated |
| (2) | The allowance for credit losses reflects the allowance related to both loans on the balance sheet and exposure related to unfunded commitments and standby letters of credit |
| (3) | Excludes loans held for sale |
FINANCIAL SUPPLEMENT TO
FOURTH QUARTER 2009 EARNINGS RELEASE
PAGE 8
Loans (1)
Loan Portfolio - Period End Data
| ($ amounts in millions) |
12/31/09 | 9/30/09 | 6/30/09 | 3/31/09 | 12/31/08 | 12/31/09 vs. 9/30/09 |
12/31/09 vs. 12/31/08 |
||||||||||||||||||||||
| Commercial and industrial |
$ | 21,547 | $ | 21,925 | $ | 23,619 | $ | 22,585 | $ | 23,596 | $ | (378 | ) | -1.7 | % | $ | (2,049 | ) | -8.7 | % | |||||||||
| Commercial real estate mortgage - owner-occupied |
12,054 | 12,103 | 12,282 | 11,926 | 11,722 | (49 | ) | -0.4 | % | 332 | 2.8 | % | |||||||||||||||||
| Commercial real estate construction - owner-occupied |
751 | 875 | 1,060 | 1,328 | 1,605 | (124 | ) | -14.2 | % | (854 | ) | -53.2 | % | ||||||||||||||||
| Total commercial |
34,352 | 34,903 | 36,961 | 35,839 | 36,923 | (551 | ) | -1.6 | % | (2,571 | ) | -7.0 | % | ||||||||||||||||
| Commercial investor real estate mortgage |
16,109 | 16,190 | 16,419 | 15,969 | 14,486 | (81 | ) | -0.5 | % | 1,623 | 11.2 | % | |||||||||||||||||
| Commercial investor real estate construction |
5,591 | 6,616 | 7,163 | 7,611 | 9,029 | (1,025 | ) | -15.5 | % | (3,438 | ) | -38.1 | % | ||||||||||||||||
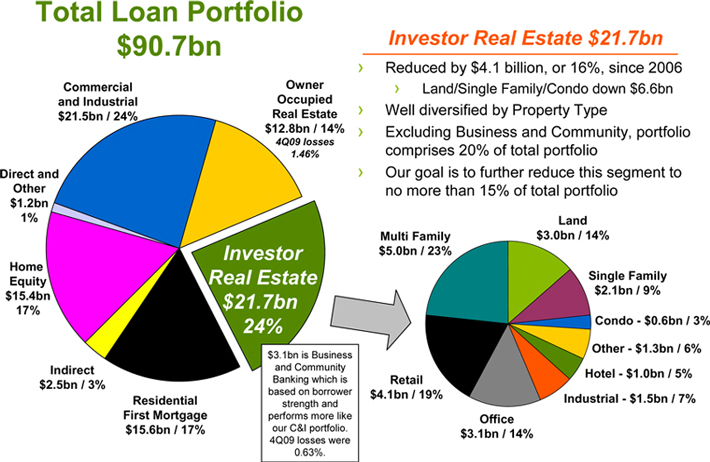
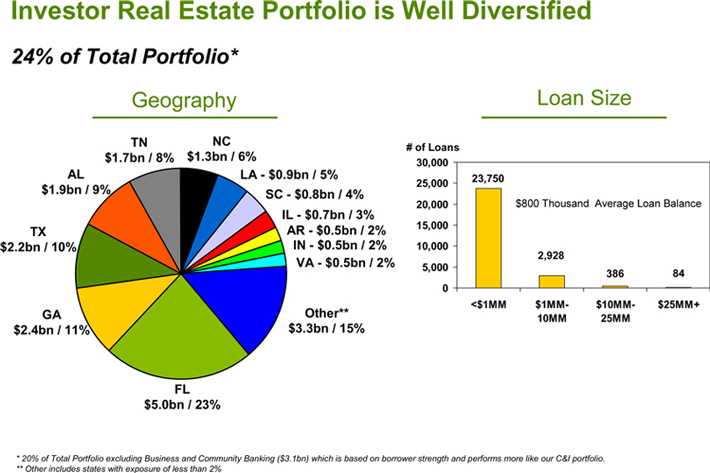
| Total investor real estate |
21,700 | 22,806 | 23,582 | 23,580 | 23,515 | (1,106 | ) | -4.8 | % | (1,815 | ) | -7.7 | % | ||||||||||||||||
| Residential first mortgage |
15,632 | 15,513 | 15,564 | 15,678 | 15,839 | 119 | 0.8 | % | (207 | ) | -1.3 | % | |||||||||||||||||
| Home equity |
15,381 | 15,630 | 15,796 | 16,023 | 16,130 | (249 | ) | -1.6 | % | (749 | ) | -4.6 | % | ||||||||||||||||
| Indirect |
2,452 | 2,755 | 3,099 | 3,464 | 3,854 | (303 | ) | -11.0 | % | (1,402 | ) | -36.4 | % | ||||||||||||||||
| Other consumer |
1,157 | 1,147 | 1,147 | 1,102 | 1,158 | 10 | 0.9 | % | (1 | ) | -0.1 | % | |||||||||||||||||
| $ | 90,674 | $ | 92,754 | $ | 96,149 | $ | 95,686 | $ | 97,419 | $ | (2,080 | ) | -2.2 | % | $ | (6,745 | ) | -6.9 | % | ||||||||||
Loan Portfolio - Average Balances
| ($ amounts in millions) |
4Q09 | 3Q09 | 2Q09 | 1Q09 | 4Q08 | 4Q09 vs. 3Q09 |
4Q09 vs. 4Q08 |
||||||||||||||||||||||
| Commercial and industrial |
$ | 21,570 | $ | 22,443 | $ | 22,707 | $ | 23,095 | $ | 24,122 | $ | (873 | ) | -3.9 | % | $ | (2,552 | ) | -10.6 | % | |||||||||
| Commercial real estate mortgage - owner-occupied |
12,127 | 12,188 | 11,983 | 11,773 | 11,574 | (61 | ) | -0.5 | % | 553 | 4.8 | % | |||||||||||||||||
| Commercial real estate construction - owner-occupied |
819 | 944 | 1,198 | 1,524 | 1,782 | (125 | ) | -13.2 | % | (963 | ) | -54.0 | % | ||||||||||||||||
| Total commercial |
34,516 | 35,575 | 35,888 | 36,392 | 37,478 | (1,059 | ) | -3.0 | % | (2,962 | ) | -7.9 | % | ||||||||||||||||
| Commercial investor real estate mortgage |
16,292 | 16,470 | 16,081 | 15,215 | 14,313 | (178 | ) | -1.1 | % | 1,979 | 13.8 | % | |||||||||||||||||
| Commercial investor real estate construction |
6,145 | 7,010 | 7,474 | 8,420 | 9,802 | (865 | ) | -12.3 | % | (3,657 | ) | -37.3 | % | ||||||||||||||||
| Total investor real estate |
22,437 | 23,480 | 23,555 | 23,635 | 24,115 | (1,043 | ) | -4.4 | % | (1,678 | ) | -7.0 | % | ||||||||||||||||
| Residential first mortgage |
15,521 | 15,508 | 15,593 | 15,708 | 16,005 | 13 | 0.1 | % | (484 | ) | -3.0 | % | |||||||||||||||||
| Home equity |
15,515 | 15,714 | 15,940 | 16,115 | 16,036 | (199 | ) | -1.3 | % | (521 | ) | -3.2 | % | ||||||||||||||||
| Indirect |
2,601 | 2,923 | 3,276 | 3,660 | 4,043 | (322 | ) | -11.0 | % | (1,442 | ) | -35.7 | % | ||||||||||||||||
| Other consumer |
1,176 | 1,154 | 1,130 | 1,138 | 1,457 | 22 | 1.9 | % | (281 | ) | -19.3 | % | |||||||||||||||||
| $ | 91,766 | $ | 94,354 | $ | 95,382 | $ | 96,648 | $ | 99,134 | $ | (2,588 | ) | -2.7 | % | $ | (7,368 | ) | -7.4 | % | ||||||||||
| (1) | Certain amounts in the prior periods have been reclassified to reflect current period presentation |
FINANCIAL SUPPLEMENT TO
FOURTH QUARTER 2009 EARNINGS RELEASE
PAGE 9
Deposits (1)
Deposit Portfolio - Period End Data
| ($ amounts in millions) |
12/31/09 | 9/30/09 | 6/30/09 | 3/31/09 | 12/31/08 | 12/31/09 vs. 9/30/09 |
12/31/09 vs. 12/31/08 |
||||||||||||||||||||||
| Customer Deposits |
|||||||||||||||||||||||||||||
| Interest-free deposits |
$ | 23,204 | $ | 21,226 | $ | 20,995 | $ | 19,988 | $ | 18,457 | $ | 1,978 | 9.3 | % | $ | 4,747 | 25.7 | % | |||||||||||
| Interest-bearing checking |
15,791 | 13,688 | 14,140 | 14,800 | 15,022 | 2,103 | 15.4 | % | 769 | 5.1 | % | ||||||||||||||||||
| Savings |
4,073 | 4,025 | 4,033 | 3,970 | 3,663 | 48 | 1.2 | % | 410 | 11.2 | % | ||||||||||||||||||
| Money market - domestic |
23,291 | 22,327 | 21,571 | 19,969 | 19,471 | 964 | 4.3 | % | 3,820 | 19.6 | % | ||||||||||||||||||
| Money market - foreign |
766 | 941 | 1,075 | 1,357 | 1,812 | (175 | ) | -18.6 | % | (1,046 | ) | -57.7 | % | ||||||||||||||||
| Low-cost deposits |
67,125 | 62,207 | 61,814 | 60,084 | 58,425 | 4,918 | 7.9 | % | 8,700 | 14.9 | % | ||||||||||||||||||
| Time deposits |
31,468 | 32,582 | 32,724 | 33,379 | 32,369 | (1,114 | ) | -3.4 | % | (901 | ) | -2.8 | % | ||||||||||||||||
| Total customer deposits |
98,593 | 94,789 | 94,538 | 93,463 | 90,794 | 3,804 | 4.0 | % | 7,799 | 8.6 | % | ||||||||||||||||||
| Corporate Treasury Deposits |
|||||||||||||||||||||||||||||
| Time deposits |
87 | 91 | 188 | 73 | 110 | (4 | ) | -4.4 | % | (23 | ) | -20.9 | % | ||||||||||||||||
| Total corporate treasury deposits |
87 | 91 | 188 | 73 | 110 | (4 | ) | -4.4 | % | (23 | ) | -20.9 | % | ||||||||||||||||
| Total Deposits |
$ | 98,680 | $ | 94,880 | $ | 94,726 | $ | 93,536 | $ | 90,904 | $ | 3,800 | 4.0 | % | $ | 7,776 | 8.6 | % | |||||||||||
| Deposit Portfolio - Average Balances | |||||||||||||||||||||||||||||
| ($ amounts in millions) |
|||||||||||||||||||||||||||||
| 4Q09 | 3Q09 | 2Q09 | 1Q09 | 4Q08 | 4Q09 vs. 3Q09 |
4Q09 vs. 4Q08 |
|||||||||||||||||||||||
| Customer Deposits |
|||||||||||||||||||||||||||||
| Interest-free deposits |
$ | 22,149 | $ | 21,122 | $ | 20,421 | $ | 18,896 | $ | 17,773 | $ | 1,027 | 4.9 | % | $ | 4,376 | 24.6 | % | |||||||||||
| Interest-bearing checking |
14,279 | 13,934 | 14,277 | 14,909 | 14,393 | 345 | 2.5 | % | (114 | ) | -0.8 | % | |||||||||||||||||
| Savings |
4,064 | 4,038 | 4,029 | 3,804 | 3,691 | 26 | 0.6 | % | 373 | 10.1 | % | ||||||||||||||||||
| Money market - domestic |
22,956 | 22,103 | 20,962 | 19,670 | 18,432 | 853 | 3.9 | % | 4,524 | 24.5 | % | ||||||||||||||||||
| Money market - foreign |
852 | 1,004 | 1,176 | 1,534 | 2,133 | (152 | ) | -15.1 | % | (1,281 | ) | -60.1 | % | ||||||||||||||||
| Low-cost deposits |
64,300 | 62,201 | 60,865 | 58,813 | 56,422 | 2,099 | 3.4 | % | 7,878 | 14.0 | % | ||||||||||||||||||
| Time deposits |
31,961 | 32,481 | 33,221 | 32,814 | 31,442 | (520 | ) | -1.6 | % | 519 | 1.7 | % | |||||||||||||||||
| Total customer deposits |
96,261 | 94,682 | 94,086 | 91,627 | 87,864 | 1,579 | 1.7 | % | 8,397 | 9.6 | % | ||||||||||||||||||
| Corporate Treasury Deposits |
|||||||||||||||||||||||||||||
| Time deposits |
85 | 103 | 221 | 80 | 407 | (18 | ) | -17.5 | % | (322 | ) | -79.1 | % | ||||||||||||||||
| Other |
— | — | 728 | 530 | 1,262 | — | NM | (1,262 | ) | -100.0 | % | ||||||||||||||||||
| Total corporate treasury deposits |
85 | 103 | 949 | 610 | 1,669 | (18 | ) | -17.5 | % | (1,584 | ) | -94.9 | % | ||||||||||||||||
| Total Deposits |
$ | 96,346 | $ | 94,785 | $ | 95,035 | $ | 92,237 | $ | 89,533 | $ | 1,561 | 1.6 | % | $ | 6,813 | 7.6 | % | |||||||||||
| (1) | Certain amounts in the prior periods have been reclassified to reflect current period presentation |
FINANCIAL SUPPLEMENT TO
FOURTH QUARTER 2009 EARNINGS RELEASE
PAGE 10
Pre-Tax Pre-Provision Net Revenue (“PPNR”) (1)
| ($ amounts in millions) |
4Q09 | 3Q09 | 2Q09 | 1Q09 | 4Q08 | 4Q09 vs. 3Q09 |
4Q09 vs. 4Q08 |
|||||||||||||||||||||||||||
| Net Interest Income |
$ | 850 | $ | 845 | $ | 831 | $ | 809 | $ | 924 | 5 | 0.6 | % | $ | (74 | ) | -8.0 | % | ||||||||||||||||
| Non-Interest Income |
718 | 772 | 1,199 | 1,066 | 702 | (54 | ) | -7.0 | % | 16 | 2.3 | % | ||||||||||||||||||||||
| Total Revenue |
1,568 | 1,617 | 2,030 | 1,875 | 1,626 | (49 | ) | -3.0 | % | (58 | ) | -3.6 | % | |||||||||||||||||||||
| Non-Interest Expense |
1,219 | 1,243 | 1,231 | 1,058 | 7,273 | (24 | ) | -1.9 | % | (6,054 | ) | -83.2 | % | |||||||||||||||||||||
| Pre-tax Pre-provision Net Revenue |
$ | 349 | $ | 374 | $ | 799 | $ | 817 | $ | (5,647 | ) | (25 | ) | -6.7 | % | 5,996 | -106.2 | % | ||||||||||||||||
| Adjustments: |
||||||||||||||||||||||||||||||||||
| Securities (gains) losses, net |
96 | (4 | ) | (108 | ) | (53 | ) | — | 100 | NM | 96 | NM | ||||||||||||||||||||||
| Gain on sale of Visa shares |
— | — | (80 | ) | — | — | — | NM | — | NM | ||||||||||||||||||||||||
| Leveraged lease termination gains |
(71 | ) | (4 | ) | (189 | ) | (323 | ) | — | (67 | ) | NM | (71 | ) | NM | |||||||||||||||||||
| Gain on extinguishment of debt |
— | — | (61 | ) | — | — | — | NM | — | NM | ||||||||||||||||||||||||
| Impairment of MSR’s |
— | — | — | — | 99 | — | NM | (99 | ) | NM | ||||||||||||||||||||||||
| FDIC special assessment |
— | — | 64 | — | — | — | NM | — | NM | |||||||||||||||||||||||||
| Securities impairment, net |
— | 3 | 69 | 3 | 13 | (3 | ) | NM | (13 | ) | NM | |||||||||||||||||||||||
| Branch consolidation costs (2) |
12 | 41 | — | — | — | (29 | ) | NM | 12 | NM | ||||||||||||||||||||||||
| Goodwill impairment |
— | — | — | — | 6,000 | — | NM | (6,000 | ) | NM | ||||||||||||||||||||||||
| Total adjustments |
37 | 36 | (305 | ) | (373 | ) | 6,112 | 1 | 2.8 | % | (6,075 | ) | NM | |||||||||||||||||||||
| Adjusted PPNR |
$ | 386 | $ | 410 | $ | 494 | $ | 444 | $ | 465 | $ | (24 | ) | -5.9 | % | $ | (79 | ) | -17.0 | % | ||||||||||||||
| (1) Certain amounts in the prior periods have been reclassified to reflect current period presentation. |
| |||||||||||||||||||||||||||||||||
| (2) Includes $3 million of net occupancy expense, $6 million of salary expense and $3 million in valuation charges in 4Q09; and $9 million of net occupancy expense, $7 million of furniture equipment expense and $25 million in valuation charges in 3Q09. |
| |||||||||||||||||||||||||||||||||
| Categorization of Income related to Mortgage Servicing Rights (MSRs) (3) |
| |||||||||||||||||||||||||||||||||
| ($ amounts in millions) |
4Q09 | 3Q09 | 2Q09 | 1Q09 | 4Q08 | 4Q09 vs. 3Q09 |
4Q09 vs. 4Q08 |
|||||||||||||||||||||||||||
| Net interest income (4) |
$ | 20 | $ | — | $ | — | $ | — | $ | — | 20 | NM | 20 | NM | ||||||||||||||||||||
| Brokerage, investment banking and capital markets (5) |
5 | — | — | — | — | 5 | NM | 5 | NM | |||||||||||||||||||||||||
| Mortgage income (6) |
(4 | ) | 19 | (2 | ) | (1 | ) | — | (23 | ) | -121.1 | % | (4 | ) | NM | |||||||||||||||||||
| $ | 21 | $ | 19 | $ | (2 | ) | $ | (1 | ) | $ | — | 2 | 10.5 | % | 21 | NM | ||||||||||||||||||
| (3) | This table details the impact of changes in valuation of mortgage servicing rights and related hedging instruments on various categories in the consolidated statements of operations. |
| (4) | Interest earned on trading securities used to hedge MSRs. |
| (5) | Mark-to-market impact of trading securities used to hedge MSRs. |
| (6) | Net effect of mark-to-market impact of MSRs and derivatives used to hedge MSRs. |
FINANCIAL SUPPLEMENT TO
FOURTH QUARTER 2009 EARNINGS RELEASE
PAGE 11
Non-Interest Income and Expense from Continuing Operations (1)
Non-Interest Income and Expense
Non-Interest Income
| ($ amounts in millions) |
4Q09 | 3Q09 | 2Q09 | 1Q09 | 4Q08 | 4Q09 vs. 3Q09 |
4Q09 vs. 4Q08 |
|||||||||||||||||||||||
| Service charges on deposit accounts |
$ | 299 | $ | 300 | $ | 288 | $ | 269 | $ | 288 | $ | (1 | ) | -0.3 | % | $ | 11 | 3.8 | % | |||||||||||
| Brokerage, investment banking and capital markets |
257 | 252 | 263 | 217 | 241 | 5 | 2.0 | % | 16 | 6.6 | % | |||||||||||||||||||
| Mortgage income |
46 | 76 | 64 | 73 | 34 | (30 | ) | -39.5 | % | 12 | 35.3 | % | ||||||||||||||||||
| Trust department income |
48 | 49 | 48 | 46 | 52 | (1 | ) | -2.0 | % | (4 | ) | -7.7 | % | |||||||||||||||||
| Securities gains (losses), net |
(96 | ) | 4 | 108 | 53 | — | (100 | ) | NM | (96 | ) | NM | ||||||||||||||||||
| Insurance income |
25 | 25 | 27 | 28 | 26 | — | 0.0 | % | (1 | ) | -3.8 | % | ||||||||||||||||||
| Leveraged lease termination gains |
71 | 4 | 189 | 323 | — | 67 | NM | 71 | NM | |||||||||||||||||||||
| Visa shares sale gain |
— | — | 80 | — | — | — | NM | — | NM | |||||||||||||||||||||
| Gain on early extinguishment of debt |
— | — | 61 | — | — | — | NM | — | NM | |||||||||||||||||||||
| Other |
68 | 62 | 71 | 57 | 61 | 6 | 9.7 | % | 7 | 11.5 | % | |||||||||||||||||||
| Total non-interest income |
$ | 718 | $ | 772 | $ | 1,199 | $ | 1,066 | $ | 702 | $ | (54 | ) | -7.0 | % | $ | 16 | 2.3 | % | |||||||||||
| Non-Interest Expense (2) | ||||||||||||||||||||||||||||||
| ($ amounts in millions) |
4Q09 | 3Q09 | 2Q09 | 1Q09 | 4Q08 | 4Q09 vs. 3Q09 |
4Q09 vs. 4Q08 |
|||||||||||||||||||||||
| Salaries and employee benefits |
$ | 566 | $ | 578 | $ | 586 | $ | 539 | $ | 562 | $ | (12 | ) | -2.1 | % | $ | 4 | 0.7 | % | |||||||||||
| Net occupancy expense |
114 | 121 | 112 | 107 | 114 | (7 | ) | -5.8 | % | — | 0.0 | % | ||||||||||||||||||
| Furniture and equipment expense |
74 | 83 | 78 | 76 | 79 | (9 | ) | -10.8 | % | (5 | ) | -6.3 | % | |||||||||||||||||
| Impairment (recapture) of MSR’s |
— | — | — | — | 99 | — | NM | (99 | ) | NM | ||||||||||||||||||||
| Professional and legal fees |
109 | 98 | 50 | 53 | 74 | 11 | 11.2 | % | 35 | 47.3 | % | |||||||||||||||||||
| Marketing expense |
18 | 20 | 20 | 17 | 21 | (2 | ) | -10.0 | % | (3 | ) | -14.3 | % | |||||||||||||||||
| Amortization of core deposit intangible |
29 | 30 | 30 | 31 | 32 | (1 | ) | -3.3 | % | (3 | ) | -9.4 | % | |||||||||||||||||
| Amortization of MSR’s |
— | — | — | — | 16 | — | NM | (16 | ) | NM | ||||||||||||||||||||
| Other real estate owned expense |
65 | 61 | 24 | 26 | 32 | 4 | 6.6 | % | 33 | 103.1 | % | |||||||||||||||||||
| Other-than-temporary impairments, net |
— | 3 | 69 | 3 | 13 | (3 | ) | -100.0 | % | (13 | ) | NM | ||||||||||||||||||
| FDIC premiums - special assessment |
— | — | 64 | — | — | — | NM | — | NM | |||||||||||||||||||||
| FDIC premiums |
54 | 56 | 43 | 10 | 6 | (2 | ) | -3.6 | % | 48 | NM | |||||||||||||||||||
| Valuation charges associated with branch consolidations |
2 | 25 | — | — | — | (23 | ) | NM | 2 | NM | ||||||||||||||||||||
| Other |
188 | 168 | 155 | 196 | 225 | 20 | 11.9 | % | (37 | ) | -16.4 | % | ||||||||||||||||||
| Total non-interest expense, excluding goodwill impairment charges |
1,219 | 1,243 | 1,231 | 1,058 | 1,273 | (24 | ) | -1.9 | % | (54 | ) | -4.2 | % | |||||||||||||||||
| Goodwill impairment charge |
— | — | — | — | 6,000 | — | NM | (6,000 | ) | NM | ||||||||||||||||||||
| Total non-interest expense |
$ | 1,219 | $ | 1,243 | $ | 1,231 | $ | 1,058 | $ | 7,273 | $ | (24 | ) | -1.9 | % | $ | (6,054 | ) | -83.2 | % | ||||||||||
| (1) | Certain amounts in prior periods have been reclassified to reflect current period presentation |
| (2) | Individual expense categories are presented excluding goodwill impairment, which is presented in a separate line item in the above table |
| • | 4Q09 non-interest income declined 7% linked quarter; however excluding gains (losses) on sale of securities and leveraged lease termination gains, non-interest income only declined 3% linked quarter |
| • | Service charges remained steady linked quarter; however, service charges revenue will be negatively impacted in 2010 by recent changes the company announced related to its NSF/OD policies |
| • | Brokerage, investment banking and capital markets income increased $5 million or 2% linked quarter, primarily driven by higher fees from investment banking and fixed income capital markets |
| • | Mortgage income declined $30 million linked quarter, however $23 million of the decline was partially offset by a $20 million linked quarter MSR hedge benefit recorded in net interest income |
| • | Securities losses in 4Q09 reflect the sale of approximately $1.3 billion of securities, including non-agency mortgage-backed securities and municipal bonds. The proceeds were reinvested in agency guaranteed mortgage-backed securities. As a result of these actions, the investment portfolio now has very minimal risk to commercial mortgage-backed securities, non-agency mortgage-backed securities or municipal bonds. |
| • | 2Q09 reflects both the sale of approximately $1.4 billion of agency debentures ($108 million gain) and the sale of Visa shares ($80 million gain). The proceeds from the sale of the agency debentures were reinvested in U.S. government agency mortgage-backed securities classified as available for sale, as part of Regions’ asset/liability management strategy. |
| • | 1Q09 securities gains reflect sale of approximately $656 million of U.S. Treasury securities with the proceeds reinvested in U.S. government agency mortgage-backed securities classified as available for sale, as part of Regions’ asset/liability management strategy |
| • | Leveraged lease termination gains reflect revenue recorded as a result of Regions unwinding certain leveraged lease transactions. These amounts totaled $71 million in 4Q09, $4 million in 3Q09, $189 million in 2Q09 and $323 million in 1Q09; however these amounts were offset by $74 million, $4 million, $196 million and $315 million in increased tax expense, respectively, resulting in a nominal impact to net income. |
| • | 4Q09 non-interest expense declined 2% linked quarter; however when excluding branch consolidation and valuation write-down charges ($41 million in 3Q09, $12 million in 4Q09), non-interest expense remained relatively unchanged linked quarter. |
| • | Salaries and employee benefits declined $12 million linked quarter, primarily due to continued headcount reduction (declined 2,275 since 12/31/08). |
| • | Professional and legal fees remained elevated, increasing $11 million linked quarter, reflecting higher legal costs. |
| • | Third quarter’s $41 million branch consolidation charge includes $9 million of net occupancy expense, $7 million of furniture and equipment expense and $25 million in valuation charges. |
| • | Fourth quarter’s $12 million branch consolidation charge includes $3 million of net occupancy expense, $6 million of salaries and benefits expense and $3 million in valuation charges. |
| • | 2Q09 non-interest expense was negatively impacted by higher FDIC insurance expenses, including a $64 million special assessment, and $69 million of securities impairment charges |
FINANCIAL SUPPLEMENT TO
FOURTH QUARTER 2009 EARNINGS RELEASE
PAGE 12
Morgan Keegan
Morgan Keegan
Summary Income Statement (1)
| ($ amounts in millions) |
4Q09 | 3Q09 | 2Q09 | 1Q09 | 4Q08 | 4Q09 vs. 3Q09 |
4Q09 vs. 4Q08 |
||||||||||||||||||||||
| Revenues: |
|||||||||||||||||||||||||||||
| Commissions |
$ | 52 | $ | 53 | $ | 48 | $ | 49 | $ | 56 | $ | (1 | ) | -1.9 | % | $ | (4 | ) | -7.1 | % | |||||||||
| Principal transactions |
100 | 116 | 122 | 94 | 99 | (16 | ) | -13.8 | % | 1 | 1.0 | % | |||||||||||||||||
| Investment banking |
67 | 50 | 56 | 33 | 43 | 17 | 34.0 | % | 24 | 55.8 | % | ||||||||||||||||||
| Interest |
17 | 17 | 19 | 22 | 28 | — | 0.0 | % | (11 | ) | -39.3 | % | |||||||||||||||||
| Trust fees and services |
45 | 47 | 44 | 41 | 48 | (2 | ) | -4.3 | % | (3 | ) | -6.3 | % | ||||||||||||||||
| Investment advisory |
38 | 44 | 32 | 29 | 50 | (6 | ) | -13.6 | % | (12 | ) | -24.0 | % | ||||||||||||||||
| Other |
18 | 6 | 16 | 7 | 10 | 12 | 200.0 | % | 8 | 80.0 | % | ||||||||||||||||||
| Total revenues |
337 | 333 | 337 | 275 | 334 | 4 | 1.2 | % | 3 | 0.9 | % | ||||||||||||||||||
| Expenses: |
|||||||||||||||||||||||||||||
| Interest expense |
3 | 3 | 5 | 6 | 14 | — | 0.0 | % | (11 | ) | -78.6 | % | |||||||||||||||||
| Non-interest expense |
305 | 284 | 285 | 248 | 277 | 21 | 7.4 | % | 28 | 10.1 | % | ||||||||||||||||||
| Total expenses |
308 | 287 | 290 | 254 | 291 | 21 | 7.3 | % | 17 | 5.8 | % | ||||||||||||||||||
| Income before income taxes |
29 | 46 | 47 | 21 | 43 | (17 | ) | -37.0 | % | (14 | ) | -32.6 | % | ||||||||||||||||
| Income taxes |
11 | 17 | 17 | 8 | 15 | (6 | ) | -35.3 | % | (4 | ) | -26.7 | % | ||||||||||||||||
| Net income |
$ | 18 | $ | 29 | $ | 30 | $ | 13 | $ | 28 | $ | (11 | ) | -37.9 | % | $ | (10 | ) | -35.7 | % | |||||||||
Breakout of Revenue by Division
| ($ amounts in millions) |
Private Client |
Fixed- Income Capital Markets |
Equity Capital Markets |
Regions MK Trust |
Asset Management |
Interest & Other |
||||||||||||||||||
| Three months ended December 31, 2009 |
||||||||||||||||||||||||
| $ amount of revenue |
$ | 82 | $ | 119 | $ | 25 | $ | 49 | $ | 31 | $ | 31 | ||||||||||||
| % of gross revenue |
24.3 | % | 35.3 | % | 7.4 | % | 14.5 | % | 9.2 | % | 9.3 | % | ||||||||||||
| Three months ended September 30, 2009 |
||||||||||||||||||||||||
| $ amount of revenue |
$ | 83 | $ | 108 | $ | 22 | $ | 51 | $ | 45 | $ | 24 | ||||||||||||
| % of gross revenue |
24.9 | % | 32.5 | % | 6.6 | % | 15.3 | % | 13.5 | % | 7.2 | % | ||||||||||||
| Year Ended December 31, 2009 |
||||||||||||||||||||||||
| $ amount of revenue |
$ | 317 | $ | 452 | $ | 85 | $ | 197 | $ | 150 | $ | 81 | ||||||||||||
| % of gross revenue |
24.7 | % | 35.3 | % | 6.6 | % | 15.4 | % | 11.7 | % | 6.3 | % | ||||||||||||
| Year Ended December 31, 2008 |
||||||||||||||||||||||||
| $ amount of revenue |
$ | 339 | $ | 370 | $ | 128 | $ | 231 | $ | 177 | $ | 95 | ||||||||||||
| % of gross revenue |
25.3 | % | 27.7 | % | 9.5 | % | 17.2 | % | 13.2 | % | 7.1 | % | ||||||||||||
| (1) | Certain amounts in the prior periods have been reclassified to reflect current period presentation |
| • | The increase in non-interest expense is primarily related to higher professional and legal fees. Other increases, primarily incentive based compensation from improved market operations, were offset by continued cost cutting efforts. |
| • | The strong trend for Fixed-Income Capital Markets revenue continued in 4Q09 due to high volume of sales and trading. Also, improvement in the markets aided Fixed Income Capital Markets municipal banking due to municipalities either financing or refinancing infrastructure projects. |
FINANCIAL SUPPLEMENT TO
FOURTH QUARTER 2009 EARNINGS RELEASE
PAGE 13
Credit Quality (1)
Credit Quality
| As of and for Quarter Ended | ||||||||||||||||||||
| ($ in millions) |
12/31/09 | 9/30/09 | 6/30/09 | 3/31/09 | 12/31/08 | |||||||||||||||
| Allowance for credit losses (ACL) |
$ | 3,188 | $ | 2,690 | $ | 2,335 | $ | 1,935 | $ | 1,900 | ||||||||||
| Provision for loan losses |
1,179 | 1,025 | 912 | 425 | 1,150 | |||||||||||||||
| Provision for unfunded credit losses |
10 | 10 | (21 | ) | — | (1 | ) | |||||||||||||
| Net loans charged-off:* |
||||||||||||||||||||
| Commercial and industrial |
76 | 137 | 84 | 58 | 73 | |||||||||||||||
| Commercial real estate mortgage - owner-occupied |
38 | 17 | 15 | 12 | 32 | |||||||||||||||
| Commercial real estate construction - owner-occupied |
9 | 2 | 3 | 4 | 4 | |||||||||||||||
| Total commercial |
123 | 156 | 102 | 74 | 109 | |||||||||||||||
| Commercial investor real estate mortgage |
210 | 196 | 90 | 87 | 245 | |||||||||||||||
| Commercial investor real estate construction |
159 | 148 | 111 | 66 | 301 | |||||||||||||||
| Total investor real estate |
369 | 344 | 201 | 153 | 546 | |||||||||||||||
| Residential first mortgage |
55 | 57 | 51 | 39 | 41 | |||||||||||||||
| Home equity |
113 | 94 | 113 | 95 | 69 | |||||||||||||||
| Indirect |
10 | 10 | 11 | 16 | 15 | |||||||||||||||
| Other consumer |
22 | 19 | 13 | 13 | 16 | |||||||||||||||
| Total |
$ | 692 | $ | 680 | $ | 491 | $ | 390 | $ | 796 | ||||||||||
| Net loan charge-offs as a % of average loans, annualized * |
||||||||||||||||||||
| Commercial and industrial |
1.39 | % | 2.43 | % | 1.49 | % | 1.02 | % | 1.20 | % | ||||||||||
| Commercial real estate mortgage - owner-occupied |
1.26 | % | 0.55 | % | 0.51 | % | 0.42 | % | 1.10 | % | ||||||||||
| Commercial real estate construction - owner-occupied |
4.45 | % | 0.88 | % | 1.00 | % | 1.06 | % | 0.89 | % | ||||||||||
| Total commercial |
1.41 | % | 1.73 | % | 1.15 | % | 0.83 | % | 1.16 | % | ||||||||||
| Commercial investor real estate mortgage |
5.11 | % | 4.74 | % | 2.23 | % | 2.30 | % | 6.80 | % | ||||||||||
| Commercial investor real estate construction |
10.26 | % | 8.40 | % | 5.94 | % | 3.18 | % | 12.20 | % | ||||||||||
| Total investor real estate |
6.52 | % | 5.83 | % | 3.40 | % | 2.62 | % | 9.01 | % | ||||||||||
| Residential first mortgage |
1.40 | % | 1.45 | % | 1.31 | % | 1.02 | % | 1.05 | % | ||||||||||
| Home equity |
2.89 | % | 2.37 | % | 2.85 | % | 2.38 | % | 1.72 | % | ||||||||||
| Indirect |
1.58 | % | 1.46 | % | 1.31 | % | 1.74 | % | 1.43 | % | ||||||||||
| Other consumer |
7.37 | % | 6.21 | % | 4.78 | % | 4.70 | % | 4.38 | % | ||||||||||
| Total |
2.99 | % | 2.86 | % | 2.06 | % | 1.64 | % | 3.19 | % | ||||||||||
| Non-accrual loans |
$ | 3,488 | $ | 3,216 | $ | 2,618 | $ | 1,641 | $ | 1,052 | ||||||||||
| Foreclosed properties |
607 | 503 | 439 | 294 | 243 | |||||||||||||||
| Non-performing assets, excluding loans held for sale |
$ | 4,095 | $ | 3,719 | $ | 3,057 | $ | 1,935 | $ | 1,295 | ||||||||||
| Non-performing loans held for sale |
317 | 380 | 371 | 393 | 423 | |||||||||||||||
| Non-performing assets (NPAs) |
$ | 4,412 | $ | 4,099 | $ | 3,428 | $ | 2,328 | $ | 1,718 | ||||||||||
| Loans past due > 90 days* |
$ | 688 | $ | 643 | $ | 613 | $ | 782 | $ | 554 | ||||||||||
| Commercial loans restructured not included in categories above |
$ | 25 | $ | 16 | $ | 11 | $ | 1 | $ | 1 | ||||||||||
| Consumer loans restructured not included in categories above** |
$ | 1,583 | $ | 1,400 | $ | 1,167 | $ | 736 | $ | 454 | ||||||||||
| Total restructured loans not included in categories above |
$ | 1,608 | $ | 1,416 | $ | 1,178 | $ | 737 | $ | 455 | ||||||||||
| Credit Ratios: |
||||||||||||||||||||
| ACL/Loans, net |
3.52 | % | 2.90 | % | 2.43 | % | 2.02 | % | 1.95 | % | ||||||||||
| ALL/Loans, net |
3.43 | % | 2.83 | % | 2.37 | % | 1.94 | % | 1.87 | % | ||||||||||
| NPAs (ex. 90+ past due)/Loans and foreclosed properties |
4.83 | % | 4.40 | % | 3.55 | % | 2.43 | % | 1.76 | % | ||||||||||
| NPAs (ex. 90+ past due)/Loans and foreclosed properties - excludes loans held for sale |
4.49 | % | 3.99 | % | 3.17 | % | 2.02 | % | 1.33 | % | ||||||||||
| NPAs (inc. 90+ past due)/Loans and foreclosed properties |
5.59 | % | 5.08 | % | 4.18 | % | 3.24 | % | 2.33 | % | ||||||||||
| NPAs (inc. 90+ past due)/Loans and foreclosed properties - excludes loans held for sale |
5.24 | % | 4.68 | % | 3.80 | % | 2.83 | % | 1.89 | % | ||||||||||
| * | See pages 14-17 for loan portfolio (risk view) breakout |
| ** | At 12/31/09, 82 percent of consumer loans restructured not included in categories above consist of residential first mortgages. |
Allowance for Credit Losses
| Year Ended December 31 |
||||||||
| ($ amounts in millions) |
2009 | 2008 | ||||||
| Balance at beginning of year |
$ | 1,900 | $ | 1,379 | ||||
| Net loans charged-off |
(2,253 | ) | (1,547 | ) | ||||
| Allowance allocated to sold loans |
— | (5 | ) | |||||
| Provision for loan losses |
3,541 | 2,057 | ||||||
| Provision for unfunded credit commitments |
— | 15 | ||||||
| Balance at end of period |
$ | 3,188 | $ | 1,900 | ||||
| Components: |
||||||||
| Allowance for loan losses |
$ | 3,114 | $ | 1,826 | ||||
| Reserve for unfunded credit commitments |
74 | 74 | ||||||
| Allowance for credit losses |
$ | 3,188 | $ | 1,900 | ||||
| (1) | Certain amounts in prior periods have been reclassified to reflect current period presentation |
FINANCIAL SUPPLEMENT TO
FOURTH QUARTER 2009 EARNINGS RELEASE
PAGE 14
| Total Loan Portfolio Risk View |
| ||||||||||||||||||||||||
| 4Q2009 | 3Q2009 | 2Q2009 | 1Q2009 | 4Q2008 | |||||||||||||||||||||
| ($ millions) |
$ | % Total | $ | % Total | $ | % Total | $ | % Total | $ | % Total | |||||||||||||||
| Commercial & Industrial |
18,150 | 20.0 | % | 18,442 | 19.9 | % | 20,003 | 20.8 | % | 18,853 | 19.7 | % | 19,581 | 20.1 | % | ||||||||||
| Business Banking C&I |
3,397 | 3.7 | % | 3,483 | 3.8 | % | 3,616 | 3.8 | % | 3,732 | 3.9 | % | 4,015 | 4.1 | % | ||||||||||
| Total Commercial and Industrial |
21,547 | 23.8 | % | 21,925 | 23.6 | % | 23,619 | 24.6 | % | 22,585 | 23.6 | % | 23,596 | 24.2 | % | ||||||||||
| Commercial RE Mortgage - OO |
5,399 | 6.0 | % | 5,461 | 5.9 | % | 5,573 | 5.8 | % | 5,147 | 5.4 | % | 4,780 | 4.9 | % | ||||||||||
| Business Banking CRE Mortgage - OO |
6,655 | 7.3 | % | 6,642 | 7.2 | % | 6,709 | 7.0 | % | 6,779 | 7.1 | % | 6,942 | 7.1 | % | ||||||||||
| Total Commercial Real Estate Mortgage - OO |
12,054 | 13.3 | % | 12,103 | 13.0 | % | 12,282 | 12.8 | % | 11,926 | 12.5 | % | 11,722 | 12.0 | % | ||||||||||
| Commercial RE Construction - OO |
527 | 0.6 | % | 649 | 0.7 | % | 807 | 0.8 | % | 1,023 | 1.1 | % | 1,235 | 1.3 | % | ||||||||||
| Business Banking CRE Construction - OO |
224 | 0.2 | % | 226 | 0.2 | % | 253 | 0.3 | % | 305 | 0.3 | % | 370 | 0.4 | % | ||||||||||
| Total Commercial Real Estate Construction - OO |
751 | 0.8 | % | 875 | 0.9 | % | 1,060 | 1.1 | % | 1,328 | 1.4 | % | 1,605 | 1.6 | % | ||||||||||
| Total Commercial |
34,352 | 37.9 | % | 34,903 | 37.6 | % | 36,961 | 38.4 | % | 35,839 | 37.5 | % | 36,923 | 37.9 | % | ||||||||||
| Commercial IRE Mortgage |
13,102 | 14.4 | % | 13,030 | 14.0 | % | 13,034 | 13.6 | % | 12,425 | 13.0 | % | 10,732 | 11.0 | % | ||||||||||
| Business Banking IRE Mortgage |
3,007 | 3.3 | % | 3,160 | 3.4 | % | 3,385 | 3.5 | % | 3,544 | 3.7 | % | 3,754 | 3.9 | % | ||||||||||
| Total Commercial Investor Real Estate Mortgage |
16,109 | 17.8 | % | 16,190 | 17.5 | % | 16,419 | 17.1 | % | 15,969 | 16.7 | % | 14,486 | 14.9 | % | ||||||||||
| Commercial IRE Construction |
5,473 | 6.0 | % | 6,472 | 7.0 | % | 6,961 | 7.2 | % | 7,316 | 7.6 | % | 8,624 | 8.9 | % | ||||||||||
| Business Banking IRE Construction |
118 | 0.1 | % | 144 | 0.2 | % | 202 | 0.2 | % | 295 | 0.3 | % | 405 | 0.4 | % | ||||||||||
| Total Commercial Investor Real Estate Construction |
5,591 | 6.2 | % | 6,616 | 7.1 | % | 7,163 | 7.4 | % | 7,611 | 8.0 | % | 9,029 | 9.3 | % | ||||||||||
| Total Investor Real Estate |
21,700 | 23.9 | % | 22,806 | 24.6 | % | 23,582 | 24.5 | % | 23,580 | 24.6 | % | 23,515 | 24.1 | % | ||||||||||
| Residential First Mortgage |
15,632 | 17.2 | % | 15,513 | 16.7 | % | 15,564 | 16.2 | % | 15,678 | 16.4 | % | 15,839 | 16.3 | % | ||||||||||
| Home Equity |
15,381 | 17.0 | % | 15,630 | 16.9 | % | 15,796 | 16.4 | % | 16,023 | 16.7 | % | 16,130 | 16.6 | % | ||||||||||
| Direct |
783 | 0.9 | % | 797 | 0.9 | % | 786 | 0.8 | % | 783 | 0.8 | % | 826 | 0.8 | % | ||||||||||
| Indirect |
2,452 | 2.7 | % | 2,755 | 3.0 | % | 3,099 | 3.2 | % | 3,464 | 3.6 | % | 3,854 | 4.0 | % | ||||||||||
| Other Consumer |
374 | 0.4 | % | 350 | 0.4 | % | 361 | 0.4 | % | 319 | 0.3 | % | 332 | 0.3 | % | ||||||||||
| Total Consumer |
34,622 | 38.2 | % | 35,045 | 37.8 | % | 35,606 | 37.0 | % | 36,267 | 37.9 | % | 36,981 | 38.0 | % | ||||||||||
| Total Loans |
90,674 | 100.0 | % | 92,754 | 100.0 | % | 96,149 | 100.0 | % | 95,686 | 100.0 | % | 97,419 | 100.0 | % | ||||||||||
OO = Owner Occupied
IRE = Investor Real Estate
FINANCIAL SUPPLEMENT TO
FOURTH QUARTER 2009 EARNINGS RELEASE
PAGE 15
| Net Charge-Offs Risk View |
| ||||||||||||||||||||||||
| 4Q2009 | 3Q2009 | 2Q2009 | 1Q2009 | 4Q2008 | |||||||||||||||||||||
| ($ millions) |
$ | % | $ | % | $ | % | $ | % | $ | % | |||||||||||||||
| Commercial & Industrial |
28 | 0.61 | % | 88 | 1.83 | % | 46 | 0.97 | % | 27 | 0.57 | % | 43 | 0.86 | % | ||||||||||
| Business Banking C&I |
48 | 5.51 | % | 49 | 5.45 | % | 38 | 4.16 | % | 31 | 3.23 | % | 30 | 2.84 | % | ||||||||||
| Total Commercial and Industrial |
76 | 1.39 | % | 137 | 2.41 | % | 84 | 1.49 | % | 58 | 1.02 | % | 73 | 1.20 | % | ||||||||||
| Commercial RE Mortgage - OO |
33 | 2.40 | % | 15 | 1.08 | % | 14 | 1.06 | % | 10 | 0.86 | % | 26 | 2.21 | % | ||||||||||
| Business Banking CRE Mortgage - OO |
5 | 0.31 | % | 2 | 0.11 | % | 1 | 0.08 | % | 2 | 0.11 | % | 6 | 0.36 | % | ||||||||||
| Total Commercial Real Estate Mortgage - OO |
38 | 1.26 | % | 17 | 0.55 | % | 15 | 0.51 | % | 12 | 0.42 | % | 32 | 1.10 | % | ||||||||||
| Commercial RE Construction - OO |
9 | 5.90 | % | 2 | 1.10 | % | 3 | 1.32 | % | 3 | 1.08 | % | 4 | 1.08 | % | ||||||||||
| Business Banking CRE Construction - OO |
— | 0.55 | % | — | 0.22 | % | — | 0.55 | % | 1 | 0.99 | % | — | 0.34 | % | ||||||||||
| Total Commercial Real Estate Construction - OO |
9 | 4.45 | % | 2 | 0.88 | % | 3 | 1.00 | % | 4 | 1.06 | % | 4 | 0.89 | % | ||||||||||
| Total Commercial |
123 | 1.41 | % | 156 | 1.73 | % | 102 | 1.15 | % | 74 | 0.83 | % | 109 | 1.16 | % | ||||||||||
| Commercial IRE Mortgage |
205 | 6.17 | % | 193 | 5.81 | % | 88 | 2.80 | % | 83 | 2.91 | % | 241 | 9.14 | % | ||||||||||
| Business Banking IRE Mortgage |
5 | 0.57 | % | 3 | 0.40 | % | 2 | 0.15 | % | 4 | 0.39 | % | 4 | 0.35 | % | ||||||||||
| Total Commercial Investor Real Estate Mortgage |
210 | 5.11 | % | 196 | 4.74 | % | 90 | 2.23 | % | 87 | 2.30 | % | 245 | 6.80 | % | ||||||||||
| Commercial IRE Construction |
158 | 10.43 | % | 147 | 8.57 | % | 110 | 6.08 | % | 66 | 3.30 | % | 300 | 12.77 | % | ||||||||||
| Business Banking IRE Construction |
1 | 2.24 | % | 1 | 1.48 | % | 1 | 1.13 | % | — | 0.45 | % | 1 | 0.67 | % | ||||||||||
| Total Commercial Investor Real Estate Construction |
159 | 10.26 | % | 148 | 8.40 | % | 111 | 5.94 | % | 66 | 3.18 | % | 301 | 12.20 | % | ||||||||||
| Total Investor Real Estate |
369 | 6.52 | % | 344 | 5.83 | % | 201 | 3.40 | % | 153 | 2.62 | % | 546 | 9.01 | % | ||||||||||
| Residential First Mortgage |
55 | 1.40 | % | 57 | 1.45 | % | 51 | 1.31 | % | 39 | 1.02 | % | 41 | 1.05 | % | ||||||||||
| Home Equity |
113 | 2.89 | % | 94 | 2.37 | % | 113 | 2.85 | % | 95 | 2.38 | % | 69 | 1.72 | % | ||||||||||
| Direct |
4 | 2.07 | % | 5 | 2.47 | % | 3 | 1.59 | % | 2 | 1.14 | % | 3 | 1.61 | % | ||||||||||
| Indirect |
10 | 1.58 | % | 10 | 1.46 | % | 11 | 1.31 | % | 16 | 1.74 | % | 15 | 1.43 | % | ||||||||||
| Other Consumer |
18 | 18.46 | % | 14 | 15.61 | % | 10 | 12.00 | % | 11 | 13.43 | % | 13 | 8.24 | % | ||||||||||
| Total Consumer |
200 | 2.28 | % | 180 | 2.03 | % | 188 | 2.10 | % | 163 | 1.81 | % | 141 | 1.50 | % | ||||||||||
| Total Net Charge-Offs |
692 | 2.99 | % | 680 | 2.86 | % | 491 | 2.06 | % | 390 | 1.64 | % | 796 | 3.19 | % | ||||||||||
OO = Owner Occupied
IRE = Investor Real Estate
FINANCIAL SUPPLEMENT TO
FOURTH QUARTER 2009 EARNINGS RELEASE
PAGE 16
| 90+ Days Past Due Loans Risk View |
| ||||||||||||||||||||||||
| 4Q2009 | 3Q2009 | 2Q2009 | 1Q2009 | 4Q2008 | |||||||||||||||||||||
| ($ millions) |
$ | % | $ | % | $ | % | $ | % | $ | % | |||||||||||||||
| Commercial & Industrial |
16 | 0.09 | % | 6 | 0.03 | % | 5 | 0.02 | % | 28 | 0.15 | % | 2 | 0.01 | % | ||||||||||
| Business Banking C&I |
8 | 0.23 | % | 7 | 0.20 | % | 9 | 0.25 | % | 14 | 0.38 | % | 12 | 0.30 | % | ||||||||||
| Total Commercial & Industrial |
24 | 0.11 | % | 13 | 0.06 | % | 14 | 0.06 | % | 42 | 0.19 | % | 14 | 0.06 | % | ||||||||||
| Commercial RE Mortgage - OO |
7 | 0.13 | % | 4 | 0.08 | % | 7 | 0.12 | % | 8 | 0.16 | % | 7 | 0.15 | % | ||||||||||
| Business Banking CRE Mortgage - OO |
9 | 0.13 | % | 8 | 0.12 | % | 10 | 0.16 | % | 15 | 0.22 | % | 6 | 0.09 | % | ||||||||||
| Total Commercial Real Estate Mortgage - OO |
16 | 0.13 | % | 12 | 0.10 | % | 17 | 0.14 | % | 23 | 0.19 | % | 13 | 0.11 | % | ||||||||||
| Commercial RE Construction - OO |
2 | 0.34 | % | — | 0.00 | % | 3 | 0.38 | % | 3 | 0.29 | % | 2 | 0.16 | % | ||||||||||
| Business Banking CRE Construction - OO |
— | 0.00 | % | 1 | 0.38 | % | — | 0.00 | % | 1 | 0.21 | % | — | 0.00 | % | ||||||||||
| Total Commercial Real Estate Construction - OO |
2 | 0.24 | % | 1 | 0.10 | % | 3 | 0.29 | % | 4 | 0.27 | % | 2 | 0.17 | % | ||||||||||
| Total Commercial |
42 | 0.12 | % | 26 | 0.07 | % | 34 | 0.09 | % | 69 | 0.19 | % | 29 | 0.08 | % | ||||||||||
| Commercial IRE Mortgage |
12 | 0.09 | % | 25 | 0.19 | % | 36 | 0.27 | % | 62 | 0.50 | % | 7 | 0.07 | % | ||||||||||
| Business Banking IRE Mortgage |
10 | 0.33 | % | 4 | 0.14 | % | 10 | 0.29 | % | 6 | 0.18 | % | 5 | 0.13 | % | ||||||||||
| Total Commercial Investor Real Estate Mortgage |
22 | 0.14 | % | 29 | 0.18 | % | 46 | 0.28 | % | 68 | 0.43 | % | 12 | 0.08 | % | ||||||||||
| Commercial IRE Construction |
8 | 0.14 | % | 11 | 0.16 | % | 12 | 0.17 | % | 29 | 0.40 | % | 11 | 0.13 | % | ||||||||||
| Business Banking IRE Construction |
— | 0.19 | % | — | 0.12 | % | 1 | 0.49 | % | — | 0.13 | % | 1 | 0.25 | % | ||||||||||
| Total Commercial Investor Real Estate Construction |
8 | 0.14 | % | 11 | 0.16 | % | 13 | 0.18 | % | 29 | 0.39 | % | 12 | 0.13 | % | ||||||||||
| Total Investor Real Estate |
30 | 0.14 | % | 40 | 0.18 | % | 59 | 0.25 | % | 97 | 0.42 | % | 24 | 0.10 | % | ||||||||||
| Residential First Mortgage |
361 | 2.31 | % | 345 | 2.23 | % | 360 | 2.32 | % | 359 | 2.29 | % | 272 | 1.72 | % | ||||||||||
| Home Equity |
241 | 1.57 | % | 222 | 1.42 | % | 148 | 0.94 | % | 244 | 1.52 | % | 214 | 1.33 | % | ||||||||||
| Direct |
2 | 0.30 | % | 2 | 0.22 | % | 2 | 0.21 | % | 3 | 0.38 | % | 3 | 0.36 | % | ||||||||||
| Indirect |
6 | 0.24 | % | 4 | 0.16 | % | 5 | 0.15 | % | 6 | 0.16 | % | 8 | 0.21 | % | ||||||||||
| Other Consumer |
6 | 1.34 | % | 4 | 1.07 | % | 5 | 1.33 | % | 4 | 1.25 | % | 4 | 1.20 | % | ||||||||||
| Total Consumer |
616 | 1.78 | % | 577 | 1.65 | % | 520 | 1.46 | % | 616 | 1.70 | % | 501 | 1.35 | % | ||||||||||
| Total 90+ Days Past Due Loans |
688 | 0.76 | % | 643 | 0.69 | % | 613 | 0.64 | % | 782 | 0.82 | % | 554 | 0.57 | % | ||||||||||
OO = Owner Occupied
IRE = Investor Real Estate
FINANCIAL SUPPLEMENT TO
FOURTH QUARTER 2009 EARNINGS RELEASE
PAGE 17
| Non-Accrual Loans (excludes loans held for sale) | |||||||||||||||||||||||||
| Risk View | |||||||||||||||||||||||||
| 4Q2009 | 3Q2009 | 2Q2009 | 1Q2009 | 4Q2008 | |||||||||||||||||||||
| ($ millions) |
$ | % | $ | % | $ | % | $ | % | $ | % | |||||||||||||||
| Commercial & Industrial |
345 | 1.90 | % | 303 | 1.64 | % | 300 | 1.50 | % | 187 | 0.99 | % | 118 | 0.60 | % | ||||||||||
| Business Banking C&I |
82 | 2.43 | % | 78 | 2.23 | % | 83 | 2.30 | % | 73 | 1.95 | % | 57 | 1.42 | % | ||||||||||
| Total Commercial & Industrial |
427 | 1.98 | % | 381 | 1.73 | % | 383 | 1.62 | % | 260 | 1.15 | % | 175 | 0.74 | % | ||||||||||
| Commercial RE Mortgage - OO |
395 | 7.32 | % | 311 | 5.70 | % | 257 | 4.60 | % | 190 | 3.69 | % | 131 | 2.74 | % | ||||||||||
| Business Banking CRE Mortgage - OO |
165 | 2.49 | % | 139 | 2.10 | % | 115 | 1.71 | % | 81 | 1.20 | % | 66 | 0.95 | % | ||||||||||
| Total Commercial Real Estate Mortgage - OO |
560 | 4.65 | % | 450 | 3.72 | % | 372 | 3.03 | % | 271 | 2.27 | % | 197 | 1.68 | % | ||||||||||
| Commercial RE Construction - OO |
47 | 8.88 | % | 46 | 7.01 | % | 44 | 5.49 | % | 29 | 2.81 | % | 23 | 1.86 | % | ||||||||||
| Business Banking CRE Construction - OO |
3 | 1.54 | % | 1 | 0.46 | % | 1 | 0.47 | % | 2 | 0.54 | % | 2 | 0.54 | % | ||||||||||
| Total Commercial Real Estate Construction - OO |
50 | 6.69 | % | 47 | 5.33 | % | 45 | 4.29 | % | 31 | 2.29 | % | 25 | 1.61 | % | ||||||||||
| Total Commercial |
1,037 | 3.02 | % | 878 | 2.52 | % | 800 | 2.16 | % | 562 | 1.57 | % | 397 | 1.07 | % | ||||||||||
| Commercial IRE Mortgage |
1,126 | 8.60 | % | 1,123 | 8.62 | % | 759 | 5.82 | % | 437 | 3.52 | % | 261 | 2.43 | % | ||||||||||
| Business Banking IRE Mortgage |
77 | 2.56 | % | 61 | 1.95 | % | 52 | 1.55 | % | 38 | 1.06 | % | 31 | 0.83 | % | ||||||||||
| Total Commercial Investor Real Estate Mortgage |
1,203 | 7.47 | % | 1,184 | 7.31 | % | 811 | 4.94 | % | 475 | 2.97 | % | 292 | 2.01 | % | ||||||||||
| Commercial IRE Construction |
1,061 | 19.37 | % | 987 | 15.25 | % | 864 | 12.41 | % | 493 | 6.73 | % | 269 | 3.12 | % | ||||||||||
| Business Banking IRE Construction |
6 | 5.21 | % | 5 | 3.16 | % | 5 | 2.32 | % | 5 | 1.65 | % | 4 | 0.99 | % | ||||||||||
| Total Commercial Investor Real Estate Construction |
1,067 | 19.07 | % | 992 | 14.99 | % | 869 | 12.13 | % | 498 | 6.53 | % | 273 | 3.02 | % | ||||||||||
| Total Investor Real Estate |
2,270 | 10.46 | % | 2,176 | 9.54 | % | 1,680 | 7.12 | % | 973 | 4.12 | % | 565 | 2.40 | % | ||||||||||
| Residential First Mortgage |
180 | 1.15 | % | 162 | 1.05 | % | 136 | 0.87 | % | 102 | 0.65 | % | 86 | 0.54 | % | ||||||||||
| Home Equity |
1 | 0.00 | % | — | 0.00 | % | 2 | 0.01 | % | 4 | 0.03 | % | 4 | 0.02 | % | ||||||||||
| Direct |
— | 0.00 | % | — | 0.00 | % | — | 0.00 | % | — | 0.00 | % | — | 0.00 | % | ||||||||||
| Indirect |
— | 0.00 | % | — | 0.00 | % | — | 0.00 | % | — | 0.00 | % | — | 0.00 | % | ||||||||||
| Other Consumer |
— | 0.00 | % | — | 0.00 | % | — | 0.00 | % | — | 0.00 | % | — | 0.00 | % | ||||||||||
| Total Consumer |
181 | 0.52 | % | 162 | 0.46 | % | 138 | 0.39 | % | 106 | 0.29 | % | 90 | 0.24 | % | ||||||||||
| Total Non-Accrual Loans |
3,488 | 3.85 | % | 3,216 | 3.47 | % | 2,618 | 2.72 | % | 1,641 | 1.71 | % | 1,052 | 1.08 | % | ||||||||||
OO = Owner Occupied
IRE = Investor Real Estate
FINANCIAL SUPPLEMENT TO
FOURTH QUARTER 2009 EARNINGS RELEASE
PAGE 18
FINANCIAL SUPPLEMENT TO
FOURTH QUARTER 2009 EARNINGS RELEASE
PAGE 19
FINANCIAL SUPPLEMENT TO
FOURTH QUARTER 2009 EARNINGS RELEASE
PAGE 20
FINANCIAL SUPPLEMENT TO
FOURTH QUARTER 2009 EARNINGS RELEASE
PAGE 21
FINANCIAL SUPPLEMENT TO
FOURTH QUARTER 2009 EARNINGS RELEASE
PAGE 22
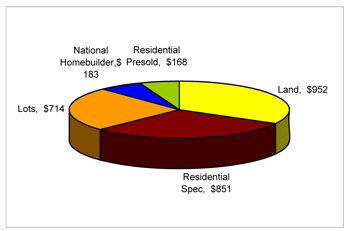
Residential Homebuilder Portfolio - $2.9 billion (as of 12/31/09) (1)
Portfolio Breakout by Category
($ in millions)
Geographic Breakout
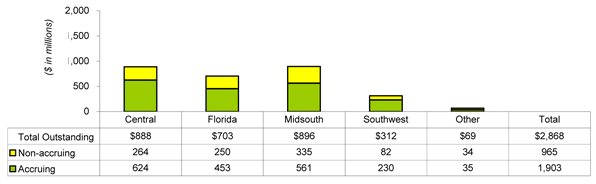
| 1 | Central consists of Alabama, Georgia, and South Carolina |
| 2 | Midsouth consists of North Carolina, Virginia, Tennessee, Indiana, Illinois, Missouri, Iowa and Kentucky |
| 3 | Southwest consists of Louisiana, Mississippi, Texas and Arkansas |
Product Breakout
($ in millions - except for average note size)
| Lots | Residential Presold | Residential Spec |
Land | National Homebuilder/Other |
Total Portfolio |
|||||||||||||||||||||||||
| $ | %* | $ | %* | $ | %* | $ | %* | $ | %* | $ | %* | |||||||||||||||||||
| Ending Outstandings |
714 | 168 | 851 | 952 | 183 | 2,868 | ||||||||||||||||||||||||
| Current Quarter Charge-offs |
37 | 19.3 | % | 13 | 26.8 | % | 25 | 11.2 | % | 61 | 23.4 | % | 13 | 25.9 | % | 149 | 19.2 | % | ||||||||||||
| 90+ Past Due |
12 | 1.7 | % | 1 | 0.5 | % | 3 | 0.4 | % | 2 | 0.2 | % | — | 0.0 | % | 18 | 0.6 | % | ||||||||||||
| Non-Accruing Loans |
219 | 30.7 | % | 96 | 57.3 | % | 229 | 26.9 | % | 295 | 30.9 | % | 126 | 68.9 | % | 965 | 33.7 | % | ||||||||||||
| Average Note Size (in thousands): |
||||||||||||||||||||||||||||||
| Total Portfolio |
241 | — | 307 | — | 278 | — | 725 | — | 1,536 | — | 356 | — | ||||||||||||||||||
| Central |
209 | — | 172 | — | 187 | — | 725 | — | 600 | — | 282 | — | ||||||||||||||||||
| Florida |
443 | — | 957 | — | 723 | — | 1,604 | — | 260 | — | 836 | — | ||||||||||||||||||
| * | Percentage of related product outstandings; charge-offs shown as annualized and calculated on an average outstandings balance |
| • | Average note size of the homebuilder portfolio is $356 thousand |
| • | Non-accruing loans represent 33.7% of the total homebuilder portfolio with the highest concentrations in the Midsouth and Central (mainly Atlanta) regions |
| • | $2.9 billion residential homebuilder portfolio is a subset of the Investor Real Estate portfolio (p. 19) with the majority of the residential homebuilder portfolio found in land and single family sectors |
| (1) | Excludes loans held for sale |
FINANCIAL SUPPLEMENT TO
FOURTH QUARTER 2009 EARNINGS RELEASE
PAGE 23
Home Equity Lending Net Charge-off Analysis
| 4Q09 | 3Q09 | 2Q09 | 1Q09 | 4Q08 | ||||||||||||||||||||||||||||||||||||||||||||||||||||||||||
| ($ in millions) |
1st Lien | 2nd Lien |
Total | 1st Lien | 2nd Lien |
Total | 1st Lien | 2nd Lien |
Total | 1st Lien | 2nd Lien |
Total | 1st Lien | 2nd Lien |
Total | |||||||||||||||||||||||||||||||||||||||||||||||
| Florida |
Net Charge-off %* | 3.17 | % | 7.47 | % | 5.83 | % | 2.19 | % | 6.33 | % | 4.77 | % | 2.44 | % | 7.89 | % | 5.85 | % | 3.07 | % | 5.99 | % | 4.91 | % | 1.71 | % | 4.37 | % | 3.40 | % | |||||||||||||||||||||||||||||||
| $ Losses |
$ | 17.4 | $ | 66.4 | $ | 83.8 | $ | 12.1 | $ | 57.4 | $ | 69.5 | $ | 13.2 | $ | 72.0 | $ | 85.2 | $ | 16.4 | $ | 54.6 | $ | 71.0 | $ | 8.9 | $ | 40.0 | $ | 48.9 | ||||||||||||||||||||||||||||||||
| Balance |
$ | 2,169.7 | $ | 3,485.5 | $ | 5,655.2 | $ | 2,181.0 | $ | 3,570.4 | $ | 5,751.4 | $ | 2,171.3 | $ | 3,624.8 | $ | 5,796.1 | $ | 2,169.9 | $ | 3,677.5 | $ | 5,847.4 | $ | 2,121.6 | $ | 3,662.9 | $ | 5,784.5 | ||||||||||||||||||||||||||||||||
| Original LTV |
65.4 | % | 76.1 | % | 72.0 | % | ||||||||||||||||||||||||||||||||||||||||||||||||||||||||
| All Other States |
Net Charge-off %* | 0.93 | % | 1.39 | % | 1.18 | % | 0.56 | % | 1.33 | % | 0.98 | % | 0.63 | % | 1.50 | % | 1.11 | % | 0.52 | % | 1.27 | % | 0.93 | % | 0.52 | % | 1.00 | % | 0.79 | % | |||||||||||||||||||||||||||||||
| $ Losses |
$ | 10.4 | $ | 18.8 | $ | 29.2 | $ | 6.2 | $ | 18.3 | $ | 24.5 | $ | 7.2 | $ | 20.7 | $ | 27.9 | $ | 5.9 | $ | 17.7 | $ | 23.6 | $ | 6.0 | $ | 14.3 | $ | 20.3 | ||||||||||||||||||||||||||||||||
| Balance |
$ | 4,394.8 | $ | 5,330.6 | $ | 9,725.4 | $ | 4,451.0 | $ | 5,428.0 | $ | 9,879.0 | $ | 4,508.6 | $ | 5,491.6 | $ | 10,000.2 | $ | 4,569.4 | $ | 5,606.6 | $ | 10,176.0 | $ | 4,624.0 | $ | 5,721.7 | $ | 10,345.7 | ||||||||||||||||||||||||||||||||
| Original LTV |
67.8 | % | 79.8 | % | 74.3 | % | ||||||||||||||||||||||||||||||||||||||||||||||||||||||||
| Totals |
Net Charge-off %* | 1.67 | % | 3.79 | % | 2.89 | % | 1.09 | % | 3.32 | % | 2.37 | % | 1.22 | % | 4.04 | % | 2.85 | % | 1.34 | % | 3.14 | % | 2.38 | % | 0.89 | % | 2.31 | % | 1.72 | % | |||||||||||||||||||||||||||||||
| $ Losses |
$ | 27.8 | $ | 85.2 | $ | 113.0 | $ | 18.3 | $ | 75.7 | $ | 94.0 | $ | 20.4 | $ | 92.7 | $ | 113.1 | $ | 22.3 | $ | 72.3 | $ | 94.6 | $ | 14.9 | $ | 54.3 | $ | 69.2 | ||||||||||||||||||||||||||||||||
| Balance |
$ | 6,564.5 | $ | 8,816.1 | $ | 15,380.6 | $ | 6,632.0 | $ | 8,998.4 | $ | 15,630.4 | $ | 6,679.9 | $ | 9,116.4 | $ | 15,796.3 | $ | 6,739.3 | $ | 9,284.1 | $ | 16,023.4 | $ | 6,745.6 | $ | 9,384.6 | $ | 16,130.2 | ||||||||||||||||||||||||||||||||
| Original LTV |
67.0 | % | 78.3 | % | 73.4 | % | ||||||||||||||||||||||||||||||||||||||||||||||||||||||||
| • | 23% Florida second lien concentration driving results |
| • | Second lien, Florida net charge-offs represent 59% of 4Q09 net charge-offs but just 23% of outstanding balances. |
| • | Net charge-offs in Florida approximately 4.9 times non-Florida net charge-off rate |
| • | New origination quality solid with an average FICO of 768 and an average LTV of 61%; Property value declines driving losses |
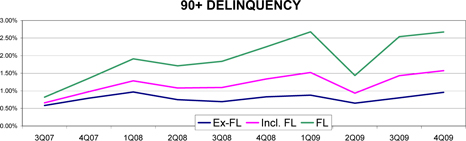
| Notes: | * Recoveries are pro-rated based on charge-off balances. | |
| * Net Charge-off percentages are calculated on average balances. * Balances shown on an ending basis. Net loss rates calculated using average balances * Original LTVs shown for current period only; prior period LTVs not materially different |
FINANCIAL SUPPLEMENT TO
FOURTH QUARTER 2009 EARNINGS RELEASE
PAGE 24
Gross and Net NPA Migration Declining
| ($ in millions) |
4Q 2008 | 1Q 2009 | 2Q 2009 | 3Q 2009 | 4Q 2009 | |||||||||||||||
| Beginning Non-Performing Assets¹ |
$ | 1,642 | $ | 1,295 | $ | 1,935 | $ | 3,057 | $ | 3,719 | ||||||||||
| Additions |
$ | 1,004 | $ | 1,116 | $ | 1,758 | $ | 1,667 | $ | 1,404 | ||||||||||
| Payments |
(82 | ) | (55 | ) | (116 | ) | (90 | ) | (88 | ) | ||||||||||
| Returned to Accruing Status |
(44 | ) | (34 | ) | (10 | ) | (42 | ) | (44 | ) | ||||||||||
| Charge-Offs / OREO Write-Downs |
(243 | ) | (215 | ) | (296 | ) | (440 | ) | (451 | ) | ||||||||||
| Net Additions |
$ | 635 | $ | 812 | $ | 1,336 | $ | 1,095 | $ | 821 | ||||||||||
| Dispositions |
(276 | ) | (81 | ) | (80 | ) | (232 | ) | (312 | ) | ||||||||||
| Moved to Held for Sale |
(706 | ) | (91 | ) | (134 | ) | (201 | ) | (133 | ) | ||||||||||
| Ending Non-Performing Assets¹ |
$ | 1,295 | $ | 1,935 | $ | 3,057 | $ | 3,719 | $ | 4,095 | ||||||||||
| Change Versus Previous Quarter |
$ | (347 | ) | $ | 640 | $ | 1,122 | $ | 662 | $ | 376 | |||||||||
| 1 | Excludes Loans Held for Sale |
FINANCIAL SUPPLEMENT TO
FOURTH QUARTER 2009 EARNINGS RELEASE
PAGE 25
Additional Financial and Operational Data
| 12/31/09 | 9/30/09 | 6/30/09 | 3/31/09 | 12/31/08 | ||||||
| Associate headcount |
28,509 | 28,995 | 29,838 | 30,613 | 30,784 | |||||
| Total branch outlets |
1,895 | 1,895 | 1,899 | 1,904 | 1,900 | |||||
| ATMs |
2,304 | 2,313 | 2,321 | 2,322 | 2,336 | |||||
| Morgan Keegan offices |
324 | 339 | 324 | 328 | 332 |
FINANCIAL SUPPLEMENT TO
FOURTH QUARTER 2009 EARNINGS RELEASE
PAGE 26
Reconciliation to GAAP Financial Measures
The table below presents computations of earnings and certain other financial measures excluding goodwill impairment charges (non-GAAP). Goodwill impairment charges are included in financial results presented in accordance with generally accepted accounting principles (GAAP). Regions believes the exclusion of goodwill impairment charges in expressing earnings and certain other financial measures, including “earnings per common share, excluding goodwill impairment charges” and “return on average tangible common equity, excluding goodwill impairment charges”, provides a meaningful base for period-to-period comparisons, which management believes will assist investors in analyzing the operating results of the Company and predicting future performance. These non-GAAP financial measures are also used by management to assess the performance of Regions’ business, because management does not consider goodwill impairment charges to be relevant to ongoing operating results. Management and the Board of Directors utilize these non-GAAP financial measures for the following purposes: preparation of Regions’ operating budgets; calculation of performance-based annual incentive bonuses for certain executives; calculation of performance-based multi-year incentive bonuses for certain executives; monthly financial performance reporting, including segment reporting; monthly close-out “flash” reporting of consolidated results (management only); and presentations to investors of company performance. Regions believes that presenting these non-GAAP financial measures will permit investors to assess the performance of the Company on the same basis as that applied by management and the Board of Directors. Non-GAAP financial measures have inherent limitations, are not required to be uniformly applied and are not audited. Although these non-GAAP financial measures are frequently used by stakeholders in the evaluation of a company, they have limitations as analytical tools, and should not be considered in isolation, or as a substitute for analyses of results as reported under GAAP. In particular, a measure of earnings that excludes goodwill impairment charges does not represent the amount that effectively accrues directly to stockholders (i.e., goodwill impairment charges are a reduction to earnings and stockholders’ equity).
| As of and for Quarter Ended | ||||||||||||||||||||||
| ($ amounts in millions, except per share data) |
12/31/09 | 09/30/09 | 06/30/09 | 03/31/09 | 12/31/08 | |||||||||||||||||
| INCOME |
||||||||||||||||||||||
| Net income (loss) (GAAP) |
$ | (543 | ) | $ | (377 | ) | $ | (188 | ) | $ | 77 | $ | (6,218 | ) | ||||||||
| Preferred dividends (GAAP) |
(63 | ) | (60 | ) | (56 | ) | (51 | ) | (26 | ) | ||||||||||||
| Net income (loss) available to common shareholders (GAAP) |
A | $ | (606 | ) | $ | (437 | ) | $ | (244 | ) | $ | 26 | $ | (6,244 | ) | |||||||
| Goodwill impairment |
— | — | — | — | 6,000 | |||||||||||||||||
| Net income (loss) available to common shareholders, excluding goodwill impairment charges (non-GAAP) |
B | $ | (606 | ) | $ | (437 | ) | $ | (244 | ) | $ | 26 | $ | (244 | ) | |||||||
| Weighted-average diluted shares |
C | 1,191 | 1,189 | 876 | 694 | 693 | ||||||||||||||||
| Earnings (loss) per common share - diluted (GAAP) |
A/C | $ | (0.51 | ) | $ | (0.37 | ) | $ | (0.28 | ) | $ | 0.04 | $ | (9.01 | ) | |||||||
| Earnings (loss) per common share, excluding goodwill impairment charges- diluted (non-GAAP) |
B/C | $ | (0.51 | ) | $ | (0.37 | ) | $ | (0.28 | ) | $ | 0.04 | $ | (0.35 | ) | |||||||
FINANCIAL SUPPLEMENT TO
FOURTH QUARTER 2009 EARNINGS RELEASE
PAGE 27
Reconciliation to GAAP Financial Measures (Continued)
The following tables provide calculations of “return on average tangible common stockholders’ equity”, end of period “tangible common stockholders’ equity” ratios and a reconciliation of stockholders’ equity (GAAP) to Tier 1 capital (regulatory) and to “Tier 1 common equity” (non-GAAP). Tangible common stockholders’ equity ratios have become a focus of some investors and management believes they may assist investors in analyzing the capital position of the Company absent the effects of intangible assets and preferred stock. Traditionally, the Federal Reserve and other banking regulatory bodies have assessed a bank’s capital adequacy based on Tier 1 capital, the calculation of which is codified in federal banking regulations. In connection with the Supervisory Capital Assessment Program (“SCAP”), these regulators began supplementing their assessment of the capital adequacy of a bank based on a variation of Tier 1 capital, known as Tier 1 common equity. While not codified, analysts and banking regulators have assessed Regions’ capital adequacy using the tangible common stockholders’ equity and/or the Tier 1 common equity measure. Because tangible common stockholders’ and Tier 1 common equity are not formally defined by GAAP or codified in the federal banking regulations, these measures are considered to be non-GAAP financial measures and other entities may calculate them differently than Regions’ disclosed calculations. Since analysts and banking regulators may assess Regions’ capital adequacy using tangible common stockholders’ equity and Tier 1 common equity, we believe that it is useful to provide investors the ability to assess Regions’ capital adequacy on these same bases.
Tier 1 common equity is often expressed as a percentage of risk-weighted assets. Under the risk-based capital framework, a bank’s balance sheet assets and credit equivalent amounts of off-balance sheet items are assigned to one of four broad risk categories. The aggregated dollar amount in each category is then multiplied by the risk-weighted category. The resulting weighted values from each of the four categories are added together and this sum is the risk-weighted assets total that, as adjusted, comprises the denominator of certain risk-based capital ratios. Tier 1 capital is then divided by this denominator (risk-weighted assets) to determine the Tier 1 capital ratio. Adjustments are made to Tier 1 capital to arrive at Tier 1 common equity. Tier 1 common equity is also divided by the risk-weighted assets to determine the Tier 1 common equity ratio. The amounts disclosed as risk-weighted assets are calculated consistent with banking regulatory requirements.
| As of and for Quarter Ended | ||||||||||||||||||||||
| ($ amounts in millions) |
12/31/09 | 09/30/09 | 06/30/09 | 03/31/09 | 12/31/08 | |||||||||||||||||
| RETURN ON AVERAGE TANGIBLE COMMON STOCKHOLDERS’ EQUITY |
||||||||||||||||||||||
| Average stockholders’ equity (GAAP) |
$ | 18,248 | $ | 18,612 | $ | 17,494 | $ | 16,710 | $ | 20,410 | ||||||||||||
| Less: Average intangible assets (GAAP) |
6,077 | 6,108 | 6,138 | 6,168 | 11,086 | |||||||||||||||||
| Average preferred equity (GAAP) |
3,606 | 3,606 | 3,421 | 3,311 | 1,690 | |||||||||||||||||
| Average tangible common stockholders’ equity (non-GAAP) |
D | $ | 8,565 | $ | 8,898 | $ | 7,935 | $ | 7,231 | $ | 7,634 | |||||||||||
| Return on average tangible common stockholders’ equity (1) |
A/D | -28.03 | % | -19.48 | % | -12.34 | % | 1.43 | % | NM | ||||||||||||
| Return on average tangible common stockholders’ equity, ex. goodwill impairment charges (non-GAAP) (1) |
B/D | -28.03 | % | -19.48 | % | -12.34 | % | 1.43 | % | -12.72 | % | |||||||||||
| TANGIBLE COMMON RATIOS |
||||||||||||||||||||||
| Stockholders’ equity (GAAP) |
$ | 17,881 | $ | 18,492 | $ | 18,737 | $ | 16,817 | $ | 16,813 | ||||||||||||
| Less: Intangible assets (GAAP) |
6,060 | 6,093 | 6,124 | 6,154 | 6,186 | |||||||||||||||||
| Preferred equity (GAAP) |
3,602 | 3,612 | 3,603 | 3,316 | 3,307 | |||||||||||||||||
| Tangible common stockholders’ equity (non-GAAP) |
E | $ | 8,219 | $ | 8,787 | $ | 9,010 | $ | 7,347 | $ | 7,320 | |||||||||||
| Total assets (GAAP) |
$ | 142,318 | $ | 139,986 | $ | 142,811 | $ | 141,980 | $ | 146,248 | ||||||||||||
| Less: Intangible assets (GAAP) |
6,060 | 6,093 | 6,124 | 6,154 | 6,186 | |||||||||||||||||
| Tangible assets (non-GAAP) |
F | $ | 136,258 | $ | 133,893 | $ | 136,687 | $ | 135,826 | $ | 140,062 | |||||||||||
| Actual shares outstanding—end of quarter |
G | 1,193 | 1,188 | 1,188 | 695 | 691 | ||||||||||||||||
| Tangible common stockholders’ equity to tangible assets (non-GAAP) |
E/F | 6.03 | % | 6.56 | % | 6.59 | % | 5.41 | % | 5.23 | % | |||||||||||
| Tangible common book value per share (non-GAAP) |
E/G | $ | 6.89 | $ | 7.40 | $ | 7.58 | $ | 10.57 | $ | 10.59 | |||||||||||
| TIER 1 COMMON RISK-BASED RATIO (2) |
||||||||||||||||||||||
| Stockholders’ equity (GAAP) |
$ | 17,881 | $ | 18,492 | $ | 18,737 | $ | 16,817 | $ | 16,813 | ||||||||||||
| Accumulated other comprehensive income (loss) |
(130 | ) | (143 | ) | 36 | (11 | ) | 8 | ||||||||||||||
| Non-qualifying goodwill and intangibles |
(5,794 | ) | (5,821 | ) | (5,845 | ) | (5,865 | ) | (5,864 | ) | ||||||||||||
| Other non-qualifying assets |
(876 | ) | (506 | ) | (423 | ) | (267 | ) | (16 | ) | ||||||||||||
| Qualifying non-controlling interests |
91 | 91 | 91 | 91 | 91 | |||||||||||||||||
| Qualifying trust preferred securities |
846 | 846 | 846 | 1,036 | 1,036 | |||||||||||||||||
| Tier 1 capital (regulatory) |
$ | 12,018 | $ | 12,959 | $ | 13,442 | $ | 11,801 | $ | 12,068 | ||||||||||||
| Qualifying non-controlling interests |
(91 | ) | (91 | ) | (91 | ) | (91 | ) | (91 | ) | ||||||||||||
| Qualifying trust preferred securities |
(846 | ) | (846 | ) | (846 | ) | (1,036 | ) | (1,036 | ) | ||||||||||||
| Preferred stock |
(3,602 | ) | (3,612 | ) | (3,603 | ) | (3,316 | ) | (3,307 | ) | ||||||||||||
| Tier 1 common equity (non-GAAP) |
H | $ | 7,479 | $ | 8,410 | $ | 8,902 | $ | 7,358 | $ | 7,634 | |||||||||||
| Risk-weighted assets (regulatory) |
I | 103,842 | 106,673 | 110,558 | 113,312 | 116,251 | ||||||||||||||||
| Tier 1 common risk-based ratio (non-GAAP) |
H/I | 7.2 | % | 7.9 | % | 8.1 | % | 6.5 | % | 6.6 | % | |||||||||||
| (1) | Income statement amounts have been annualized in calculation |
| (2) | Current quarter amounts and the resulting ratios are estimated |
FINANCIAL SUPPLEMENT TO
FOURTH QUARTER 2009 EARNINGS RELEASE
PAGE 28
Forward-Looking Statements
This supplement may include forward-looking statements, which reflect Regions’ current views with respect to future events and financial performance. The Private Securities Litigation Reform Act of 1995 (“the Act”) provides a safe harbor for forward-looking statements which are identified as such and are accompanied by the identification of important factors that could cause actual results to differ materially from the forward-looking statements. For these statements, we, together with our subsidiaries, claim the protection afforded by the safe harbor in the Act. Forward-looking statements are not based on historical information, but rather are related to future operations, strategies, financial results or other developments. Forward-looking statements are based on management’s expectations as well as certain assumptions and estimates made by, and information available to, management at the time the statements are made. Those statements are based on general assumptions and are subject to various risks, uncertainties and other factors that may cause actual results to differ materially from the views, beliefs and projections expressed in such statements. These risks, uncertainties and other factors include, but are not limited to, those described below:
| • | In October 2008, Congress enacted, and the President signed into law, the Emergency Economic Stabilization Act of 2008, and in February, 2009 the American Recovery and Reinvestment Act of 2009 was signed into law. Additionally, the Department of the U.S. Treasury and federal banking regulators are implementing a number of programs to address capital and liquidity issues in the banking system, and may announce additional programs in the future, all of which may have significant effects on Regions and the financial services industry, the exact nature and extent of which cannot be determined at this time. |
| • | The impact of compensation and other restrictions imposed under the Troubled Asset Relief Program (“TARP”) until Regions is able to repay the outstanding preferred stock issued under the TARP. |
| • | Possible additional loan losses, impairment of goodwill and other intangibles and valuation allowances on deferred tax assets and the impact on earnings and capital. |
| • | Possible changes in interest rates may affect funding costs and reduce earning asset yields, thus reducing margins. |
| • | Possible changes in general economic and business conditions in the United States in general and in the communities Regions serves in particular. |
| • | Possible changes in the creditworthiness of customers and the possible impairment of collectability of loans. |
| • | Possible changes in trade, monetary and fiscal policies, laws and regulations, and other activities of governments, agencies, and similar organizations, including changes in accounting standards, may have an adverse effect on business. |
| • | The current stresses in the financial and real estate markets, including possible continued deterioration in property values. |
| • | Regions’ ability to manage fluctuations in the value of assets and liabilities and off-balance sheet exposure so as to maintain sufficient capital and liquidity to support Regions’ business. |
| • | Regions’ ability to achieve the earnings expectations related to businesses that have been acquired or that may be acquired in the future. |
| • | Regions’ ability to expand into new markets and to maintain profit margins in the face of competitive pressures. |
| • | Regions’ ability to develop competitive new products and services in a timely manner and the acceptance of such products and services by Regions’ customers and potential customers. |
| • | Regions’ ability to keep pace with technological changes. |
| • | Regions’ ability to effectively manage credit risk, interest rate risk, market risk, operational risk, legal risk, liquidity risk, and regulatory and compliance risk. |
| • | The cost and other effects of material contingencies, including litigation contingencies. |
| • | The effects of increased competition from both banks and non-banks. |
| • | The effects of geopolitical instability and risks such as terrorist attacks. |
| • | Possible changes in consumer and business spending and saving habits could affect Regions’ ability to increase assets and to attract deposits. |
| • | The effects of weather and natural disasters such as droughts and hurricanes. |
The foregoing list of factors is not exhaustive; for discussion of these and other risks that may cause actual results to differ from expectations, please look under the captions “Forward-Looking Statements” and “Risk Factors” in Regions’ Annual Report on Form 10-K for the year ended December 31, 2008 and Forms 10-Q for the quarter ended March 31, 2009 (as amended), June 30, 2009 and September 30, 2009 as on file with the Securities and Exchange Commission.
The words “believe,” “expect,” “anticipate,” “project,” and similar expressions often signify forward-looking statements. You should not place undue reliance on any forward-looking statements, which speak only as of the date made. We assume no obligation to update or revise any forward-looking statements that are made from time to time.
Regions’ Investor Relations contact is List Underwood at (205) 801-0265; Regions’ Media contact is Tim Deighton at (205) 264-4551