Attached files
| file | filename |
|---|---|
| 8-K - 8-K - MICROFLUIDICS INTERNATIONAL CORP | a10-2327_18k.htm |
Exhibit 99.1
|
|
Microfluidics Investment Opportunity (OTCBB: MFLU) Michael C. Ferrara Chief Executive Officer mferrara@mfics.com Peter Byczko Chief Accounting Officer pbyczko@mfics.com Tiny particles, BIG RESULTS 1 |
|
|
Safe Harbor for Forward-Looking Statements This presentation contains forward-looking statements within the meaning of the Private Securities Litigation Reform Act of 1995 as contained in Section 27A of the Securities Act of 1933 and Section 21E of the Securities Exchange Act of 1934. You can identify these statements by the fact that they use words such as “anticipate,” “believe,” “estimate,” "expect,” “intend,” “project,” “plan,” “outlook,” and other words and terms of similar meaning. These statements involve a number of risks and uncertainties that could cause actual results to differ materially from the potential results discussed in the forward-looking statements. Among the factors that could cause actual results and outcomes to differ materially from those contained in such forward-looking statements are the following: our ability to access sufficient working capital, including a new working capital line; our continued compliance with the representations, warranties and covenants under our existing convertible debenture; our continued history of losses, which includes net losses in three of the last five fiscal years; the timing and size of customer orders for our products; the adoption, timing and performance of new technology and products developed by us; changes and advances in technology that may make our products obsolete or reduce demand for our products; our ability to protect and maintain the confidentiality of our Intellectual property; our ability to retain key employees and our reliance on a new management team; changes in governmental rules and regulations, including those regulating the exportation of goods; and general economic and business conditions and the financial crisis, including those adversely effecting the pharmaceutical and biotechnology industries. For a more detailed discussion of risks and uncertainties which could cause actual results to differ from those contained in our forward-looking statements, see Item 1A, “Risk Factors” in our annual report on Form 10-K or our most recently filed Quarterly Report on Form 10-Q for the quarter ended September 30, 2009 and our other periodic reports filed with the SEC. You should not place undue reliance on our forward-looking statements, which speak only as of the date they are made. We are providing this information as of this date, and we do not undertake to update the information included in this presentation, whether as a result of new information, future events or otherwise. |
|
|
Value Proposition 3 1. Nanopharmaceuticals are a growing market; Microfluidics has a well-established foothold in this field 2. New products are being rapidly adopted with a solid pipeline engine behind them 3. Products and services are commanding higher value and raising gross margins 4. New leadership has built a culture focused on customers, quality and execution 5. Strong financials, EBITDA positive through Q3 2009 despite economy, and well positioned for sustained growth |
|
|
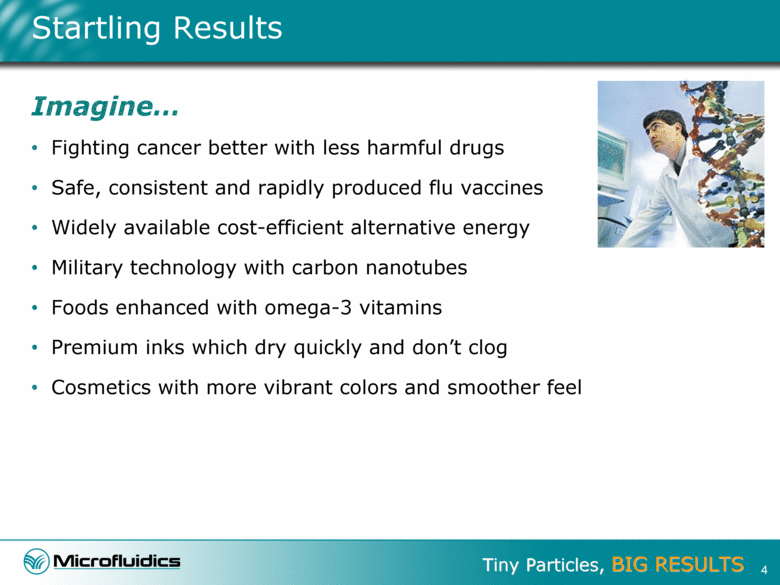
Startling Results Imagine Fighting cancer better with less harmful drugs Safe, consistent and rapidly produced flu vaccines Widely available cost-efficient alternative energy Military technology with carbon nanotubes Foods enhanced with omega-3 vitamins Premium inks which dry quickly and don’t clog Cosmetics with more vibrant colors and smoother feel 4 |
|
|
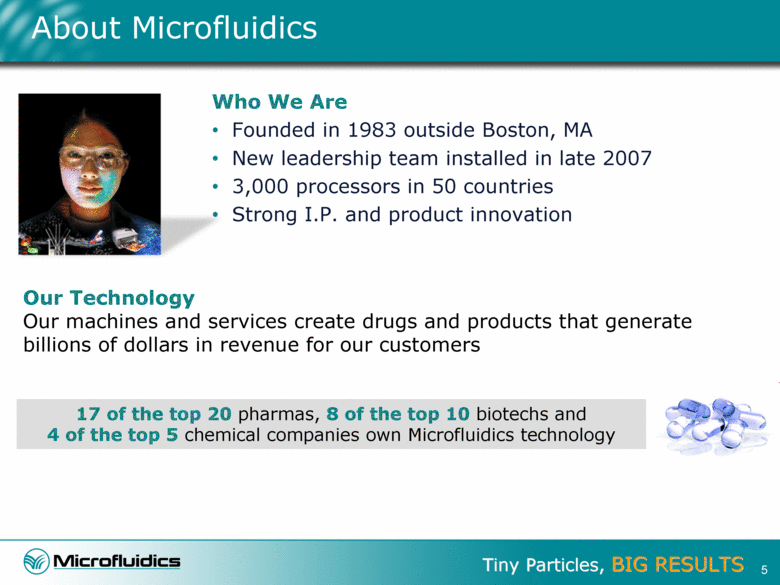
About Microfluidics Who We Are Founded in 1983 outside Boston, MA New leadership team installed in late 2007 3,000 processors in 50 countries Strong I.P. and product innovation 17 of the top 20 pharmas, 8 of the top 10 biotechs and 4 of the top 5 chemical companies own Microfluidics technology Our Technology Our machines and services create drugs and products that generate billions of dollars in revenue for our customers 5 |
|
|
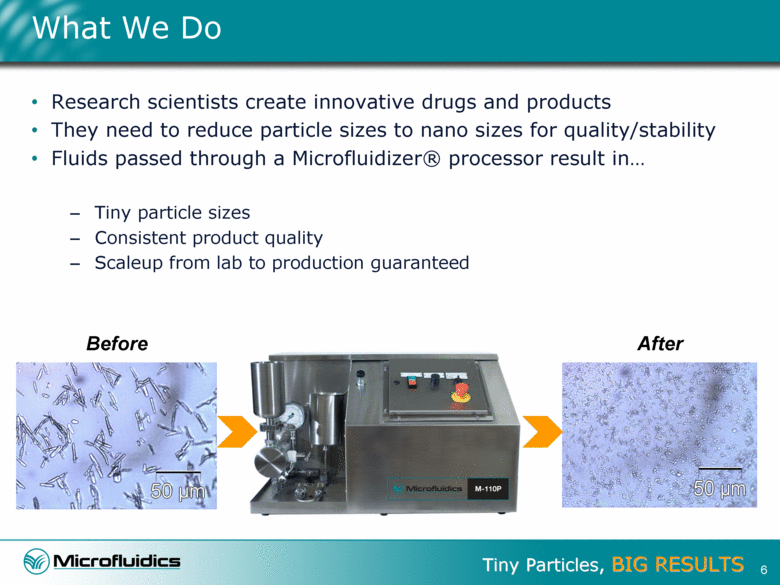
What We Do Research scientists create innovative drugs and products They need to reduce particle sizes to nano sizes for quality/stability Fluids passed through a Microfluidizer® processor result in Tiny particle sizes Consistent product quality Scaleup from lab to production guaranteed 6 Before After |
|
|
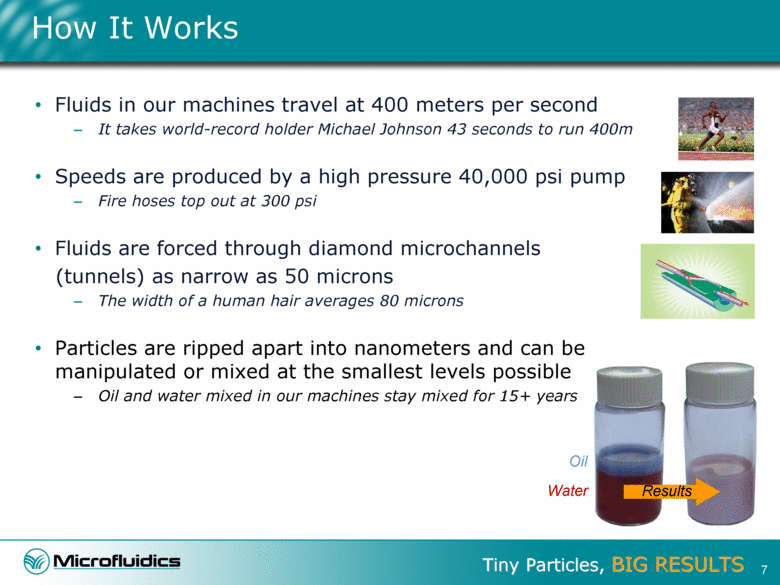
How It Works Fluids in our machines travel at 400 meters per second It takes world-record holder Michael Johnson 43 seconds to run 400m Speeds are produced by a high pressure 40,000 psi pump Fire hoses top out at 300 psi Fluids are forced through diamond microchannels (tunnels) as narrow as 50 microns The width of a human hair averages 80 microns Particles are ripped apart into nanometers and can be manipulated or mixed at the smallest levels possible Oil and water mixed in our machines stay mixed for 15+ years Oil Water Results 7 |
|
|
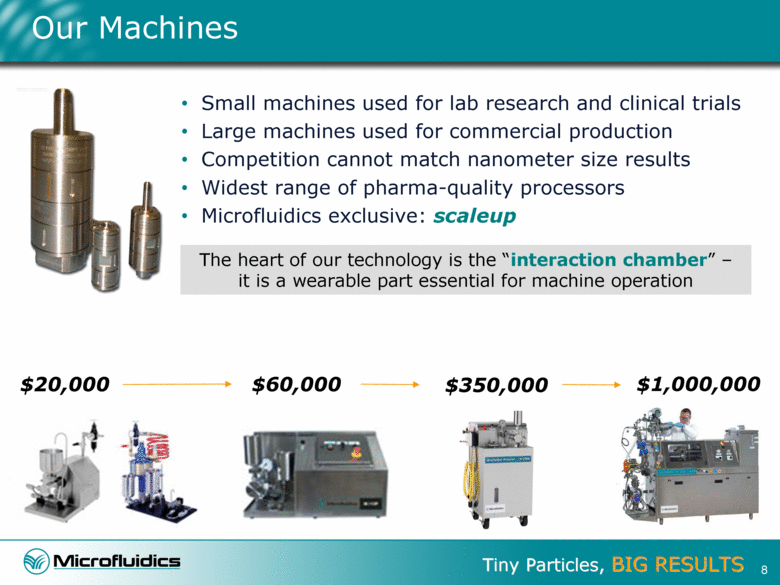
Our Machines Small machines used for lab research and clinical trials Large machines used for commercial production Competition cannot match nanometer size results Widest range of pharma-quality processors Microfluidics exclusive: scaleup The heart of our technology is the “interaction chamber” – it is a wearable part essential for machine operation $20,000 $1,000,000 $60,000 $350,000 8 |
|
|
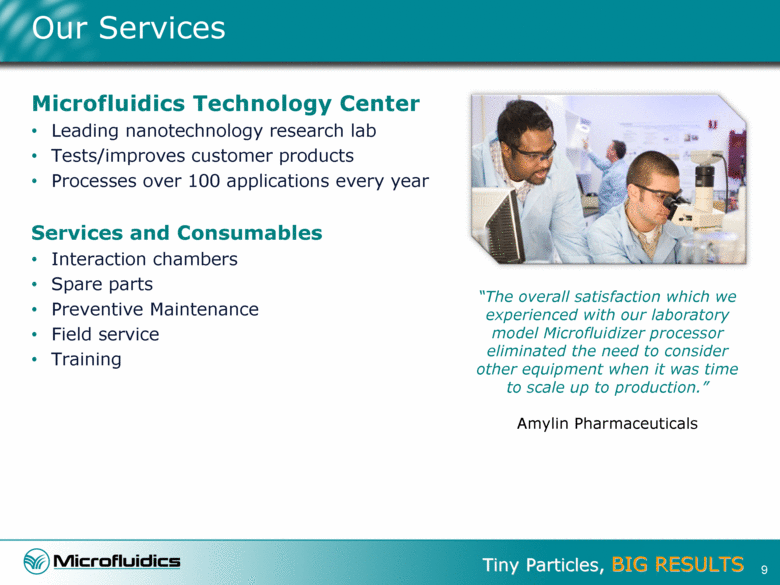
Our Services Microfluidics Technology Center Leading nanotechnology research lab Tests/improves customer products Processes over 100 applications every year Services and Consumables Interaction chambers Spare parts Preventive Maintenance Field service Training 9 “The overall satisfaction which we experienced with our laboratory model Microfluidizer processor eliminated the need to consider other equipment when it was time to scale up to production.” Amylin Pharmaceuticals |
|
|
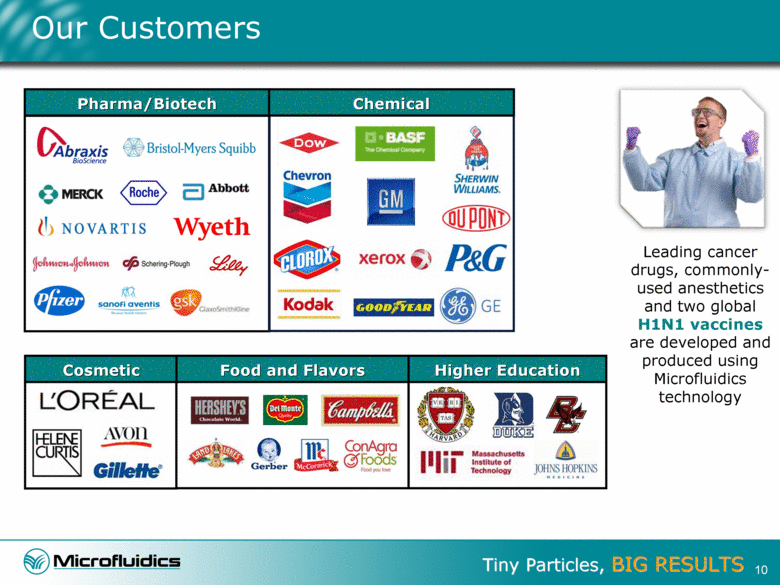
Our Customers 10 Leading cancer drugs, commonly-used anesthetics and two global H1N1 vaccines are developed and produced using Microfluidics technology Pharma/Biotech Chemical Cosmetic Food and Flavors Higher Education |
|
|
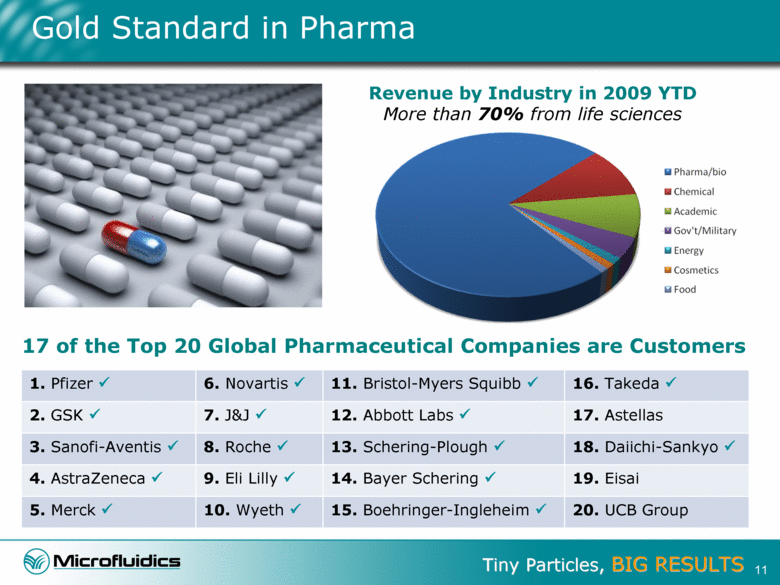
Gold Standard in Pharma Revenue by Industry in 2009 YTD More than 70% from life sciences 1. Pfizer 6. Novartis 11. Bristol-Myers Squibb 16. Takeda 2. GSK 7. J&J 12. Abbott Labs 17. Astellas 3. Sanofi-Aventis 8. Roche 13. Schering-Plough 18. Daiichi-Sankyo 4. AstraZeneca 9. Eli Lilly 14. Bayer Schering 19. Eisai 5. Merck 10. Wyeth 15. Boehringer-Ingleheim 20. UCB Group 17 of the Top 20 Global Pharmaceutical Companies are Customers 11 |
|
|
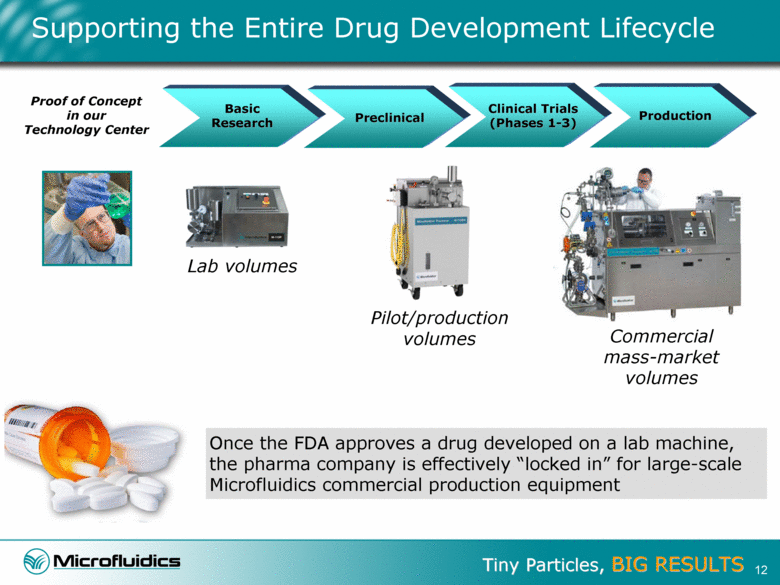
Supporting the Entire Drug Development Lifecycle Preclinical Basic Research Proof of Concept in our Technology Center Production Once the FDA approves a drug developed on a lab machine, the pharma company is effectively “locked in” for large-scale Microfluidics commercial production equipment Clinical Trials (Phases 1-3) Lab volumes Pilot/production volumes Commercial mass-market volumes 12 |
|
|
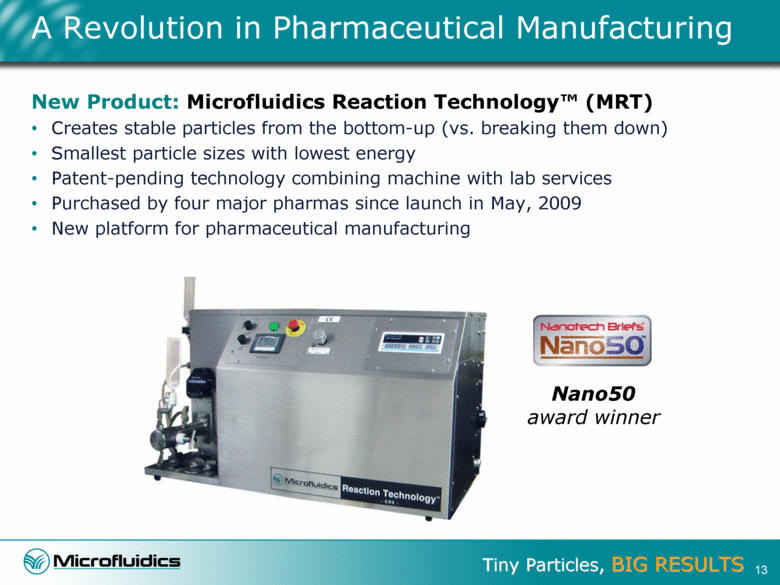
New Product: Microfluidics Reaction Technology™ (MRT) Creates stable particles from the bottom-up (vs. breaking them down) Smallest particle sizes with lowest energy Patent-pending technology combining machine with lab services Purchased by four major pharmas since launch in May, 2009 New platform for pharmaceutical manufacturing 13 A Revolution in Pharmaceutical Manufacturing Nano50 award winner |
|
|
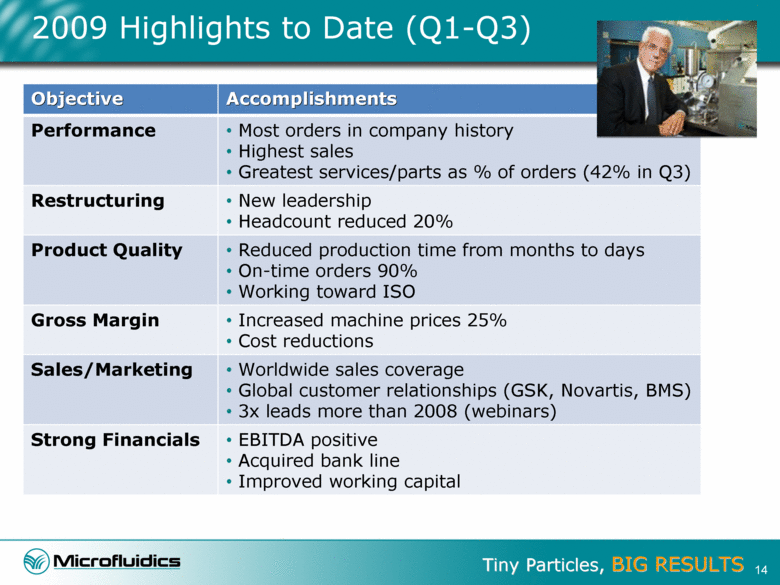
2009 Highlights to Date (Q1-Q3) Objective Accomplishments Performance Most orders in company history Highest sales Greatest services/parts as % of orders (42% in Q3) Restructuring New leadership Headcount reduced 20% Product Quality Reduced production time from months to days On-time orders 90% Working toward ISO Gross Margin Increased machine prices 25% Cost reductions Sales/Marketing Worldwide sales coverage Global customer relationships (GSK, Novartis, BMS) 3x leads more than 2008 (webinars) Strong Financials EBITDA positive Acquired bank line Improved working capital 14 |
|
|
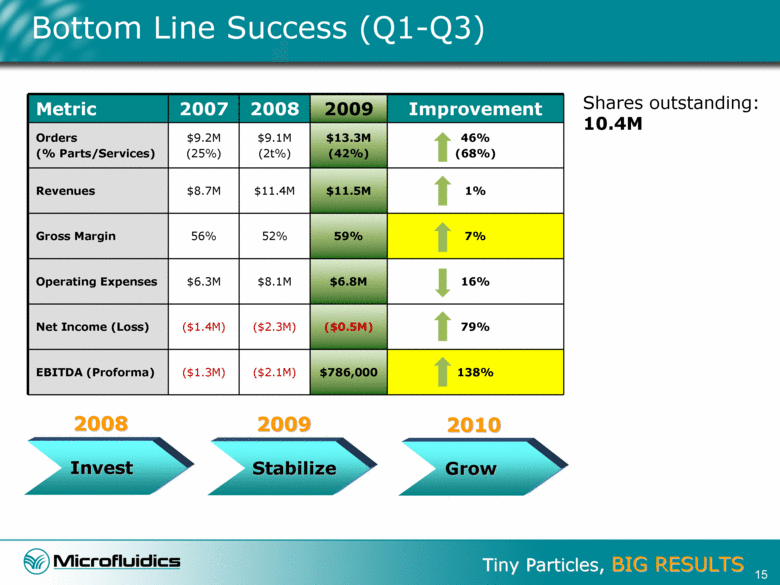
Bottom Line Success (Q1-Q3) Metric 2007 2008 2009 Improvement Orders (% Parts/Services) $9.2M (25%) $9.1M (2t%) $13.3M (42%) 46% (68%) Revenues $8.7M $11.4M $11.5M 1% Gross Margin 56% 52% 59% 7% Operating Expenses $6.3M $8.1M $6.8M 16% Net Income (Loss) ($1.4M) ($2.3M) ($0.5M) 79% EBITDA (Proforma) ($1.3M) ($2.1M) $786,000 138% Shares outstanding: 10.4M Invest Stabilize Grow 2009 2008 2010 15 |
|
|
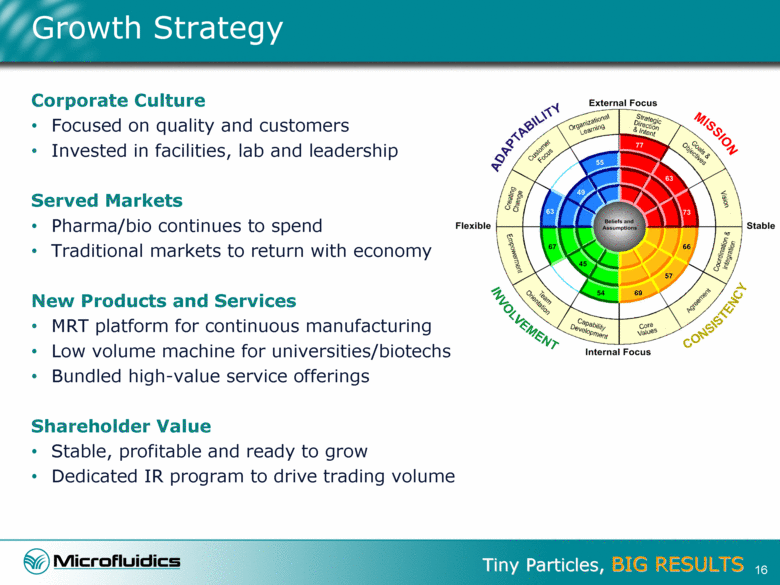
Corporate Culture Focused on quality and customers Invested in facilities, lab and leadership Served Markets Pharma/bio continues to spend Traditional markets to return with economy New Products and Services MRT platform for continuous manufacturing Low volume machine for universities/biotechs Bundled high-value service offerings Shareholder Value Stable, profitable and ready to grow Dedicated IR program to drive trading volume Growth Strategy 16 |
|
|
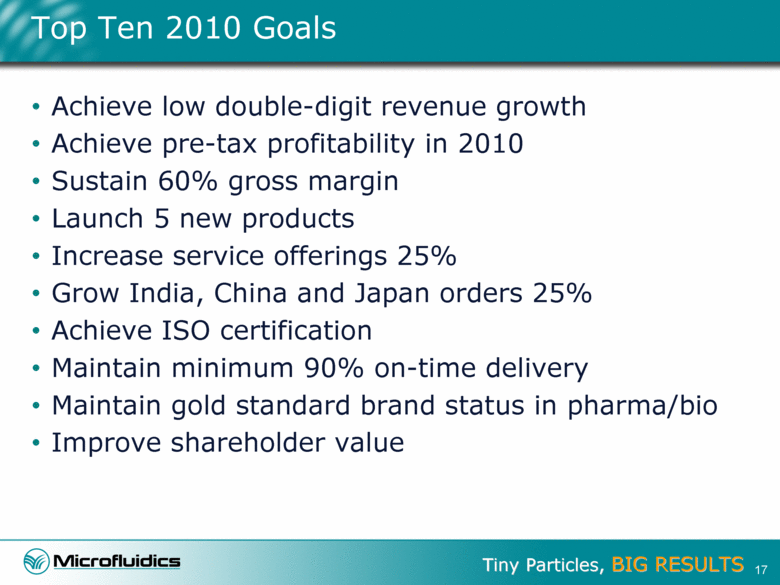
Achieve low double-digit revenue growth Achieve pre-tax profitability in 2010 Sustain 60% gross margin Launch 5 new products Increase service offerings 25% Grow India, China and Japan orders 25% Achieve ISO certification Maintain minimum 90% on-time delivery Maintain gold standard brand status in pharma/bio Improve shareholder value Top Ten 2010 Goals 17 |
|
|
Top 5 Reasons to Invest 18 1. Nanopharmaceuticals are a growing market; Microfluidics has a well-established foothold in this field 2. New products are being rapidly adopted with a solid pipeline engine behind them 3. Products and services are commanding higher value and raising gross margins 4. New leadership has built a culture focused on customers, quality and execution 5. Strong financials, EBITDA positive through Q3 2009 despite economy, and well positioned for sustained growth |
|
|
Thank You for Your Time Questions? OTCBB: MFLU www.microfluidicscorp.com 19 |

