Attached files
| file | filename |
|---|---|
| 8-K - FORM 8-K - JOHNSON CONTROLS INC | c55778e8vk.htm |
| EX-99.1 - EX-99.1 - JOHNSON CONTROLS INC | c55778exv99w1.htm |
Exhibit 99.2

| Quarterly update FY 2010 first quarter January 22, 2010 Exhibit 99.2 |

| Agenda Introduction Glen Ponczak, Executive Director, Investor Relations Overview Steve Roell, Chairman and Chief Executive Officer Business results and financial review Bruce McDonald, Executive Vice President and Chief Financial Officer Q&A FORWARD-LOOKING STATEMENT Johnson Controls, Inc. ("the Company") has made forward-looking statements in this presentation pertaining to its financial results for fiscal 2010 and beyond that are based on preliminary data and are subject to risks and uncertainties. All statements other than statements of historical fact are statements that are or could be deemed forward-looking statements and included terms such as "outlook," "expectations," "estimates," or "forecasts." For those statements, the Company cautions that numerous important factors, such as automotive vehicle production levels, mix and schedules, financial distress of key customers, energy prices, the strength of the U.S. or other economies, currency exchange rates, cancellation of or changes to commercial contracts, liquidity, changes in the levels or timing of investments in commercial buildings, the ability to execute on restructuring actions according to anticipated timelines and costs as well as other factors discussed in the Company's Form 8k (filed March 9, 2009) could affect the Company's actual results and could cause its actual consolidated results to differ materially from those expressed in any forward-looking statement made by, or on behalf of, the Company. 2 |

| First quarter 2010 Diversified business portfolio a key contributor to record earnings Record Q1 segment income and net income driven by double-digit revenue growth Market improvements Share gains Converting well on the higher automotive volumes Benefitting from cost reduction initiatives taken over the past year 3 |
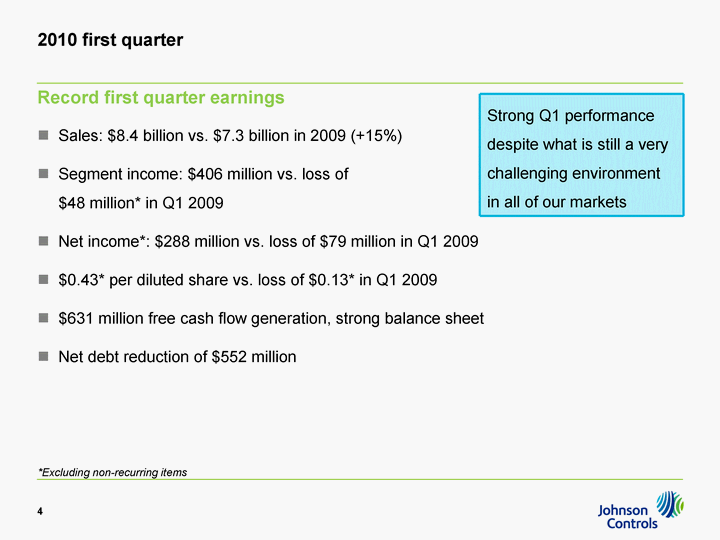
| 2010 first quarter Record first quarter earnings Sales: $8.4 billion vs. $7.3 billion in 2009 (+15%) Segment income: $406 million vs. loss of $48 million* in Q1 2009 Net income*: $288 million vs. loss of $79 million in Q1 2009 $0.43* per diluted share vs. loss of $0.13* in Q1 2009 $631 million free cash flow generation, strong balance sheet Net debt reduction of $552 million 4 Strong Q1 performance despite what is still a very challenging environment in all of our markets *Excluding non-recurring items |

| First quarter 2010 Our markets Automotive Experience Auto production in both North America and Europe stronger than earlier expectations North America production benefitted from dealer inventory replenishment 53 days on hand at 12/31/09 vs. 93 days a year ago Stable European production Decline expected later in 2010 as government stimulus programs end Exceptionally strong growth in China 5 5 |

| First quarter 2010 Our markets Power Solutions Higher overall demand for automotive batteries Aftermarket stocking returning to traditional levels Stronger global OE demand Continuing market share shifts 6 6 |

| First quarter 2010 Our markets Building Efficiency Continued challenges in late-cycle non-residential buildings market Education buildings market demand strong despite slow ARRA (stimulus) funding Strong government buildings market demand Healthcare market demand lower than expected Mixed international markets Lower demand in Western Europe Continued opportunities in Middle East (excluding Dubai), Latin America, China Improvements in residential HVAC market demand 7 7 In aggregate, Building Efficiency markets appear to have reached the bottom of the cycle |

| 2010 Outlook Cautiously optimistic regarding auto production in 2H 2010 Uncertainties around consumer demand Strong growth in China expected to continue Improved profitability in Power Solutions due to increased volume Building Efficiency performance in line with previous expectations Y/Y sales growth expected later in 2010 Stable pipeline of energy solutions projects Momentum in some emerging markets 8 Updated automotive production assumptions North America: 10.3M Increasing full-year 2010 EPS guidance October 2009: fully diluted EPS: $1.35 - $1.45 January 2010: fully diluted EPS: $1.70 - $1.75 |

| Business segment results |

| 2010 first quarter Automotive Experience 2010 2009 Net sales $4.1B $3.1B 31% Sales up 24% adjusted for currency North America: up 14% Europe: up 47% (35% excluding currency) China sales (including unconsolidated): $745M, up 112% Segment income $121M ($219M) Excellent conversion on the higher volume Benefits of cost reduction initiatives Significantly higher equity income in China Launch difficulties, distressed supplier costs in Europe 10 Return on sales by geography N. America: 5.4% Europe 0.5% Asia 6.1% |

| 2010 first quarter Building Efficiency 2010 2009 Net sales $3.0B $3.1B -2% Sales down 8% adjusted for currency Some segments starting to improve Global Workplace Solutions, performance contracting, North America residential HVAC up double-digits Revenue declines concentrated in Latin America and Europe Segment income $104M $131M -21% Impact of lower volumes Information technology implementation costs Increased investments in growth initiatives Residential margin expansion 11 Commercial backlog (December 31, 2009) $4.3B, down 8% Double-digit increase in energy solutions Commercial orders Down slightly Double-digit increases in energy solutions and Asia N.A. Systems down 2% Softness in Europe and Middle East |

| 2010 first quarter Power Solutions 2010 2009 Net sales $1.3B $1.1B 15% Unit volumes up 12% Lead impact on sales not significant Aftermarket unit volume up 9% OE unit volume up 19% Segment income $181M $40M Higher volumes Operational improvements $50 million non-recurring lead inventory charge in 2009 quarter 12 |

| Financial review 13 |

| First quarter 2010 Financial highlights (in millions) 2010 (reported) 2009* (excluding items) 2009 (reported) %change Sales $8,408 $7,336 $7,336 15% Gross profit % of sales 1,236 14.7% 795 10.8% 685 9.3% 55% SG&A expenses 883 859 859 3% Equity income 53 16 (136) N/M Segment income $ $406 ($48) ($310) Segment income % 4.8% (0.7%) 14 FX - Euro to U.S. dollar average exchange rate at $1.48 in Q1 2010 vs. $1.32 in 2009 Gross profit - Restructuring initiatives and better capacity utilization Equity income - Significant improvement in Automotive JVs in China and North America *Excludes impairment charges |

| First quarter 2010 Financial highlights (in millions, except earnings per share) 2010* (excluding items) 2009* (excluding items) 2010 (reported) 2009 (reported) Segment income $406 ($48) $406 ($310) Financing charges - net (35) (56) (35) (56) Income before taxes 371 (104) 371 (366) Income tax provision / (benefit) 67 (25) 5 242 Net income / (loss) 304 (79) $366 (608) Income attributable to non-controlling interests 16 - 16 - Net income / (loss) attributable to JCI $288 ($79) $350 ($608) Diluted earnings / (loss) per share $0.43 ($0.13) $0.52 ($1.02) 15 Financing charges-net - Lower debt levels, short term rates, FX benefit Income tax provisions - Underlying 2010 tax rate of 18% Non-controlling interests- Return to profitability in consolidated Automotive NA JV's *Excludes impairment charges and non-recurring tax items in 2009; excludes non-recurring tax items in 2010. |

| Balance sheet Strong liquidity position Net borrowings $2.7 billion, $552M debt reduction in the quarter Liquidity cushion in excess of $3.2B Cash flow positive Q1 net cash flow - operating and investing activities--$623 million vs. ($674 million) in 2009 Strong Q1 working capital performance ($307 million source of cash in the quarter) Net debt to capitalization 22% vs 26% last quarter and 35% in 2009 Q1 16 |

| Revised fiscal 2010 outlook October guidance January revisions Consolidated net sales $31 B (up 9%) $33B (up 16%) Higher NA vehicle production Increased PS aftermarket volume and impact of higher lead BE sales increased to +5% EPS $1.35 - $1.48 $1.70 - $1.75 Profitable conversion of incremental revenue growth Continued focus on cost base Tax rate reduced to 18% Segment margins Up 250 bpts Up 290 bpts AE: increased to 2.0% - 2.2% PS: increased to 11.8% - 12.0% BE: unchanged at 5.6% - 5.8% Net financing charges $200M - $210M $175M - $185M Lower short term interest rates, stronger free cash flow Capital expenditures $625M - $675M $700 - $750 Accelerating investments in Power Solutions Net debt to capitalization Below 20% Below 20% $1.2 billion in free cash flow generation 17 |