Attached files
| file | filename |
|---|---|
| 8-K - FORM 8-K - SENSUS USA INC | d8k.htm |
 Presentation to the Resolute Fund January 21, 2010 Exhibit 99.1 |
 2 • Peter Mainz - CEO and President |
 3 Agenda Business Overview Financial Overview |
 4 Safe Harbor Statement The statements made during this presentation, other than historical facts, are made in
reliance on the safe-harbor provisions of the Private Securities
Litigation Reform Act of 1995. These statements involve risks and
uncertainties and are subject to change at any time. These statements
reflect the Company’s current expectations regarding its financial position, revenues, cash flow and other operating results, business strategy, financing plans, forecasted
trends related to the markets in which the Company operates, legal
proceedings and similar matters. We cannot assure you that the expectations
expressed or implied in these forward-looking statements will turn out
to be accurate. Our actual results could be materially different from our operations because of various risks. These risks include our susceptibility to
macroeconomic downturns in the United States and abroad, conditions in the
residential, commercial and industrial construction markets and in the
automotive industry, our dependence on new product development and
intellectual property, and our dependence on independent distributors and third-party contract manufacturers, automotive vehicle production levels and
schedules, our substantial financial leverage, debt service and other cash
requirements, liquidity constraints and risks related to future growth and
expansion. Other important risk factors that could cause actual events or
results to differ from those contained or implied in the forward-looking statements include, without limitation, our ability to integrate acquired companies, general economic and business conditions, competition, adverse changes in the regulatory or
legislative environment in which we operate, customer cancellations and
other factors beyond the Company’s control. We encourage you to review
our annual report on Form 10-K which discusses in great detail our
results of operations for the most recently completed fiscal year
and consider the risks that relate to any of our forward-looking
statements. |
 Technology Advanced technology and communications for data collection and metering Experience More than a century of experience providing service and support to the utility
industry Global Reliable Global footprint on five continents with operations and activities in many countries
Reliable partner for utilities’ critical data collection and metering infrastructure solutions 5 Provides superior technologies and services to measure, manage and control distributed resources. |
 Company
Overview Over a century of providing cutting-edge infrastructure systems,
metering technologies and related communications to the worldwide
utility industry Strategy focused on growth through technology A leader in building the Smart Grid with over 4 million SmartPoints deployed to date in the U.S. A leading global water meter supplier Record $806 million in Adjusted Net Sales* in FY2009 Solid business model with a track record of strong Adjusted EBITDA and cash generation and growth Privately held with publicly traded bonds (SEC registrant) Headquarters in Raleigh, N.C. 6 * Represents fiscal year ended March 31, 2009 and includes $135.4 million of
customer billings required to be deferred under ASC 985-605 (formerly SOP
97-2). See Appendix: Non-GAAP Measures. |
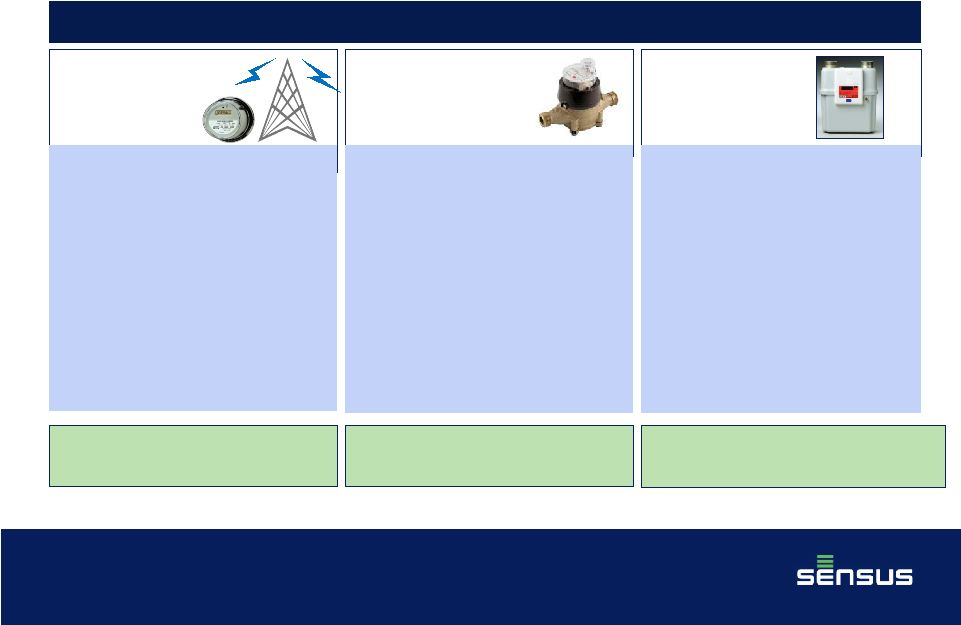 Sensus Business Focus 7 Utility Infrastructure Systems Conservation Solutions Water & Heat Gas • Advanced communications technologies (FlexNet ) • Electric meters • Fixed two-way RF network • Electric, Water & Gas • Activities focused in N.A. • A leader in developing the Smart Grid and entering Distribution Automation and Demand Response • Water & Heat meters for residential & commercial uses • Strong presence in N.A. and Europe with activities in Africa, S.A., and Asia. • Gas meters and pressure regulators for residential, industrial, commercial and transmission uses • Focused in N.A. with presence in Asia and Europe A leading market position in North America A leading market position in North America A leading global market position TM |
 Global
Reach: Adjusted Net Sales by Geography Over 40 facilities on five continents
and nearly 4,000 people Text 8 $542 million* $12 million $17 million $193 million $29 million * Represents Fiscal Year Ended March 31, 2009 and includes $135.4 million of
customer billings required to be deferred under ASC 985-605 (formerly SOP
97-2). See Appendix: Non-GAAP Measures. $13 million |
 9 Global Water Market Position Source: IMS Research Report 2008; management estimates Global Water Market $2.3 billion annually 16% 22% U.S & Canada $0.6 billion annually Europe, Middle East & Africa $0.9 billion annually 25% 2% Asia & S. America $0.8 billion annually Sensus market share based on revenue |
 N.A.
AMR/Smart Metering Market 2008 market over $1 billion Market shifting from AMR to AMI and smart metering Only 142 million or 46% of the estimated 305 million installed meters have been converted to automated metering Early AMR installations must be replaced to make them AMI/Smart Grid compatible 10 (in millions) Source: The Scott AMR Report: AMR Deployments in North America, 1 st Quarter 2009; management estimates |
 Sensus SmartPoint Deployments 11 Dramatic growth in electric Sensus Smart Grid deployments Electric growth driven by 2-way Smart Grid deployments, not basic AMR Electric market share increased from 4% to 19% in two years Water market transitioning from basic AMR to 2-way smart metering Water market share stable as utilities transition to 2-way smart metering
Source: The Scott Report: AMR Deployments in North America
|
 12 • One-way communications • Automated monthly meter reads • Two-way communications • Frequent meter reads enable time-of-use billing • Utilities able to “talk” to the meters and control other devices • Two-way umbrella communications across transmission and distribution • Enables intelligent control by utilities and the consumers • Provides ability for infrastructure to react in unison to changing market and demand needs Evolution of the Smart Grid |
 Evolution Drivers Utility business economics – Reduced operating cost and customer service – Efficiency improvements and better asset utilization – Offset/reduce capital needs for new generation Global conservation and environmental initiatives – Scarcity of water and energy resources … a global reality – Reduced carbon footprint … electric vehicles – Consumer choice … home area networked devices ARRA stimulus will accelerate growth & interest in Smart Grid – Allocated $4.5 billion for Smart Grid projects – Allocated $6.0 billion for water infrastructure projects – Utilities are accelerating evaluation of projects – Enhanced focus on standards and security 13 |
 Distributed
Generation Distributed Generation (Wind/Solar/Other) Sensus Enables the Promise of the Smart Grid 14 Home Energy Gateways Backend Backend Endpoints Layer Control & Management Layer Performance and Supervisory Layer PCT / LOAD ZigBee Chip PCT / LOAD U-SNAP Card Redundant RNI U-SNAP Card TGB Gas Endpoints Gas Endpoints Billing Systems Network Performance Load Management Gas Water Electric Data Backhaul Distribution Automation and Asset Management via Telemetric (acquired in July 2009) TGB |
 Sensus
Advantages The Sensus solution is simple, reliable, secure – Minimum infrastructure – Licensed radio spectrum – Standards compliant – Upgradeable in place with over-the-air programmable radios The Sensus solution is field proven … at scale – Over 4 million endpoints installed & reporting over the last 3 years – Over 1 million endpoints for Southern Company – Over 200 individual projects electric, water, gas & combination Sensus is well positioned – Long history of serving utilities – Proven business model – Published financial results 15 |
 Utilities Selecting Sensus 16 Utilities Customers Served AMI Endpoints Duration 4.3 million 4.3 million Electric 15 years 1.4 million 1.0 million Electric 0.4 million Gas 15 years 3.0 million 0.3 million Gas 20 years 0.9 million 0.9 million Electric 12 years 2.4 million 1.3 million Electric 0.2 million Gas 20 years London Hydro Smart Grid Consortium Ontario,
Canada (representing 35 utilities) 1.8 million 1.2 million Electric 15 years |
 Building the Smart Grid…Today 200 Smart Grid projects completed or in-process 37 States 2 Canadian Provinces 2 European countries Over 4 million SmartPoints installed Over 10 million SmartPoints when all current projects complete 17 |
 18 Agenda Business Overview Financial Overview |
 19 Evolution of Adjusted Net Sales Fiscal Year 2004 Adjusted Net Sales $529 million LTM September 2009 Adjusted Net Sales $796 million* * Includes $188 million of customer billings required to be deferred under ASC
985-605 (formerly SOP 97-2). See Appendix: Non-GAAP
Measures. Conservation Solutions Adjusted Net Sales 11%; $59 million Conservation Solutions Adjusted Net Sales 36%; $288 million* up 388% Water Metering 60% Clamps & Couplings 10% Gas Metering 12% Precision Die Casting 7% Gas Metering 7% Precision Die Casting 7% Clamps & Couplings 8% Water Metering 42% |
 20 Fiscal Year Financial Highlights * See Appendix: Non-GAAP Measures. |
 21 $92 $97 $96 $93 $112 $109 16% 16% 15% 13% 14% 0% 5% 10% 15% 20% 25% $0 $20 $40 $60 $80 $100 $120 FY 2005 FY 2006 FY 2007 FY 2008 FY 2009 LTM 9/09 $570 $614 $633 $726 $806 $796 $0 $100 $200 $300 $400 $500 $600 $700 $800 $900 FY 2005 FY 2006 FY 2007 FY 2008 FY 2009 LTM 9/09 Adjusted Net Sales and Adjusted EBITDA 21 Adjusted Net Sales* (1) Net cash provided by operating activities as reported in the Company’s SEC filings. FY 2009 Adjusted EBITDA margin performance reflects significant upfront investments made in AMI business since FY 2007 For each fiscal quarter in FY 2009, Sensus posted Adjusted EBITDA growth compared to the prior year quarter Five consecutive years of increasing top-line growth FY 2008 and 2009 growth fueled by Conservation Solutions ($ in millions) Adjusted EBITDA* Operating Cash Flow (1) Record cash flow in FY 2009 Invested $27 million in capex and $9 million in software development Term debt prepayments include: $23 million in FY 2008 $16 million in FY 2009 ~$38 million of cash on hand at 3/31/09 ($ in millions) ($ in millions) $34 $47 $29 $51 $61 $60 $0 $10 $20 $30 $40 $50 $60 $70 FY 2005 FY 2006 FY 2007 FY 2008 FY 2009 LTM 9/09 (Fiscal year ended March 31) * See Non-GAAP Measures. |
 Credit
Structure and Acquisitions Sensus successfully amended and extended its existing credit structure on July 23, 2009 – Extended maturity of approximately $131 million of term loans to June 2013; – Added $35 million in new tranche term loans; – Extended maturity date of $70 million of revolving credit loan capacity to December 2012; – Increased U.S. letter of credit availability from $20 million to $50 million; – Modified certain financial covenants to improve financial flexibility. Recent significant acquisitions – Telemetric, Inc. – Acquired this Distribution Automation business located in Boise, Idaho in July 2009 for approximately $8 million in cash over the first
year and additional future consideration payable through June 2013; – Rongtai – Acquired the 40% minority interest of this aluminum die casting operation located in China in September 2009 for total consideration of approximately $15.8 million payable through September 2011. 22 |
 23 Financial Position * Includes customer billings less incremental direct costs required to be deferred
under ASC 985-605 (formerly SOP 97-2). See Appendix: Non-GAAP Measures. ($ in millions) Fiscal Year End March 2008 Fiscal Year End March 2009 LTM Sept 2009 FYE % of Capitalization Cash $ 38 $ 38 $ 34 Short-term loans $ 6 $ 5 $ 5 1% Term loans $174 $159 $194 27% Sr. Subordinated Notes $275 $275 $275 37% Total Debt $455 $439 $474 65% Paid-in Capital $243 $245 $254 35% Total Book Capitalization $698 $684 $728 100% Adjusted EBITDA* $ 93 $112 $109 Adjusted EBITDA/Interest expense, net 2.4x 3.1x 3.0x Adjusted EBITDA – CAPEX/Interest Expense, net 1.7x 2.1x 2.1x Net Debt/Adjusted EBITDA 4.5x 3.6x 3.9x |
 24 Sensus is “Smart Grid-Ready” Today Financially strong provider of time-tested technology and communications to global water, gas and electric utilities No matter what the alternative energy source is, it must be measured, managed and controlled Water conservation driven by increasing scarcity “Future-proof,” flexible and proven Smart Grid solutions Cover all types of utilities, population densities and terrain Over 4 million Sensus SmartPoints installed to date Our Goal: Sensus in every home and business |
 Thank You For more information visit: www.sensus.com |
 26 Appendix: Non-GAAP Measures To enhance the comparability and usefulness of its financial information, the
Company provides certain non-GAAP measures to describe more fully the results
of its underlying business. Specifically, the Company utilizes the measures
of Adjusted Net Sales, Adjusted EBITDA and Adjusted Gross Profit, which are
defined as follows: Adjusted Net Sales is defined as net sales as determined under U.S. GAAP adjusted to add back customer billings (net of amortization) related to multi-element contracts
that have been deferred under the provisions of Accounting Standards
Codification Topic 985- 605, Software – Revenue Recognition (“ASC 985-605”), formerly SOP 97-2. Adjusted EBITDA is defined as consolidated earnings before interest expense, depreciation and amortization, and income taxes plus (a) customer billings less the
associated incremental direct costs (both net of amortization) related to
multi-element contracts that have been deferred under ASC 985-605,
(b) restructuring costs, (c) management fees and (d)
acquisition-related costs, and adjusted for other nonrecurring items. Adjusted Gross Profit is defined as gross profit as determined under U.S. GAAP adjusted to add back customer billings less the associated incremental direct costs (both net of
amortization) related to multi-element contracts that have been
deferred under ASC 985- 605 plus acquisition-related costs, and
adjusted for other nonrecurring items. Refer to the Company’s press
release on Form 8-K dated October 28, 2009 for further discussion of
non-GAAP measures. |
 Appendix: Non-GAAP Measures 27 A reconciliation of each of these Non-GAAP measures to its closely related
U.S. GAAP measure follows: LTM FY FY FY FY FY Ended Ended Ended Ended Ended Ended ($ in millions) 9/30/2009 3/31/2009 3/31/2008 3/31/2007 3/31/2006 3/31/2005 Net sales $ 607.7 $ 670.7 $ 694.2 $ 632.9 $ 613.9 $ 569.8 Customer billings from multi-element contracts deferred under ASC 985-605 (net of amortization) 188.2 135.4 31.4 - - - Adjusted Net Sales $ 795.9 $ 806.1 $ 725.6 $ 632.9 $ 613.9 $ 569.8 Gross profit $ 122.9 $ 147.3 $ 183.9 $ 179.1 $ 186.4 $ 170.8 Customer billings less incremental direct costs from multi- element contracts deferred under ASC 985-605 (net of amortization) 85.3 62.4 5.1 - - - Accelerated amortization of software development costs 3.4 3.4 - - - - Other non-recurring items 3.3 3.3 - - - - Adjusted Gross Profit $ 214.9 $ 216.4 $ 189.0 $ 179.1 $ 186.4 $ 170.8 Net loss $ (73.3) $ (47.5) $ (8.2) $ (7.5) $ (3.2) $ (4.9) Depreciation and amortization 46.4 46.6 47.7 48.1 42.4 39.8 Interest expense, net 40.8 39.9 41.8 42.4 39.3 36.7 Income tax (benefit) provision (36.0) (19.9) (2.6) 1.0 8.2 8.3 Customer billings less incremental direct costs from multi- element contracts deferred under ASC 985-605 (net of amortization) 85.3 62.4 5.1 - - - Restructuring costs 17.6 9.9 7.0 8.5 7.2 8.1 Management fees 3.3 3.1 2.6 2.6 2.3 2.1 Acquisition-related costs 0.9 - - - - - Loss on debt extinguishment 5.9 - - - - - Other non-recurring items 3.5 3.3 - 0.8 1.1 0.9 Goodwill impairment 14.4 14.4 - - - - (Gain) loss from discontinued operations - - - (0.1) - 0.8 Adjusted EBITDA (excluding discontinued operations) $ 108.8 $ 112.2 $ 93.4 $ 95.8 $ 97.3 $ 91.8 |