Attached files
| file | filename |
|---|---|
| 8-K - 8-K - CubeSmart | a10-2147_18k.htm |
Exhibit 99.1
|
|
2009 Capital-Raising Review January 20, 2010 |
|
|
2 Forward Looking Statements The forward-looking statements contained in this presentation are subject to various risks and uncertainties. Although the Company believes the expectations reflected in such forward-looking statements are based on reasonable assumptions, there can be no assurance that its expectations will be achieved. You should not rely on our forward-looking statements because the matters they describe are subject to known and unknown risks and uncertainties that could cause the Company's future results, performance, or achievements to differ significantly from the results, performance, or achievements expressed or implied by such statements. Such risks are set forth under the captions “Item 1A. Risk Factors” and “Forward-Looking Statements” in our annual report on Form 10-K and under the caption “Item 2. Management's Discussion and Analysis of Financial Condition and Results of Operations” (or similar captions) in our quarterly reports on Form 10-Q, and described from time to time in the Company's filings with the SEC. Forward-looking statements are not guarantees of performance. For forward-looking statements herein, the Company claims the protection of the safe harbor for forward-looking statements contained in the Private Securities Litigation Reform Act of 1995. The Company assumes no obligation to update or supplement forward-looking statements that become untrue because of subsequent events. |
|
|
3 Capital-Raising Initiatives: 2009 Activity o Capital raising efforts in 2009 combined to raise over $875 million to address maturities, reduce leverage, and position the company for future growth o Net debt to gross assets improved from approximately 51% as of December 31, 2008 to approximately 36% as of December 31, 2009 Asset sales $88.9 million Common share issuances $171 million Joint venture $51 million Small mortgages / Regional banks $116.1 million New line of credit, $450 million |
|
|
4 New $450 Million Secured Credit Facility • Senior secured credit facility $200 million secured term loan $250 million secured revolving credit facility • Three-year term • Secured by mortgages on borrowing base properties • Use of proceeds: Replace existing unsecured credit facility General corporate purposes • Closed in December 2009 • Financial covenants: 65% maximum leverage ratio (67.5% in first year) 1.45x minimum fixed charge coverage ratio Minimum tangible net worth Limitations on distributions Limitations on certain permitted investments Limitations on the amount of floating rate debt • Pricing: Range from 3.25% to 4.0% over LIBOR, depending on leverage levels LIBOR floor of 1.5% Unused fee of 0.5% |
|
|
5 Asset Level Loans / Regional Banks • Our focused effort generated $116.1 million of asset level loans from regional banks and life companies • Loans were from 17 different lenders and encumbered 45 properties • Average terms: 64% loan-to-value 7.01% interest rate 7.73% effective rate (including amortization of loan procurement costs) 6.6 year maturity |
|
|
6 2009 Ended with an Improved Debt Maturity Profile DEBT OVERVIEW (as of December 31, 2009) (unaudited, in thousands) Unsecured and Secured Debt Weighted Floating and Fixed Weighted Average Average Maturity Maturity Debt Amount Rate(1) (in years) Debt Amount Rate(1) (in years) Unsecured - $ - - Floating 203,865 $ 4.99% 3.0 Secured 769,054 5.55% 3.1 Fixed 565,189 5.75% 3.1 Total 769,054 $ 5.55% 3.1 Total 769,054 $ 5.55% 3.1 (1) Weighted average interest rate Debt Maturities $106,854 $86,307 $361,235 $23,586 $84,377 $106,464 $0 $50,000 $100,000 $150,000 $200,000 $250,000 $300,000 $350,000 $400,000 2010 2011 2012 2013 2014 Thereafter Floating 27% Secured 100% Fixed 73% |
|
|
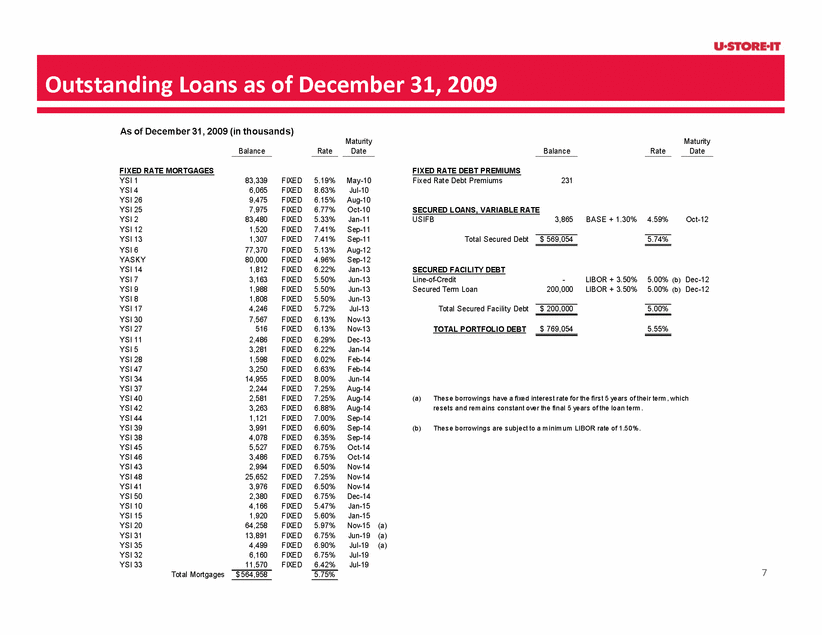
7 Outstanding Loans as of December 31, 2009 As of December 31, 2009 (in thousands) Maturity Maturity Balance Rate Date Balance Rate Date FIXED RATE MORTGAGES FIXED RATE DEBT PREMIUMS YSI 1 83,339 FIXED 5.19% May-10 Fixed Rate Debt Premiums 231 YSI 4 6,065 FIXED 8.63% Jul-10 YSI 26 9,475 FIXED 6.15% Aug-10 YSI 25 7,975 FIXED 6.77% Oct-10 SECURED LOANS, VARIABLE RATE YSI 2 83,480 FIXED 5.33% Jan-11 USIFB 3,865 BASE + 1.30% 4.59% Oct-12 YSI 12 1,520 FIXED 7.41% Sep-11 YSI 13 1,307 FIXED 7.41% Sep-11 Total Secured Debt 569,054 $ 5.74% YSI 6 77,370 FIXED 5.13% Aug-12 YASKY 80,000 FIXED 4.96% Sep-12 YSI 14 1,812 FIXED 6.22% Jan-13 SECURED FACILITY DEBT YSI 7 3,163 FIXED 5.50% Jun-13 Line-of-Credit - LIBOR + 3.50% 5.00% (b) Dec-12 YSI 9 1,988 FIXED 5.50% Jun-13 Secured Term Loan 200,000 LIBOR + 3.50% 5.00% (b) Dec-12 YSI 8 1,808 FIXED 5.50% Jun-13 YSI 17 4,246 FIXED 5.72% Jul-13 Total Secured Facility Debt 200,000 $ 5.00% YSI 30 7,567 FIXED 6.13% Nov-13 YSI 27 516 FIXED 6.13% Nov-13 TOTAL PORTFOLIO DEBT 769,054 $ 5.55% YSI 11 2,486 FIXED 6.29% Dec-13 YSI 5 3,281 FIXED 6.22% Jan-14 YSI 28 1,598 FIXED 6.02% Feb-14 YSI 47 3,250 FIXED 6.63% Feb-14 YSI 34 14,955 FIXED 8.00% Jun-14 YSI 37 2,244 FIXED 7.25% Aug-14 YSI 40 2,581 FIXED 7.25% Aug-14 (a) YSI 42 3,263 FIXED 6.88% Aug-14 YSI 44 1,121 FIXED 7.00% Sep-14 YSI 39 3,991 FIXED 6.60% Sep-14 (b) These borrowings are subject to a minimum LIBOR rate of 1.50%. YSI 38 4,078 FIXED 6.35% Sep-14 YSI 45 5,527 FIXED 6.75% Oct-14 YSI 46 3,486 FIXED 6.75% Oct-14 YSI 43 2,994 FIXED 6.50% Nov-14 YSI 48 25,652 FIXED 7.25% Nov-14 YSI 41 3,976 FIXED 6.50% Nov-14 YSI 50 2,380 FIXED 6.75% Dec-14 YSI 10 4,166 FIXED 5.47% Jan-15 YSI 15 1,920 FIXED 5.60% Jan-15 YSI 20 64,258 FIXED 5.97% Nov-15 (a) YSI 31 13,891 FIXED 6.75% Jun-19 (a) YSI 35 4,499 FIXED 6.90% Jul-19 (a) YSI 32 6,160 FIXED 6.75% Jul-19 YSI 33 11,570 FIXED 6.42% Jul-19 Total Mortgages 564,958 $ 5.75% These borrowings have a fixed interest rate for the first 5 years of their term, which resets and remains constant over the final 5 years of the loan term. |
|
|
8 Pro Forma Interest Expense March 31, June 30, September 30, December 31, March 31, June 30, September 30, December 31, 2009 2009 2009 2009 2010 2010 2010 2010 Interest: Interest expense on loans 11,353 $ 11,473 $ 12,008 $ 10,435 $ 10,878 $ 10,250 $ 9,829 $ 9,540 $ Loan procurement amortization expense 483 545 489 822 1,430 1,401 1,343 1,338 Total interest expense 11,836 $ 12,018 $ 12,497 $ 11,257 $ 12,308 $ 11,651 $ 11,172 $ 10,878 $ Notes: - All amounts are in thousands and unaudited. - Estimates assume 2010 maturities are satisfied at their respective maturity dates with available cash and do not reflect any assumptions for speculative acquisitions, dispositions or additional capital-raising in 2010. - Borrowings under the $200 million secured term loan have an assumed interest rate of 5.0%. This assumes a spread over LIBOR of 3.5% (the spread can range from 3.25% to 4.0% depending on leverage levels) and assumes LIBOR of 1.5% (the facility requires a minimum LIBOR rate, or floor, of 1.5%). - There are no borrowings assumed in 2010 under the $250 million secured revolving line of credit. Accordingly, interest expense above includes costs associated with the 0.5% unused fee applied to the entire $250 million amount during 2010. Three Months Ended Actual Estimated |
|
|
9 Joint Venture • Closed on a $102 million joint venture with an affiliate of Heitman, LLC in August 2009 • Proceeds to the Company of $51 million for a 50% interest in the unleveraged joint venture • U-Store-It Contributed 22 wholly-owned properties located in eight states The Company’s interest in the venture is subordinate to its partner’s 9% current return and 12% return upon a capital event Continues day-to-day operation of properties Receives market rate management fee |
|
|
10 Property Dispositions • Closed on the disposition of 19 properties totaling 1.2 million square feet during 2009 • The properties had an aggregate sale price of $88.9 million and gains on the sales totaled approximately $14.1 million • Cap rates for the sold properties averaged 8.26% on trailing 12 month net operating income (less management fee and cap-ex) • Aggregate sales price on sales represents $76 per square foot |
|
|
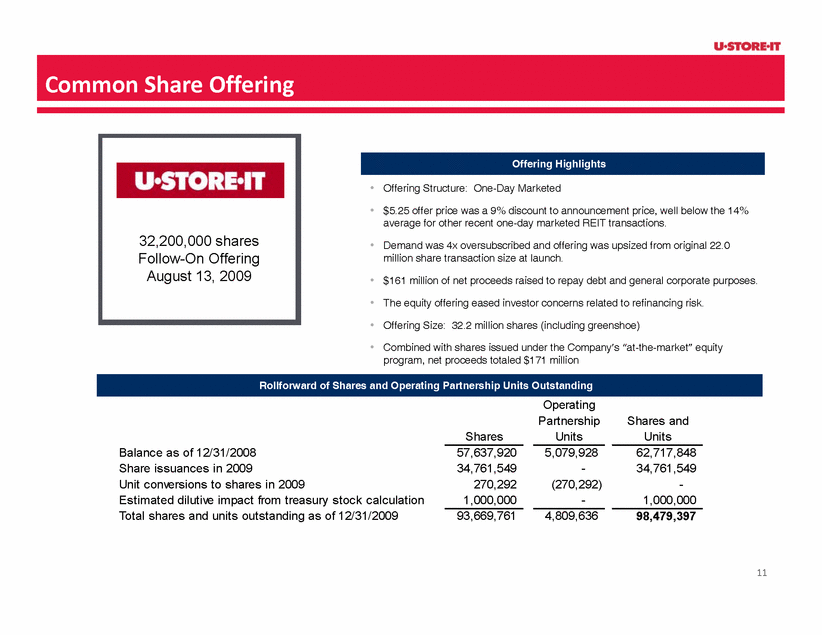
11 Common Share Offering Offering Highlights • Offering Structure: One-Day Marketed • $5.25 offer price was a 9% discount to announcement price, well below the 14% average for other recent one-day marketed REIT transactions. • Demand was 4x oversubscribed and offering was upsized from original 22.0 million share transaction size at launch. • $161 million of net proceeds raised to repay debt and general corporate purposes. • The equity offering eased investor concerns related to refinancing risk. • Offering Size: 32.2 million shares (including greenshoe) • Combined with shares issued under the Company’s “at-the-market” equity program, net proceeds totaled $171 million 32,200,000 shares Follow-On Offering August 13, 2009 Operating Partnership Shares and Shares Units Units Balance as of 12/31/2008 57,637,920 5,079,928 62,717,848 Share issuances in 2009 34,761,549 - 34,761,549 Unit conversions to shares in 2009 270,292 (270,292) - Estimated dilutive impact from treasury stock calculation 1,000,000 - 1,000,000 Total shares and units outstanding as of 12/31/2009 93,669,761 4,809,636 98,479,397 Rollforward of Shares and Operating Partnership Units Outstanding |
|
|
12 Capital Sources / Debt Maturities ($ in thousands) Capital Sources Maturities through December 2012 (1) Cash balance as of 12/31/09 (unaudited) 102,400 $ Secured maturity - YSI 1 in May 2010 83,339 $ Available capacity under revolving line of credit 250,000 Secured maturity - YSI 4 in July 2010 6,065 Secured maturity - YSI 26 in August 2010 9,475 Secured maturity - YSI 25 in October 2010 7,975 Secured maturity - YSI 2 in January 2011 83,480 Secured maturity - YSI 12 in September 2011 1,520 Secured maturity - YSI 13 in September 2011 1,307 Secured maturity - YSI 6 in August 2012 77,370 Secured maturity - YASKY in September 2012 80,000 Total Capital Sources 352,400 $ Total Maturities through December 2012 350,531 $ (1) Excludes the maturity of the Company's secured credit facility in December 2012 Funding Analysis (December 2009 - December 2012) • Current available cash and capacity under the Company’s secured credit facility combine to provide enough capital to satisfy debt maturities through late 2012 • The table below does not reflect utilization of free cash flow, future property sales, future property acquisitions or future capital-raising activities |


