Attached files
| file | filename |
|---|---|
| 8-K - FORM 8-K - TOTAL SYSTEM SERVICES INC | g21807e8vk.htm |
| EX-99.1 - EX-99.1 - TOTAL SYSTEM SERVICES INC | g21807exv99w1.htm |
Exhibit 99.2
| 2009 Fourth Quarter Results January 20, 2010 |
| Forward-Looking Statements This presentation contains forward-looking statements about the future operating results of TSYS. These statements are based on management's expectations and assumptions and are subject to risks, uncertainties and changes in circumstances. Actual results may differ materially from those set forth in the forward-looking statements due to a variety of factors. More information about these risks, uncertainties and factors may be found in TSYS' 2008 Annual Report on Form 10-K, Quarterly Reports on Form 10-Q and Current Reports on Form 8-K which have been filed with the Securities and Exchange Commission. TSYS does not assume any obligation to update any forward-looking statements as a result of new information, future developments or otherwise. |
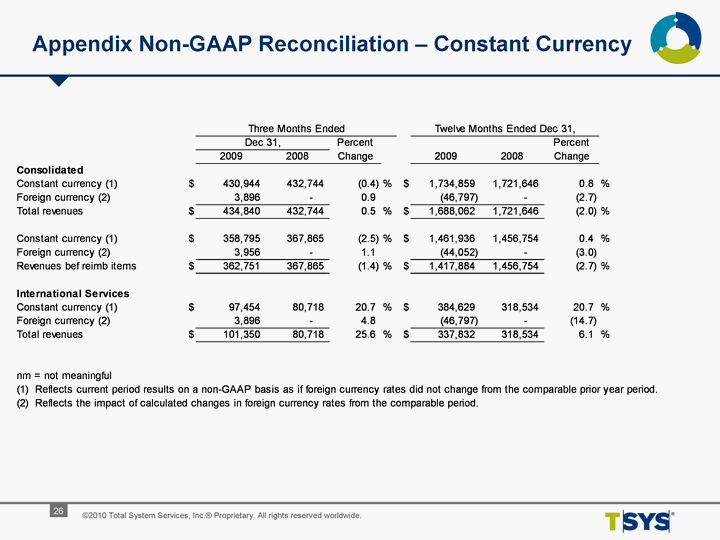
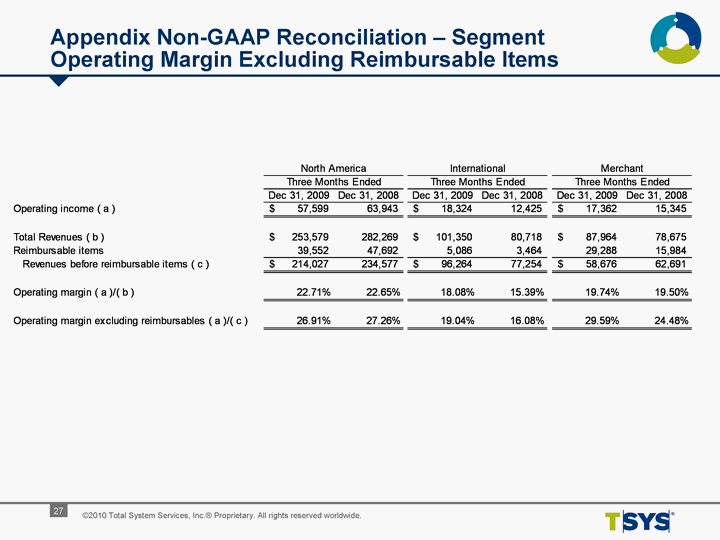
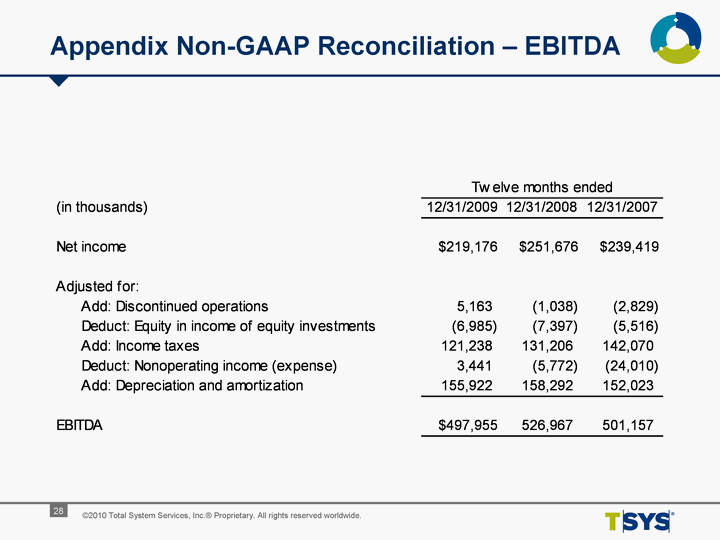
| Use of Non-GAAP Financial Measures This slide presentation contains certain non-GAAP financial measures determined by methods other than in accordance with generally accepted accounting principles. Such non-GAAP financial measures include the following: operating margin excluding reimbursable items, revenues and operating income measured on a constant currency basis, free cash flow and EBITDA. The most comparable GAAP measures to these measures are operating margin, revenues, operating income, cash flows from operating activities and net income, respectively. Management uses these non-GAAP financial measures to assess the performance of TSYS' core business. TSYS believes that these non-GAAP financial measures provide meaningful additional information about TSYS to assist investors in evaluating TSYS' operating results. These non-GAAP financial measures should not be considered as a substitute for operating results determined in accordance with GAAP and may not be comparable to other similarly titled measures of other companies. The computations of the non-GAAP financial measures used in this slide presentation are set forth in the Appendix to this slide presentation. |
| Agenda Jim Lipham, Chief Financial Officer Financial Highlights 2010 Guidance Phil Tomlinson, Chairman and CEO Q&A |
| Jim Lipham Chief Financial Officer |
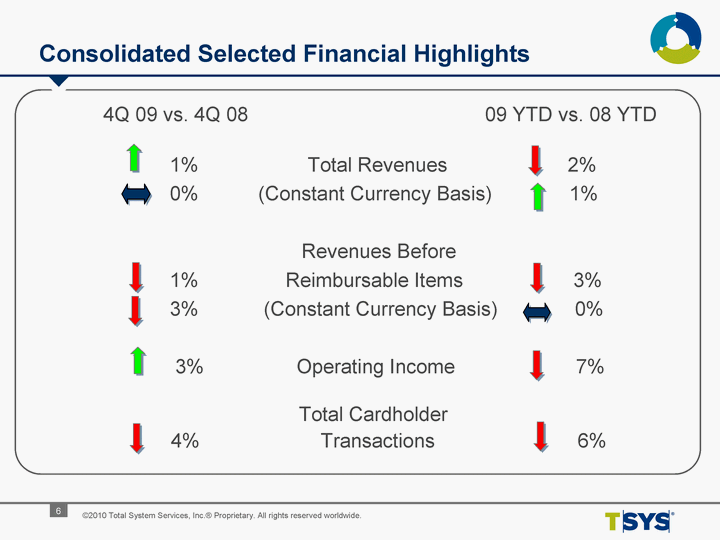
| Consolidated Selected Financial Highlights 4Q 09 vs. 4Q 08 09 YTD vs. 08 YTD 1% Total Revenues 2% 0% (Constant Currency Basis) 1% Revenues Before 1% Reimbursable Items 3% 3% (Constant Currency Basis) 0% 3% Operating Income 7% Total Cardholder 4% Transactions 6% |
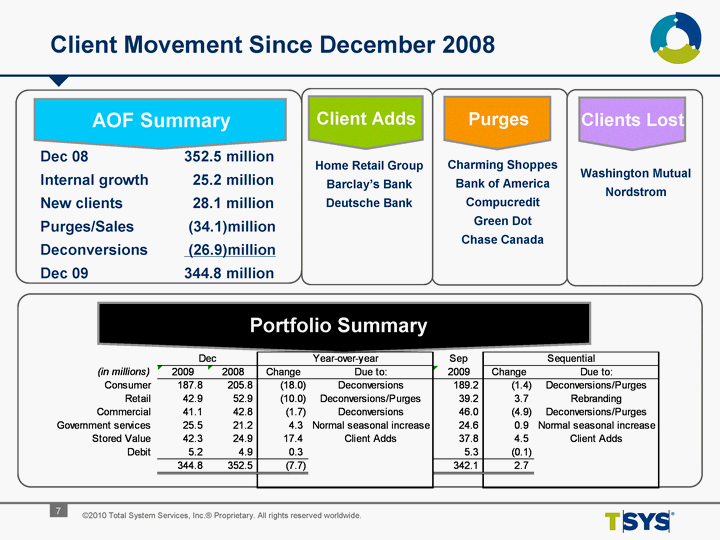
| Client Movement Since December 2008 AOF Summary Dec 08 352.5 million Internal growth 25.2 million New clients 28.1 million Purges/Sales (34.1)million Deconversions (26.9)million Dec 09 344.8 million Purges Charming Shoppes Bank of America Compucredit Green Dot Chase Canada Client Adds Home Retail Group Barclay's Bank Deutsche Bank Clients Lost Washington Mutual Nordstrom Portfolio Summary |
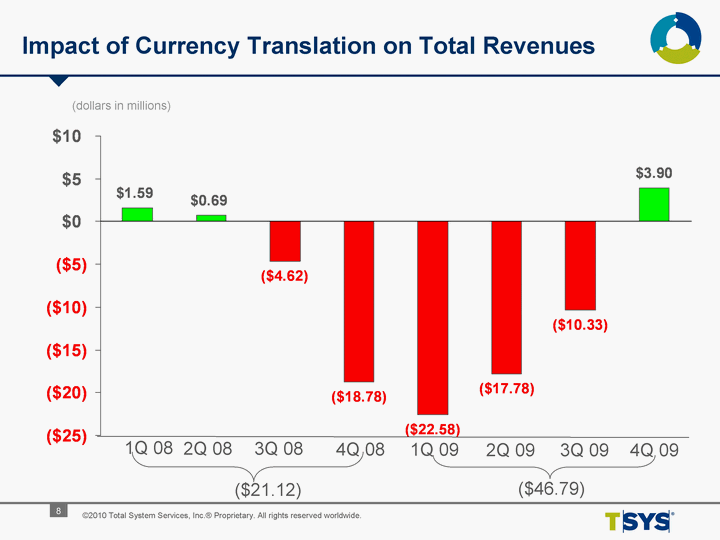
| 1Q 08 2Q 08 3Q 08 4Q 08 1Q 09 2Q 09 3rd Qtr 09 4th Qtr 09 CTA Impact 1.587773 0.687972 -4.61757 -18.779283 -22.582598 -17.778674 -10.33 3.896 CTA Impact Incremental Impact of Currency Translation on Total Revenues (dollars in millions) ($21.12) ($46.79) 1Q 08 2Q 08 1Q 09 2Q 09 3Q 08 4Q 08 3Q 09 4Q 09 |
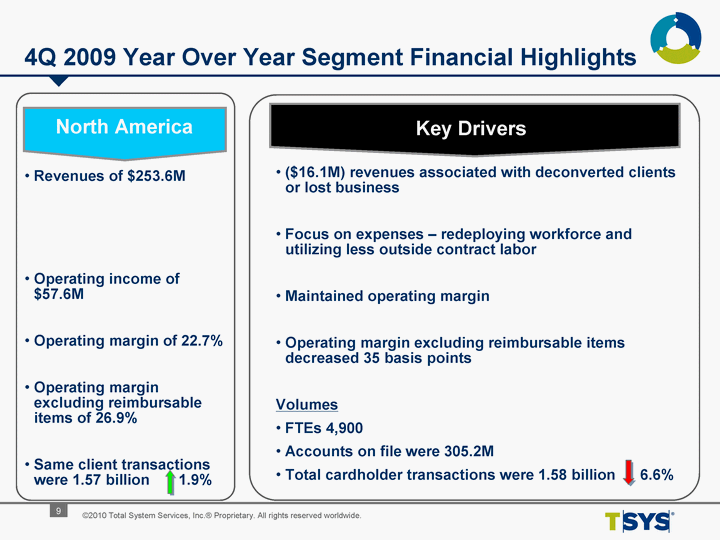
| North America 4Q 2009 Year Over Year Segment Financial Highlights Revenues of $253.6M Operating income of $57.6M Operating margin of 22.7% Operating margin excluding reimbursable items of 26.9% Same client transactions were 1.57 billion 1.9% Key Drivers ($16.1M) revenues associated with deconverted clients or lost business Focus on expenses - redeploying workforce and utilizing less outside contract labor Maintained operating margin Operating margin excluding reimbursable items decreased 35 basis points Volumes FTEs 4,900 Accounts on file were 305.2M Total cardholder transactions were 1.58 billion 6.6% |
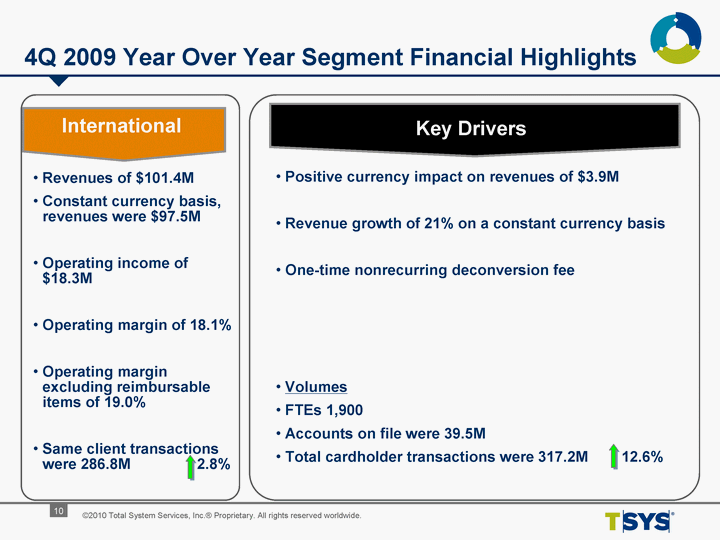
| 4Q 2009 Year Over Year Segment Financial Highlights International Revenues of $101.4M Constant currency basis, revenues were $97.5M Operating income of $18.3M Operating margin of 18.1% Operating margin excluding reimbursable items of 19.0% Same client transactions were 286.8M 2.8% Key Drivers Positive currency impact on revenues of $3.9M Revenue growth of 21% on a constant currency basis One-time nonrecurring deconversion fee Volumes FTEs 1,900 Accounts on file were 39.5M Total cardholder transactions were 317.2M 12.6% |
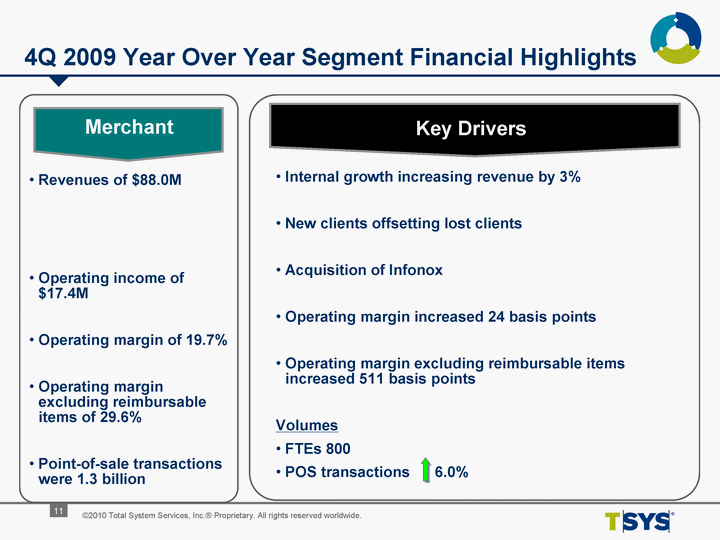
| 4Q 2009 Year Over Year Segment Financial Highlights Merchant Revenues of $88.0M Operating income of $17.4M Operating margin of 19.7% Operating margin excluding reimbursable items of 29.6% Point-of-sale transactions were 1.3 billion Key Drivers Internal growth increasing revenue by 3% New clients offsetting lost clients Acquisition of Infonox Operating margin increased 24 basis points Operating margin excluding reimbursable items increased 511 basis points Volumes FTEs 800 POS transactions 6.0% |
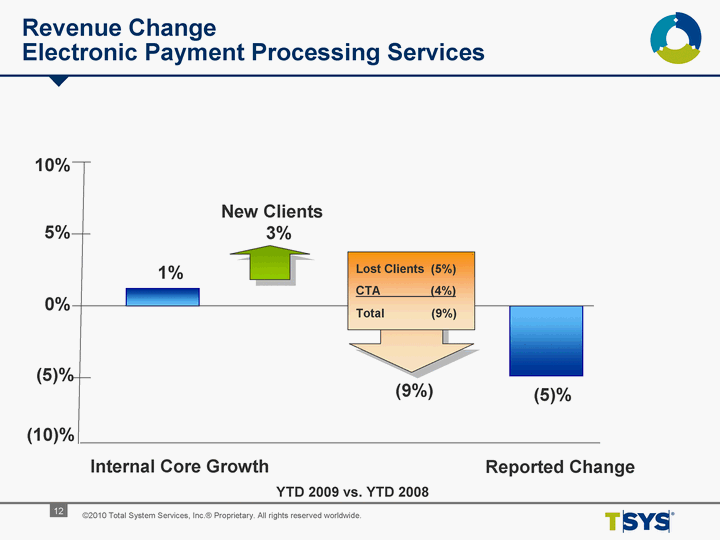
| Revenue Change Electronic Payment Processing Services 1% Internal Core Growth (5)% 0% 5% 10% 3% (5)% Reported Change (9%) YTD 2009 vs. YTD 2008 New Clients (10)% Lost Clients (5%) CTA (4%) Total (9%) |
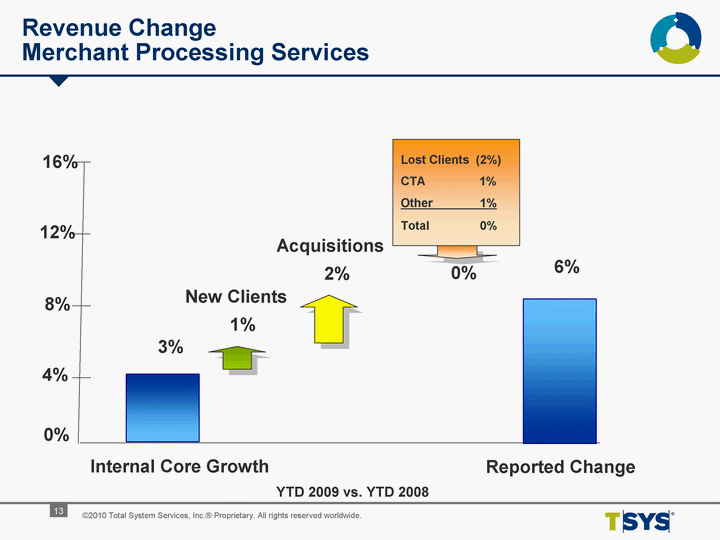
| Revenue Change Merchant Processing Services 3% Internal Core Growth 4% 8% 12% 16% 1% Reported Change 0% YTD 2009 vs. YTD 2008 New Clients 0% Lost Clients (2%) CTA 1% Other 1% Total 0% 6% 2% Acquisitions |
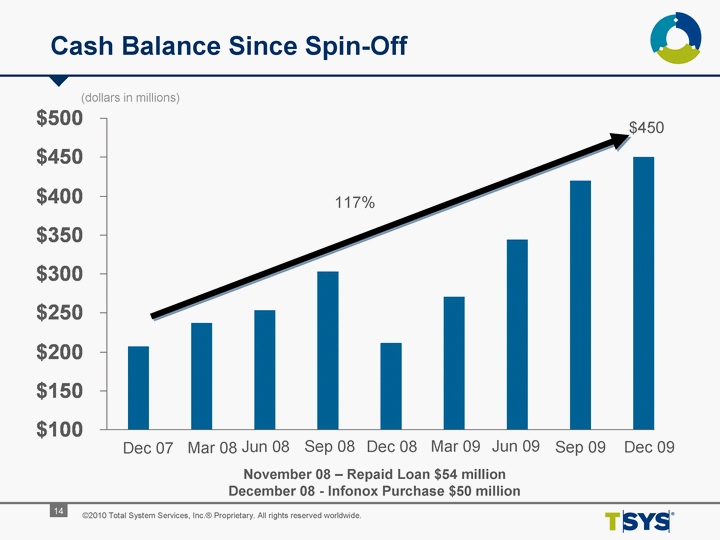
| 12/31/2007 3/31/2008 6/30/2008 9/30/2008 12/31/2008 3/31/2009 6/30/2009 9/30/2009 12/31/2009 Cash 207.5625 236.7717 253.5411 303.3602 211.3647 271.0428 344.4427 420 450 Cash Balance Since Spin-Off November 08 - Repaid Loan $54 million December 08 - Infonox Purchase $50 million (dollars in millions) Dec 07 Mar 08 Jun 08 Sep 08 Dec 08 Mar 09 Jun 09 Sep 09 117% Dec 09 $450 |
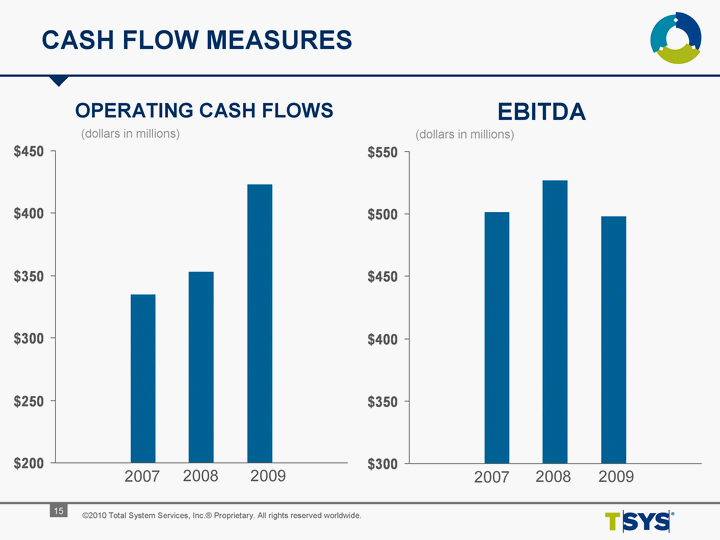
| CASH FLOW MEASURES 12/31/2006 12/31/2007 12/31/2008 12/31/2009 EBITDA 334.861 352.835 423.137 (dollars in millions) 2007 2008 2009 EBITDA OPERATING CASH FLOWS 9/30/2006 12/31/2007 12/31/2008 12/31/2009 EBITDA 501.158 526.967193 497.955227 (dollars in millions) 2007 2008 2009 |
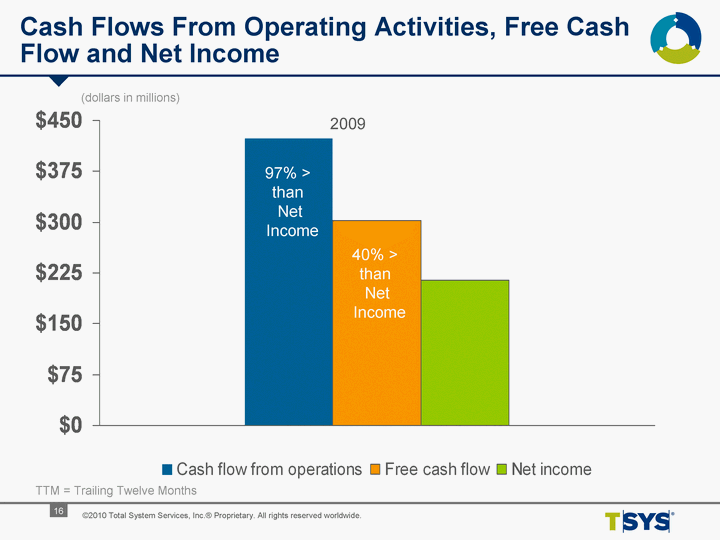
| Cash Flows From Operating Activities, Free Cash Flow and Net Income 9/31/2008 9/30/2009 Sep 09 TTM Cash flow from operations 278.906 333.056 423 Free cash flow 175.202 249.925 302 Net income 183.772 154.999 215 (dollars in millions) 2009 97% > than Net Income 40% > than Net Income TTM = Trailing Twelve Months |
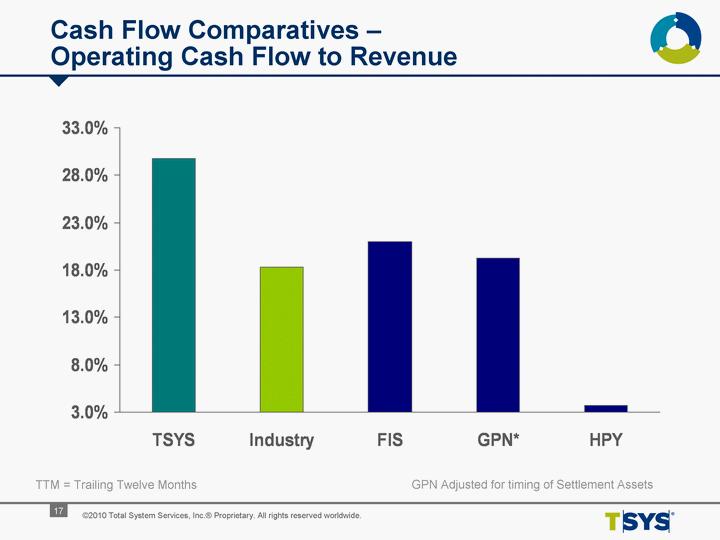
| TSYS Industry FIS GPN* HPY Operating Cash Flow to revenue 0.298 0.183 0.21 0.193 0.037 TTM = Trailing Twelve Months Cash Flow Comparatives - Operating Cash Flow to Revenue GPN Adjusted for timing of Settlement Assets |
| 2010 Guidance |
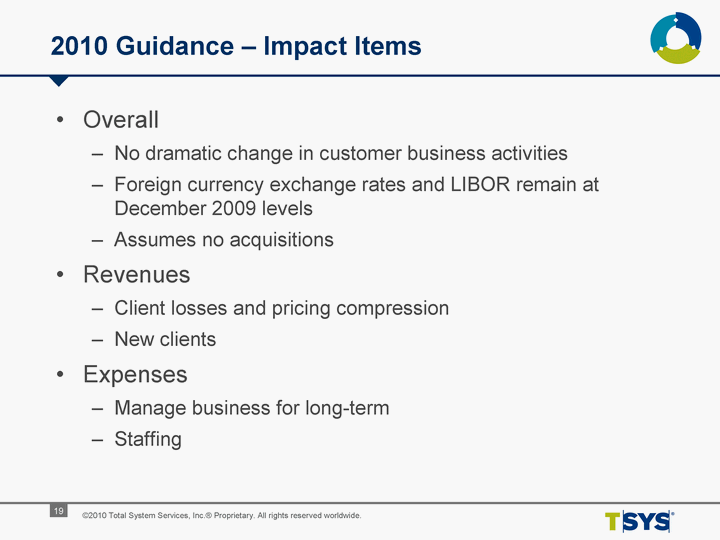
| 2010 Guidance - Impact Items Overall No dramatic change in customer business activities Foreign currency exchange rates and LIBOR remain at December 2009 levels Assumes no acquisitions Revenues Client losses and pricing compression New clients Expenses Manage business for long-term Staffing |
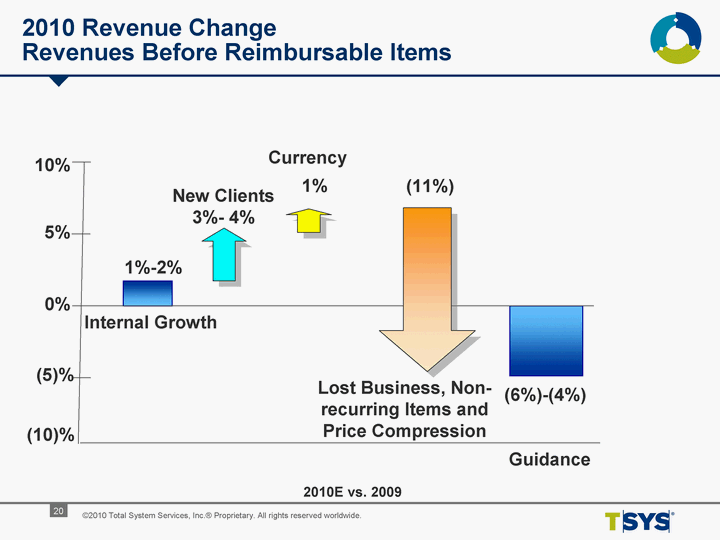
| 2010 Revenue Change Revenues Before Reimbursable Items 3%- 4% Lost Business, Non- recurring Items and Price Compression (5)% 0% 5% 10% (6%)-(4%) Guidance (11%) 2010E vs. 2009 New Clients (10)% 1% Currency Internal Growth 1%-2% |
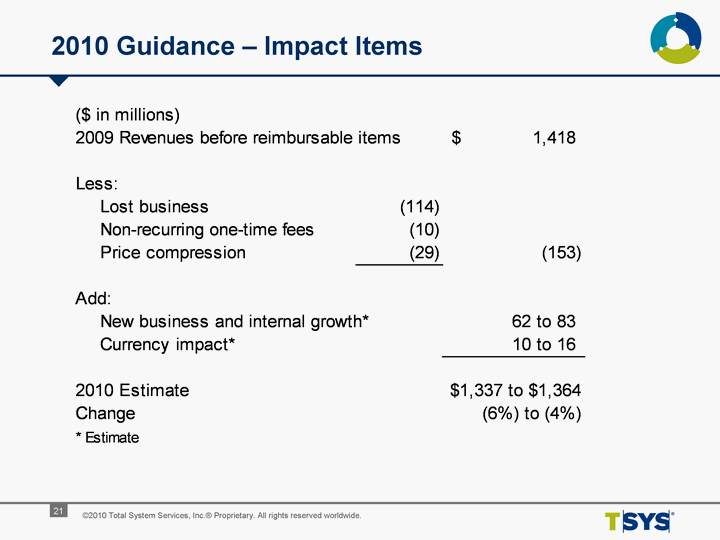
| 2010 Guidance - Impact Items |
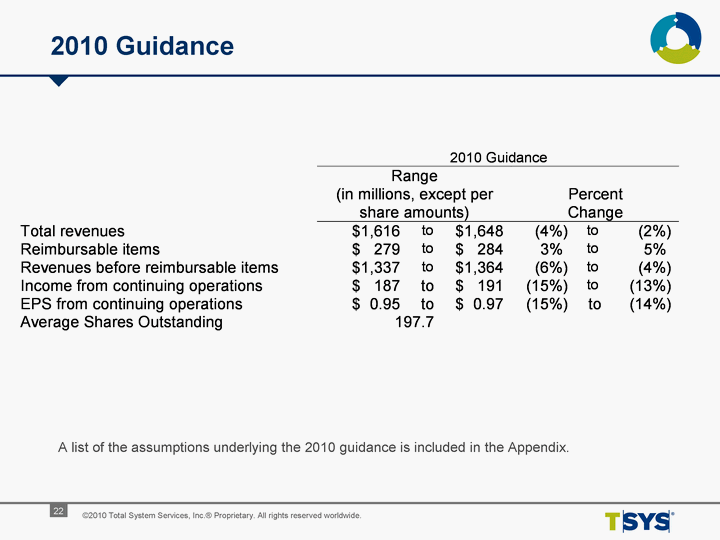
| 2010 Guidance A list of the assumptions underlying the 2010 guidance is included in the Appendix. |
| Jim Lipham Chief Financial Officer |
| Phil Tomlinson Chairman and Chief Executive Officer |
| Q&A |
| Appendix Non-GAAP Reconciliation - Constant Currency |
| Appendix Non-GAAP Reconciliation - Segment Operating Margin Excluding Reimbursable Items |
| Appendix Non-GAAP Reconciliation - EBITDA |
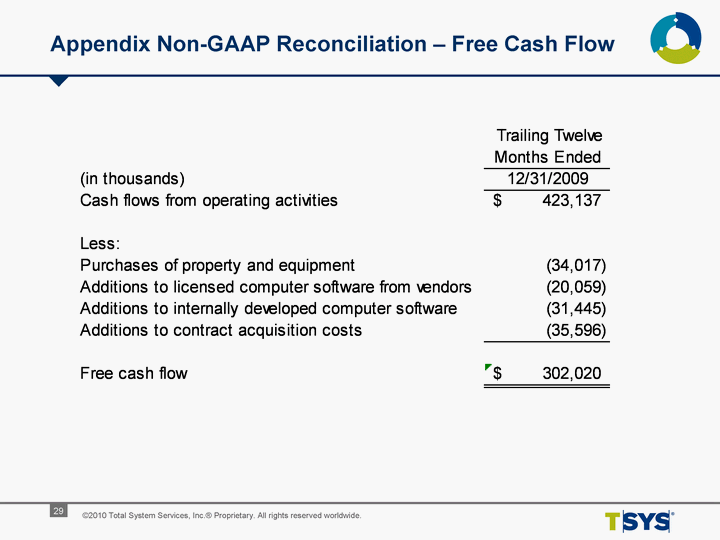
| Appendix Non-GAAP Reconciliation - Free Cash Flow |
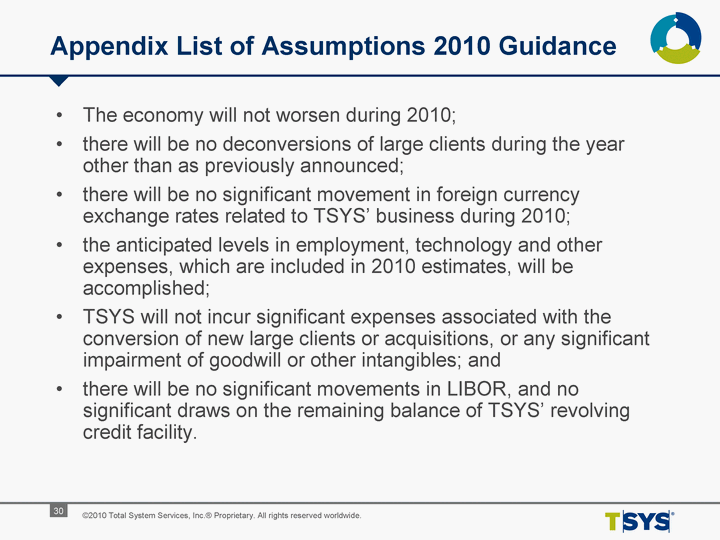
| Appendix List of Assumptions 2010 Guidance The economy will not worsen during 2010; there will be no deconversions of large clients during the year other than as previously announced; there will be no significant movement in foreign currency exchange rates related to TSYS' business during 2010; the anticipated levels in employment, technology and other expenses, which are included in 2010 estimates, will be accomplished; TSYS will not incur significant expenses associated with the conversion of new large clients or acquisitions, or any significant impairment of goodwill or other intangibles; and there will be no significant movements in LIBOR, and no significant draws on the remaining balance of TSYS' revolving credit facility. |
