Attached files
| file | filename |
|---|---|
| 8-K - FORM 8-K - JPMORGAN CHASE & CO | y81560e8vk.htm |
| January 15, 2010 F I N A N C I A L R E S U L T S 4Q09 |
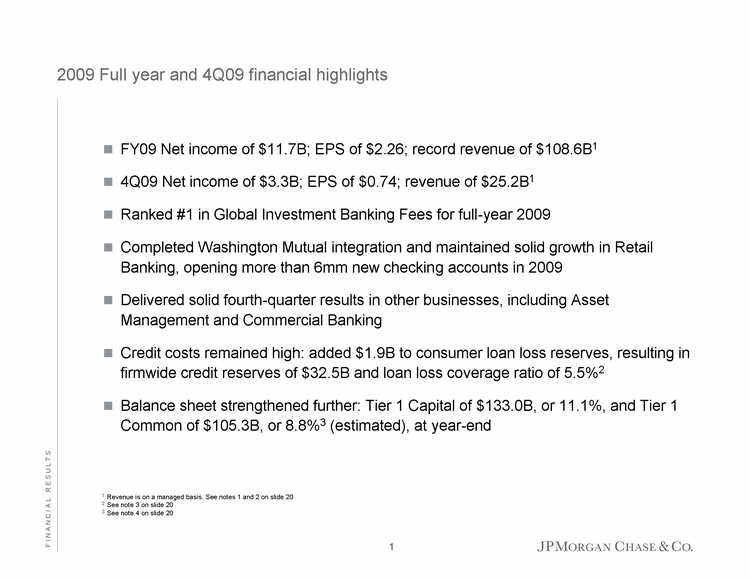
| 2009 Full year and 4Q09 financial highlights 1 Revenue is on a managed basis. See notes 1 and 2 on slide 20 2 See note 3 on slide 20 3 See note 4 on slide 20 FY09 Net income of $11.7B; EPS of $2.26; record revenue of $108.6B1 4Q09 Net income of $3.3B; EPS of $0.74; revenue of $25.2B1 Ranked #1 in Global Investment Banking Fees for full-year 2009 Completed Washington Mutual integration and maintained solid growth in Retail Banking, opening more than 6mm new checking accounts in 2009 Delivered solid fourth-quarter results in other businesses, including Asset Management and Commercial Banking Credit costs remained high: added $1.9B to consumer loan loss reserves, resulting in firmwide credit reserves of $32.5B and loan loss coverage ratio of 5.5%2 Balance sheet strengthened further: Tier 1 Capital of $133.0B, or 11.1%, and Tier 1 Common of $105.3B, or 8.8%3 (estimated), at year-end 1 F I N A N C I A L R E S U L T S |
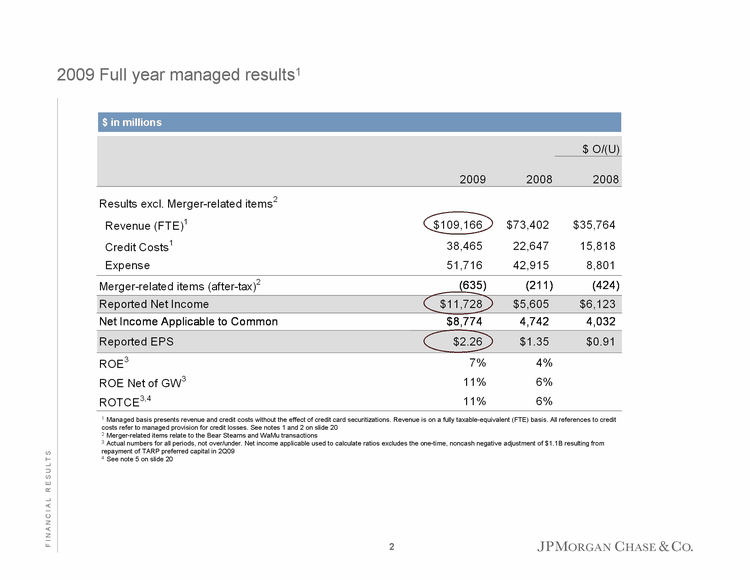
| 2009 Full year managed results1 1 Managed basis presents revenue and credit costs without the effect of credit card securitizations. Revenue is on a fully taxable-equivalent (FTE) basis. All references to credit costs refer to managed provision for credit losses. See notes 1 and 2 on slide 20 2 Merger-related items relate to the Bear Stearns and WaMu transactions 3 Actual numbers for all periods, not over/under. Net income applicable used to calculate ratios excludes the one-time, noncash negative adjustment of $1.1B resulting from repayment of TARP preferred capital in 2Q09 4 See note 5 on slide 20 $ in millions 2 F I N A N C I A L R E S U L T S |
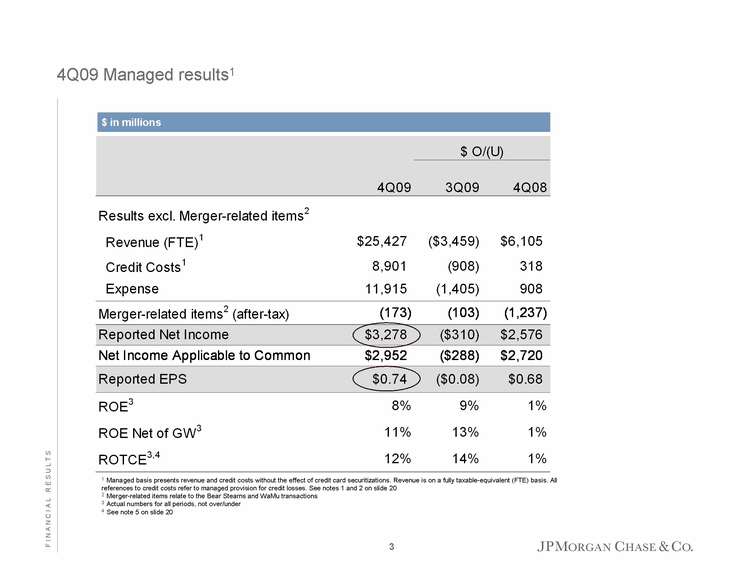
| 4Q09 Managed results1 1 Managed basis presents revenue and credit costs without the effect of credit card securitizations. Revenue is on a fully taxable-equivalent (FTE) basis. All references to credit costs refer to managed provision for credit losses. See notes 1 and 2 on slide 20 2 Merger-related items relate to the Bear Stearns and WaMu transactions 3 Actual numbers for all periods, not over/under 4 See note 5 on slide 20 $ in millions 3 F I N A N C I A L R E S U L T S |
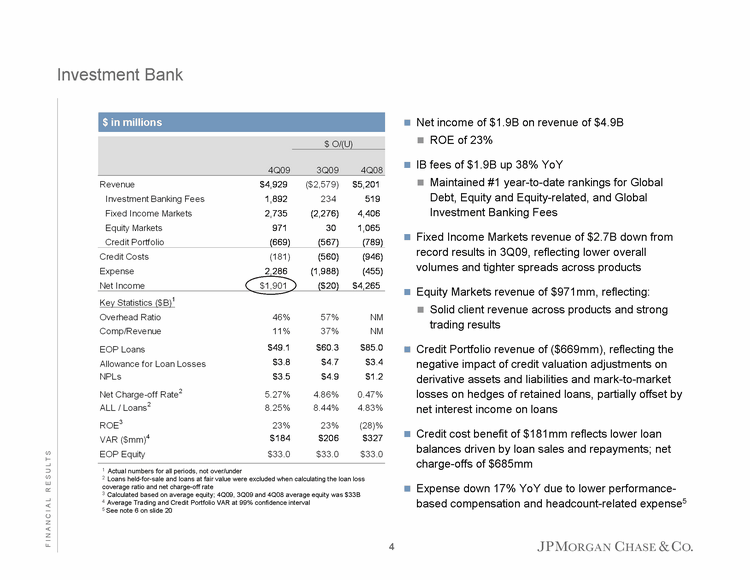
| Investment Bank $ in millions 1 Actual numbers for all periods, not over/under 2 Loans held-for-sale and loans at fair value were excluded when calculating the loan loss coverage ratio and net charge-off rate 3 Calculated based on average equity; 4Q09, 3Q09 and 4Q08 average equity was $33B 4 Average Trading and Credit Portfolio VAR at 99% confidence interval 5 See note 6 on slide 20 Net income of $1.9B on revenue of $4.9B ROE of 23% IB fees of $1.9B up 38% YoY Maintained #1 year-to-date rankings for Global Debt, Equity and Equity-related, and Global Investment Banking Fees Fixed Income Markets revenue of $2.7B down from record results in 3Q09, reflecting lower overall volumes and tighter spreads across products Equity Markets revenue of $971mm, reflecting: Solid client revenue across products and strong trading results Credit Portfolio revenue of ($669mm), reflecting the negative impact of credit valuation adjustments on derivative assets and liabilities and mark-to-market losses on hedges of retained loans, partially offset by net interest income on loans Credit cost benefit of $181mm reflects lower loan balances driven by loan sales and repayments; net charge-offs of $685mm Expense down 17% YoY due to lower performance- based compensation and headcount-related expense5 4 F I N A N C I A L R E S U L T S |
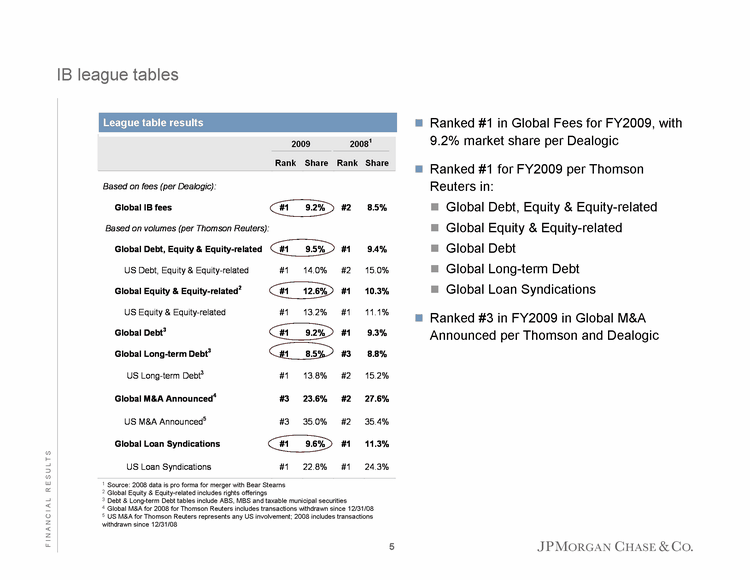
| IB league tables Ranked #1 in Global Fees for FY2009, with 9.2% market share per Dealogic Ranked #1 for FY2009 per Thomson Reuters in: Global Debt, Equity & Equity-related Global Equity & Equity-related Global Debt Global Long-term Debt Global Loan Syndications Ranked #3 in FY2009 in Global M&A Announced per Thomson and Dealogic 1 Source: 2008 data is pro forma for merger with Bear Stearns 2 Global Equity & Equity-related includes rights offerings 3 Debt & Long-term Debt tables include ABS, MBS and taxable municipal securities 4 Global M&A for 2008 for Thomson Reuters includes transactions withdrawn since 12/31/08 5 US M&A for Thomson Reuters represents any US involvement; 2008 includes transactions withdrawn since 12/31/08 League table results 5 F I N A N C I A L R E S U L T S |
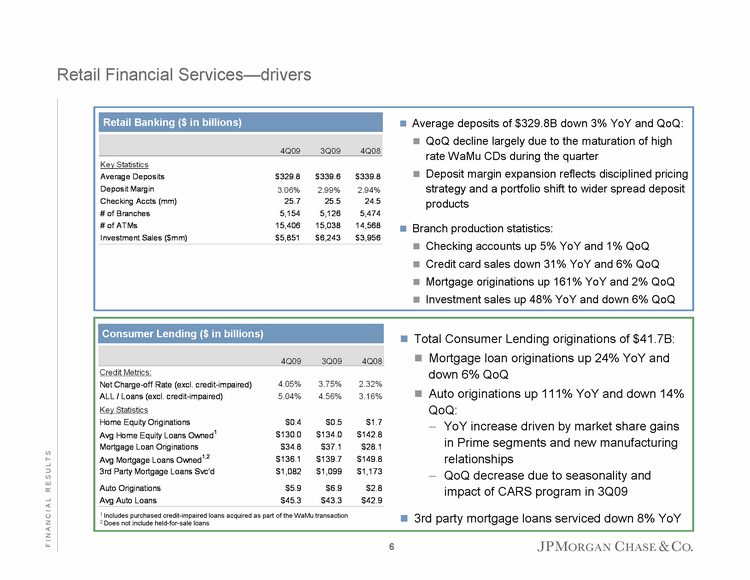
| Retail Financial Services-drivers 1 Includes purchased credit-impaired loans acquired as part of the WaMu transaction 2 Does not include held-for-sale loans Retail Banking ($ in billions) Consumer Lending ($ in billions) Total Consumer Lending originations of $41.7B: Mortgage loan originations up 24% YoY and down 6% QoQ Auto originations up 111% YoY and down 14% QoQ: YoY increase driven by market share gains in Prime segments and new manufacturing relationships QoQ decrease due to seasonality and impact of CARS program in 3Q09 3rd party mortgage loans serviced down 8% YoY Average deposits of $329.8B down 3% YoY and QoQ: QoQ decline largely due to the maturation of high rate WaMu CDs during the quarter Deposit margin expansion reflects disciplined pricing strategy and a portfolio shift to wider spread deposit products Branch production statistics: Checking accounts up 5% YoY and 1% QoQ Credit card sales down 31% YoY and 6% QoQ Mortgage originations up 161% YoY and 2% QoQ Investment sales up 48% YoY and down 6% QoQ 6 F I N A N C I A L R E S U L T S |
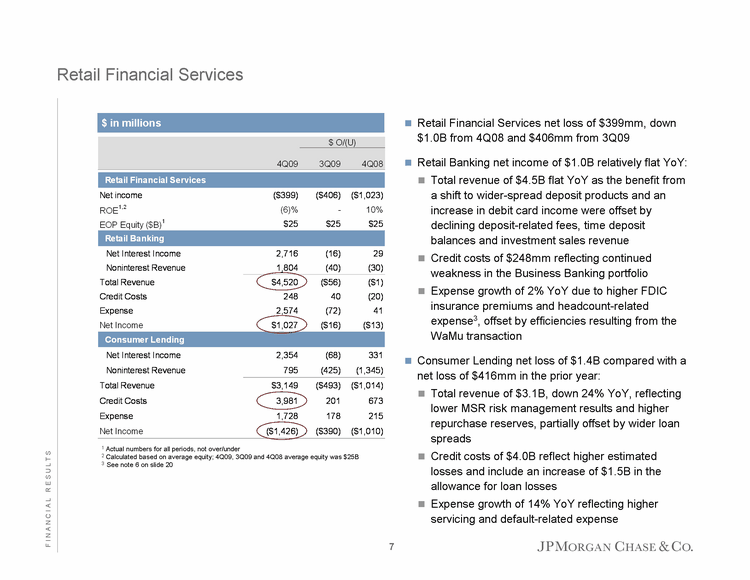
| Retail Financial Services 1 Actual numbers for all periods, not over/under 2 Calculated based on average equity; 4Q09, 3Q09 and 4Q08 average equity was $25B 3 See note 6 on slide 20 $ in millions Retail Financial Services net loss of $399mm, down $1.0B from 4Q08 and $406mm from 3Q09 Retail Banking net income of $1.0B relatively flat YoY: Total revenue of $4.5B flat YoY as the benefit from a shift to wider-spread deposit products and an increase in debit card income were offset by declining deposit-related fees, time deposit balances and investment sales revenue Credit costs of $248mm reflecting continued weakness in the Business Banking portfolio Expense growth of 2% YoY due to higher FDIC insurance premiums and headcount-related expense3, offset by efficiencies resulting from the WaMu transaction Consumer Lending net loss of $1.4B compared with a net loss of $416mm in the prior year: Total revenue of $3.1B, down 24% YoY, reflecting lower MSR risk management results and higher repurchase reserves, partially offset by wider loan spreads Credit costs of $4.0B reflect higher estimated losses and include an increase of $1.5B in the allowance for loan losses Expense growth of 14% YoY reflecting higher servicing and default-related expense 7 F I N A N C I A L R E S U L T S |
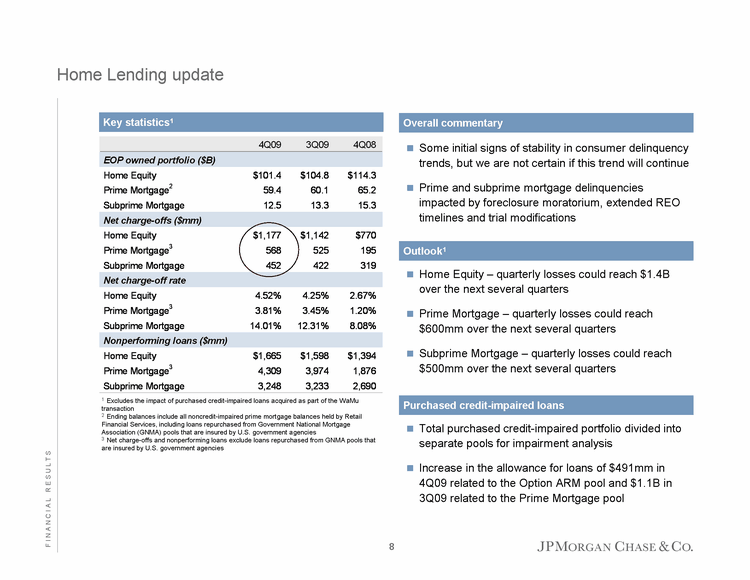
| Home Lending update Overall commentary Outlook1 1 Excludes the impact of purchased credit-impaired loans acquired as part of the WaMu transaction 2 Ending balances include all noncredit-impaired prime mortgage balances held by Retail Financial Services, including loans repurchased from Government National Mortgage Association (GNMA) pools that are insured by U.S. government agencies 3 Net charge-offs and nonperforming loans exclude loans repurchased from GNMA pools that are insured by U.S. government agencies Purchased credit-impaired loans Key statistics1 Home Equity - quarterly losses could reach $1.4B over the next several quarters Prime Mortgage - quarterly losses could reach $600mm over the next several quarters Subprime Mortgage - quarterly losses could reach $500mm over the next several quarters Some initial signs of stability in consumer delinquency trends, but we are not certain if this trend will continue Prime and subprime mortgage delinquencies impacted by foreclosure moratorium, extended REO timelines and trial modifications Total purchased credit-impaired portfolio divided into separate pools for impairment analysis Increase in the allowance for loans of $491mm in 4Q09 related to the Option ARM pool and $1.1B in 3Q09 related to the Prime Mortgage pool 8 F I N A N C I A L R E S U L T S |
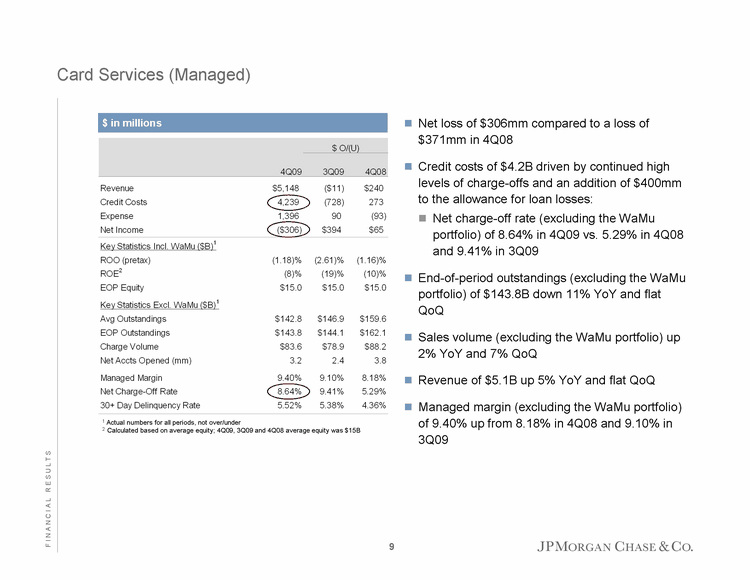
| Net loss of $306mm compared to a loss of $371mm in 4Q08 Credit costs of $4.2B driven by continued high levels of charge-offs and an addition of $400mm to the allowance for loan losses: Net charge-off rate (excluding the WaMu portfolio) of 8.64% in 4Q09 vs. 5.29% in 4Q08 and 9.41% in 3Q09 End-of-period outstandings (excluding the WaMu portfolio) of $143.8B down 11% YoY and flat QoQ Sales volume (excluding the WaMu portfolio) up 2% YoY and 7% QoQ Revenue of $5.1B up 5% YoY and flat QoQ Managed margin (excluding the WaMu portfolio) of 9.40% up from 8.18% in 4Q08 and 9.10% in 3Q09 Card Services (Managed) 1 Actual numbers for all periods, not over/under 2 Calculated based on average equity; 4Q09, 3Q09 and 4Q08 average equity was $15B $ in millions 9 F I N A N C I A L R E S U L T S |
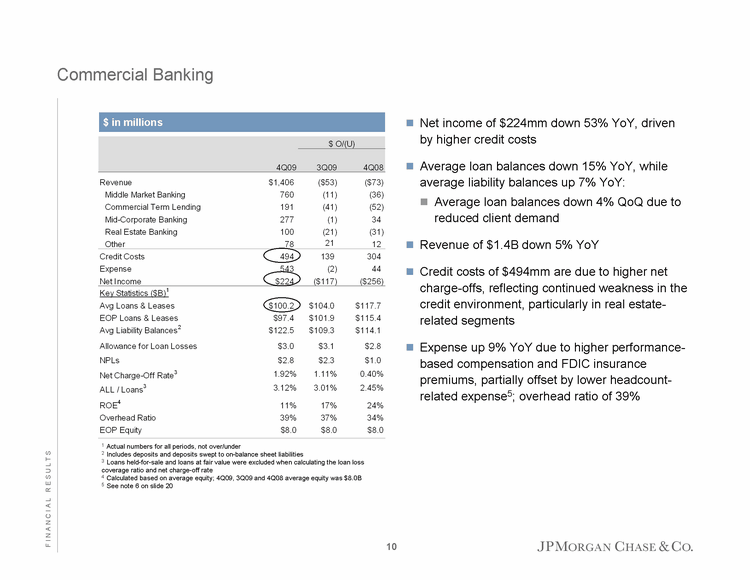
| Net income of $224mm down 53% YoY, driven by higher credit costs Average loan balances down 15% YoY, while average liability balances up 7% YoY: Average loan balances down 4% QoQ due to reduced client demand Revenue of $1.4B down 5% YoY Credit costs of $494mm are due to higher net charge-offs, reflecting continued weakness in the credit environment, particularly in real estate- related segments Expense up 9% YoY due to higher performance- based compensation and FDIC insurance premiums, partially offset by lower headcount- related expense5; overhead ratio of 39% Commercial Banking 1 Actual numbers for all periods, not over/under 2 Includes deposits and deposits swept to on-balance sheet liabilities 3 Loans held-for-sale and loans at fair value were excluded when calculating the loan loss coverage ratio and net charge-off rate 4 Calculated based on average equity; 4Q09, 3Q09 and 4Q08 average equity was $8.0B 5 See note 6 on slide 20 $ in millions 10 F I N A N C I A L R E S U L T S |
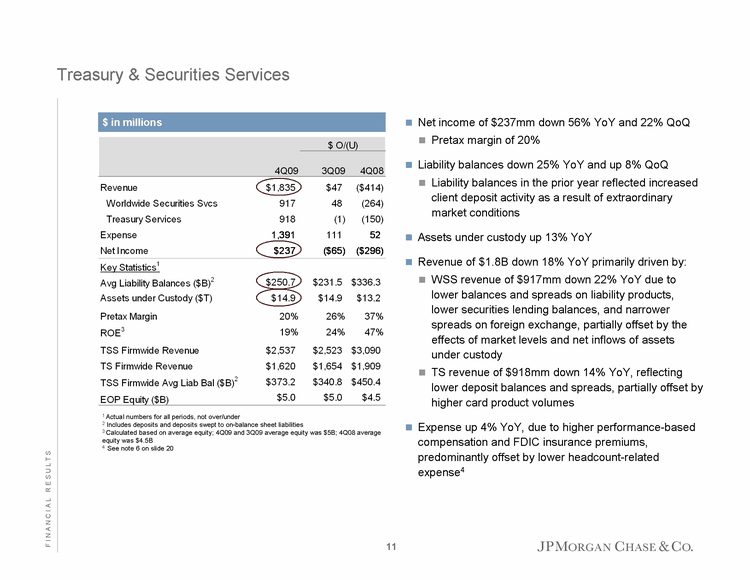
| Treasury & Securities Services 1 Actual numbers for all periods, not over/under 2 Includes deposits and deposits swept to on-balance sheet liabilities 3 Calculated based on average equity; 4Q09 and 3Q09 average equity was $5B; 4Q08 average equity was $4.5B 4 See note 6 on slide 20 $ in millions Net income of $237mm down 56% YoY and 22% QoQ Pretax margin of 20% Liability balances down 25% YoY and up 8% QoQ Liability balances in the prior year reflected increased client deposit activity as a result of extraordinary market conditions Assets under custody up 13% YoY Revenue of $1.8B down 18% YoY primarily driven by: WSS revenue of $917mm down 22% YoY due to lower balances and spreads on liability products, lower securities lending balances, and narrower spreads on foreign exchange, partially offset by the effects of market levels and net inflows of assets under custody TS revenue of $918mm down 14% YoY, reflecting lower deposit balances and spreads, partially offset by higher card product volumes Expense up 4% YoY, due to higher performance-based compensation and FDIC insurance premiums, predominantly offset by lower headcount-related expense4 11 F I N A N C I A L R E S U L T S |
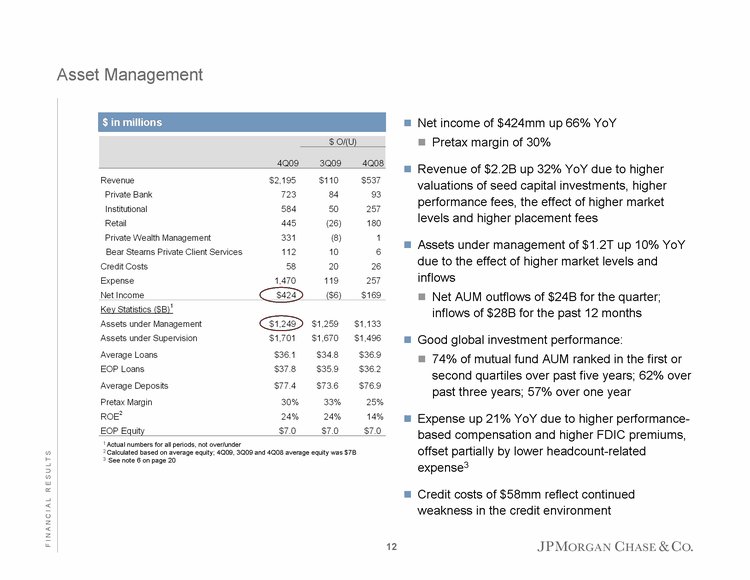
| Asset Management 1 Actual numbers for all periods, not over/under 2 Calculated based on average equity; 4Q09, 3Q09 and 4Q08 average equity was $7B 3 See note 6 on page 20 $ in millions Net income of $424mm up 66% YoY Pretax margin of 30% Revenue of $2.2B up 32% YoY due to higher valuations of seed capital investments, higher performance fees, the effect of higher market levels and higher placement fees Assets under management of $1.2T up 10% YoY due to the effect of higher market levels and inflows Net AUM outflows of $24B for the quarter; inflows of $28B for the past 12 months Good global investment performance: 74% of mutual fund AUM ranked in the first or second quartiles over past five years; 62% over past three years; 57% over one year Expense up 21% YoY due to higher performance- based compensation and higher FDIC premiums, offset partially by lower headcount-related expense3 Credit costs of $58mm reflect continued weakness in the credit environment 12 F I N A N C I A L R E S U L T S |
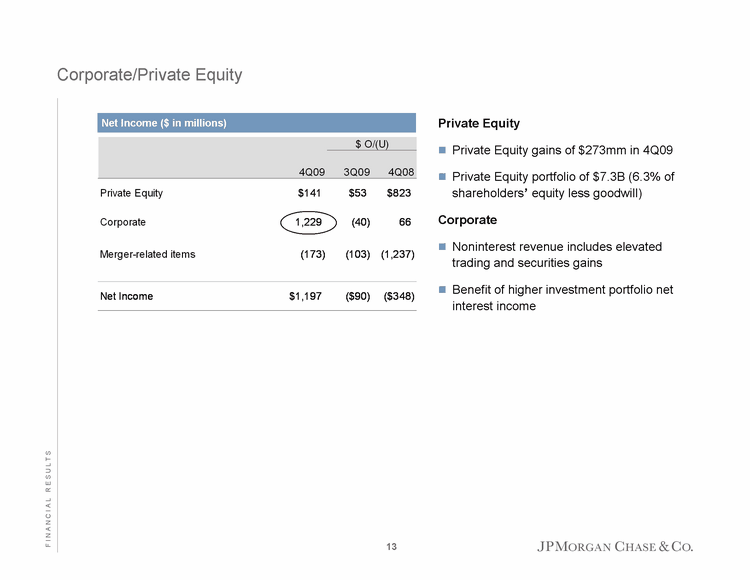
| Corporate/Private Equity Net Income ($ in millions) Private Equity Private Equity gains of $273mm in 4Q09 Private Equity portfolio of $7.3B (6.3% of shareholders' equity less goodwill) Corporate Noninterest revenue includes elevated trading and securities gains Benefit of higher investment portfolio net interest income 13 F I N A N C I A L R E S U L T S |
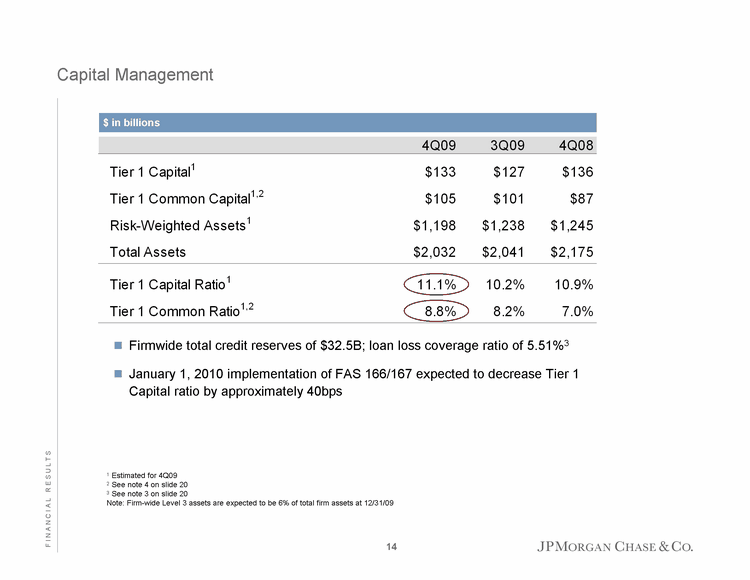
| Capital Management $ in billions Firmwide total credit reserves of $32.5B; loan loss coverage ratio of 5.51%3 January 1, 2010 implementation of FAS 166/167 expected to decrease Tier 1 Capital ratio by approximately 40bps 1 Estimated for 4Q09 2 See note 4 on slide 20 3 See note 3 on slide 20 Note: Firm-wide Level 3 assets are expected to be 6% of total firm assets at 12/31/09 14 F I N A N C I A L R E S U L T S |
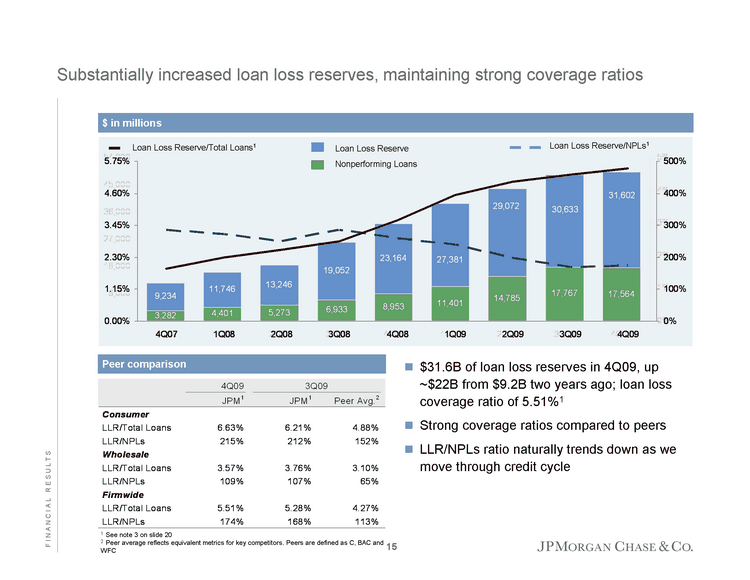
| LLR/NPLs LLR/Total Loans Line 3 NPLs LLR Stack 3 Stack 4 Stack 5 Stack 6 Stack 7 Stack 8 Stack 9 Stack 10 Stack 11 Stack 12 Stack 13 Stack 14 Stack 15 Stack 16 1Q07 3.46 1907 7300 2Q07 3.56 2006 7633 3Q07 3.14 2490 8113 4Q07 2.86 3282 9234 1Q08 2.71 4401 11746 2Q08 2.54 5273 13246 3Q08 2.87 6933 19052 4Q08 2.6 8953 23164 1Q09 2.42 11401 27381 2Q09 14785 29072 3Q09 17767 30633 4Q09 17564 31602 LLR/NPLs LLR/Total Loans Line 3 NPLs LLR Stack 3 Stack 4 Stack 5 Stack 6 Stack 7 Stack 8 Stack 9 Stack 10 Stack 11 Stack 12 Stack 13 Stack 14 Stack 15 Stack 16 1Q07 4.08 0.0174 2112 7300 2Q07 4.32 0.0171 2144 7633 3Q07 3.36 0.0176 2587 8113 4Q07 2.86 0.0188 3232 9234 1Q08 2.71 0.0229 4401 11746 2Q08 2.51 0.0257 5273 13246 3Q08 2.86 0.0287 6933 19052 4Q08 2.59 0.0362 8953 23164 1Q09 2.4 0.0453 11401 27381 2Q09 1.98 0.0501 3Q09 1.68 0.0527 4Q09 1.74 0.0551 $ in millions Substantially increased loan loss reserves, maintaining strong coverage ratios Loan Loss Reserve Nonperforming Loans Loan Loss Reserve/Total Loans1 Loan Loss Reserve/NPLs1 Peer comparison $31.6B of loan loss reserves in 4Q09, up ~$22B from $9.2B two years ago; loan loss coverage ratio of 5.51%1 Strong coverage ratios compared to peers LLR/NPLs ratio naturally trends down as we move through credit cycle 1 See note 3 on slide 20 2 Peer average reflects equivalent metrics for key competitors. Peers are defined as C, BAC and WFC 15 F I N A N C I A L R E S U L T S |
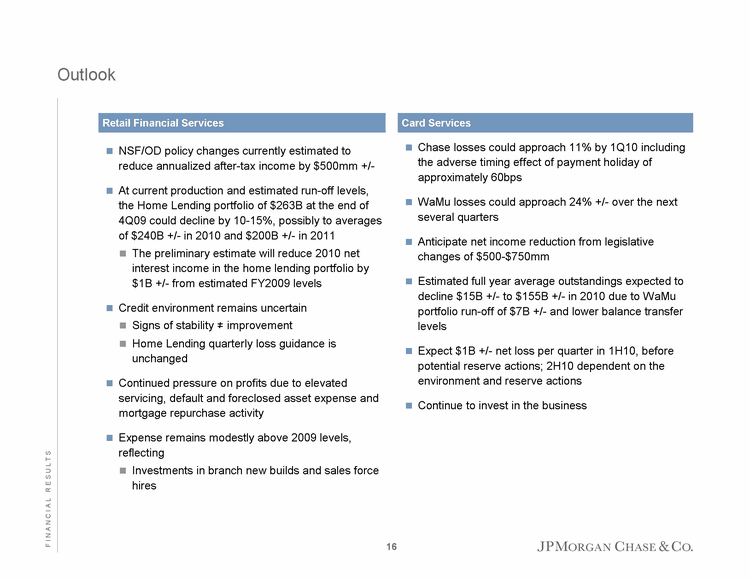
| Outlook Chase losses could approach 11% by 1Q10 including the adverse timing effect of payment holiday of approximately 60bps WaMu losses could approach 24% +/- over the next several quarters Anticipate net income reduction from legislative changes of $500-$750mm Estimated full year average outstandings expected to decline $15B +/- to $155B +/- in 2010 due to WaMu portfolio run-off of $7B +/- and lower balance transfer levels Expect $1B +/- net loss per quarter in 1H10, before potential reserve actions; 2H10 dependent on the environment and reserve actions Continue to invest in the business Card Services Retail Financial Services NSF/OD policy changes currently estimated to reduce annualized after-tax income by $500mm +/- At current production and estimated run-off levels, the Home Lending portfolio of $263B at the end of 4Q09 could decline by 10-15%, possibly to averages of $240B +/- in 2010 and $200B +/- in 2011 The preliminary estimate will reduce 2010 net interest income in the home lending portfolio by $1B +/- from estimated FY2009 levels Credit environment remains uncertain Signs of stability ^ improvement Home Lending quarterly loss guidance is unchanged Continued pressure on profits due to elevated servicing, default and foreclosed asset expense and mortgage repurchase activity Expense remains modestly above 2009 levels, reflecting Investments in branch new builds and sales force hires 16 F I N A N C I A L R E S U L T S |
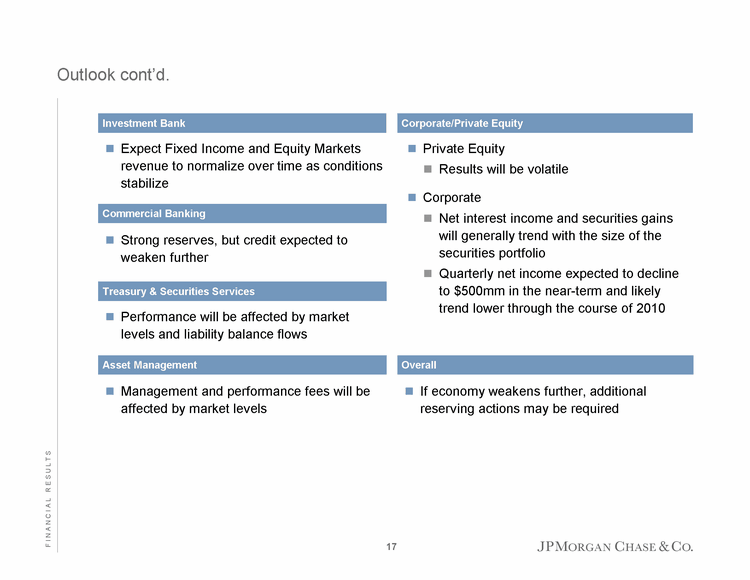
| Outlook cont'd. Investment Bank Treasury & Securities Services Corporate/Private Equity Asset Management Commercial Banking Overall Performance will be affected by market levels and liability balance flows Management and performance fees will be affected by market levels Private Equity Results will be volatile Corporate Net interest income and securities gains will generally trend with the size of the securities portfolio Quarterly net income expected to decline to $500mm in the near-term and likely trend lower through the course of 2010 If economy weakens further, additional reserving actions may be required Expect Fixed Income and Equity Markets revenue to normalize over time as conditions stabilize Strong reserves, but credit expected to weaken further 17 F I N A N C I A L R E S U L T S |
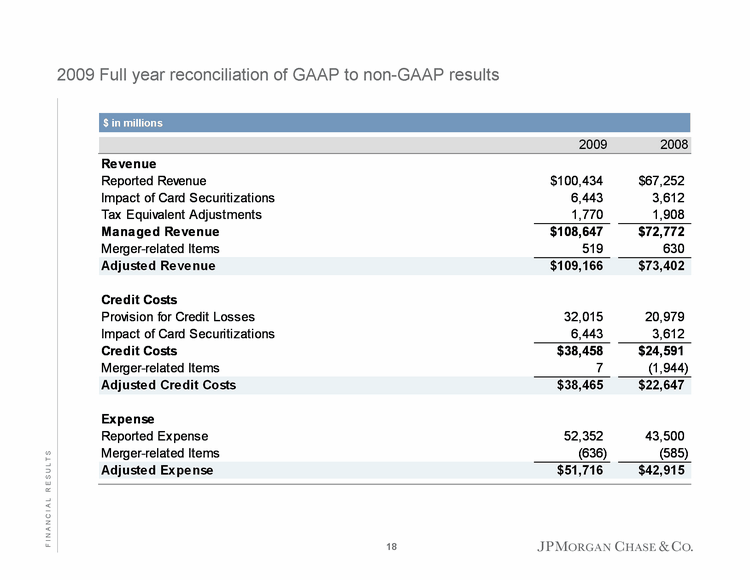
| 2009 Full year reconciliation of GAAP to non-GAAP results $ in millions 18 F I N A N C I A L R E S U L T S |
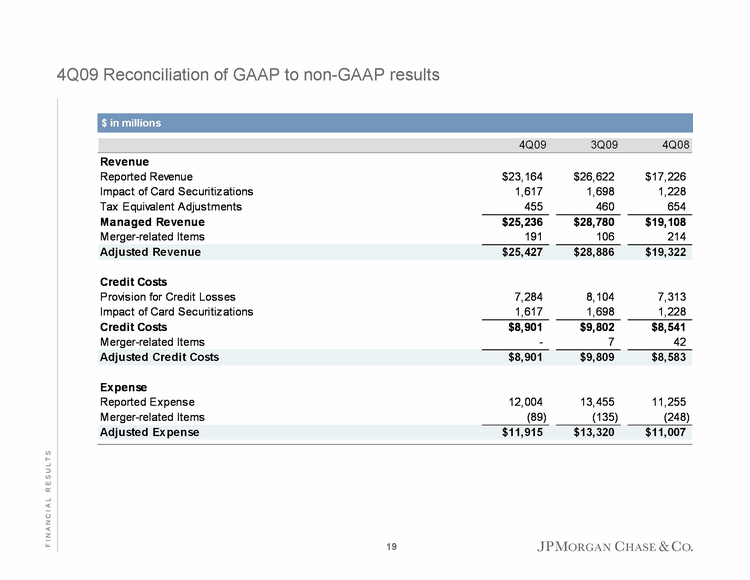
| 4Q09 Reconciliation of GAAP to non-GAAP results $ in millions 19 F I N A N C I A L R E S U L T S |
| Non-GAAP financial measures Financial results are presented on a managed basis, as such basis is described in the firm's Quarterly Reports on Form 10-Q for the quarters ended March 31, 2009, June 30, 2009 and September 30, 2009 and its Annual Report on Form 10-K for the year ended December 31, 2008. All non-GAAP financial measures included in this presentation are provided to assist readers in understanding certain trend information. Additional information concerning such non-GAAP financial measures can be found herein, to which reference is hereby made. The ratio for the allowance for loan losses to end-of-period loans excludes the following: loans accounted for at fair value and loans held- for-sale; purchased credit-impaired loans; the allowance for loan losses related to purchased credit-impaired loans; and, loans from the Washington Mutual Master Trust, which were consolidated on the firm's balance sheet at fair value during the second quarter of 2009. Additionally, Consumer Lending net charge-off rates exclude the impact of purchased credit-impaired loans. The allowance related to the purchased credit-impaired portfolio was $1.6 billion at December 31, 2009. Tier 1 Common Capital ("Tier 1 Common") is defined as Tier 1 capital less elements of capital not in the form of common equity - such as qualifying perpetual preferred stock, qualifying noncontrolling interest in subsidiaries and qualifying trust preferred capital debt securities. Tier 1 common capital, a non-GAAP financial measure, is used by banking regulators, investors and analysts to assess and compare the quality and composition of the Firm's capital with the capital of other financial services companies. The Firm uses Tier 1 common capital along with the other capital measures to assess and monitor its capital position. Tangible Common Equity ("TCE") is calculated, for all purposes, as common stockholders equity (i.e., total stockholders' equity less preferred stock) less identifiable intangible assets (other than MSRs) and goodwill, net of related deferred tax liabilities. Return on tangible common equity, a non-GAAP financial ratio, measures the Firm's earnings as a percentage of TCE, and is in management's view a meaningful measure to assess the Firm's use of equity. The TCE measures used in this presentation are not necessarily comparable to similarly titled measures provided by other firms due to differences in calculation methodologies. Headcount-related expense includes salary and benefits, and other noncompensation costs related to employees. Notes on non-GAAP financial measures and forward-looking statements Forward looking statements This presentation contains forward-looking statements within the meaning of the Private Securities Litigation Reform Act of 1995. Such statements are based upon the current beliefs and expectations of JPMorgan Chase's management and are subject to significant risks and uncertainties. Actual results may differ from those set forth in the forward-looking statements. Factors that could cause JPMorgan Chase's actual results to differ materially from those described in the forward-looking statements can be found in JPMorgan Chase's Quarterly Reports on Form 10-Q for the quarters ended March 31, 2009, June 30, 2009 and September 30, 2009 and its Annual Report on Form 10-K for the year ended December 31, 2008, each of which has been filed with the Securities and Exchange Commission and is available on JPMorgan Chase's website (www.jpmorganchase.com) and on the Securities and Exchange Commission's website (www.sec.gov). JPMorgan Chase does not undertake to update the forward-looking statements to reflect the impact of circumstances or events that may arise after the date of the forward-looking statements. 20 F I N A N C I A L R E S U L T S |