Attached files
| file | filename |
|---|---|
| 8-K - FORM 8-K - TEAM HEALTH HOLDINGS INC. | d8k.htm |
 TeamHealth (NYSE: TMH) Investor Presentation January 2010 Exhibit 99.1 |
| 2 Forward looking statement Statements made in this presentation that are not historical facts and that reflect the
current view of Team Health Holdings, Inc. (the “Company”) about
future events and financial performance are hereby identified as “forward looking statements.” Some of these statements can be identified by terms and phrases such as “anticipate,” “believe,” “intend,” “estimate,” “expect,” “continue,” “could,” “should,” “may,” “plan,” “project,” “predict” and similar expressions and include references to assumptions that we believe are reasonable and relate to our
future prospects, developments and business strategies. The Company cautions
participants in this presentation that such “forward looking
statements,” including without limitation, those relating to the Company’s future business prospects, revenues, working capital, professional
liability expense, liquidity, capital needs, interest costs and income,
wherever they occur in this presentation or in other statements attributable to the Company, are necessarily estimates reflecting the judgment of the Company’s senior management and involve a number of
risks and uncertainties that could cause actual results to differ materially
from those suggested by the “forward looking statements.”
Factors that could cause our actual results to differ materially from those expressed or implied in such forward-looking statements, include but are
not limited to those factors detailed from time to time in the
Company’s filings with the Securities and Exchange Commission.
The Company disclaims any intent or obligation to update “forward looking statements” made in this presentation to reflect changed assumptions, the occurrence of unanticipated events, or changes to future operating results over time. |
 3 Our Company Our Service Offerings • One of the leading providers of outsourced emergency department staffing as well as management and other services – Founded in 1979 – Serves ~560 hospital clients in 48 states – Affiliated with ~6,200 healthcare professionals • 79% of 2008 net revenues (1) from ED and hospital medicine • 98% client retention rate (2) • 95% physician retention rate (2) • Experienced management team • IPO completed December 2009 (NYSE:TMH) Specialty Services Pediatrics Radiology Hospital Medicine Locum Tenens Military Staffing Emergency Medicine (1) Represents net revenues less provision for uncollectibles. (2) Based on LTM as of September 30, 2009, calculated as full year 2008, minus 9 months
ended 9/30/08, plus 9 months ended 9/30/09. Anesthesia |
 4 • Strong and stable financial profile with attractive revenue, EBITDA, and free cash flow
growth • Long-term relationships generating recurring contractual revenue • Ability to leverage existing platform to support growth Investment Highlights Attractive Financial Platform Supporting Future Growth • Leading outsourced market position • Favorable industry dynamics • Outstanding reputation augmented by an attractive client base • Experienced management team • Regional operating model supported by a national infrastructure • Significant investment in proprietary information systems and processes • Standardized best practices Compelling value proposition drives and sustains long-term growth Leading ED Management Company Scalable Infrastructure |
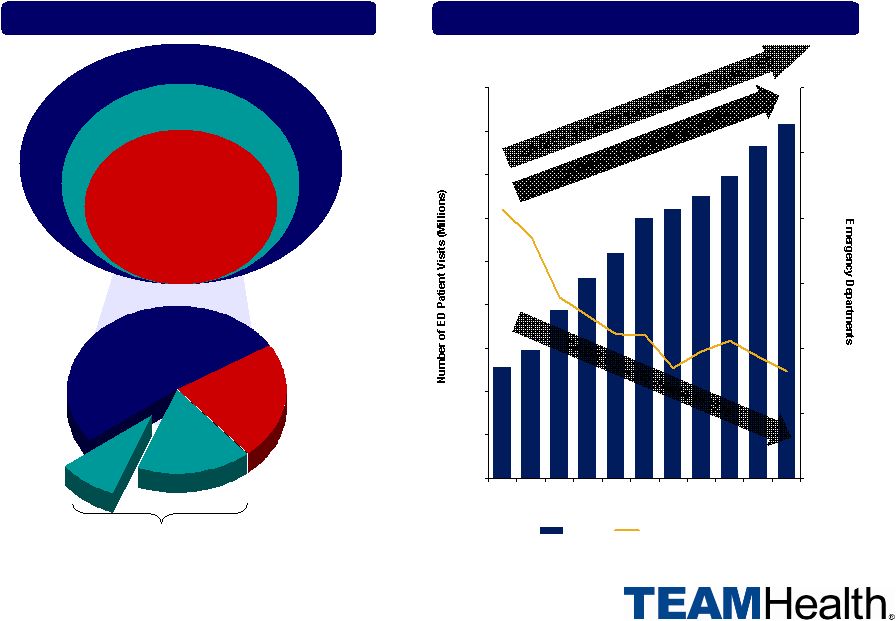       5 Leading Market Share with Favorable Industry Dynamics ~3,000 Outsourced EDs Team Health 9% Regional Groups 23% Local Groups 52% National Groups: 25% 67% Outsourced ~4,900 Community Hospitals Growth in ED Patient Visits (2) ED Market (1) 93 95 100 103 106 110 111 113 115 118 121 80 85 90 95 100 105 110 115 120 125 97 98 99 00 01 02 03 04 05 06 07 4,400 4,500 4,600 4,700 4,800 4,900 5,000 ED Visits Emergency Departments ~4,500 Hospitals with EDs (1) Management estimates (2) American Hospital Association |
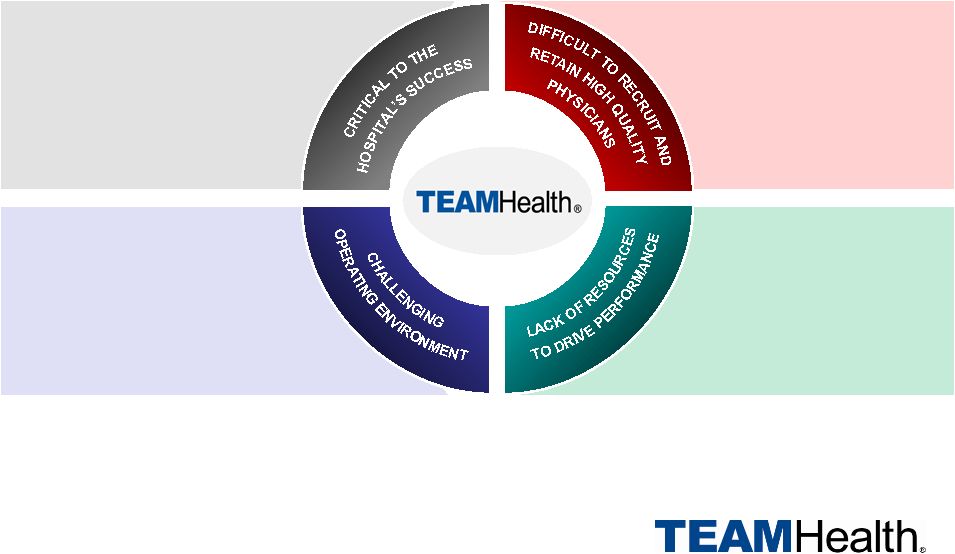 6 Why Hospitals Outsource the Emergency Department • Complex and constantly changing regulatory and reimbursement environment • Need to improve quality and efficiency of care, while driving down costs • Improve patient throughput times • Drive patient satisfaction • Increase third party quality outcome measures • Improve patient safety • Lack of infrastructure to recruit and retain physicians • Need to focus on other challenges facing the hospital • Entry point for the majority of hospital admissions • Drives market share for the hospital • Has significant impact on image of hospital in the community |
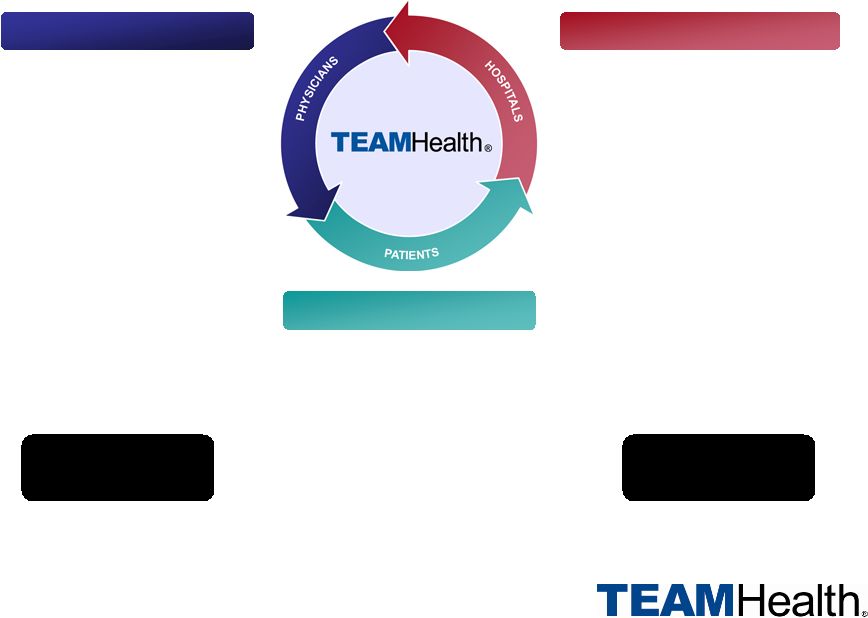 7 • Stable practice opportunities in well regarded hospitals • Competitive compensation packages • Comprehensive practice management support • Continuing medical education • Opportunities for career advancement • Long and outstanding reputation: – High quality physicians – Low physician turnover – High contract retention – High quality patient care and satisfaction – Financial stability • Customized approach for each hospital • Accountability for measurable outcomes • Significant resources and support Our Value Proposition Physicians Hospitals 98% Contract Retention Rate 95% Physician Retention Rate Patients • Outstanding quality care • Comprehensive risk management program • Focus on patient satisfaction |
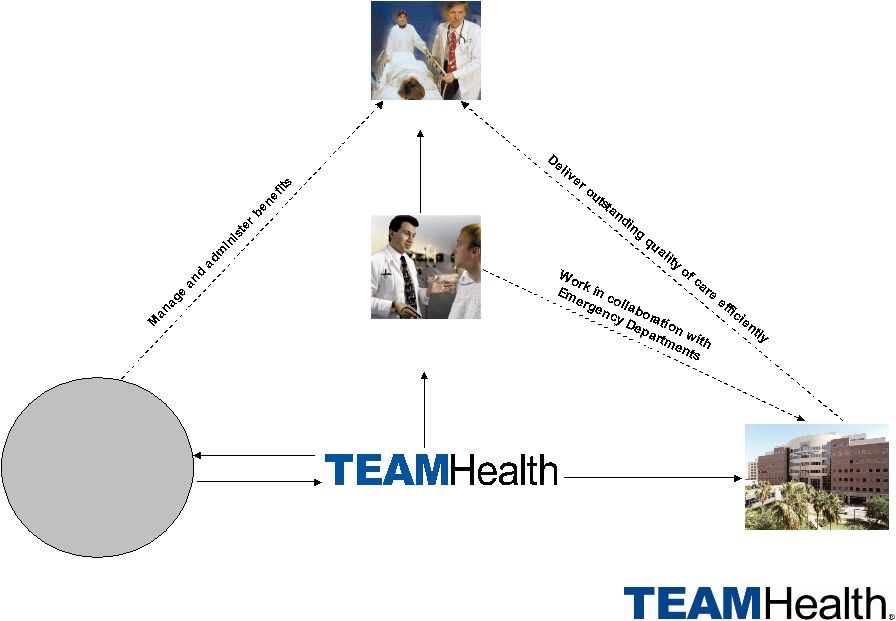 8 Our Proven Business Model Delivers Value to Multiple Constituents Payors (Commercial, Medicaid, Medicare, Contract, Self-Pay, Subsidy) Patients Physicians & Other Clinicians Bill Receive payments •Recruit & retain •Provide comprehensive services Client contract Hospitals |
 9 Regional Operating Model Supported by a National Infrastructure Scalable infrastructure drives operating efficiencies 9.5% 9.3% 8.8% 8.8% 8.7% FY 2006 FY 2007 FY 2008 9/30/2008 YTD 9/30/2009 YTD Favorable SG&A Margin Trend Drives Operating Efficiencies • Favorable SG&A margin trend since 2006 • Regional operating units are structured to absorb future growth • 13 regional operating units with local market knowledge • Centralized infrastructure • Three billing centers that process 8.2 million patient claims / year • One IT platform across the enterprise • Consolidated corporate functions such as Accounting, Payroll, Human Resources Investment in Infrastructure |
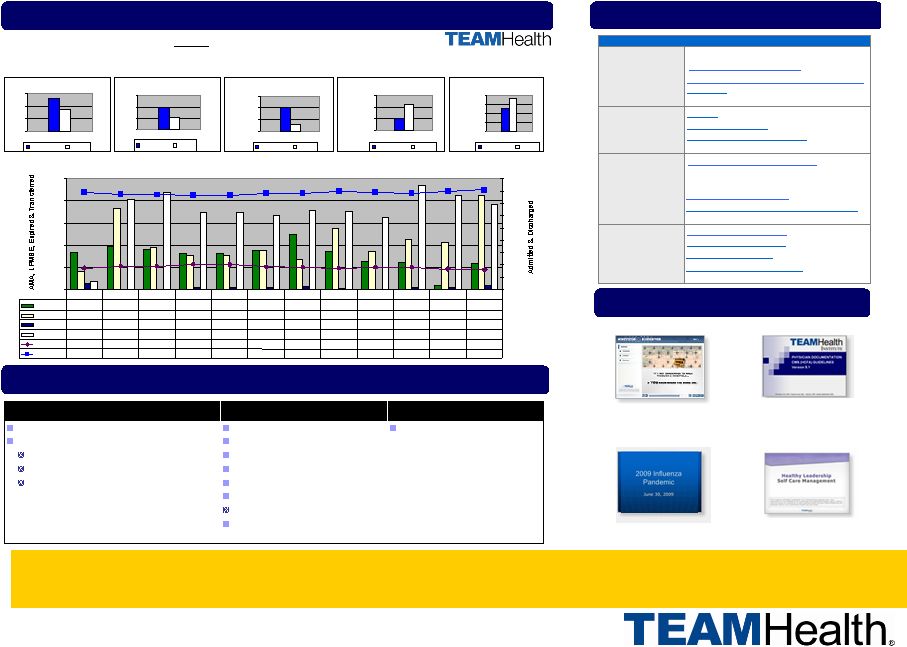 10 Significant Investment in Proprietary Systems and Processes… ED Dashboard Physician Information Systems Patient Satisfaction Monitoring Healthy Leadership Influenza Pandemic Physician Documentation Guidelines Online CME Activities Minefield Navigator Resources for ED Management Education Risk Management TH ED Listserve Emergency Cardiac Care Risk Management Alerts Nurse 411 Policies and Procedures ENERGY Modules Administrative Patient Safety Goals Clinical Suicide Prevention Tools Recretional Water Illnesses Wellness Tips Patient Education Influenza Pandemic TeamHealth Client Patient Disposition For DOS Between 2008/Oct - 2009/Sep Benchmark 2006 CDC National Average (updated as published) Source National Hospital Ambulatory Medical Care Survey : 2006 Emergency Department
Survey AMA 0.0% 0.5% 1.0% 1.5% Benchmark Facility LPMSE 0.0% 1.0% 2.0% 3.0% Benchmark Facility Expired 0.00% 0.10% 0.20% 0.30% Benchmark Facility Transferred 1.88% 1.90% 1.92% 1.94% Benchmark Facility Report Facts -LPMSE (Left Prior to Medical Screening Exam) is tracked in Medical Records Tracking
System (MRTS) -Data is rounded so totals may exceed 100% Admitted 0.0% 5.0% 10.0% 15.0% 20.0% Benchmark Facility 0.0% 0.5% 1.0% 1.5% 2.0% 2.5% 0.0% 10.0% 20.0% 30.0% 40.0% 50.0% 60.0% 70.0% 80.0% 90.0% AMA 0.842% 0.977% 0.920% 0.805% 0.805% 0.875% 1.235% 0.861% 0.644% 0.621% 0.099% 0.590% LPMSE 0.421% 1.832% 0.960% 0.762% 0.762% 0.875% 0.674% 1.377% 0.871% 1.133% 1.068% 2.131% Expired 0.126% 0.000% 0.000% 0.042% 0.042% 0.036% 0.075% 0.034% 0.000% 0.037% 0.038% 0.098% Transferred 0.190% 2.036% 2.201% 1.737% 1.737% 1.676% 1.796% 1.756% 1.629% 2.338% 2.136% 1.934% Admitted 17.607% 19.055% 19.128% 20.880% 20.288% 18.768% 18.189% 17.424% 18.258% 18.122% 16.857% 16.197% Discharged 79.360% 77.565% 77.271% 76.747% 76.747% 78.499% 78.630% 79.821% 79.091% 78.663% 79.863% 81.115% 2008 / Oct 2008 / Nov 2008 / Dec 2009 / Jan 2009 / Feb 2009 / Mar 2009 / Apr 2009 / May 2009 / Jun 2009 / Jul 2009 / Aug 2009 / Sep Five Stars Essentials Caring 1. Established ED Culture 2. Implemented Departmental Rounding 3. Inform Comfort 1. Pain 2. Comfort Rounds 3. Housekeeping Protocols Clinical & Operational Effectiveness 1. Nursing / Triage Protocols 2. Efficient Throughput 3. Quality Initiatives and Patient Safety Communication 1. ED Commnucations 2. Satisfaction Metrics 3. Patient Call Back 4. Complaint Management …focused on best practices, standardized processes and procedures, minimizing
liability risks and improving operating efficiencies
|
 11 Comprehensive and Effective Risk Management… + + Patient Safety Initiatives Claims Management Right Clients + + Professional Liability Cost as Percent of Total Net Revenue (1) 6.6% 6.0% 4.8% 4.5% 4.3% 3.8% 3.5% 2003 2004 2005 2006 2007 2008 YTD 9/30/09 …leading to favorable loss trends (1) Professional liability cost excludes favorable actuarial adjustments associated with
prior periods, including $1.6 million and $7.6 million in 2004 and 2005,
respectively. Net revenue represents net revenues less provision for
uncollectibles. |
 12 Increase Revenue from Existing Clients Leverage Value Proposition to Drive Growth Pursue Selective Acquisitions Pursue Opportunities in Adjacent Markets Win New Contracts |
 13 Attractive client base Revenue Cycle Performance 5.7% 9.0% 4.3% 9.3% 4.5% 5.9% 4.5% 5.7% 2002 2003 2004 2005 2006 2007 2008 YTD 9/30/09 (1) Represents growth in same contract net revenues less provision for
uncollectibles. Increase Revenue from Existing Clients Same contract revenue growth Attractive clients and revenue cycle performance drive sustainable organic growth
X X X = = = Patient volumes Revenue per Visit Same contract growth 1 |
 14 • Large and highly fragmented market – 3,000 EDs outsourced – Regional and local groups – 75% of outsourced EDs • Hospitals continue to face fiscal and operating pressures • Customized solutions through people, technology, and experience • $100 million annually generated from new contract revenue • Dedication of significant incremental resources to sales effort • Strong pipeline volume and competitive position Win New Contracts Disciplined approach to sales – right clients, right terms |
 15 • Established track record of acquisitions and seamless integration • Solidifies existing market share/new market entry • Adhere to strict set of criteria: – Good cultural fit – Accretive to earnings – Opportunity for immediate financial improvement • Expanded dedicated M&A team resources • Recent M&A activity – Emergency Physicians of Naples – November 30, 2009 • Robust pipeline Pursue Selective Acquisitions in Core ED Markets Growth opportunity in highly fragmented markets |
 16 • 58% of community hospitals have hospital medicine programs • 83% of hospitals > 200 beds have hospital medicine programs • 2 largest hospitalist provider • Technological advancements • Aging population • Inadequate supply of radiologists • Increase in surgical procedures • Highly fragmented market • Inadequate supply of anesthesiologists • Acquired Anesthetix – December 31, 2009 Pursue Opportunities in Adjacent Markets • Insufficient supply of physicians across specialties • Acquired Psychiatrists Only LLC – December 31, 2009 Hospitalist Market $8 BN Radiology Market $16 BN Anesthesia Market $15 BN Locum Tenens $1.5 BN Source: Management estimates. nd |
 17 Financial Overview |
 18 Financial Highlights and Overview • $40 million in 2008 and $74 million for YTD 2009 • Free cash flow CAGR: 48.1% (3)(4) Strong Financial Performance Significant Free Cash Flow (3) Stable Financial Profile • Net revenues (1) of $1.4 billion and adjusted EBITDA (excluding favorable actuarial adjustments associated with prior periods) of $142 million as of LTM (2) 9/30/09 • Revenue CAGR: 8.7% (3) • Adjusted EBITDA CAGR: 7.6% (3) • Improving SG&A margin trends delivering operating leverage – 8.8% of revenues in 2008 vs. 9.5% in 2006 • $198 million of available liquidity (as adjusted for the IPO and the use of proceeds by the Company) • No debt maturities until December 2012 (1) Represents net revenues less provision for uncollectibles. (2) LTM is calculated as full year 2008, minus 9 months ended 9/30/08, plus 9 months ended
9/30/09. (3) CAGR’s represent 2006 to 9/30/09 LTM. (4) Free Cash Flow = Net cash provided by operating activities less capital expenditures and change in investments at insurance subsidiary. (5) Reflects cash and cash equivalents, as adjusted for the IPO, of $80.3 million plus
$117.5 million of available funds under the Company’s revolving credit
facility. (5) |
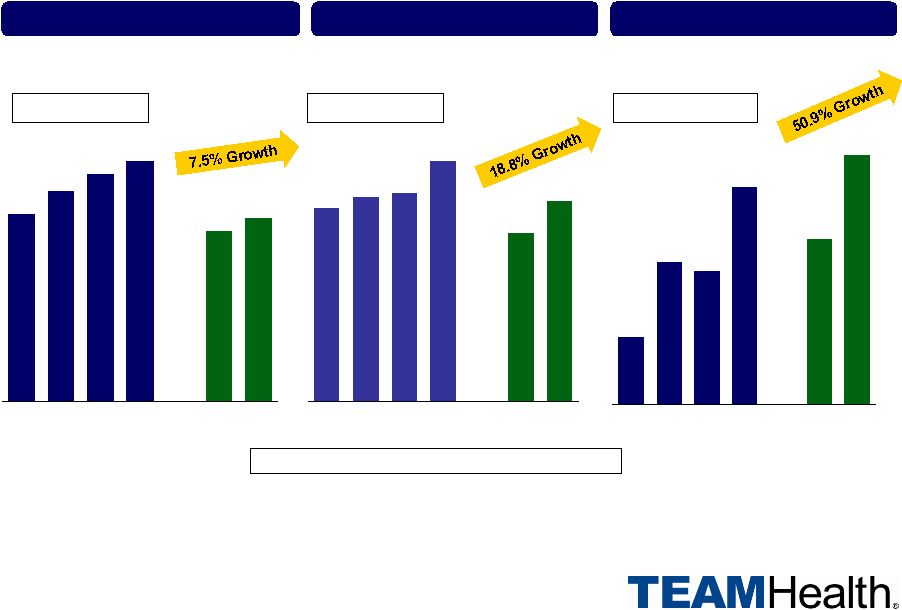 19 2006 2007 2008 9/30/09 LTM 9/30/08 YTD 9/30/09 YTD 2006 2007 2008 9/30/09 LTM 9/30/08 YTD 9/30/09 YTD Historical Financial Performance 2006 2007 2008 9/30/09 LTM 9/30/08 YTD 9/30/09 YTD Note: CAGR represents 2006 – LTM 09/30/09 (LTM is calculated as full year 2008, minus 9 months ended 9/30/08, plus 9 months ended 9/30/09). Net revenue represents net revenues less provision for uncollectibles. Adjusted EBITDA excludes favorable actuarial adjustments associated with
prior periods. $1,095 $114 $1,232 $121 $1,331 $100 Net Revenue Adjusted EBITDA $1,000 $123 $1,075 $118 Free Cash Flow $42 $49 $65 $74 CAGR: 8.7% $20 $1,406 $142 $40 Margin: 10.4% 9.8% 9.2%
10.1% 10.0% 11.0% CAGR: 7.6% CAGR: 48.1% |
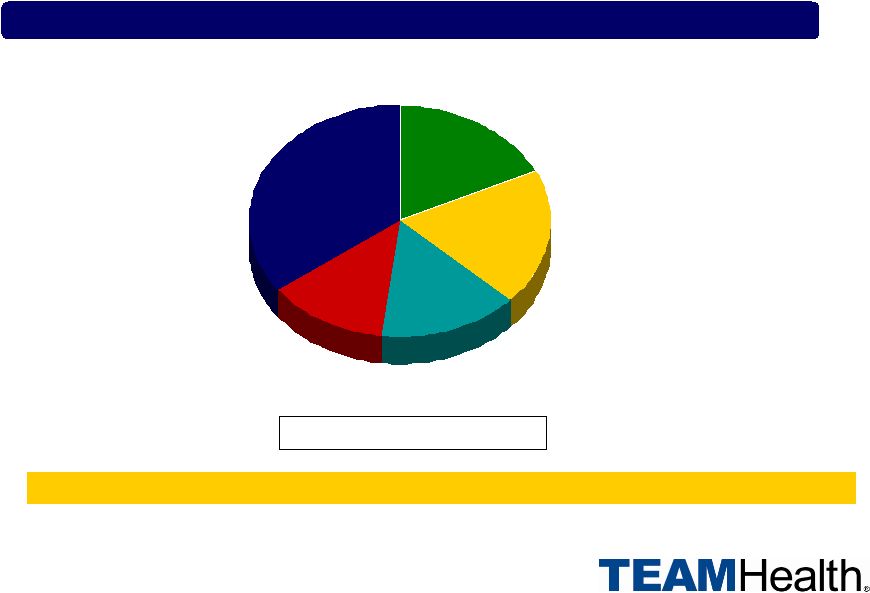 20 Long -Term Relationships Generating Recurring Contractual Revenue ED Contract Longevity 0-2 Years, 18% 2-4 Years, 19% 4-7 Years, 15% 7-10 Years, 13% 10 Years +, 35% 375 contracts as of 9/30/09 13 year average tenure of top 50 customers by net revenue |
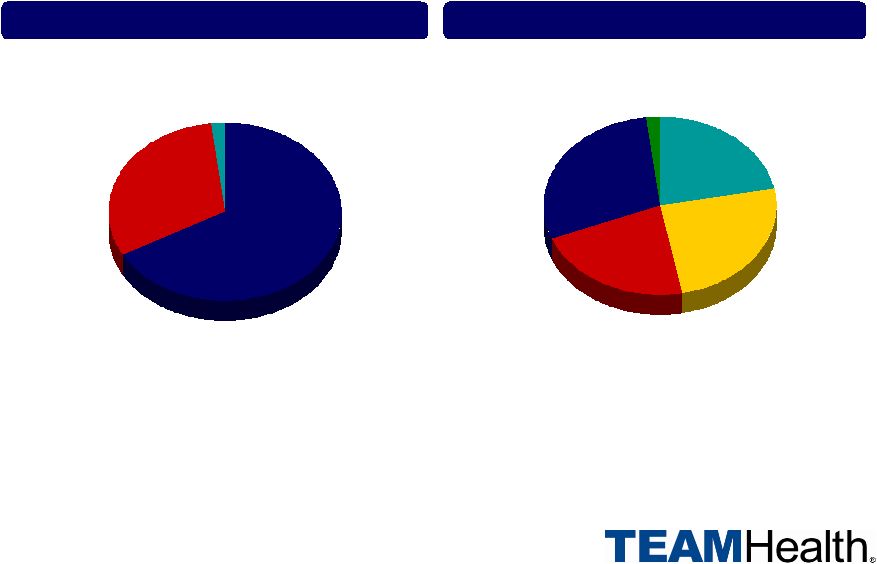 21 Payor Mix by Volume – 09/30/09 YTD Medicare, 22% Medicaid, 25% Self-pay, 22% Commercial, 29% Other, 2% Net Revenue Mix – 09/30/09 YTD (1) Fee For Service, 67% Contract, 31% Other, 2% Diversified Payor Mix Provides Stable Revenue Base (1) Represents net revenues less provision for uncollectibles. Of provision for
uncollectibles, 99.9% is allocated to fee for service revenue.
|
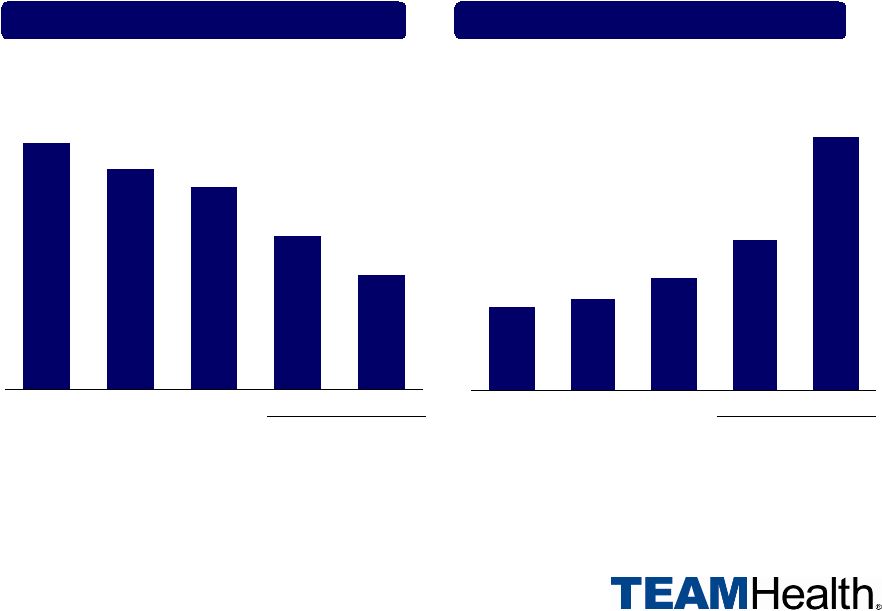 22 2006 2007 2008 2006 2007 2008 Proven Ability to De-lever Net Debt / Adjusted EBITDA (1) Adjusted EBITDA (1) / Interest 5.6x 5.0x 4.6x 2.0x 2.2x 2.7x 3.5x 3.6x 2.6x 6.5x Actual As Adjusted
(2) 9/30/09 Actual As
Adjusted (2) 9/30/09 (1) Adjusted EBITDA excludes favorable actuarial adjustments associated with prior
periods. (2) Adjusted for the receipt and use of the net proceeds from the IPO. Assumes debt
paydown with $183.5 million of primary proceeds at a 6.0% gross spread, with
$4.0 million of other transaction expenses and a 7% redemption premium
on existing bonds. |
 23 Capitalization (1) Assumes debt paydown with $183.5 million of primary proceeds at a 6.0% gross spread, with $4.0 million of other transaction expenses and a 7% redemption premium on existing bonds. (2) Based on LTM Adjusted EBITDA of $141.6 million excluding favorable actuarial adjustments
associated with prior periods. LTM is calculated as full year 2008, minus 9
months ended 9/30/08, plus 9 months ended 9/30/09. (3) Reflects total debt less cash. Capitalization Table (1) ($ in millions) Actual As Adjusted Maturity 9/30/2009 9/30/2009 Cash and Cash Equivalents $113.0 $80.3 Revolving Line of Credit ($125) Dec. 2011 0.0 0.0 Term Loan Dec. 2012 409.1 409.1 Total Secured Debt $409.1 $409.1 11.25% Senior Sub Notes Dec. 2013 203.0 45.5 Total Debt $612.1 $454.6 Shareholders Equity (228.3) (86.5) Total Capitalization $383.8 $368.1 Total Debt / Adjusted LTM EBITDA (2) 4.3x 3.2x Net Debt (3) / Adjusted LTM EBITDA (2) 3.5 2.6 |
 24 • Strong and stable financial profile with attractive revenue, EBITDA, and free cash flow
growth • Long-term relationships generating recurring contractual revenue • Ability to leverage existing platform to support growth Investment Highlights Attractive Financial Platform Supporting Future Growth • Leading outsourced market position • Favorable industry dynamics • Outstanding reputation augmented by an attractive client base • Experienced management team • Regional operating model supported by a national infrastructure • Significant investment in proprietary information systems and processes • Standardized best practices Compelling value proposition drives and sustains long-term growth Leading ED Management Company Scalable Infrastructure |
 25 Appendix |
 26 Adjusted EBITDA / Net Earnings Reconciliation and Free Cash Flow Calculation Reported Net Earnings to Adjusted EBITDA Reconciliation ($ in millions) 2006 2007 2008 9/30/2008 YTD 9/30/2009 YTD LTM 09/30/2009 (1) Net earnings $16.5 $43.3 $44.7 $50.1 $55.2 $49.8 Interest expense, net 57.8 55.2 45.8 34.0 27.7 39.5 Provision for income taxes 13.8 27.7 31.0 33.9 34.2 31.4 Depreciation and amortization 23.3 14.8 17.3 12.6 14.0 18.8 Loss from discontinued operations, net of taxes 7.0 0.6 0.0 0.0 0.0 0.0 Impairment of intangibles 0.0 0.0 9.1 0.0 0.0 9.1 Management fee and other expenses 3.7 4.1 3.6 2.7 2.3 3.2 Gain on extinguishment of debt 0.0 0.0 (1.6) 0.0 0.0 (1.6) Transaction costs 0.0 0.0 2.4 1.8 0.6 1.2 Restricted unit expense 0.6 0.6 0.6 0.4 0.6 0.7 Insurance subsidiary interest income 2.0 2.9 3.3 3.0 2.1 2.4 Severance and other charges 1.2 3.7 1.5 1.3 0.3 0.5 0.0 Adjusted EBITDA $126.0 $152.8 $157.8 $139.9 $137.1 $155.0 Favorable actuarial adjustments associated with prior periods 12.1 32.1 34.9 40.4 18.8 13.4 Adjusted EBITDA (as further adjusted to exclude favorable actuarial adjustments associated with prior periods) $113.9 $120.7 $122.9 $99.5 $118.2 $141.6 Free Cash Flow Calculation Net cash provided by operating activities (as reported) $49.6 $70.1 $62.0 $62.9 $84.6 $83.7 Capital expenditures (11.3) (12.7) (12.1) (7.3) (5.2) (10.0) Change in investments at insurance subsidiary (18.3) (15.2) (10.1) (6.3) (5.1) (8.9) Free Cash Flow $20.0 $42.2 $39.7 $49.2 $74.3 $64.8 Source: Company’s S-1. (1) LTM is calculated as full year 2008, minus 9 months ended 9/30/08, plus 9 months
ended 9/30/09. |