Attached files
| file | filename |
|---|---|
| 8-K - 8-K - AIkido Pharma Inc. | a10-1736_18k.htm |
Exhibit 99.1
|
|
San Francisco Presentation January 2010 Robert A. Lodder, Ph.D. President |
|
|
Forward-Looking Statement This presentation contains forward-looking statements that involve risks and uncertainties, including those described in the Company’s Annual Report for the year ended December 31, 2008 filed on Form 10-K, and most recent Quarterly Report filed on Form 10-Q. |
|
|
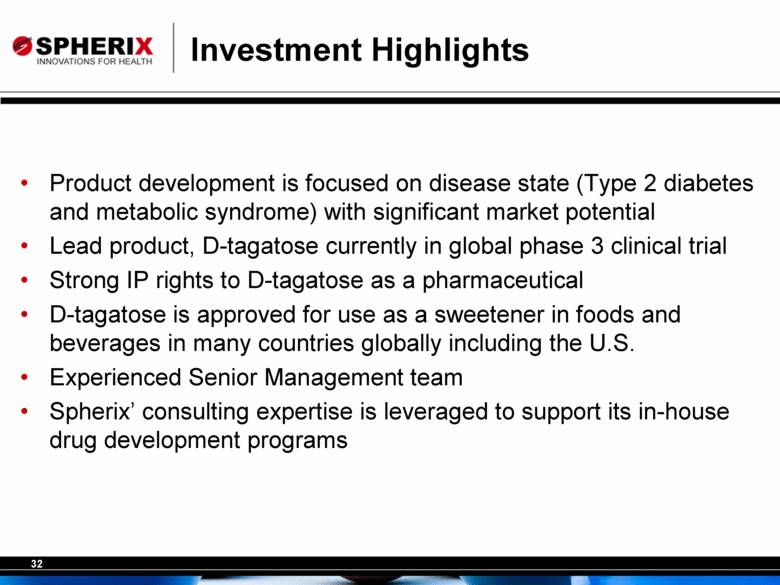
Investment Highlights Product development is focused on disease state (Type 2 diabetes and metabolic syndrome) with significant market potential Lead product, D-tagatose currently in global phase 3 clinical trial Strong IP rights to D-tagatose as a pharmaceutical D-tagatose is approved for use as a sweetener in foods and beverages in many countries globally including the U.S. Experienced Senior Management team Spherix’ consulting expertise is leveraged to support its in-house drug development programs |
|
|
Senior Management Team Claire L. Kruger, Ph.D., DABT, CEO Toxicologist with 20 years of consulting experience. Primary area of expertise is in pharmaceuticals, consumer products and foods, where she provides scientific, regulatory, and strategic support to clients in both the U.S. and international regulatory arenas. Robert A. Lodder, Ph.D. President Founder of InfraReDx, Inc. and Prescient Medical, Inc. Professor of Pharmaceutical Sciences at the College of Pharmacy, University of Kentucky Medical Center, he currently holds joint appointments in the Department of Electrical and Computer Engineering, and the Department of Chemistry at Kentucky. Robert L. Clayton, CPA, CFO 16 years of experience in finance and accounting. Previously served as Director of Finance and Controller. Randy Brown, BS, Chief of Operations 20 years in the pharmaceutical industry. Primary area of expertise is in large global clinical trials. Previous positions at Pfizer, Eli Lilly, and Genentech. Experience managing global trials in roughly 30 different countries including new emerging areas such as India. Ram Nimmagudda, Ph.D., Director of New Business Development 15 years of experience in business development, nutrition and nutraceutical industries, with particular expertise in novel food ingredients. Previous positions of Director of New Business Development for South Asia at DSM Functional Foods, Director and Sr. Principal Technologist, External Technologies at Wm. Wrigley Jr. Co. and Vice President of Technology Growth at Char. Hansen, Inc. |
|
|
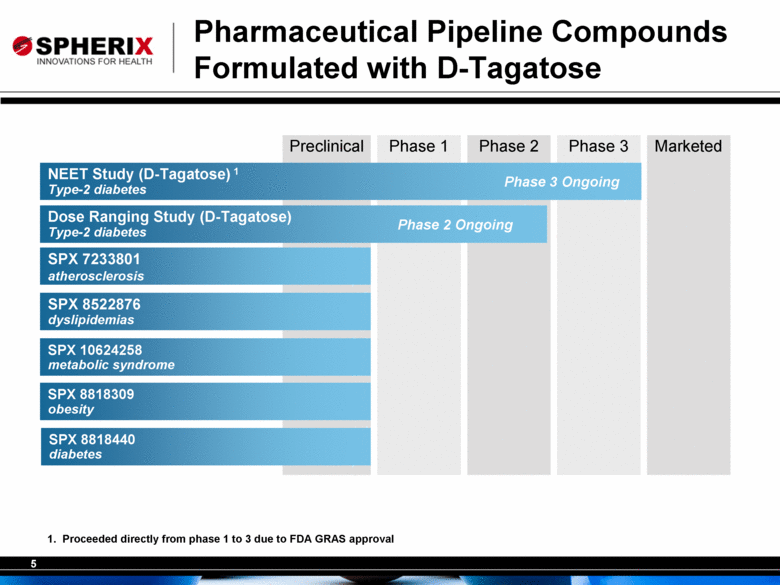
Preclinical Phase 1 Phase 2 Phase 3 Marketed Pharmaceutical Pipeline Compounds Formulated with D-Tagatose SPX 8522876 dyslipidemias Dose Ranging Study (D-Tagatose) Type-2 diabetes Phase 2 Ongoing SPX 7233801 atherosclerosis SPX 10624258 metabolic syndrome SPX 8818309 obesity SPX 8818440 diabetes NEET Study (D-Tagatose) 1 Type-2 diabetes Phase 3 Ongoing 1. Proceeded directly from phase 1 to 3 due to FDA GRAS approval |
|
|
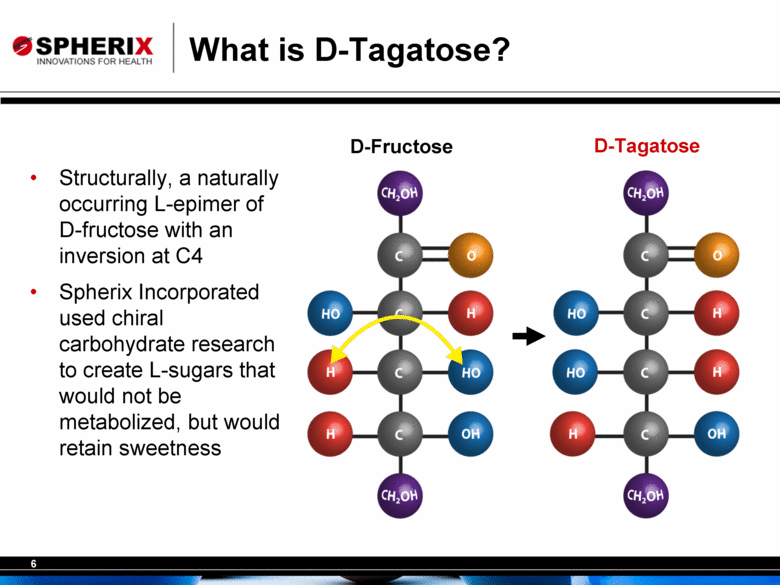
What is D-Tagatose? Structurally, a naturally occurring L-epimer of D-fructose with an inversion at C4 Spherix Incorporated used chiral carbohydrate research to create L-sugars that would not be metabolized, but would retain sweetness D-Tagatose D-Fructose |
|
|
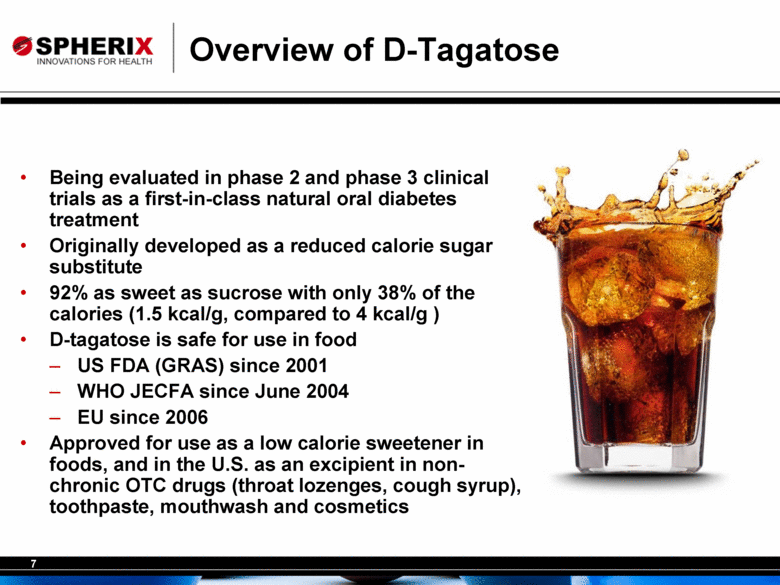
Overview of D-Tagatose Being evaluated in phase 2 and phase 3 clinical trials as a first-in-class natural oral diabetes treatment Originally developed as a reduced calorie sugar substitute 92% as sweet as sucrose with only 38% of the calories (1.5 kcal/g, compared to 4 kcal/g ) D-tagatose is safe for use in food US FDA (GRAS) since 2001 WHO JECFA since June 2004 EU since 2006 Approved for use as a low calorie sweetener in foods, and in the U.S. as an excipient in non-chronic OTC drugs (throat lozenges, cough syrup), toothpaste, mouthwash and cosmetics |
|
|
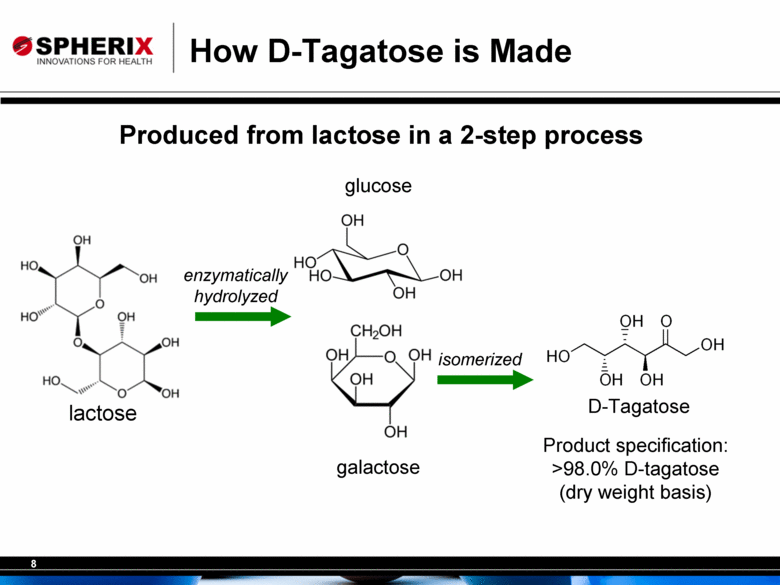
How D-Tagatose is Made Produced from lactose in a 2-step process lactose galactose glucose D-Tagatose isomerized enzymatically hydrolyzed Product specification: >98.0% D-tagatose (dry weight basis) |
|
|
What Makes D-Tagatose Different? Approved for use in food; established safety profile Chemically, it is an epimer of fructose with an inversion at C4 Behaves like and contains the identical constituent elements as L-tagatose but the human body lacks the enzymes to efficiently metabolize its structure D-Tagatose is poorly absorbed in the small intestine (25%), prevents the stimulation of insulin secretion (no beta cell exhaustion) and naturally lowers blood glucose levels Absorbed D-tagatose is metabolized to CO2 and H20, at a slower rate compared to related sugars (e.g., fructose and glucose) Passes to lower intestine, where it is fermented by bacteria to produce short-chain fatty acids and carbon dioxide |
|
|
Established Safety Profile of D-Tagatose Preclinical studies (rodents) Acute: LD50 > 10 g/kg Subchronic : 28 day, 90 day, 13-Week: NOAEL at 5% in diet 2 Years: NOAEL at 5% in diet No maternal toxicity, embryotoxicity, or teratogenicity up to 20 g/kg/day (gavage) Not genotoxic Clinical studies Over 20 studies in healthy, diabetic, hyperuricemic or gouty individuals, at doses up to 25 g per eating occasion and 75 g per day reported gastrointestinal symptoms that were mild and transient; no adverse effects on clinical chemistries, hematological parameters or urinary endpoints. Types and severity of gastrointestinal symptoms similar to other incompletely absorbed carbohydrates or polyols. |
|
|
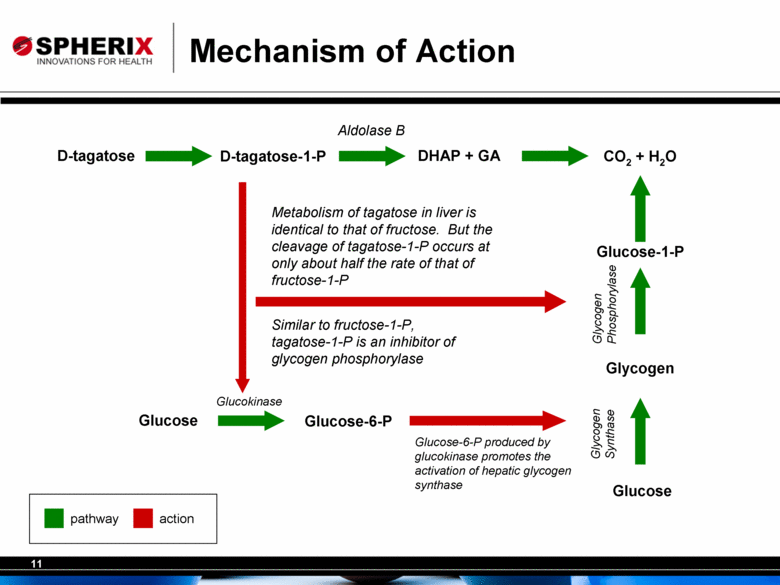
Mechanism of Action D-tagatose D-tagatose-1-P DHAP + GA CO2 + H2O Glucose Glucose-6-P Glucose Glycogen Aldolase B Glucokinase Metabolism of tagatose in liver is identical to that of fructose. But the cleavage of tagatose-1-P occurs at only about half the rate of that of fructose-1-P Glycogen Synthase Glucose-6-P produced by glucokinase promotes the activation of hepatic glycogen synthase Glucose-1-P Glycogen Phosphorylase Similar to fructose-1-P, tagatose-1-P is an inhibitor of glycogen phosphorylase pathway action |
|
|
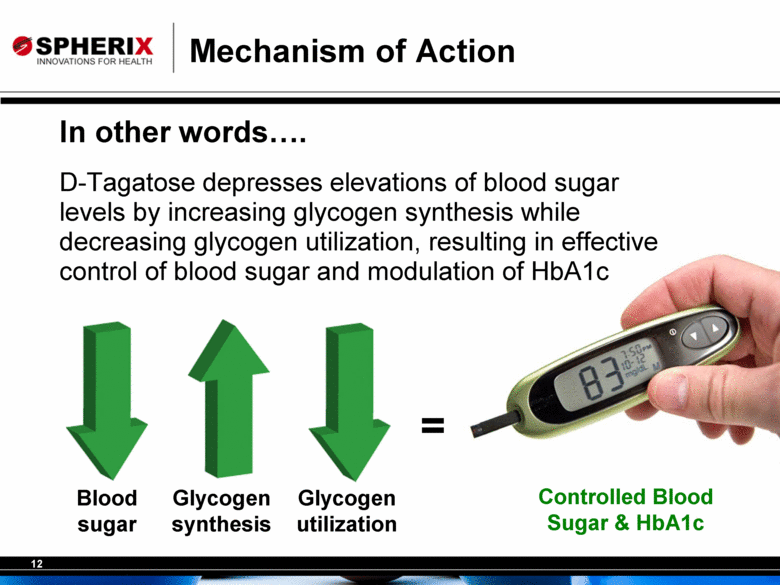
Mechanism of Action In other words.... D-Tagatose depresses elevations of blood sugar levels by increasing glycogen synthesis while decreasing glycogen utilization, resulting in effective control of blood sugar and modulation of HbA1c Blood sugar Glycogen synthesis Glycogen utilization = Controlled Blood Sugar & HbA1c |
|
|
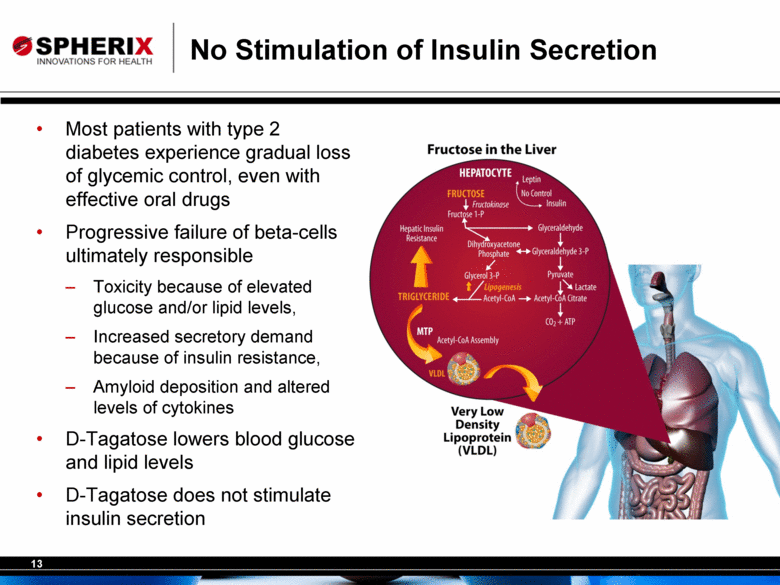
No Stimulation of Insulin Secretion Most patients with type 2 diabetes experience gradual loss of glycemic control, even with effective oral drugs Progressive failure of beta-cells ultimately responsible Toxicity because of elevated glucose and/or lipid levels, Increased secretory demand because of insulin resistance, Amyloid deposition and altered levels of cytokines D-Tagatose lowers blood glucose and lipid levels D-Tagatose does not stimulate insulin secretion |
|
|
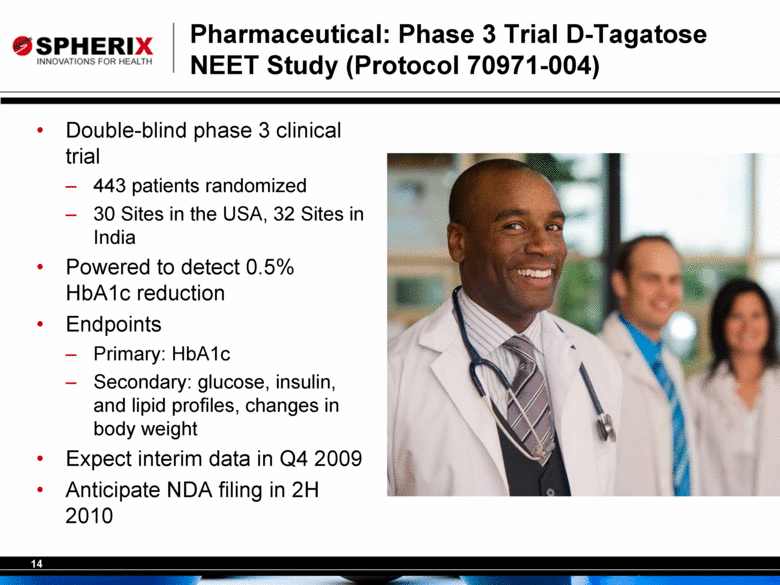
Pharmaceutical: Phase 3 Trial D-Tagatose NEET Study (Protocol 70971-004) Double-blind phase 3 clinical trial 443 patients randomized 30 Sites in the USA, 32 Sites in India Powered to detect 0.5% HbA1c reduction Endpoints Primary: HbA1c Secondary: glucose, insulin, and lipid profiles, changes in body weight Expect interim data in Q4 2009 Anticipate NDA filing in 2H 2010 |
|
|
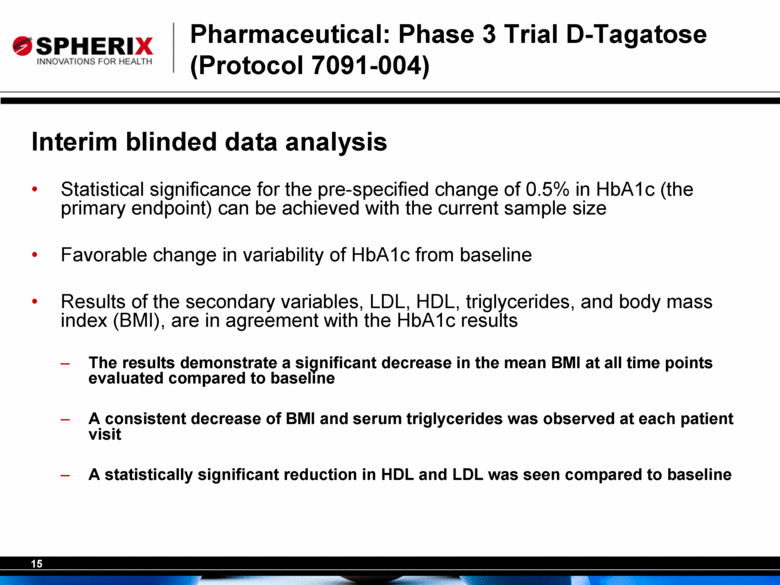
Pharmaceutical: Phase 3 Trial D-Tagatose (Protocol 7091-004) Interim blinded data analysis Statistical significance for the pre-specified change of 0.5% in HbA1c (the primary endpoint) can be achieved with the current sample size Favorable change in variability of HbA1c from baseline Results of the secondary variables, LDL, HDL, triglycerides, and body mass index (BMI), are in agreement with the HbA1c results The results demonstrate a significant decrease in the mean BMI at all time points evaluated compared to baseline A consistent decrease of BMI and serum triglycerides was observed at each patient visit A statistically significant reduction in HDL and LDL was seen compared to baseline |
|
|
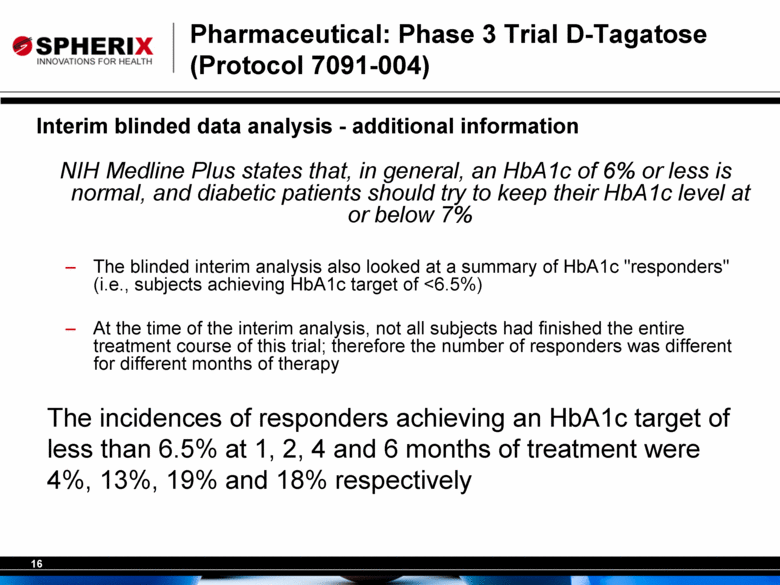
Interim blinded data analysis - additional information NIH Medline Plus states that, in general, an HbA1c of 6% or less is normal, and diabetic patients should try to keep their HbA1c level at or below 7% The blinded interim analysis also looked at a summary of HbA1c "responders" (i.e., subjects achieving HbA1c target of <6.5%) At the time of the interim analysis, not all subjects had finished the entire treatment course of this trial; therefore the number of responders was different for different months of therapy The incidences of responders achieving an HbA1c target of less than 6.5% at 1, 2, 4 and 6 months of treatment were 4%, 13%, 19% and 18% respectively Pharmaceutical: Phase 3 Trial D-Tagatose (Protocol 7091-004) |
|
|
Pharmaceutical: Phase 2 Trial D-Tagatose (Protocol 70971-005) To evaluate the dose-response effect of minimal doses of D-tagatose on glycemic control in subjects with type 2 diabetes under diet control and exercise Phase 2 Six-month Multi-center Single-blinded Randomized Parallel clinical study |
|
|
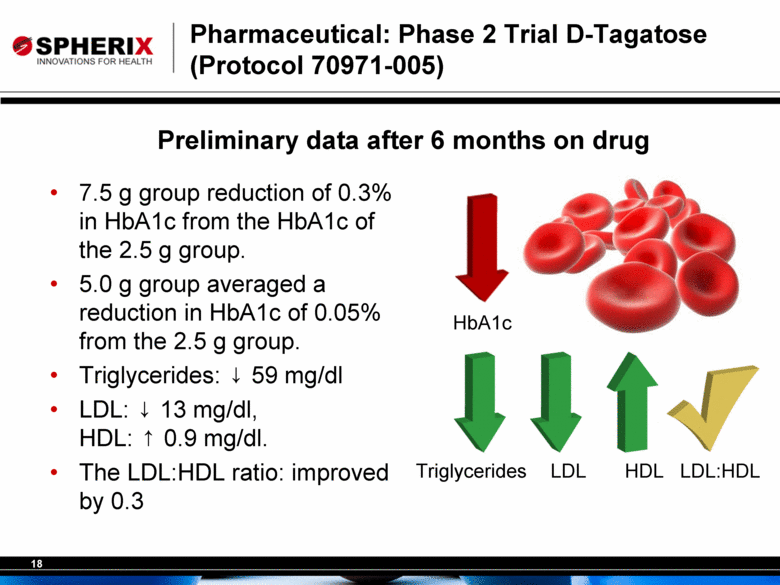
7.5 g group reduction of 0.3% in HbA1c from the HbA1c of the 2.5 g group. 5.0 g group averaged a reduction in HbA1c of 0.05% from the 2.5 g group. Triglycerides: 59 mg/dl LDL: 13 mg/dl, HDL: 0.9 mg/dl. The LDL:HDL ratio: improved by 0.3 Triglycerides LDL HDL LDL:HDL Preliminary data after 6 months on drug HbA1c Pharmaceutical: Phase 2 Trial D-Tagatose (Protocol 70971-005) |
|
|
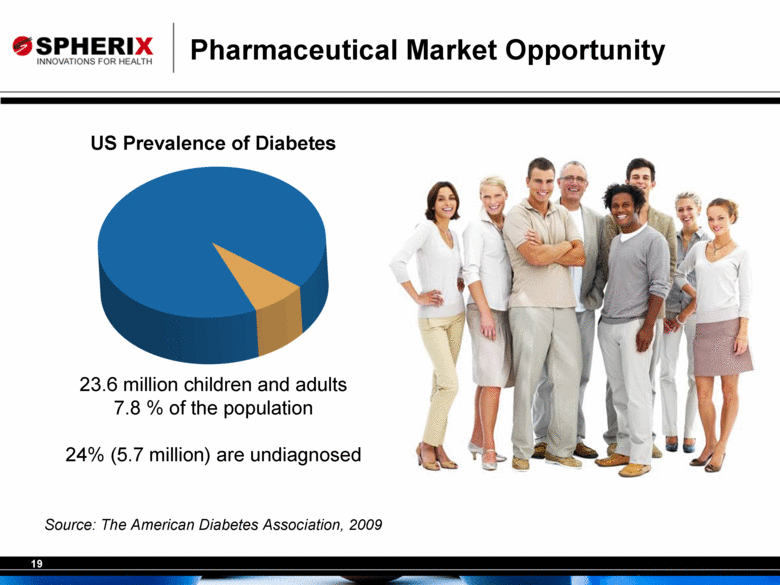
Pharmaceutical Market Opportunity Source: The American Diabetes Association, 2009 23.6 million children and adults 7.8 % of the population 24% (5.7 million) are undiagnosed US Prevalence of Diabetes |
|
|
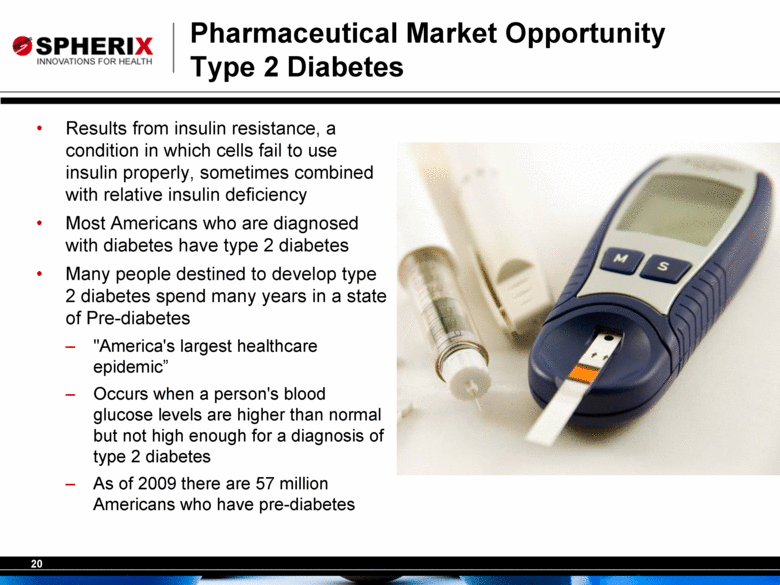
Pharmaceutical Market Opportunity Type 2 Diabetes Results from insulin resistance, a condition in which cells fail to use insulin properly, sometimes combined with relative insulin deficiency Most Americans who are diagnosed with diabetes have type 2 diabetes Many people destined to develop type 2 diabetes spend many years in a state of Pre-diabetes "America's largest healthcare epidemic” Occurs when a person's blood glucose levels are higher than normal but not high enough for a diagnosis of type 2 diabetes As of 2009 there are 57 million Americans who have pre-diabetes |
|
|
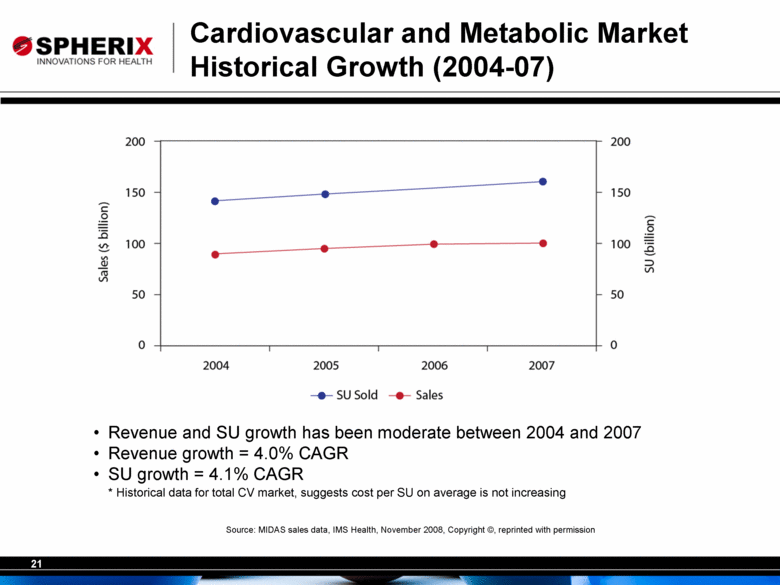
Revenue and SU growth has been moderate between 2004 and 2007 Revenue growth = 4.0% CAGR SU growth = 4.1% CAGR * Historical data for total CV market, suggests cost per SU on average is not increasing Source: MIDAS sales data, IMS Health, November 2008, Copyright ©, reprinted with permission Cardiovascular and Metabolic Market Historical Growth (2004-07) |
|
|
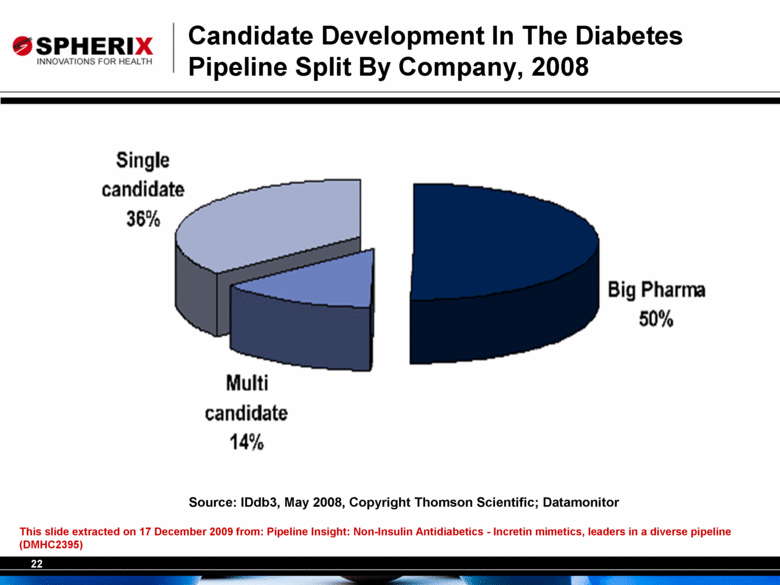
Candidate Development In The Diabetes Pipeline Split By Company, 2008 This slide extracted on 17 December 2009 from: Pipeline Insight: Non-Insulin Antidiabetics - Incretin mimetics, leaders in a diverse pipeline (DMHC2395) Source: IDdb3, May 2008, Copyright Thomson Scientific; Datamonitor |
|
|
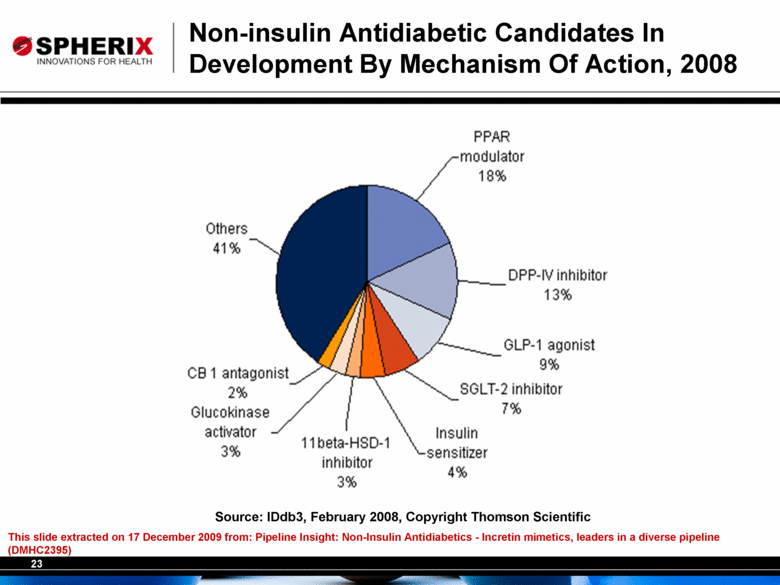
Non-insulin Antidiabetic Candidates In Development By Mechanism Of Action, 2008 This slide extracted on 17 December 2009 from: Pipeline Insight: Non-Insulin Antidiabetics - Incretin mimetics, leaders in a diverse pipeline (DMHC2395) Source: IDdb3, February 2008, Copyright Thomson Scientific |
|
|
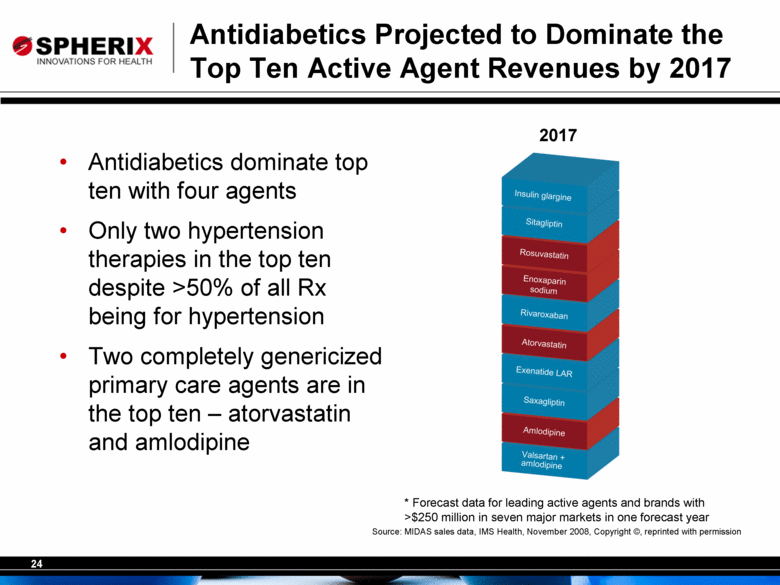
Antidiabetics Projected to Dominate the Top Ten Active Agent Revenues by 2017 Antidiabetics dominate top ten with four agents Only two hypertension therapies in the top ten despite >50% of all Rx being for hypertension Two completely genericized primary care agents are in the top ten – atorvastatin and amlodipine Source: MIDAS sales data, IMS Health, November 2008, Copyright ©, reprinted with permission * Forecast data for leading active agents and brands with >$250 million in seven major markets in one forecast year 2017 |
|
|
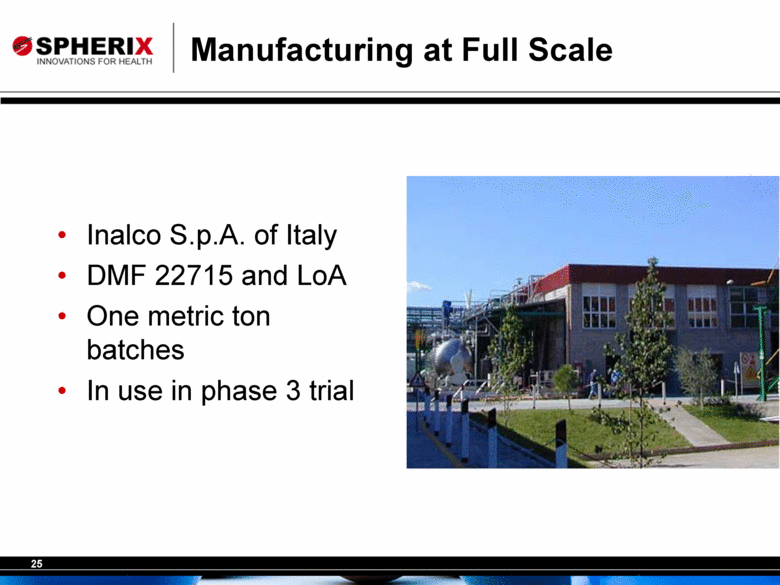
Manufacturing at Full Scale Inalco S.p.A. of Italy DMF 22715 and LoA One metric ton batches In use in phase 3 trial |
|
|
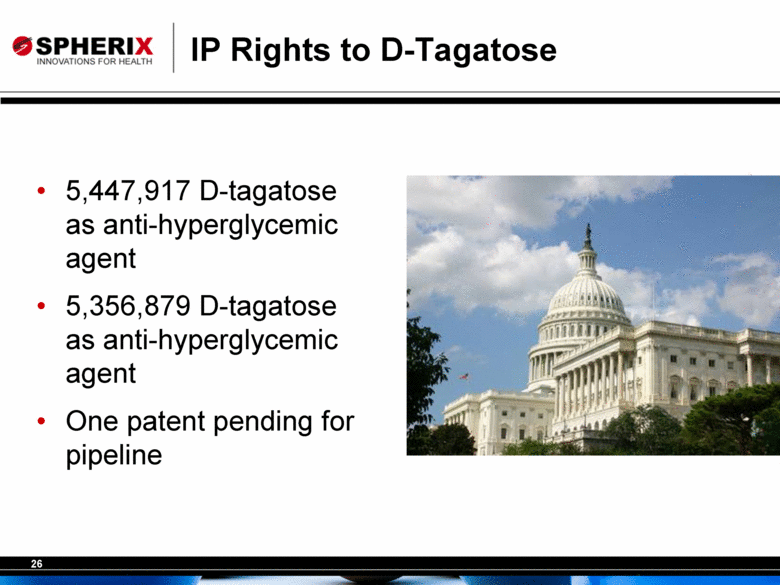
IP Rights to D-Tagatose 5,447,917 D-tagatose as anti-hyperglycemic agent 5,356,879 D-tagatose as anti-hyperglycemic agent One patent pending for pipeline |
|
|
Extension of Exclusivity New Chemical Entity Exclusivity (Hatch-Waxman) 5-year period of exclusivity is granted to new drug products containing chemical entities never previously approved by FDA either alone or in combination |
|
|
Extension of Exclusivity Patent Term Extension Up to 5 years of patent extension for creating innovative products that benefit the public. Includes most products regulated by FDA Must be the first commercial marketing under the provision of the law which such regulatory review occurred FDA assists patent trademark office (PTO) in determining a products eligibility for patent extension |
|
|
Extension of Exclusivity Pediatric Exclusivity Six months exclusivity as an incentive to sponsors to conduct more studies of the use of drug in pediatric populations Attaches to the END of all existing marketing exclusivity and patent periods. (Hatch/Waxman exclusivity and patent periods run concurrently) |
|
|
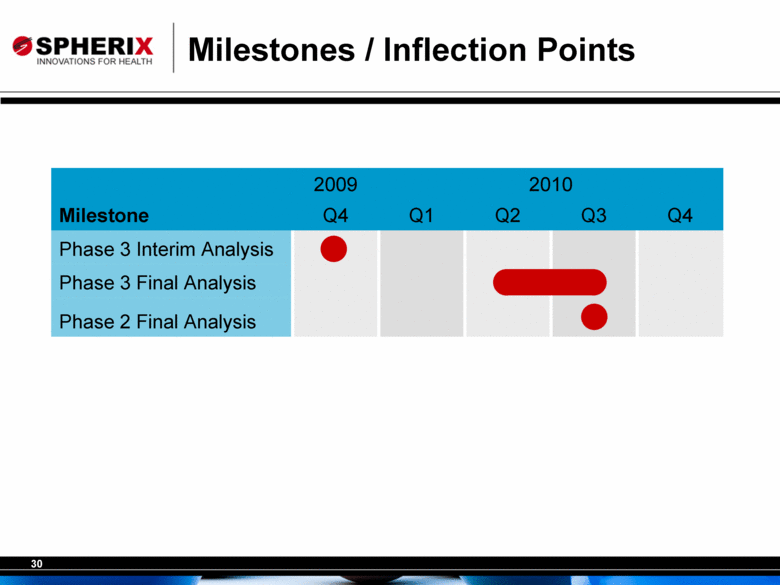
Milestones / Inflection Points 2009 2010 Milestone Q4 Q1 Q2 Q3 Q4 Phase 3 Interim Analysis • Phase 3 Final Analysis • Phase 2 Final Analysis |
|
|
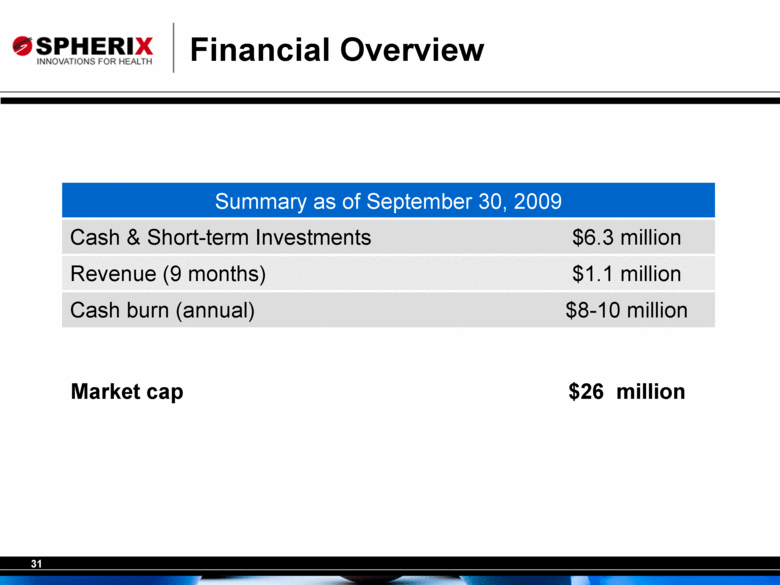
Financial Overview Summary as of September 30, 2009 Cash & Short-term Investments $6.3 million Revenue (9 months) $1.1 million Cash burn (annual) $8-10 million Market cap $26 million |
|
|
Investment Highlights Product development is focused on disease state (Type 2 diabetes and metabolic syndrome) with significant market potential Lead product, D-tagatose currently in global phase 3 clinical trial Strong IP rights to D-tagatose as a pharmaceutical D-tagatose is approved for use as a sweetener in foods and beverages in many countries globally including the U.S. Experienced Senior Management team Spherix’ consulting expertise is leveraged to support its in-house drug development programs |

