Attached files
| file | filename |
|---|---|
| 8-K - FORM 8-K - NEWFIELD EXPLORATION CO /DE/ | nfx8k-01122010.htm |
| EX-99.2 - PRESS RELEASE - NEWFIELD EXPLORATION CO /DE/ | nfx8k-01122010ex992.htm |
Exhibit
99.1

@NFX is
periodically published to keep shareholders aware of current operating
activities at Newfield. It may include estimates of expected production volumes,
costs and expenses, recent changes to hedging positions and commodity
pricing.
January
12, 2010 – Goldman Sachs Conference
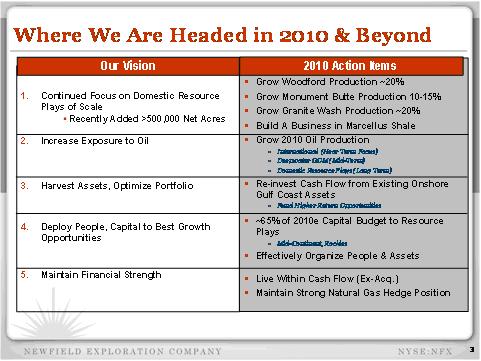
Newfield
Exploration Company will disclose the following information at the 2010 Goldman
Sachs Energy Conference in Tampa, Florida.
The Rocky
Mountains:
Uinta Basin – Newfield has
more than 200,000 gross acres (more than 150,000 net) in the Uinta Basin. The
region is the centerpiece of the Company’s domestic oil assets. Major field
areas in the Uinta Basin include Monument Butte, the adjoining Ute Tribal
acreage and Horseshoe Bend (located 15 miles northeast of Monument
Butte).
Recent
drilling successes highlight the potential on the Ute Tribal acreage -- an area
encompassing 63,000 gross acres immediately north of Monument Butte. To date,
the Company has drilled 65 wells on the Tribal acreage and current gross
production is approximately 1,500 BOPD. An operated rig will be dedicated to
drill wells on this acreage throughout 2010. Notable recent wells
include:
|
·
|
A
step-out Tribal well extended production approximately 10 miles to the
west of known field production. The well averaged 400 BOPD over the first
three days of production. (Date of first production: Dec. 10,
2009)
|
|
·
|
A
Tribal well drilled about four miles northeast of Monument Butte averaged
85 BOPD during its initial month on production. (Date of first production:
Nov. 19, 2009)
|
|
·
|
Two
wells drilled on an NFX fee lease north of Monument Butte averaged 344
BOPD and 396 BOPD, respectively, during their initial week on line. (Date
of first production: Dec. 5, 1009 and Dec.14,
2009)
|
|
·
|
Historical
average initial production rates (approximately 1,300 producing wells) are
65-80 BOPD.
|
Newfield
plans to run at least five operated rigs in its Monument Butte field area in
2010. Current gross production is approximately 16,500 BOPD. Production from the
Monument Butte field area is expected to grow more than 10-15% in
2010.
Over the
last several years, Newfield has been pursuing the formation and approval of a
“super unit” in the Monument Butte field. The super unit, approved in December
2009, consolidates all of the previously existing units and non-unitized leases
and allows for waterflood operations across common interests and 20-acre infill
drilling on previous unit or lease line boundaries. The super unit approval will
allow for additional oil reserves to be booked as proved at year-end
2009.
1
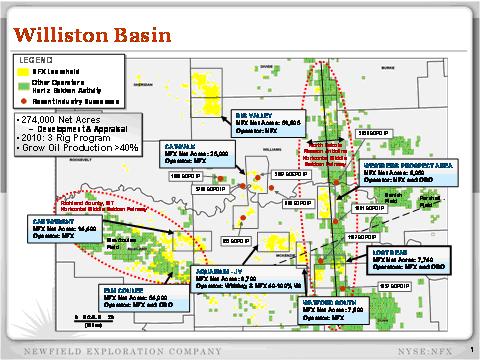
Williston
and Southern Alberta Basin - Newfield has more than
500,000 net acres, which includes more than 330,000 highly-prospective net acres
in the Williston and Southern Alberta Basins. The table below categorizes the
net acres by development, appraisal or exploration. Newfield expects to run a
three to four rig program in 2010 to expedite the evaluation of the acreage and
grow oil production by an estimated 40% over 2009 levels.
In the
Williston Basin, Newfield has ramped up drilling in its core development areas,
located primarily along the Nesson Anticline (see map on Newfield
website).
|
·
|
The
most recent well, drilled in the Westberg development area, the Clear
Creek State 1-36H, had an initial gross 24-hour production rate of 1,300
BOEPD, nearly double the offset wells previously drilled
(2008-09). The well’s first production was Dec. 9,
2009.
|
In 2010,
Newfield plans to drill 22 development wells in the Williston Basin. One rig
will be dedicated exclusively to appraising the Catwalk, Aquarium and Watford
areas where three successful wells have been drilled to date.
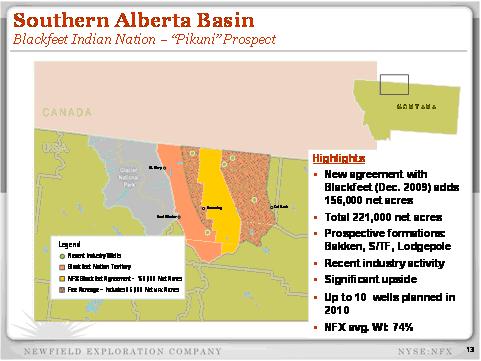
In the
Southern Alberta Basin, Newfield now has 221,000 net acres – including 156,000
net acres added through a new exploration venture with the Blackfeet Indian
Nation. The acreage is located in Glacier County, Montana. The area is
geologically similar to the Williston Basin and is prospective in the oil
bearing Bakken, Three Forks and Lodgepole formations. The Company plans to drill
up to 10 wells on the acreage in 2010.
The
following table details Newfield’s significant oil plays in the Rocky Mountain
Region:
2
Rocky
Mountain Oil Summary
|
Field
|
Acres,
Gross/Net
|
Gross
operated remaining locations
|
Gross
EUR/well (BOE)
|
Est.
Well Cost ($/MM)
|
Effective
W.I.
|
Total
Gross Unrisked Resource Reserve Potential (MMBOE)
|
Total
Net Unrisked Resource Reserve Potential (MMBOE)
|
|||||||||||||||||||||
|
UINTA
BASIN
|
||||||||||||||||||||||||||||
|
Mon.
Butte,
Ute
Tribal
H.
Bend
|
207,000 / 156,250 | 4,700 | (1) | 70,000 | $ | 0.9 | 75 | % | 400 | 246 | ||||||||||||||||||
|
WILLISTON
BASIN
|
||||||||||||||||||||||||||||
|
Development
Areas
|
||||||||||||||||||||||||||||
|
Westberg
/
Lost
Bear
|
34,882 / 17,790 | 66 | (3) | 360,000 | $ | 4.2 | 51 | % | 22 | 10 | ||||||||||||||||||
|
Appraisal
Areas
|
||||||||||||||||||||||||||||
|
Catwalk,
Aquarium,
Watford
|
78,181 / 43,000 | 338 | (2) | 354,000 | $ | 4.2 | 48 | % | 119 | 50 | ||||||||||||||||||
|
Big
Valley
|
67,222 / 48,400 | 70 | (3) | 224,000 | $ | 3.5 | 72 | % | 16 | 9 | ||||||||||||||||||
|
Other
Acreage
(expires
2010)
|
240,000 / 240,000 | |||||||||||||||||||||||||||
|
SOUTHERN
ALBERTA BASIN
|
||||||||||||||||||||||||||||
|
Exploration
Areas
|
||||||||||||||||||||||||||||
|
Blackfeet
Nation
|
156,600 / 156,600 | 488 | (3) | 225,000 | $ | 3.5 | 100 | % | 110 | 90 | ||||||||||||||||||
|
Whitegrass
Fee
|
100,000 / 65,000 | 456 | (3) | 225,000 | $ | 3.5 | 35 | % | 102 | 29 | ||||||||||||||||||
|
TOTAL
ROCKY MOUNTAINS
|
883,885 / 727,040 | 6,118 | - | - | - | 769 | 434 | |||||||||||||||||||||
Table
does not include developed property base for Uinta or Williston
Basins
(1) Predominately 20-acre spacing at
Monument Butte, 40-acre spacing elsewhere; includes approximately 70 MMBOE for
additional secondary recovery
(2) 320-acre spacing, multiple
horizons
(3) 320-acre spacing
3

4
Mid-Continent:
Newfield’s
largest division is the Mid-Continent. The region accounted for 43% of the
Company’s estimated total 2009 production. Production from the division grew
more than 20% in 2009, excluding the 2.6 Bcfe that was voluntarily curtailed in
the third quarter of 2009 due to low gas prices.
The
Woodford – Newfield’s net acreage
position in the Woodford is approximately 166,500 acres. Substantially all of
the acreage is now held by production. Current gross operated production is
approximately 300 MMcfe/d, or 170 MMcfe/d net. Production is expected to further
increase in the first quarter of 2010 as more than 20 wells (deferred
completions from the second half of 2009) are completed and placed on
production.
Six of
those 20 wells are super extended laterals – or SXLs (laterals >5000’) -- and
will have lateral lengths of more than 7,000’. Two of the recent SXL wells were
completed with initial production rates of 6 and 10 MMcfe/d (gross). The Company
expects to have results from four additional SXL completions in the first
quarter of 2010. Newfield expects that the average lateral length of its
Woodford completions in 2010 will be approximately 6,000’.
To date,
Newfield has drilled more than 300 operated horizontal wells in the play.
Newfield has significantly enhanced the economics in the Woodford through
improved efficiencies and the drilling and completion of longer lateral
wells.
Based on
drilling to date and 3-D seismic data that covers the entirety of Newfield’s
Woodford acreage, the Company estimates that approximately 25% of its Woodford
acreage will ultimately be developed with SXL completions. The Company has
applied to unitize a large portion of its acreage to facilitate drilling more
SXLs. Approval of the unit would increase this estimated percentage to
approximately 33% of the acreage, or 55,000 net acres.
Newfield
expects to run 6-8 operated rigs in the Woodford in 2010 and increase production
by approximately 20% over 2009 levels.
5
|
Typical
Woodford Well Economic Assumptions
|
|
|
Lease
Burden
|
19%
Royalty
|
|
Average
Sunk Cost per Acre
|
$800
|
|
Lease
Operating Expense (includes transportation)
|
$0.43/Mcf
|
|
Production
Tax (% of Rev.)
|
|
|
Prod Tax during credit period
|
1.09%
|
|
Prod Tax after credit period (48 months or payout)
|
7.09%
|
|
Wellhead
Pricing vs. Henry Hub ($/Mcf)
|
NYMEX
less $0.75
|
|
Total
Fuel Gas (used in compression – all resource plays have fuel
costs)
|
8%
|
|
NYMEX
gas price necessary for NPV 10 ($/MMBtu)
|
$4.50
|


6


7


Onshore
Gulf Coast:
Newfield
also issued a news release today providing an update on Newfield’s previously
disclosed offer to acquire assets from TXCO Resources Inc.
NATURAL
GAS HEDGE POSITIONS
Please
see the tables below for our complete hedging positions.
8
The
following hedge positions for the first quarter of 2010 and beyond are as of
January 8, 2010:
First Quarter
2010
|
Weighted
Average
|
Range
|
|||||||||||||||||||
|
Volume
|
Fixed
|
Floors
|
Collars
|
Floor
|
Ceiling
|
|||||||||||||||
|
31,800
MMMBtus
|
$ | 6.79 | — | — | — | — | ||||||||||||||
|
5,700
MMMBtus
|
— | — | $ | 8.50 — $10.44 | $ | 8.50 | $ | 10.00 — $11.00 | ||||||||||||
Second Quarter
2010
|
Weighted
Average
|
Range
|
|||||||||||||||||||
|
Volume
|
Fixed
|
Floors
|
Collars
|
Floor
|
Ceiling
|
|||||||||||||||
|
34,850
MMMBtus
|
$ | 6.41 | — | — | — | — | ||||||||||||||
Third Quarter
2010
|
Weighted
Average
|
Range
|
|||||||||||||||||||
|
Volume
|
Fixed
|
Floors
|
Collars
|
Floor
|
Ceiling
|
|||||||||||||||
|
35,200
MMMBtus
|
$ | 6.41 | — | — | — | — | ||||||||||||||
Fourth Quarter
2010
|
Weighted
Average
|
Range
|
|||||||||||||||||||
|
Volume
|
Fixed
|
Floors
|
Collars
|
Floor
|
Ceiling
|
|||||||||||||||
|
28,320
MMMBtus
|
$ | 6.49 | — | — | — | — | ||||||||||||||
First Quarter
2011
|
Weighted
Average
|
Range
|
|||||||||||||||||||
|
Volume
|
Fixed
|
Floors
|
Collars
|
Floor
|
Ceiling
|
|||||||||||||||
|
18,900
MMMBtus
|
$ | 6.55 | — | — | — | — | ||||||||||||||
|
9,900
MMMBtus*
|
— | — | $ | 6.00 — $7.91 | $ | 6.00 | $ | 7.75 — $8.03 | ||||||||||||
Second Quarter
2011
|
Weighted
Average
|
Range
|
|||||||||||||||||||
|
Volume
|
Fixed
|
Floors
|
Collars
|
Floor
|
Ceiling
|
|||||||||||||||
|
19,110
MMMBtus
|
$ | 6.55 | — | — | — | — | ||||||||||||||
|
10,010
MMMBtus*
|
— | — | $ | 6.00 — $7.91 | $ | 6.00 | $ | 7.75 — $8.03 | ||||||||||||
Third Quarter
2011
|
Weighted
Average
|
Range
|
|||||||||||||||||||
|
Volume
|
Fixed
|
Floors
|
Collars
|
Floor
|
Ceiling
|
|||||||||||||||
|
19,320
MMMBtus
|
$ | 6.55 | — | — | — | — | ||||||||||||||
|
10,120
MMMBtus*
|
— | — | $ | 6.00 — $7.91 | $ | 6.00 | $ | 7.75 — $8.03 | ||||||||||||
Fourth Quarter
2011
|
Weighted
Average
|
Range
|
|||||||||||||||||||
|
Volume
|
Fixed
|
Floors
|
Collars
|
Floor
|
Ceiling
|
|||||||||||||||
|
6,510
MMMBtus
|
$ | 6.55 | — | — | — | — | ||||||||||||||
|
8,290
MMMBtus*
|
— | — | $ | 6.00 — $7.94 | $ | 6.00 | $ | 7.75 — $8.03 | ||||||||||||
*These
3-way collar contracts are standard natural gas collar contracts with respect to
the periods, volumes and prices stated above. The contracts have floor and
ceiling prices per MMMBtu as per the table above until the price drops below a
weighted average price of $4.50 per MMMBtu. Below $4.50 per MMMBtu, these
contracts effectively result in realized prices that are on average $1.50 per
MMMBtu higher than the cash price that otherwise would have been
realized.
9
The
following table details the expected impact to pre-tax income from the
settlement of our derivative contracts, outlined above, at various NYMEX gas
prices, net of premiums paid for these contracts (in millions).
|
Gas
Prices
|
||||||||||||||||||||||||
| $ | 4.00 | $ | 5.00 | $ | 6.00 | $ | 7.00 | $ | 8.00 | $ | 9.00 | |||||||||||||
|
2010
|
||||||||||||||||||||||||
|
1st
Quarter
|
$ | 114 | $ | 77 | $ | 40 | $ | 2 | $ | (35 | ) | $ | (70 | ) | ||||||||||
|
2nd
Quarter
|
$ | 84 | $ | 49 | $ | 14 | $ | (21 | ) | $ | (56 | ) | $ | (91 | ) | |||||||||
|
3rd
Quarter
|
$ | 85 | $ | 49 | $ | 14 | $ | (21 | ) | $ | (56 | ) | $ | (91 | ) | |||||||||
|
4th
Quarter
|
$ | 70 | $ | 43 | $ | 14 | $ | (14 | ) | $ | (43 | ) | $ | (71 | ) | |||||||||
|
Total
2010
|
$ | 353 | $ | 218 | $ | 82 | $ | (54 | ) | $ | (190 | ) | $ | (323 | ) | |||||||||
|
2011
|
||||||||||||||||||||||||
|
1st
Quarter
|
$ | 63 | $ | 39 | $ | 10 | $ | (8 | ) | $ | (28 | ) | $ | (57 | ) | |||||||||
|
2nd
Quarter
|
$ | 64 | $ | 40 | $ | 10 | $ | (9 | ) | $ | (29 | ) | $ | (58 | ) | |||||||||
|
3rd
Quarter
|
$ | 64 | $ | 40 | $ | 11 | $ | (9 | ) | $ | (29 | ) | $ | (58 | ) | |||||||||
|
4th
Quarter
|
$ | 29 | $ | 18 | $ | 4 | $ | (3 | ) | $ | (10 | ) | $ | (25 | ) | |||||||||
|
Total
2011
|
$ | 220 | $ | 137 | $ | 35 | $ | (29 | ) | $ | (96 | ) | $ | (198 | ) | |||||||||
In the Rocky Mountains, we
hedged basis associated with 48% of the proved producing fields from January
2010 through full-year 2012. This is in addition to the 8,000 MMBtu/d sold on a
fixed physical basis for the same term for a total basis hedged for the period
of 73% at an average of $(0.94) per MMBtu.
In the Mid-Continent, we
hedged basis associated with 22% of our anticipated Stiles/Britt priced
production from January 2010 through August 2011. This is in addition to the
30,000 MMbtu/d sold on a fixed physical basis for the same term for a total
basis hedged for the period of 55% at an average of $(0.52) per MMBtu. We hedged
basis associated with 53% of our anticipated Stiles/Britt production from
September 2011 through December 2012 at an average of $(0.55) per
MMBtu.
Approximately
10% of our natural gas production correlates to Houston Ship Channel, 13% to
Columbia Gulf, 13% to Texas Gas Zone 1, 5% to Southern Natural Gas, 10% to Tenn
100, 6% to CenterPoint/East, 24% to Panhandle Eastern Pipeline, 6% to Waha, 7%
to Colorado Interstate, and 6% to others.
CRUDE
OIL HEDGE POSITIONS
The
following hedge positions for the first quarter of 2010 and beyond are as of
January 8, 2010:
First Quarter
2010
|
Weighted
Average
|
Range
|
|||||||||||||||||||
|
Volume
|
Fixed
|
Floors
|
Collars
|
Floor
|
Ceiling
|
|||||||||||||||
|
90,000 Bbls
|
$ | 93.40 | — | — | — | — | ||||||||||||||
|
810,000
Bbls
|
— | — | $ | 127.97— $170.00 | $ | 125.50 — $130.50 | $ | 170.00 | ||||||||||||
|
360,000
Bbls*
|
— | — | $ | 67.50 — $106.28 | $ | 60.00 — $75.00 | $ | 100.00 —$112.10 | ||||||||||||
Second Quarter
2010
|
Weighted
Average
|
Range
|
|||||||||||||||||||
|
Volume
|
Fixed
|
Floors
|
Collars
|
Floor
|
Ceiling
|
|||||||||||||||
|
90,000 Bbls
|
$ | 93.40 | — | — | — | — | ||||||||||||||
|
819,000
Bbls
|
— | — | $ | 127.97— $170.00 | $ | 125.50 — $130.50 | $ | 170.00 | ||||||||||||
|
364,000
Bbls*
|
— | — | $ | 67.50 — $106.28 | $ | 60.00 — $75.00 | $ | 100.00 —$112.10 | ||||||||||||
Third Quarter
2010
|
Weighted
Average
|
Range
|
|||||||||||||||||||
|
Volume
|
Fixed
|
Floors
|
Collars
|
Floor
|
Ceiling
|
|||||||||||||||
|
90,000 Bbls
|
$ | 93.40 | — | — | — | — | ||||||||||||||
|
828,000
Bbls
|
— | — | $ | 127.97— $170.00 | $ | 125.50 — $130.50 | $ | 170.00 | ||||||||||||
|
368,000
Bbls*
|
— | — | $ | 67.50 — $106.28 | $ | 60.00 — $75.00 | $ | 100.00 —$112.10 | ||||||||||||
10
Fourth Quarter
2010
|
Weighted
Average
|
Range
|
|||||||||||||||||||
|
Volume
|
Fixed
|
Floors
|
Collars
|
Floor
|
Ceiling
|
|||||||||||||||
|
90,000 Bbls
|
$ | 93.40 | — | — | — | — | ||||||||||||||
|
828,000
Bbls
|
— | — | $ | 127.97— $170.00 | $ | 125.50 — $130.50 | $ | 170.00 | ||||||||||||
|
368,000
Bbls*
|
— | — | $ | 67.50 — $106.28 | $ | 60.00 — $75.00 | $ | 100.00 —$112.10 | ||||||||||||
First Quarter
2011
|
Weighted
Average
|
Range
|
|||||||||||||||||||
|
Volume
|
Fixed
|
Floors
|
Collars
|
Floor
|
Ceiling
|
|||||||||||||||
|
360,000
Bbls*
|
— | — | $ | 77.50 — $119.94 | $ | 75.00 — $80.00 | $ | 118.50—$121.50 | ||||||||||||
Second Quarter
2011
|
Weighted
Average
|
Range
|
|||||||||||||||||||
|
Volume
|
Fixed
|
Floors
|
Collars
|
Floor
|
Ceiling
|
|||||||||||||||
|
364,000
Bbls*
|
— | — | $ | 77.50 — $119.94 | $ | 75.00 — $80.00 | $ | 118.50—$121.50 | ||||||||||||
Third Quarter
2011
|
Weighted
Average
|
Range
|
|||||||||||||||||||
|
Volume
|
Fixed
|
Floors
|
Collars
|
Floor
|
Ceiling
|
|||||||||||||||
|
368,000
Bbls*
|
— | — | $ | 77.50 — $119.94 | $ | 75.00 — $80.00 | $ | 118.50—$121.50 | ||||||||||||
Fourth Quarter
2011
|
Weighted
Average
|
Range
|
|||||||||||||||||||
|
Volume
|
Fixed
|
Floors
|
Collars
|
Floor
|
Ceiling
|
|||||||||||||||
|
368,000
Bbls*
|
— | — | $ | 77.50 — $119.94 | $ | 75.00 — $80.00 | $ | 118.50—$121.50 | ||||||||||||
*These
3-way collar contracts are standard crude oil collar contracts with respect to
the periods, volumes and prices stated above. The contracts have floor and
ceiling prices per Bbl as per the table above until the price drops below a
weighted average price of $58.75 per Bbl. Below $58.75 per Bbl, these contracts
effectively result in realized prices that are on average $13.75 per Bbl higher
than the cash price that otherwise would have been realized.
The following table details the
expected impact to pre-tax income from the settlement of our derivative
contracts, outlined above, at various NYMEX oil prices, net of premiums paid for
these contracts (in millions).
|
Oil
Prices
|
||||||||||||||||||||||||||||
| $ | 40.00 | $ | 50.00 | $ | 60.00 | $ | 70.00 | $ | 80.00 | $ | 90.00 | $ | 100.00 | |||||||||||||||
|
2010
|
||||||||||||||||||||||||||||
|
1st
Quarter
|
$ | 73 | $ | 64 | $ | 53 | $ | 43 | $ | 33 | $ | 23 | $ | 14 | ||||||||||||||
|
2nd
Quarter
|
$ | 74 | $ | 65 | $ | 54 | $ | 43 | $ | 33 | $ | 24 | $ | 15 | ||||||||||||||
|
3rd
Quarter
|
$ | 74 | $ | 65 | $ | 54 | $ | 43 | $ | 33 | $ | 24 | $ | 15 | ||||||||||||||
|
4th
Quarter
|
$ | 75 | $ | 65 | $ | 54 | $ | 43 | $ | 33 | $ | 24 | $ | 15 | ||||||||||||||
|
Total
2010
|
$ | 296 | $ | 259 | $ | 215 | $ | 172 | $ | 132 | $ | 95 | $ | 59 | ||||||||||||||
|
2011
|
||||||||||||||||||||||||||||
|
1st
Quarter
|
$ | 5 | $ | 5 | $ | 5 | $ | 2 | $ | - | $ | - | $ | - | ||||||||||||||
|
2nd
Quarter
|
$ | 5 | $ | 5 | $ | 5 | $ | 3 | $ | - | $ | - | $ | - | ||||||||||||||
|
3rd
Quarter
|
$ | 6 | $ | 6 | $ | 6 | $ | 3 | $ | - | $ | - | $ | - | ||||||||||||||
|
4th
Quarter
|
$ | 6 | $ | 6 | $ | 6 | $ | 3 | $ | - | $ | - | $ | - | ||||||||||||||
|
Total
2011
|
$ | 22 | $ | 22 | $ | 22 | $ | 11 | $ | - | $ | - | $ | - | ||||||||||||||
11
We
provide information regarding our outstanding hedging positions in our annual
and quarterly reports filed with the SEC and in our electronic publication --
@NFX. This publication can be found on Newfield’s web page at http://www.newfield.com. Through the web page,
you may elect to receive @NFX through e-mail distribution.
Newfield
Exploration Company is an independent crude oil and natural gas exploration and
production company. The Company relies on a proven growth strategy of growing
reserves through the drilling of a balanced risk/reward portfolio and select
acquisitions. Newfield's domestic areas of operation include the U.S. onshore
Gulf Coast, the Anadarko and Arkoma Basins of the Mid-Continent, the Rocky
Mountains and the Gulf of Mexico. The Company has international operations in
Malaysia and China.
This
publication contains forward-looking information. All information other than
historical facts included in this publication, such as information regarding
estimated or anticipated results, estimated production and costs, drilling and
development plans and the timing of activities, is forward-looking information.
Although Newfield believes that these expectations are reasonable, this
information is based upon assumptions and anticipated results that are subject
to numerous uncertainties and risks. Actual results may vary significantly from
those anticipated due to many factors, including drilling results, oil and gas
prices, industry conditions, the prices of goods and services, the availability
of drilling rigs and other support services, the availability of refining
capacity for the crude oil Newfield produces from its Monument Butte field in
Utah, the availability and cost of capital resources, labor conditions and
severe weather conditions (such as hurricanes). In addition, the drilling of oil
and gas wells and the production of hydrocarbons are subject to governmental
regulations and operating risks.
12