Attached files
| file | filename |
|---|---|
| 8-K - GLOBAL TELECOM & TECHNOLOGY, INC. 8-K - GTT Communications, Inc. | a6140022.htm |
Copyright ® 2010 Global Telecom & Technology, Inc. All Rights Reserved. Investor Overview January 2010
2 Disclaimer This presentation may contain “Forward-Looking Statements” within the meaning of Section 27A of the Securities Act of 1933 and Section 21E of the Securities Exchange Act of 1934. All statements other than statements of historical facts made in this presentation regarding the prospects of our industry and our prospects, plans, financial position and business strategy may constitute forward-looking statements. These statements are based upon management’s current beliefs or expectations and are inherently subject to significant business, economic and competitive risks, uncertainties, and contingencies, many of which are beyond our control. Undue reliance should not be placed on such statements. We caution you that forward-looking statements are not guarantees of future performance and that actual results of operations, financial condition and liquidity, and developments in the industry, may differ materially from those made in or suggested by any forward-looking statements contained in this presentation. Such forward-looking statements involve known and unknown risks, uncertainties, assumptions, and other factors which may cause the company’s actual results, performance or achievements to be materially different from any future results, performance or achievements expressed or implied by such forward-looking statements. Factors and risks that could cause actual results to differ materially from our expectations are described in the most recent Global Telecom and Technology Forms 10-Q and 10-K, on file with the SEC. (www.sec.gov) The forward-looking statements in this presentation speak only as of the date of this presentation and might not occur in light of these risks, uncertainties, assumptions, and other factors. We undertake no obligation and disclaim any obligation to publicly update or revise any forward-looking statements, whether as a result of new information, future events or otherwise. Copyright ® 2010 Global Telecom & Technology, Inc. All Rights Reserved. www.gt-t.net
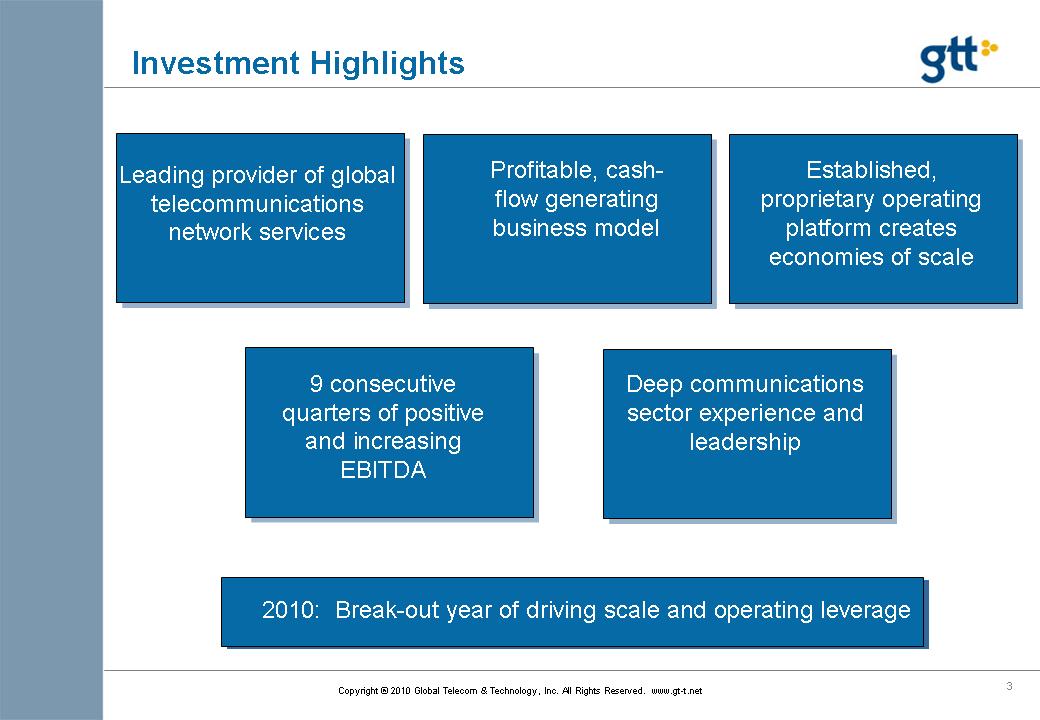
3 Investment Highlights Leading provider of global telecommunications network services Profitable, cashflow generating business model Established, proprietary operating platform creates economies of scale 9 consecutive quarters of positive and increasing EBITDA Deep communications sector experience and leadership 2010: Break-out year of driving scale and operating leverage Copyright ® 2010 Global Telecom & Technology, Inc. All Rights Reserved. www.gt-t.net
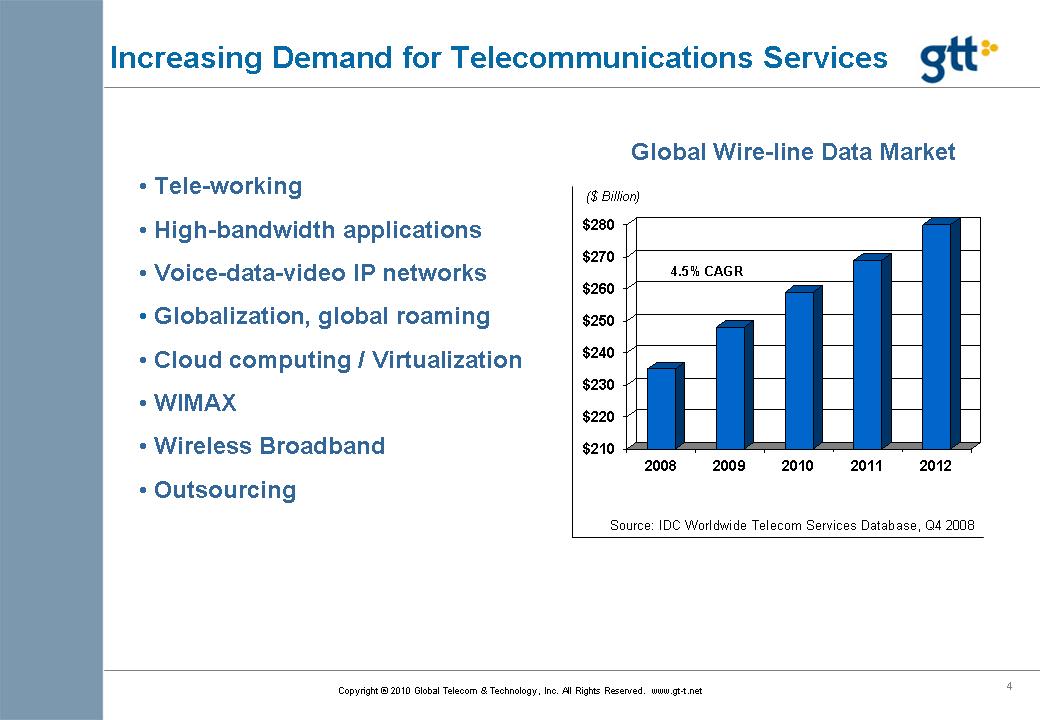
4 Increasing Demand for Telecommunications Services • Tele-working • High-bandwidth applications • Voice-data-video IP networks • Globalization, global roaming • Cloud computing / Virtualization • WIMAX • Wireless Broadband • Outsourcing Global Wire-line Data Market Source: IDC Worldwide Telecom Services Database, Q4 2008 $210 $220 $230 $240 $250 $260 $270 $280 2008 2009 2010 2011 2012 ($ Billion) 4.5% CAGR Copyright ® 2010 Global Telecom & Technology, Inc. All Rights Reserved. www.gt-t.net
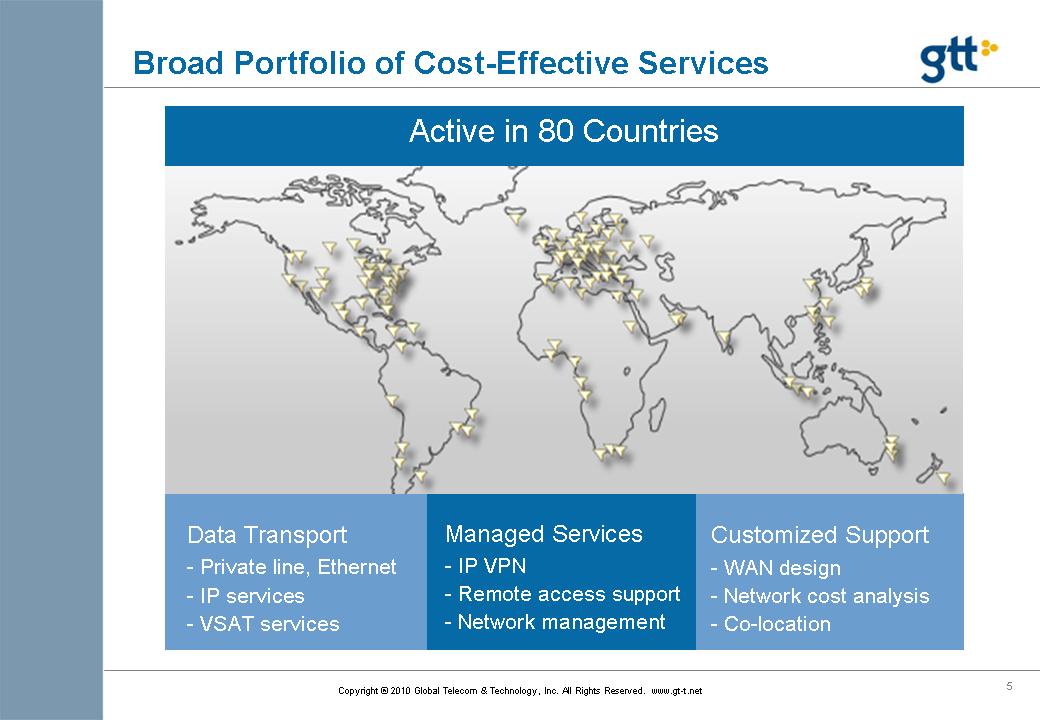
5 Broad Portfolio of Cost-Effective Services Active in 80 Countries Data Transport - Private line, Ethernet - IP services - VSAT services Managed Services - IP VPN - Remote access support - Network management Customized Support - WAN design - Network cost analysis - Co-location Copyright ® 2010 Global Telecom & Technology, Inc. All Rights Reserved. www.gt-t.net
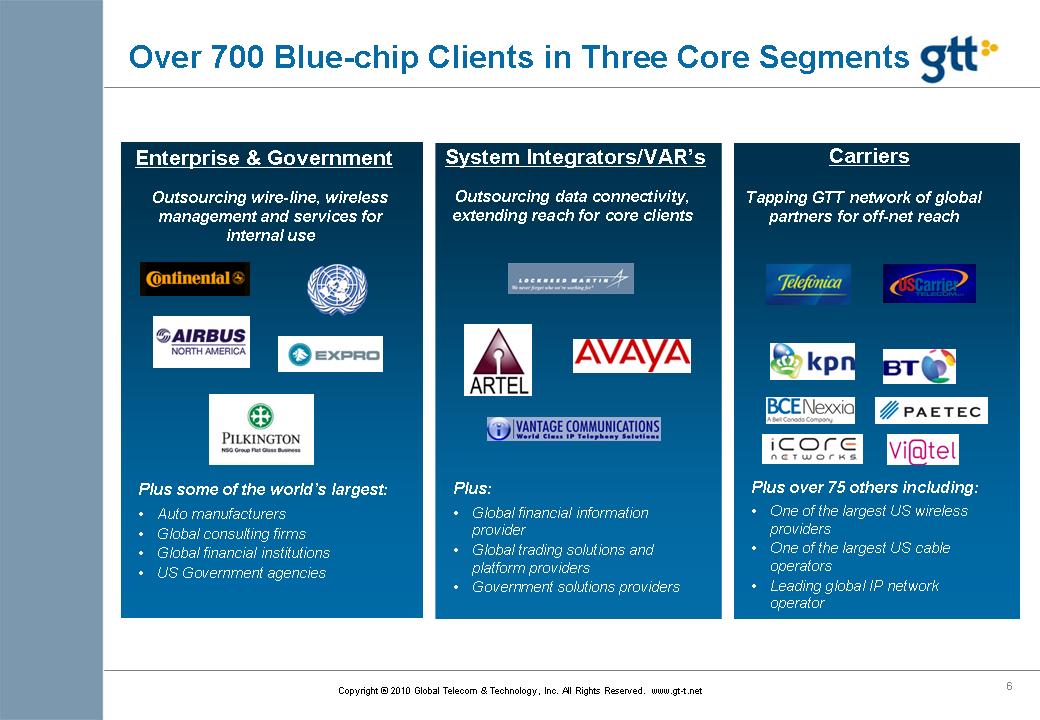
6 Over 700 Blue-chip Clients in Three Core Segments Enterprise & Government System Integrators/VAR’s Carriers Tapping GTT network of global partners for off-net reach Outsourcing data connectivity, extending reach for core clients Outsourcing wire-line, wireless management and services for internal use Plus over 75 others including: • One of the largest US wireless providers • One of the largest US cable operators • Leading global IP network operator Plus some of the world’s largest: • Auto manufacturers • Global consulting firms • Global financial institutions • US Government agencies Plus: • Global financial information provider • Global trading solutions and platform providers • Government solutions providers Copyright ® 2010 Global Telecom & Technology, Inc. All Rights Reserved. www.gt-t.net
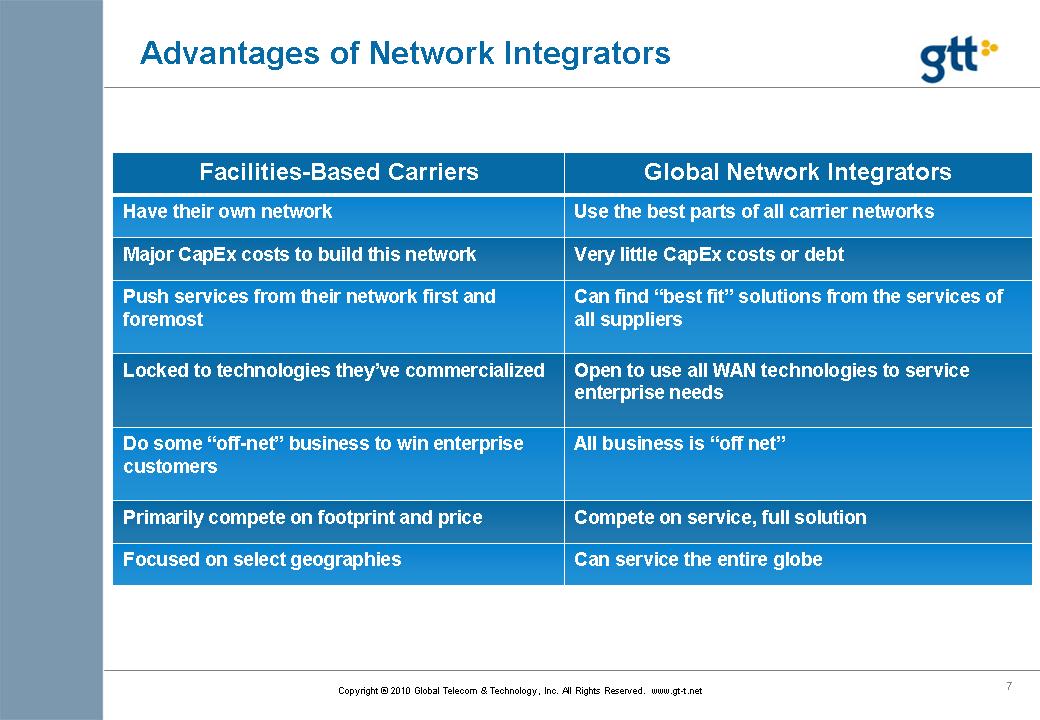
7 Advantages of Network Integrators Facilities-Based Carriers Global Network Integrators Have their own network Use the best parts of all carrier networks Major CapEx costs to build this network Very little CapEx costs or debt Push services from their network first and foremost Can find “best fit” solutions from the services of all suppliers Locked to technologies they’ve commercialized Open to use all WAN technologies to service enterprise needs Do some “off-net” business to win enterprise customers All business is “off net” Primarily compete on footprint and price Compete on service, full solution Focused on select geographies Can service the entire globe Copyright ® 2010 Global Telecom & Technology, Inc. All Rights Reserved. www.gt-t.net
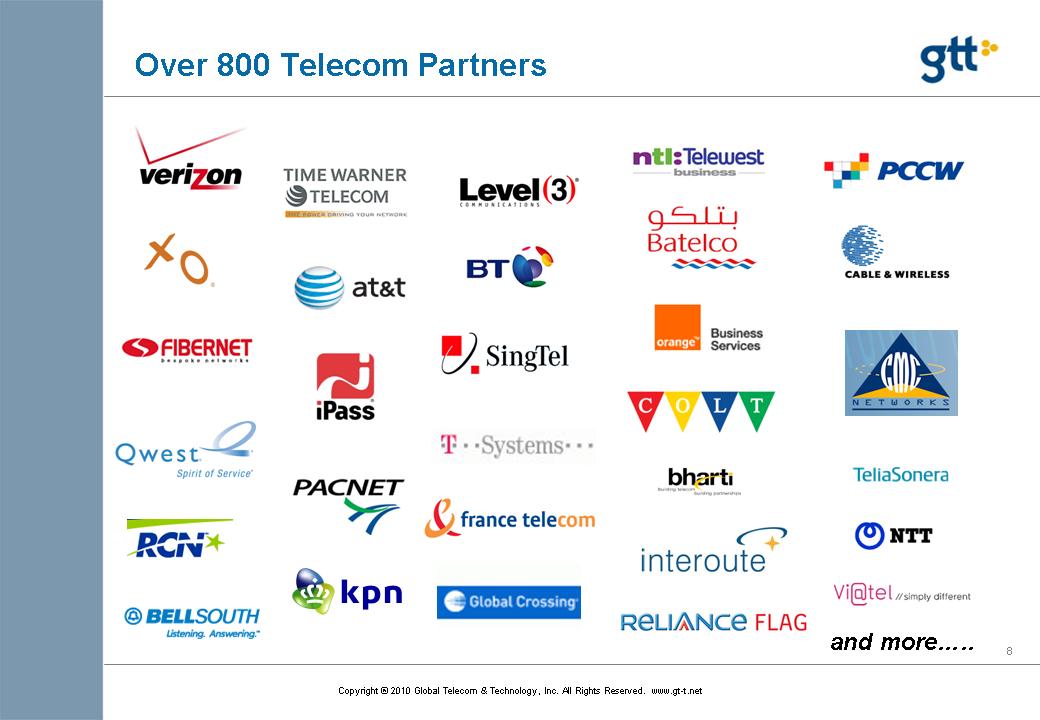
8 and more….. Over 800 Telecom Partners Copyright ® 2010 Global Telecom & Technology, Inc. All Rights Reserved. www.gt-t.net
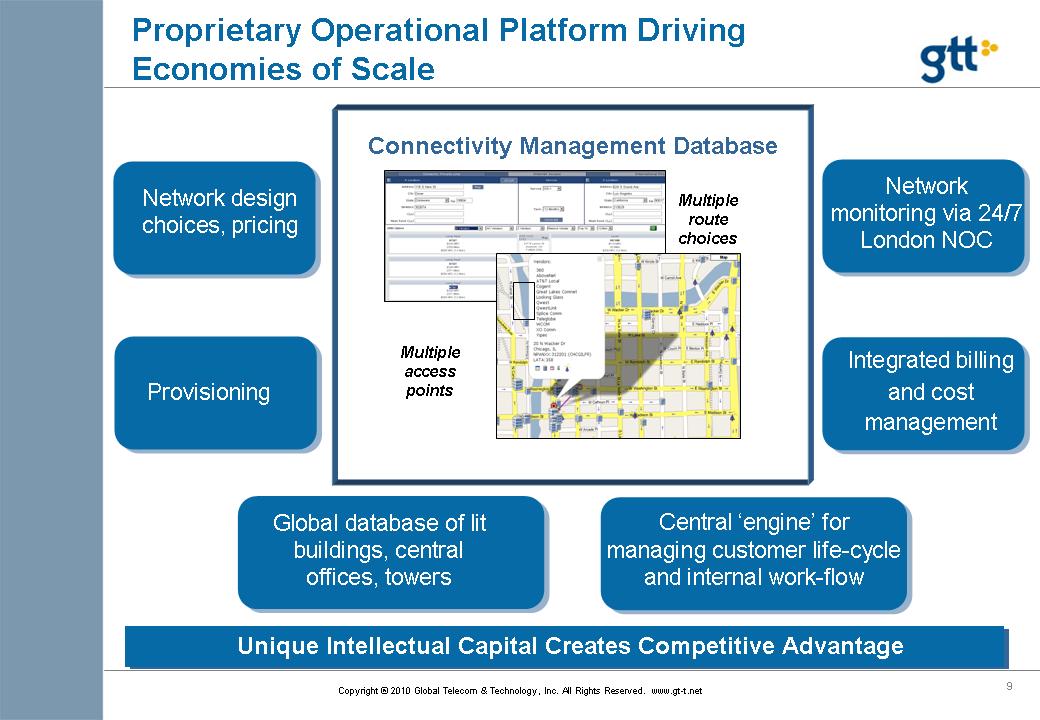
9 Proprietary Operational Platform Driving Economies of Scale Multiple route choices Multiple access points Connectivity Management Database Network design choices, pricing Provisioning Integrated billing and cost management Global database of lit buildings, central offices, towers Central ‘engine’ for managing customer life-cycle and internal work-flow Unique Intellectual Capital Creates Competitive Advantage Network monitoring via 24/7 London NOC Copyright ® 2010 Global Telecom & Technology, Inc. All Rights Reserved. www.gt-t.net
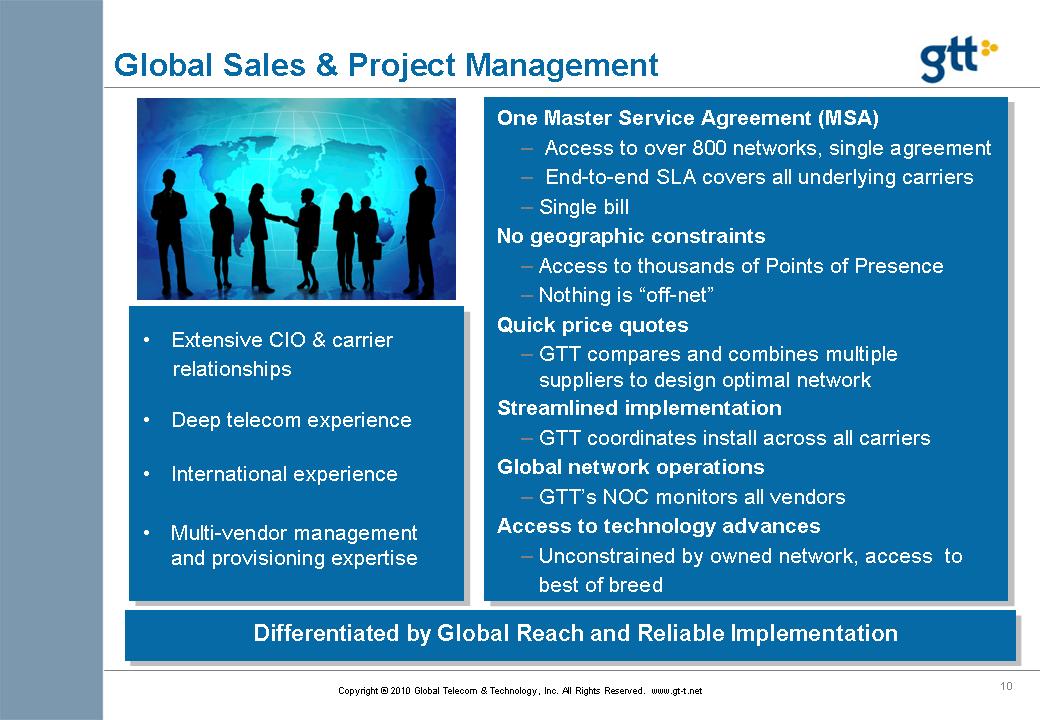
10 Global Sales & Project Management One Master Service Agreement (MSA) – Access to over 800 networks, single agreement – End-to-end SLA covers all underlying carriers – Single bill No geographic constraints – Access to thousands of Points of Presence – Nothing is “off-net” Quick price quotes – GTT compares and combines multiple suppliers to design optimal network Streamlined implementation – GTT coordinates install across all carriers Global network operations – GTT’s NOC monitors all vendors Access to technology advances – Unconstrained by owned network, access to best of breed • Extensive CIO & carrier relationships • Deep telecom experience • International experience • Multi-vendor management and provisioning expertise Differentiated by Global Reach and Reliable Implementation Copyright ® 2010 Global Telecom & Technology, Inc. All Rights Reserved. www.gt-t.net
11 Growth Strategy • Expand existing customer relationships • Expand existing service categories • Enter new service categories • Acquire complementary business – Network integrators – IP transit/transport companies – Telecom service providers Copyright ® 2010 Global Telecom & Technology, Inc. All Rights Reserved. www.gt-t.net
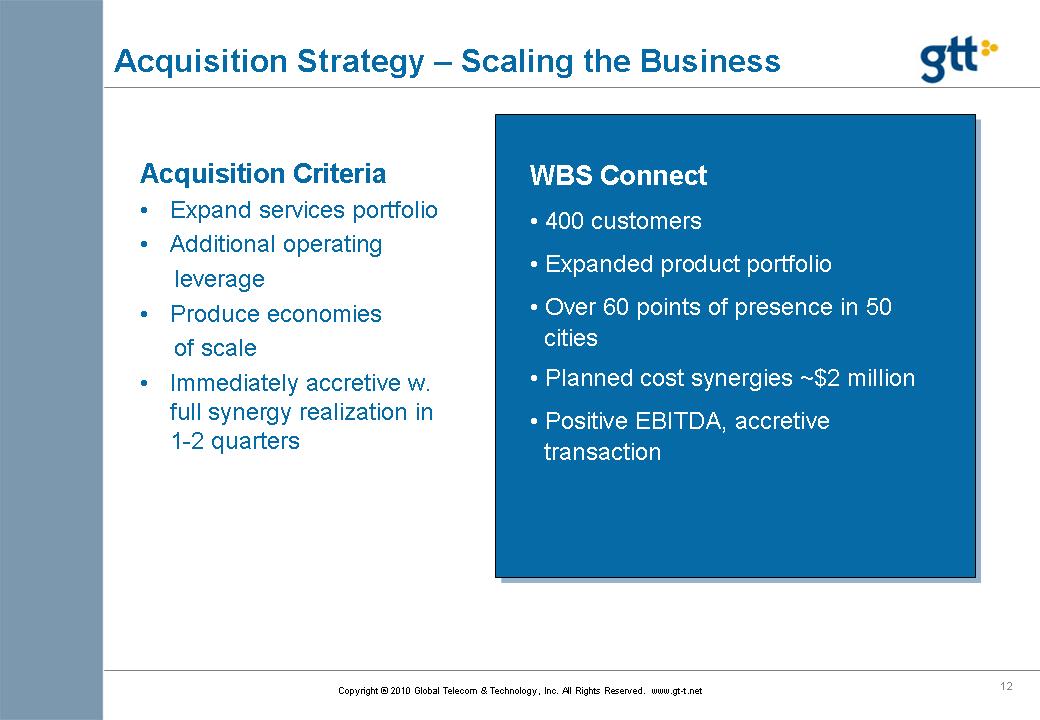
12 Acquisition Strategy – Scaling the Business WBS Connect • 400 customers • Expanded product portfolio • Over 60 points of presence in 50 cities • Planned cost synergies ~$2 million • Positive EBITDA, accretive transaction Acquisition Criteria • Expand services portfolio • Additional operating leverage • Produce economies of scale • Immediately accretive w. full synergy realization in 1-2 quarters Copyright ® 2010 Global Telecom & Technology, Inc. All Rights Reserved. www.gt-t.net
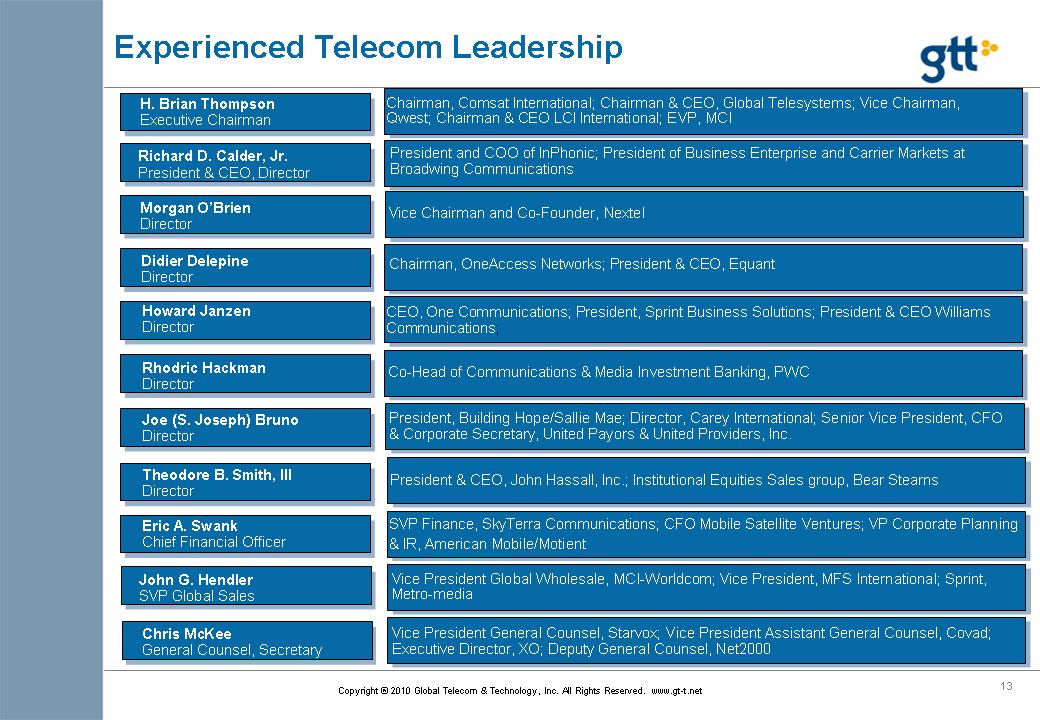
13 Experienced Telecom Leadership H. Brian Thompson Executive Chairman Chairman, Comsat International; Chairman & CEO, Global Telesystems; Vice Chairman, Qwest; Chairman & CEO LCI International; EVP, MCI President and COO of InPhonic; President of Business Enterprise and Carrier Markets at Broadwing Communications Vice Chairman and Co-Founder, Nextel Chairman, OneAccess Networks; President & CEO, Equant CEO, One Communications; President, Sprint Business Solutions; President & CEO Williams Communications; Co-Head of Communications & Media Investment Banking, PWC President, Building Hope/Sallie Mae; Director, Carey International; Senior Vice President, CFO & Corporate Secretary, United Payors & United Providers, Inc. Vice President Global Wholesale, MCI-Worldcom; Vice President, MFS International; Sprint, Metro-media Vice President General Counsel, Starvox; Vice President Assistant General Counsel, Covad; Executive Director, XO; Deputy General Counsel, Net2000 SVP Finance, SkyTerra Communications; CFO Mobile Satellite Ventures; VP Corporate Planning & IR, American Mobile/Motient President & CEO, John Hassall, Inc.; Institutional Equities Sales group, Bear Stearns Richard D. Calder, Jr. President & CEO, Director Morgan O’Brien Director Didier Delepine Director Howard Janzen Director Rhodric Hackman Director Joe (S. Joseph) Bruno Director Theodore B. Smith, III Director Eric A. Swank Chief Financial Officer John G. Hendler SVP Global Sales Chris McKee General Counsel, Secretary Copyright ® 2010 Global Telecom & Technology, Inc. All Rights Reserved. www.gt-t.net
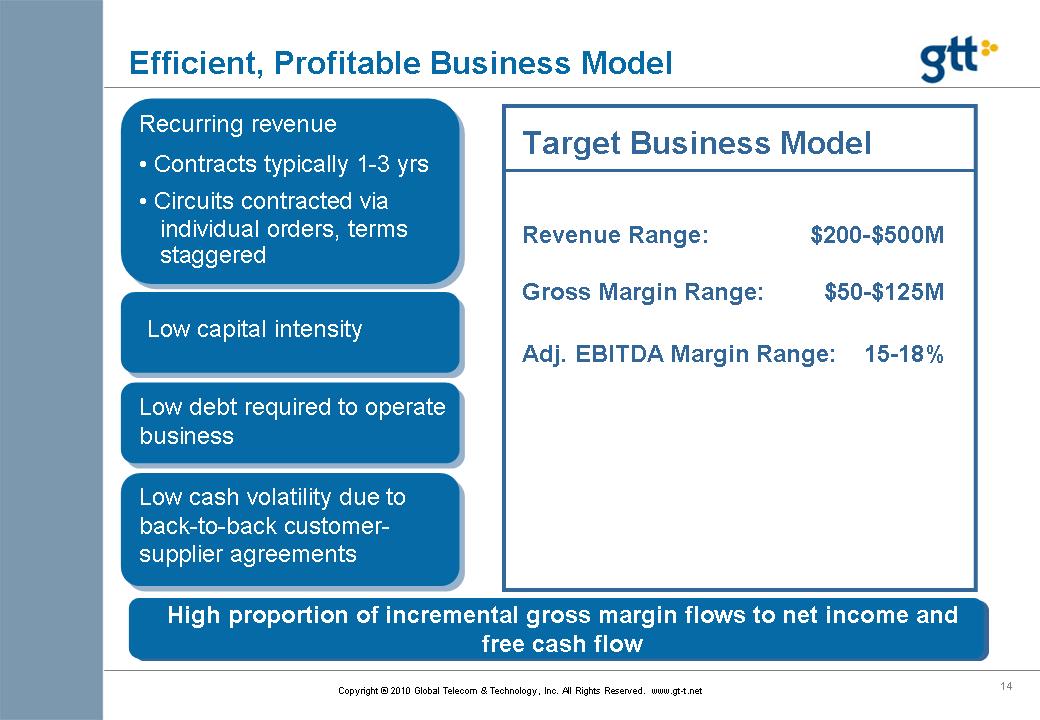
14 Efficient, Profitable Business Model Target Business Model Recurring revenue • Contracts typically 1-3 yrs • Circuits contracted via individual orders, terms staggered Low capital intensity Low debt required to operate business Low cash volatility due to back-to-back customersupplier agreements High proportion of incremental gross margin flows to net income and free cash flow Revenue Range: $200-$500M Gross Margin Range: $50-$125M Adj. EBITDA Margin Range: 15-18% Copyright ® 2010 Global Telecom & Technology, Inc. All Rights Reserved. www.gt-t.net
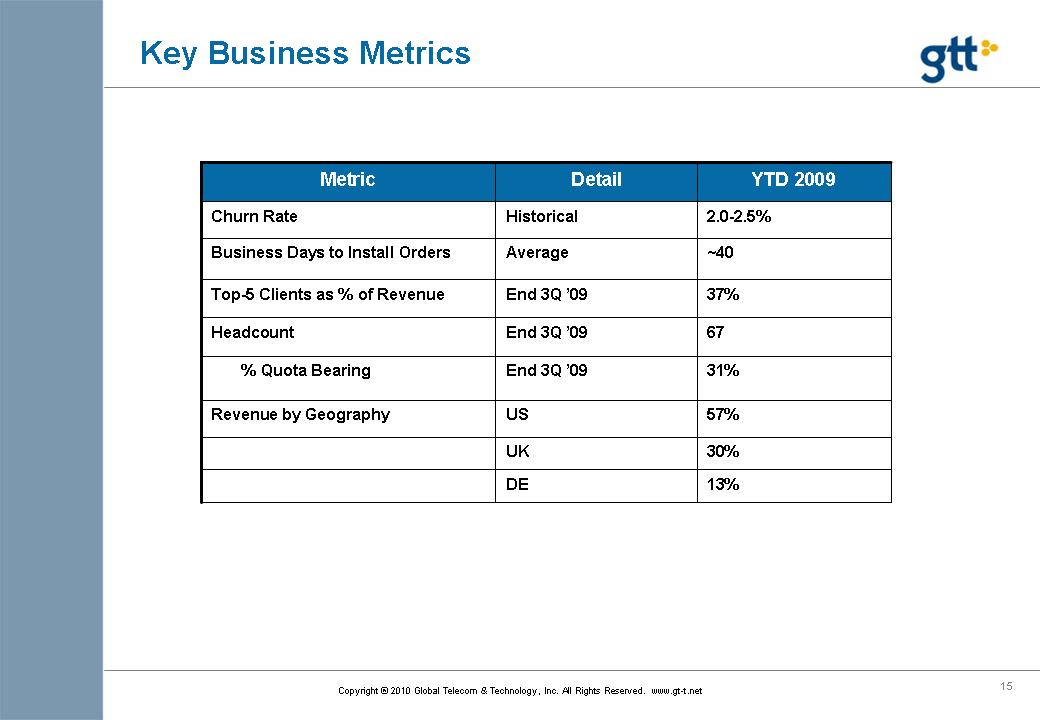
15 Key Business Metrics 37% End 3Q ’09 Top-5 Clients as % of Revenue 13% DE 57% US Revenue by Geography 30% UK 2.0-2.5% Historical Churn Rate 31% End 3Q ’09 % Quota Bearing 67 End 3Q ’09 Headcount ~40 Average Business Days to Install Orders YTD 2009 Detail Metric Copyright ® 2010 Global Telecom & Technology, Inc. All Rights Reserved. www.gt-t.net
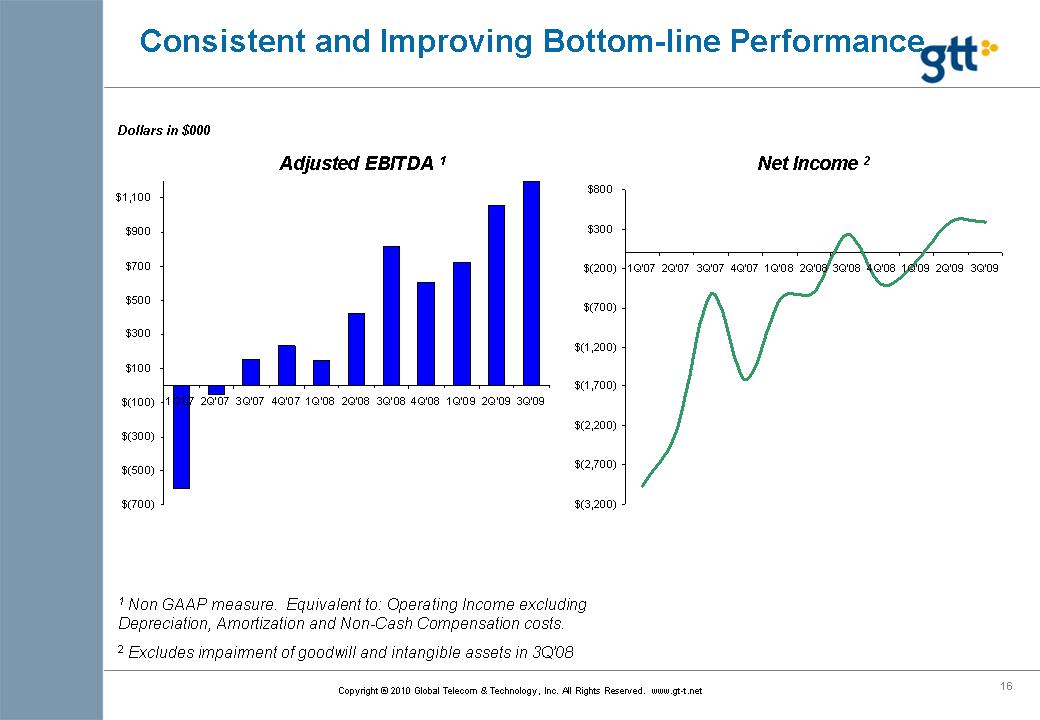
16 Consistent and Improving Bottom-line Performance Dollars in $000 $(3,200) $(2,700) $(2,200) $(1,700) $(1,200) $(700) $(200) $300 $800 1Q'07 2Q'07 3Q'07 4Q'07 1Q'08 2Q'08 3Q'08 4Q'08 1Q'09 2Q'09 3Q'09 $(700) $(500) $(300) $(100) $100 $300 $500 $700 $900 $1,100 1Q'07 2Q'07 3Q'07 4Q'07 1Q'08 2Q'08 3Q'08 4Q'08 1Q'09 2Q'09 3Q'09 Adjusted EBITDA 1 Net Income 2 1 Non GAAP measure. Equivalent to: Operating Income excluding Depreciation, Amortization and Non-Cash Compensation costs. 2 Excludes impairment of goodwill and intangible assets in 3Q’08 Copyright ® 2010 Global Telecom & Technology, Inc. All Rights Reserved. www.gt-t.net
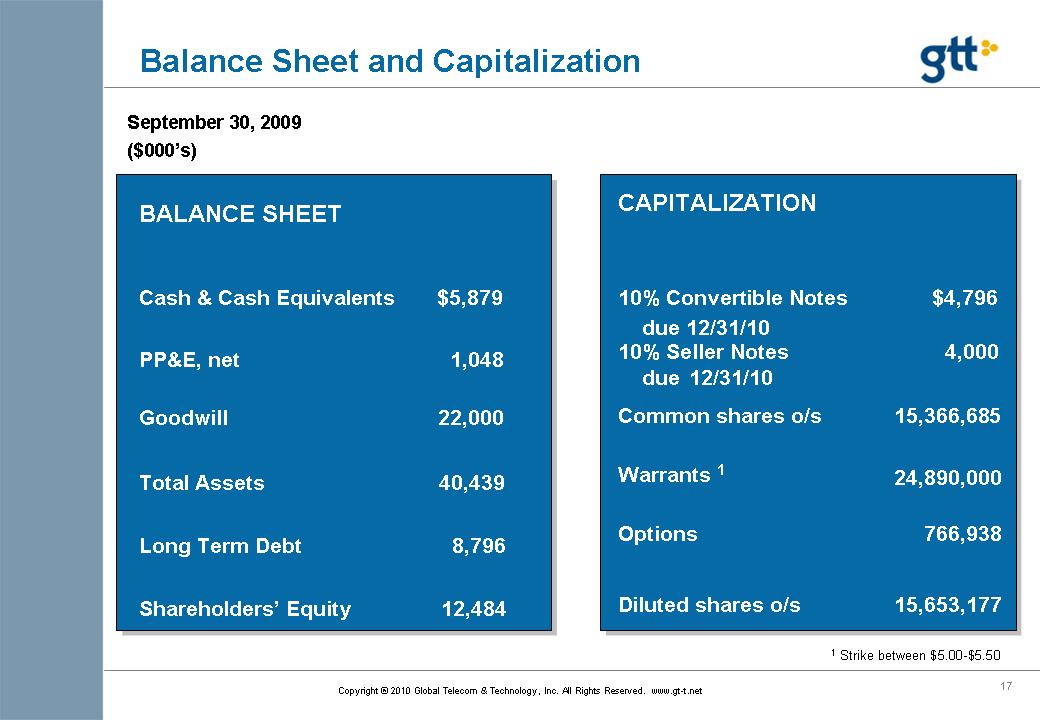
17 Balance Sheet and Capitalization BALANCE SHEET Cash & Cash Equivalents $5,879 PP&E, net 1,048 Goodwill 22,000 Total Assets 40,439 Long Term Debt 8,796 Shareholders’ Equity 12,484 CAPITALIZATION 10% Convertible Notes $4,796 due 12/31/10 10% Seller Notes 4,000 due 12/31/10 Common shares o/s 15,366,685 Warrants 1 24,890,000 Options 766,938 Diluted shares o/s 15,653,177 September 30, 2009 ($000’s) 1 Strike between $5.00-$5.50 Copyright ® 2010 Global Telecom & Technology, Inc. All Rights Reserved. www.gt-t.net
18 Investment Highlights Leading provider of global telecommunications network services Profitable, cash-flow generating business model Established, proprietary operating platform creates economies of scale 9 consecutive quarters of positive EBITDA Deep communications sector experience and leadership 2010: Break-out year of driving scale and operating leverage