Attached files
| file | filename |
|---|---|
| 8-K - 8-K - DPL INC | a10-1727_18k.htm |
|
|
Investor Roadshow January 13 – 14, 2010 |
|
|
Notice Regarding Forward-Looking Statements Certain statements contained in this presentation are “forward-looking statements” within the meaning of the Private Securities Litigation Reform Act of 1995. Matters discussed in this presentation that relate to events or developments that are expected to occur in the future, including management’s expectations, strategic objectives, business prospects, anticipated economic performance and financial condition and other similar matters constitute forward-looking statements. Forward-looking statements are based on management’s beliefs, assumptions and expectations of future economic performance, taking into account the information currently available to management. These statements are not statements of historical fact and are typically identified by terms and phrases such as “anticipate,” “believe,” “intend,” “estimate,” “expect,” “continue,” “should,” “could,” “may,” “plan,” “project,” “predict,” “will,” and similar expressions. Such forward-looking statements are subject to risks and uncertainties, and investors are cautioned that outcomes and results may vary materially from those projected due to various factors beyond our control, including but not limited to: abnormal or severe weather and catastrophic weather-related damage; unusual maintenance or repair requirements; changes in fuel costs and purchased power, coal, environmental emissions, natural gas, oil, and other commodity prices; volatility and changes in markets for electricity and other energy-related commodities; performance of our suppliers and other counterparties; increased competition and deregulation in the electric utility industry; increased competition in the retail generation market; changes in interest rates; state, federal and foreign legislative and regulatory initiatives that affect cost and investment recovery, emission levels and regulations, rate structures or tax laws; changes in federal and/or state environmental laws and regulations to which DPL and its subsidiaries are subject; the development and operation of Regional Transmission Organizations (RTOs), including PJM Interconnection, L.L.C. (PJM) to which DPL’s operating subsidiary The Dayton Power and Light Company (DP&L) has given control of its transmission functions; changes in our purchasing processes, pricing, delays, employee, contractor, and supplier performance and availability; significant delays associated with large construction projects; growth in our service territory and changes in demand and demographic patterns; changes in accounting rules and the effect of accounting pronouncements issued periodically by accounting standard-setting bodies; financial market conditions, including impacts the current financial crisis may have on our business and financial conditions; the outcomes of litigation and regulatory investigations, proceedings or inquiries; general economic conditions; and the risks and other factors discussed in DPL’s and DP&L’s filings with the Securities and Exchange Commission. Forward-looking statements speak only as of the date of the document in which they are made. We disclaim any obligation or undertaking to provide any updates or revisions to any forward-looking statement to reflect any change in our expectations or any change in events, conditions or circumstances on which the forward-looking statement is based. Investor Relations Contact Craig Jackson Assistant Treasurer 937.259.7220 craig.jackson@dplinc.com January 13-14, 2009 1 DPL Inc. Investor Roadshow |
|
|
Non-GAAP Financial Measures This presentation contains non-GAAP financial measures as defined under SEC Regulation G. Generally, a non-GAAP financial measure is a numerical measure of a company’s historical or future financial performance, financial position, or cash flows that either excludes or includes amounts that are not normally excluded or included in the most directly comparable measure calculated and presented in accordance with generally accepted accounting principles in the United States (GAAP). Adjusted earnings per share from continuing operations is a non-GAAP financial measure referenced in this presentation. DPL’s management believes that adjusted earnings per share from continuing operations information is relevant and useful information to our investors as this measure excludes certain one-time items. Management feels that this is a meaningful analysis of our financial performance as it is not obscured by unique large factors or one-time events. Non-GAAP financial measures are used by management in evaluating the company’s ongoing operating performance. However, non-GAAP financial measures are not substitutes for financial measures determined in accordance with GAAP, and may not be comparable to financial measures reported by other companies. This presentation includes a reconciliation of the non-GAAP financial measure of adjusted earnings per share from continuing operations to the comparable GAAP financial measure of earnings per share from continuing operations. January 13-14, 2009 2 DPL Inc. Investor Roadshow |
|
|
3 Frederick Boyle – Senior Vice President, CFO and Treasurer Craig Jackson – Assistant Treasurer DPL Inc. Participants January 13-14, 2009 DPL Inc. Investor Roadshow |
|
|
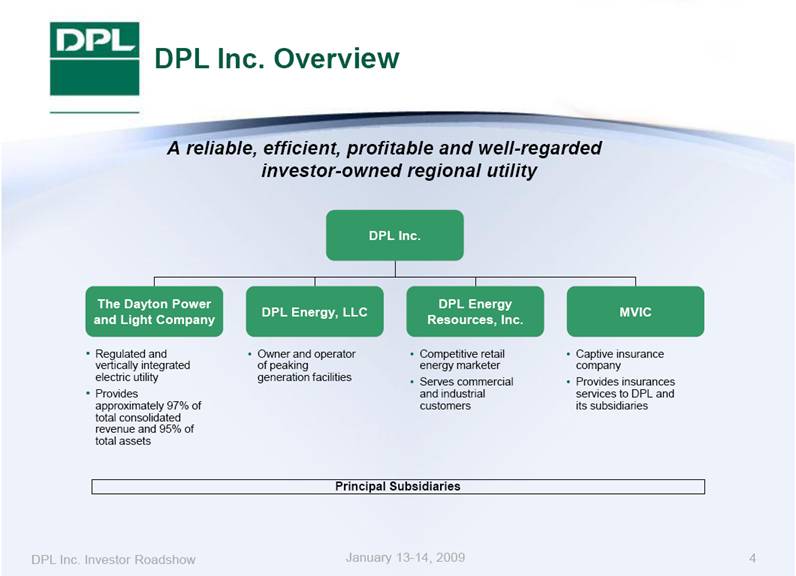
A reliable, efficient, profitable and well-regarded investor-owned regional utility DPL Inc. Overview DPL Inc. The Dayton Power and Light Company DPL Energy, LLC DPL Energy Resources, Inc. MVIC Regulated and vertically integrated electric utility Provides approximately 97% of total consolidated revenue and 95% of total assets Owner and operator of peaking generation facilities Competitive retail energy marketer Serves commercial and industrial customers Captive insurance company Provides insurances services to DPL and its subsidiaries Principal Subsidiaries January 13-14, 2009 4 DPL Inc. Investor Roadshow |
|
|
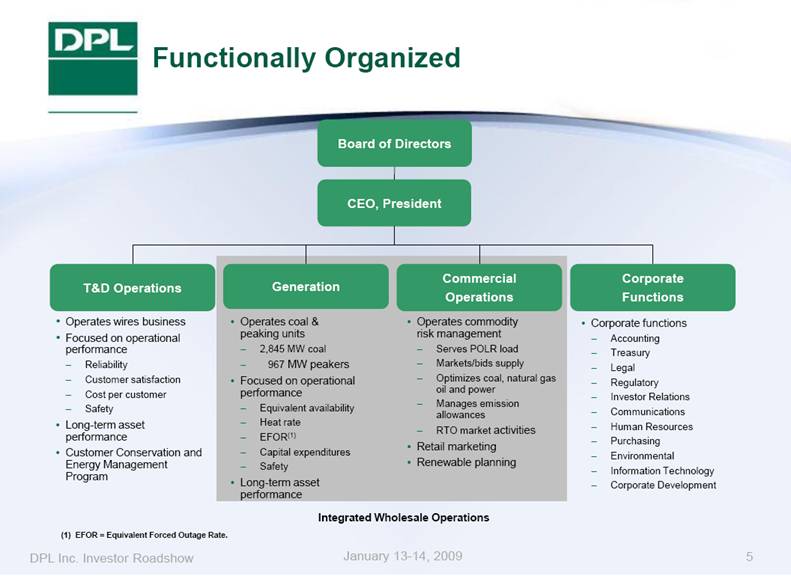
Integrated Wholesale Operations Board of Directors CEO, President Operates wires business Focused on operational performance Reliability Customer satisfaction Cost per customer Safety Long-term asset performance Customer Conservation and Energy Management Program Operates coal & peaking units 2,845 MW coal 967 MW peakers Focused on operational performance Equivalent availability Heat rate EFOR(1) Capital expenditures Safety Long-term asset performance Operates commodity risk management Serves POLR load Markets/bids supply Optimizes coal, natural gas oil and power Manages emission allowances RTO market activities Retail marketing Renewable planning Corporate functions Accounting Treasury Legal Regulatory Investor Relations Communications Human Resources Purchasing Environmental Information Technology Corporate Development T&D Operations Generation Commercial Operations Corporate Functions Functionally Organized January 13-14, 2009 5 (1) EFOR = Equivalent Forced Outage Rate. DPL Inc. Investor Roadshow |
|
|
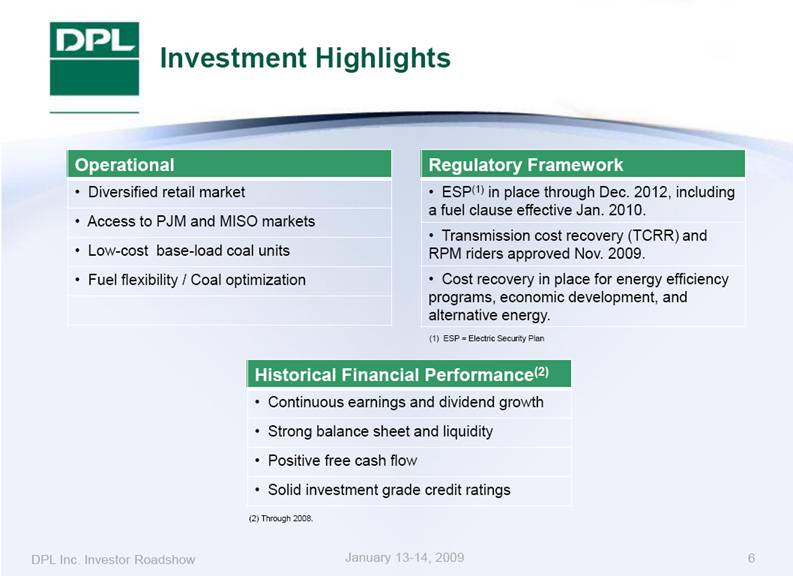
6 Investment Highlights January 13-14, 2009 Historical Financial Performance(2) Continuous earnings and dividend growth Strong balance sheet and liquidity Positive free cash flow Solid investment grade credit ratings Regulatory Framework ESP(1) in place through Dec. 2012, including a fuel clause effective Jan. 2010. Transmission cost recovery (TCRR) and RPM riders approved Nov. 2009. Cost recovery in place for energy efficiency programs, economic development, and alternative energy. Operational Diversified retail market Access to PJM and MISO markets Low-cost base-load coal units Fuel flexibility / Coal optimization (1) ESP = Electric Security Plan DPL Inc. Investor Roadshow (2) Through 2008. |
|
|
Operational |
|
|
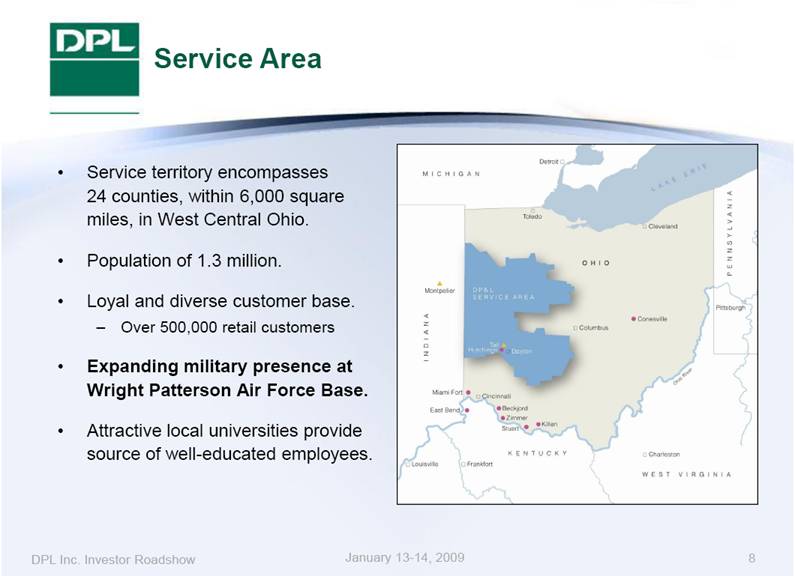
Service territory encompasses 24 counties, within 6,000 square miles, in West Central Ohio. Population of 1.3 million. Loyal and diverse customer base. Over 500,000 retail customers Expanding military presence at Wright Patterson Air Force Base. Attractive local universities provide source of well-educated employees. Service Area January 13-14, 2009 8 DPL Inc. Investor Roadshow |
|
|
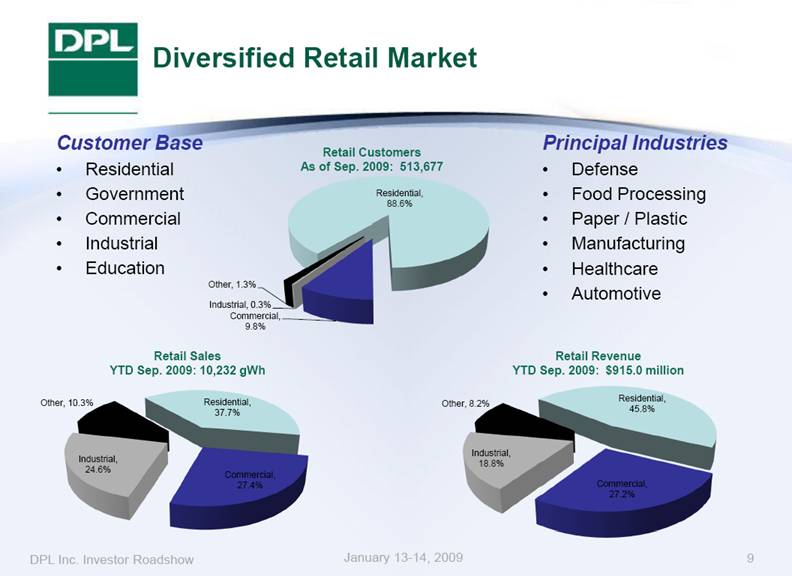
Retail Customers As of Sep. 2009: 513,677 Retail Revenue YTD Sep. 2009: $915.0 million Principal Industries Defense Food Processing Paper / Plastic Manufacturing Healthcare Automotive Diversified Retail Market Customer Base Residential Government Commercial Industrial Education Retail Sales YTD Sep. 2009: 10,232 gWh January 13-14, 2009 9 DPL Inc. Investor Roadshow |
|
|
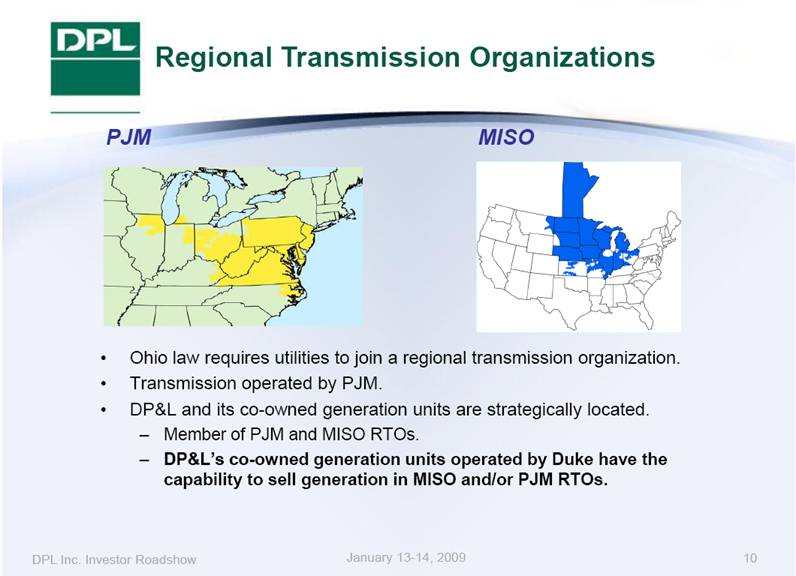
Ohio law requires utilities to join a regional transmission organization. Transmission operated by PJM. DP&L and its co-owned generation units are strategically located. Member of PJM and MISO RTOs. DP&L’s co-owned generation units operated by Duke have the capability to sell generation in MISO and/or PJM RTOs. PJM MISO Regional Transmission Organizations January 13-14, 2009 10 DPL Inc. Investor Roadshow |
|
|
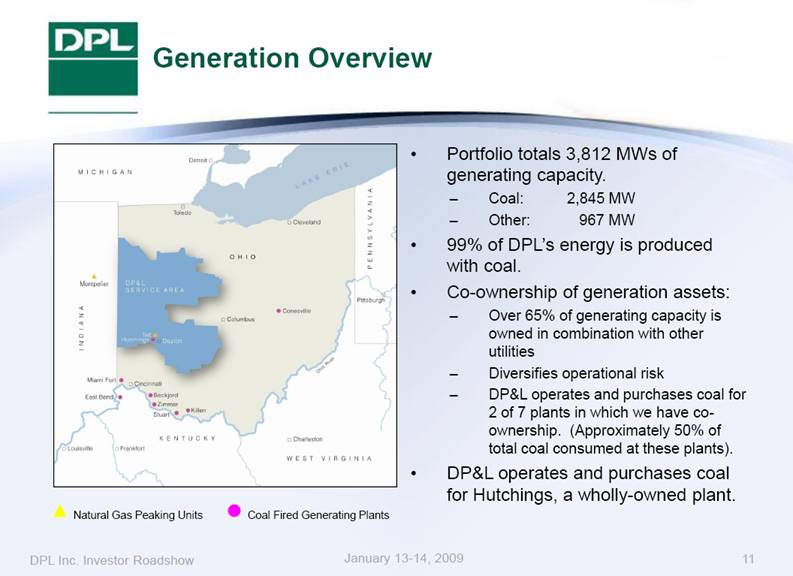
Generation Overview Natural Gas Peaking Units Coal Fired Generating Plants Portfolio totals 3,812 MWs of generating capacity. Coal: 2,845 MW Other: 967 MW 99% of DPL’s energy is produced with coal. Co-ownership of generation assets: Over 65% of generating capacity is owned in combination with other utilities Diversifies operational risk DP&L operates and purchases coal for 2 of 7 plants in which we have co-ownership. (Approximately 50% of total coal consumed at these plants). DP&L operates and purchases coal for Hutchings, a wholly-owned plant. January 13-14, 2009 11 DPL Inc. Investor Roadshow |
|
|
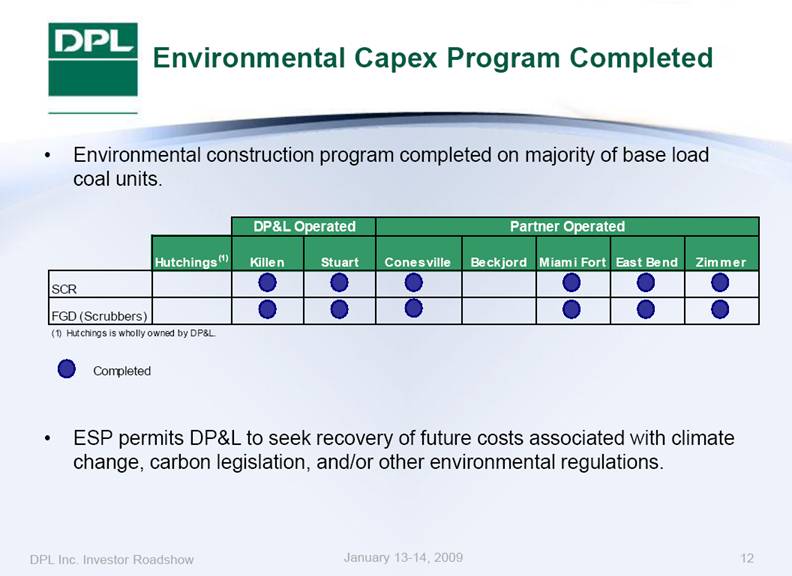
Environmental Capex Program Completed Environmental construction program completed on majority of base load coal units. ESP permits DP&L to seek recovery of future costs associated with climate change, carbon legislation, and/or other environmental regulations. January 13-14, 2009 12 DPL Inc. Investor Roadshow Completed DP&L Operated Partner Operated Hutchings(1) Killen Stuart Conesville Beckjord Miami Fort East Bend Zimmer SCR FGD (Scrubbers) (1) Hutchings is wholly owned by DP&L. |
|
|
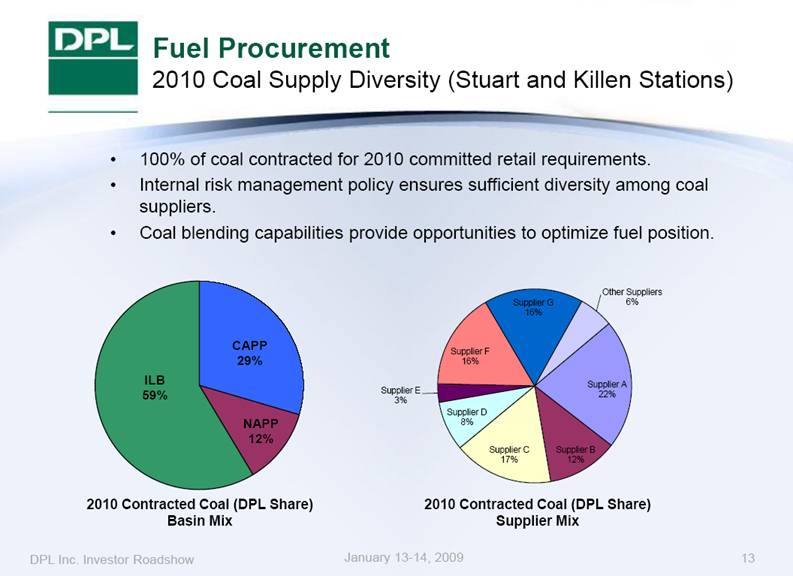
2010 Contracted Coal (DPL Share) Basin Mix 2010 Contracted Coal (DPL Share) Supplier Mix Fuel Procurement 2010 Coal Supply Diversity (Stuart and Killen Stations) 100% of coal contracted for 2010 committed retail requirements. Internal risk management policy ensures sufficient diversity among coal suppliers. Coal blending capabilities provide opportunities to optimize fuel position. January 13-14, 2009 13 DPL Inc. Investor Roadshow |
|
|
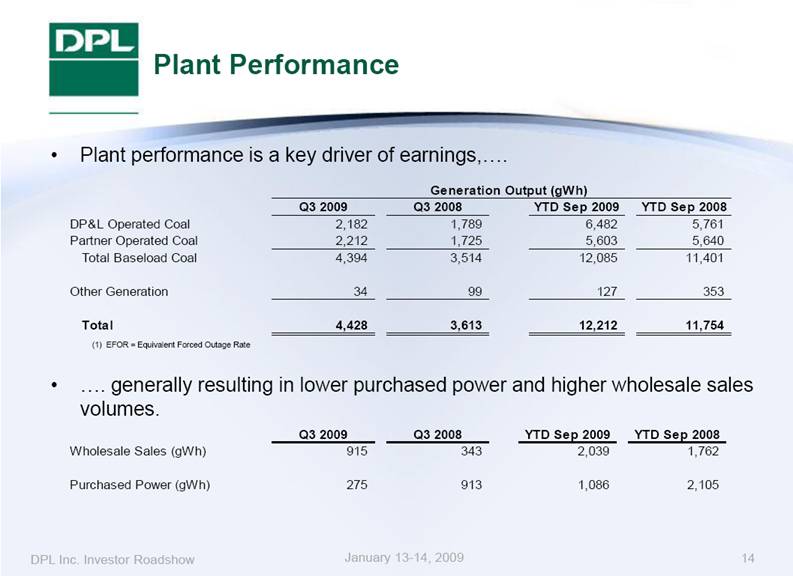
Plant Performance Plant performance is a key driver of earnings,.... ....generally resulting in lower purchased power and higher wholesale sales volumes. (1) EFOR = Equivalent Forced Outage Rate January 13-14, 2009 14 DPL Inc. Investor Roadshow Generation Output (gWh) Q3 2009 Q3 2008 YTD Sep 2009 YTD Sep 2008 DP&L Operated Coal 2,182 1,789 6,482 5,761 Partner Operated Coal 2,212 1,725 5,603 5,640 Total Baseload Coal 4,394 3,514 12,085 11,401 Other Generation 34 99 127 353 Total 4,428 3,613 12,212 11,754 Q3 2009 Q3 2008 YTD Sep 2009 YTD Sep 2008 Wholesale Sales (gWh) 915 343 2,039 1,762 Purchased Power (gWh) 275 913 1,086 2,105 |
|
|
Regulatory Framework |
|
|
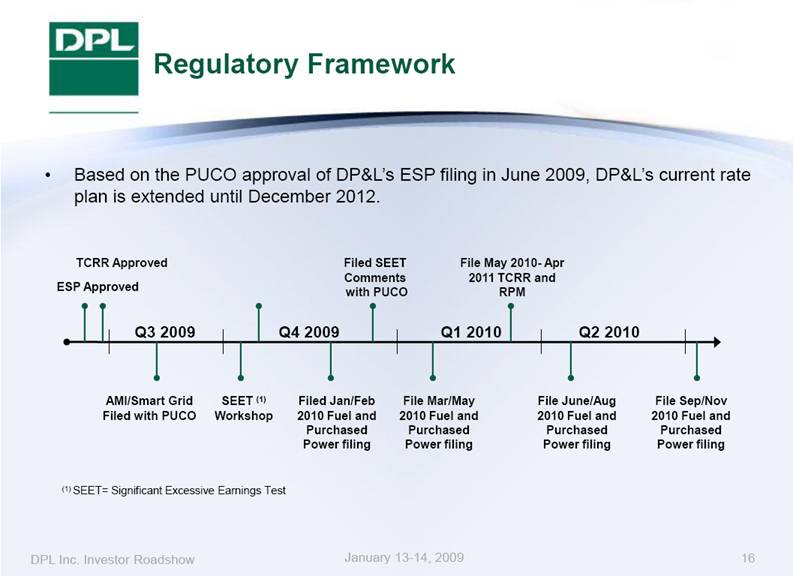
Regulatory Framework Based on the PUCO approval of DP&L’s ESP filing in June 2009, DP&L’s current rate plan is extended until December 2012. Q1 2010 Q4 2009 Q3 2009 Q2 2010 ESP Approved AMI/Smart Grid Filed with PUCO TCRR Approved SEET (1) Workshop Filed SEET Comments with PUCO Filed Jan/Feb 2010 Fuel and Purchased Power filing File Mar/May 2010 Fuel and Purchased Power filing File May 2010- Apr 2011 TCRR and RPM File June/Aug 2010 Fuel and Purchased Power filing File Sep/Nov 2010 Fuel and Purchased Power filing DPL Inc. Investor Roadshow (1) SEET= Significant Excessive Earnings Test January 13-14, 2009 16 |
|
|
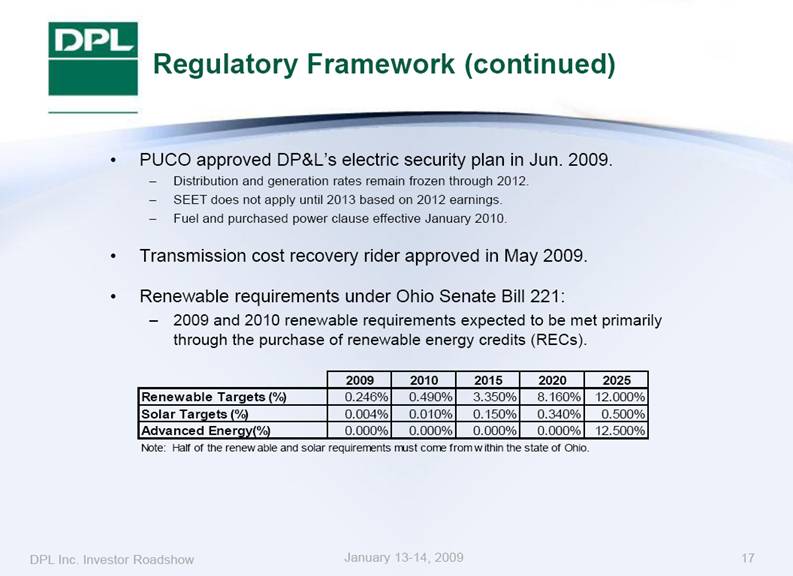
PUCO approved DP&L’s electric security plan in Jun. 2009. Distribution and generation rates remain frozen through 2012. SEET does not apply until 2013 based on 2012 earnings. Fuel and purchased power clause effective January 2010. Transmission cost recovery rider approved in May 2009. Renewable requirements under Ohio Senate Bill 221: 2009 and 2010 renewable requirements expected to be met primarily through the purchase of renewable energy credits (RECs). Regulatory Framework (continued) January 13-14, 2009 17 DPL Inc. Investor Roadshow Note: Half of the renewable and solar requirements must come from within the state of Ohio. 2009 2010 2015 2020 2025 Renewable Targets (%) 0.246% 0.490% 3.350% 8.160% 12.000% Solar Targets (%) 0.004% 0.010% 0.150% 0.340% 0.500% Advanced Energy(%) 0.000% 0.000% 0.000% 0.000% 12.500% |
|
|
Financial Performance |
|
|
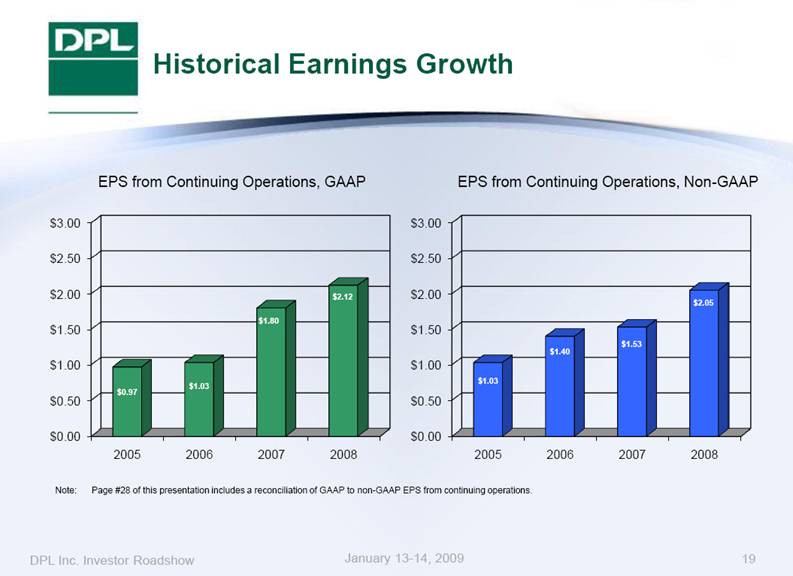
EPS from Continuing Operations, Non-GAAP Historical Earnings Growth Note: Page #28 of this presentation includes a reconciliation of GAAP to non-GAAP EPS from continuing operations. EPS from Continuing Operations, GAAP January 13-14, 2009 19 DPL Inc. Investor Roadshow |
|
|
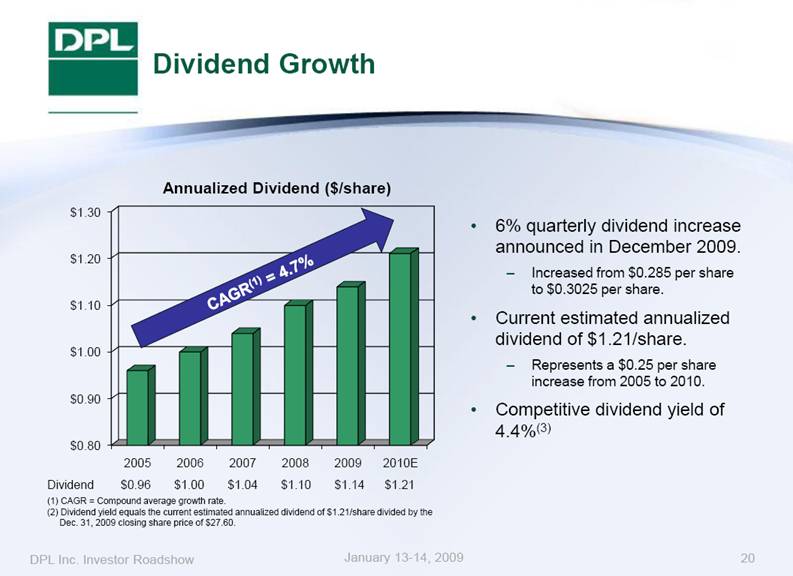
6% quarterly dividend increase announced in December 2009. Increased from $0.285 per share to $0.3025 per share. Current estimated annualized dividend of $1.21/share. Represents a $0.25 per share increase from 2005 to 2010. Competitive dividend yield of 4.4%(3) Annualized Dividend ($/share) CAGR(1) = 4.7% Dividend $0.96 $1.00 $1.04 $1.10 $1.14 $1.21 (1) CAGR = Compound average growth rate. (2) Dividend yield equals the current estimated annualized dividend of $1.21/share divided by the Dec. 31, 2009 closing share price of $27.60. Dividend Growth January 13-14, 2009 20 DPL Inc. Investor Roadshow |
|
|
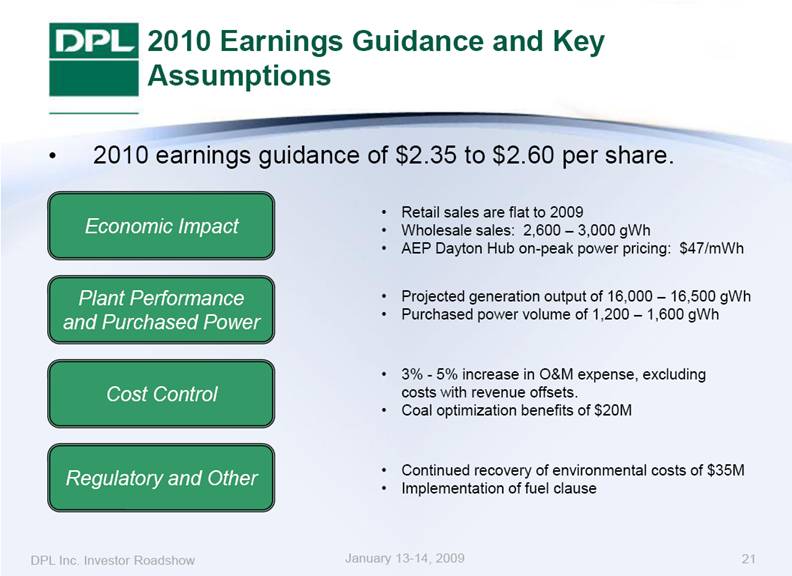
2010 earnings guidance of $2.35 to $2.60 per share. 2010 Earnings Guidance and Key Assumptions Economic Impact Retail sales are flat to 2009 Wholesale sales: 2,600 – 3,000 gWh AEP Dayton Hub on-peak power pricing: $47/mWh 3% - 5% increase in O&M expense, excluding costs with revenue offsets. Coal optimization benefits of $20M Continued recovery of environmental costs of $35M Implementation of fuel clause Projected generation output of 16,000 – 16,500 gWh Purchased power volume of 1,200 – 1,600 gWh Cost Control Plant Performance and Purchased Power Regulatory and Other DPL Inc. Investor Roadshow 21 January 13-14, 2009 |
|
|
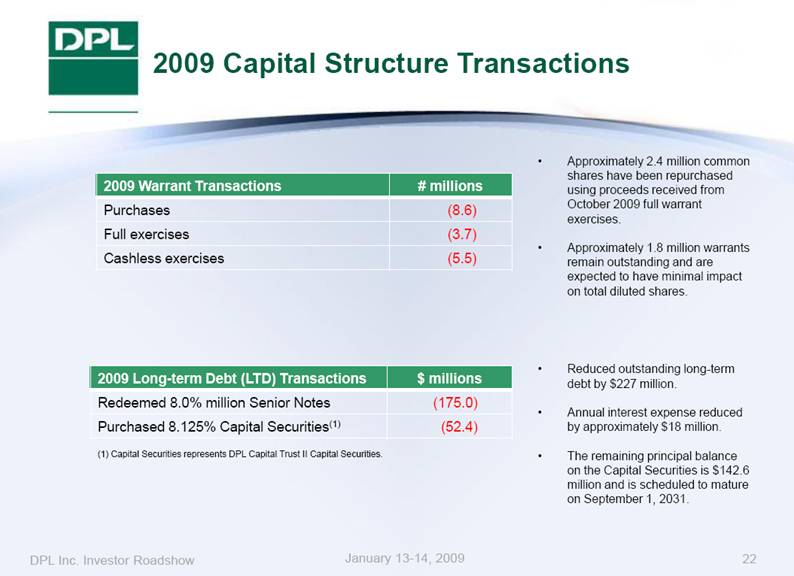
Approximately 2.4 million common shares have been repurchased using proceeds received from October 2009 full warrant exercises. Approximately 1.8 million warrants remain outstanding and are expected to have minimal impact on total diluted shares. Reduced outstanding long-term debt by $227 million. Annual interest expense reduced by approximately $18 million. The remaining principal balance on the Capital Securities is $142.6 million and is scheduled to mature on September 1, 2031. 2009 Warrant Transactions # millions Purchases (8.6) Full exercises (3.7) Cashless exercises (5.5) 2009 Long-term Debt (LTD) Transactions $ millions Redeemed 8.0% million Senior Notes (175.0) Purchased 8.125% Capital Securities(1) (52.4) (1) Capital Securities represents DPL Capital Trust II Capital Securities. 2009 Capital Structure Transactions January 13-14, 2009 22 DPL Inc. Investor Roadshow |
|
|
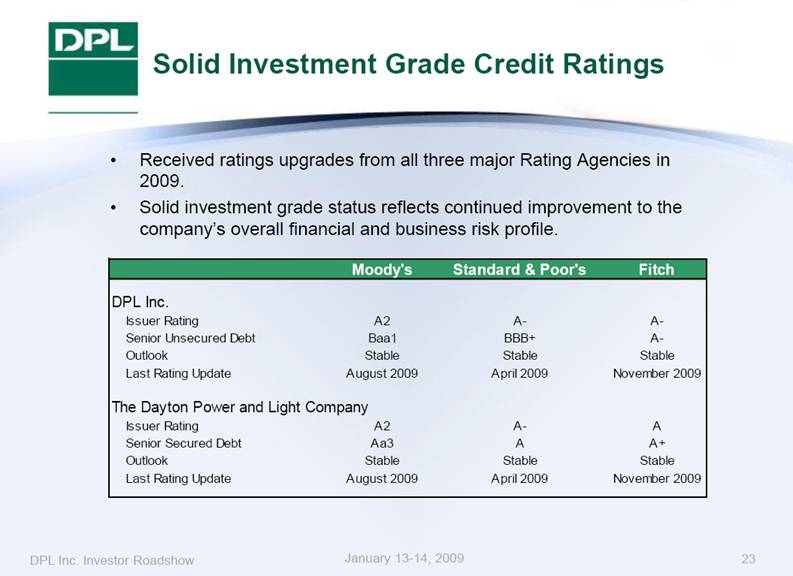
Received ratings upgrades from all three major Rating Agencies in 2009. Solid investment grade status reflects continued improvement to the company’s overall financial and business risk profile. Solid Investment Grade Credit Ratings January 13-14, 2009 23 DPL Inc. Investor Roadshow Moody's Standard & Poor's Fitch DPL Inc. Issuer Rating A2 A- A- Senior Unsecured Debt Baa1 BBB+ A- Outlook Stable Stable Stable Last Rating Update August 2009 April 2009 November 2009 The Dayton Power and Light Company Issuer Rating A2 A- A Senior Secured Debt Aa3 A A+ Outlook Stable Stable Stable Last Rating Update August 2009 April 2009 November 2009 |
|
|
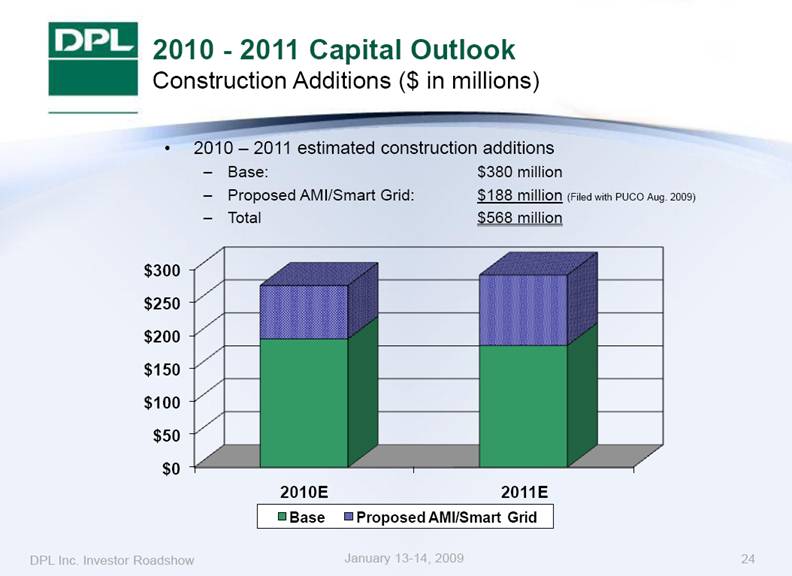
2010 - 2011 Capital Outlook Construction Additions ($ in millions) 2010 – 2011 estimated construction additions Base: $380 million Proposed AMI/Smart Grid: $188 million (Filed with PUCO Aug. 2009) Total $568 million January 13-14, 2009 24 DPL Inc. Investor Roadshow $0 $50 $100 $150 $200 $250 $300 2010E 2011E Base Proposed AMI/Smart Grid |
|
|
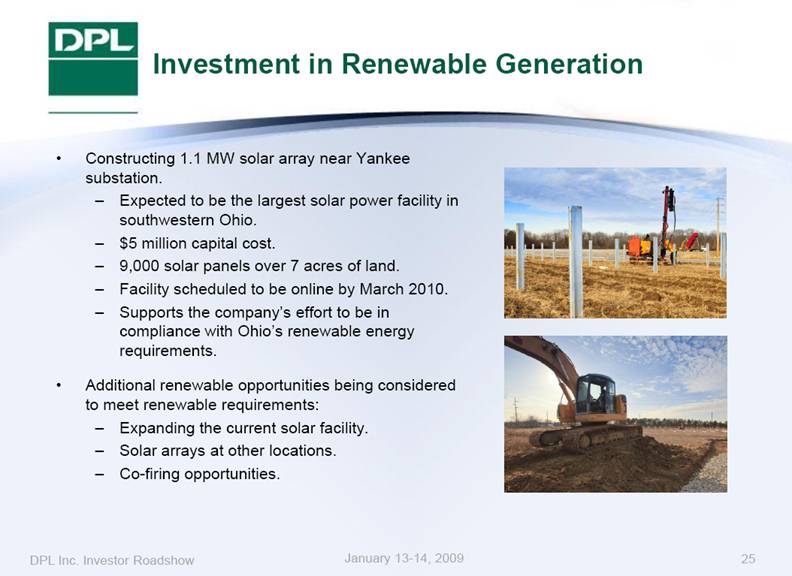
Constructing 1.1 MW solar array near Yankee substation. Expected to be the largest solar power facility in southwestern Ohio. $5 million capital cost. 9,000 solar panels over 7 acres of land. Facility scheduled to be online by March 2010. Supports the company’s effort to be in compliance with Ohio’s renewable energy requirements. Additional renewable opportunities being considered to meet renewable requirements: Expanding the current solar facility. Solar arrays at other locations. Co-firing opportunities. Investment in Renewable Generation January 13-14, 2009 25 DPL Inc. Investor Roadshow |
|
|
Appendix |
|
|
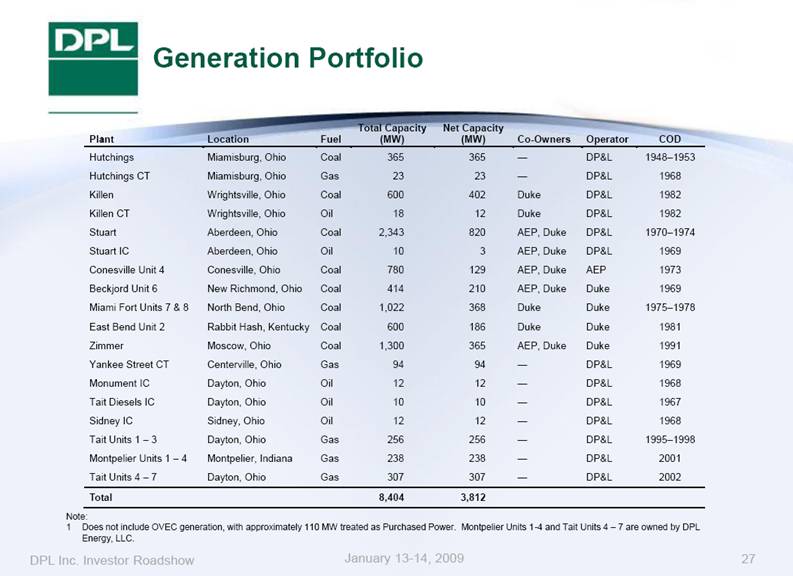
Note: 1 Does not include OVEC generation, with approximately 110 MW treated as Purchased Power. Montpelier Units 1-4 and Tait Units 4 – 7 are owned by DPL Energy, LLC. Generation Portfolio January 13-14, 2009 27 DPL Inc. Investor Roadshow Plant Location Fuel Total Capacity (MW) Net Capacity (MW) Co-Owners Operator COD Hutchings Miamisburg, Ohio Coal 365 365 — DP&L 1948–1953 Hutchings CT Miamisburg, Ohio Gas 23 23 — DP&L 1968 Killen Wrightsville, Ohio Coal 600 402 Duke DP&L 1982 Killen CT Wrightsville, Ohio Oil 18 12 Duke DP&L 1982 Stuart Aberdeen, Ohio Coal 2,343 820 AEP, Duke DP&L 1970 – 1974 Stuart IC Aberdeen, Ohio Oil 10 3 AEP, Duke DP&L 1969 Conesville Unit 4 Conesville, Ohio Coal 780 129 AEP, Duke AEP 1973 Beckjord Unit 6 New Richmond, Ohio Coal 414 210 AEP, Duke Duke 1969 Miami Fort Units 7 & 8 North Bend, Ohio Coal 1,022 368 Duke Duke 1975 – 1978 East Bend Unit 2 Rabbit Hash, Kentucky Coal 600 186 Duke Duke 1981 Zimmer Moscow, Ohio Coal 1,300 365 AEP, Duke Duke 1991 Yankee Street CT Centerville, Ohio Gas 94 94 — DP&L 1969 Monument IC Dayton, Ohio Oil 12 12 — DP&L 1968 Tait Diesels IC Dayton, Ohio Oil 10 10 — DP&L 1967 Sidney IC Sidney, Ohio Oil 12 12 — DP&L 1968 Tait Units 1 – 3 Dayton, Ohio Gas 256 256 — DP&L 1995–1998 Montpelier Units 1 – 4 Montpelier, Indiana Gas 238 238 — DP&L 2001 Tait Units 4 – 7 Dayton, Ohio Gas 307 307 — DP&L 2002 Total 8,404 3,812 |
|
|
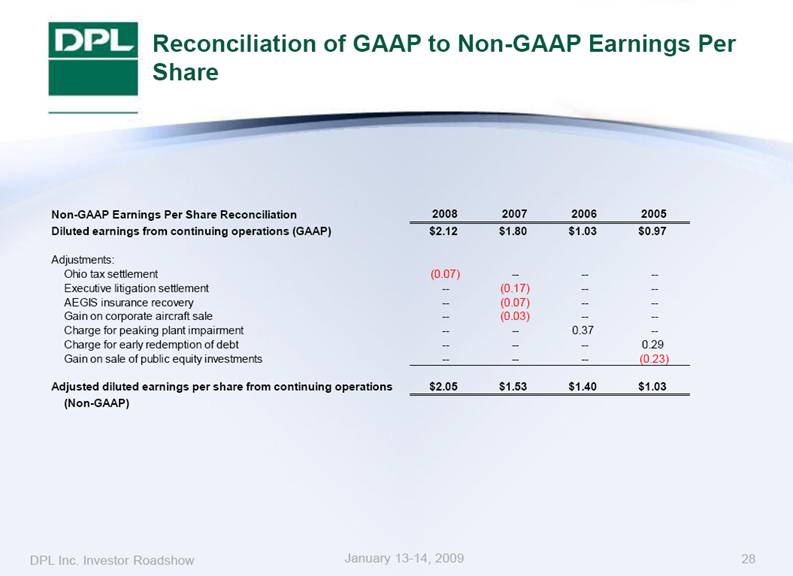
Reconciliation of GAAP to Non-GAAP Earnings Per Share January 13-14, 2009 28 DPL Inc. Investor Roadshow Non-GAAP Earnings Per Share Reconciliation 2008 2007 2006 2005 Diluted earnings from continuing operations (GAAP) $2.12 $1.80 $1.03 $0.97 Adjustments: Ohio tax settlement (0.07) -- -- -- Executive litigation settlement -- (0.17) -- -- AEGIS insurance recovery -- (0.07) -- -- Gain on corporate aircraft sale -- (0.03) -- -- Charge for peaking plant impairment -- -- 0.37 -- Charge for early redemption of debt -- -- -- 0.29 Gain on sale of public equity investments -- -- -- (0.23) Adjusted diluted earnings per share from continuing operations (Non-GAAP) $2.05 $1.53 $1.40 $1.03 |

