Attached files
| file | filename |
|---|---|
| 8-K - SUN HEALTHCARE GROUP INC | form8k.htm |
| EX-99.1 - SUN HEALTHCARE GROUP INC | ex991.htm |

28th Annual
JPMorgan
Healthcare
Conference
January
11, 2010

2
Forward-Looking
Statements
Statements made in
this presentation may contain "forward-looking" information (as defined in the
Private Securities Litigation
Reform Act of 1995), such as forecasts of future financial performance. Such statements involve risks and uncertainties and are
subject to change at any time. Factors that could cause actual results to differ are identified in the public filings made by the
company with the Securities and Exchange Commission and include changes in Medicare and Medicaid reimbursements; our
ability to maintain the occupancy rates and payor mix at our long-term care centers; potential liability for losses not covered by,
or in excess of, our insurance; the effects of government regulations and investigations; the significant amount of our
indebtedness, covenants in our debt agreements that may restrict our activities, including our ability to make acquisitions, incur
more indebtedness and refinance indebtedness on favorable terms; increasing labor costs and the shortage of qualified
healthcare personnel; the impact of current economic conditions on our liquidity, results of operations and our ability to collect
our receivables; and our ability to receive increases in reimbursement rates from government payors to cover increased costs.
More information on factors that could affect our business and financial results are included in our public filings made with the
Securities and Exchange Commission, including our Annual Report on Forms 10-K and 10-KA and Quarterly Reports on Forms
10-Q and 10-QA, copies of which are available on Sun’s web site, www.sunh.com.
The forward-looking statements involve known and unknown risks, uncertainties and other factors that are, in some cases,
beyond our control. We caution that any forward-looking statements made by us are not guarantees of future performance. We
disclaim any obligation to update any such factors or to announce publicly the results of any revisions to any of the forward-
looking statements to reflect future events or developments.
Furthermore,
references to non-GAAP financial information and pro forma, normalized data
contained herein are reconciled to
comparable GAAP financial information in our earnings release dated October 27, 2009, which is available on our website at
www.sunh.com and has been filed with the SEC on Form 8-K. Any documents filed by Sun with the SEC may be obtained free
of charge at the SEC’s web site at www.sec.gov. In addition, investors and stockholders of Sun may obtain free copies of the
documents filed with the SEC by contacting the Investor Relations Department of Sun at (505) 468-2341 (TDD users, please
call (505) 468-4458) or by sending a written request to Investor Relations, Sun Healthcare Group, Inc., 101 Sun Avenue NE,
Albuquerque, NM 87109. You may also read and copy any reports, statements, and other information filed by Sun with the SEC
at the SEC public reference room at Room 1580, 100 F Street, N.E., Washington, D.C. 20549. Please call the SEC at (800)
SEC- 0330 or visit the SEC’s web site for further information.
References
to “Sun” refer to Sun Healthcare Group, Inc. and its subsidiaries

3
Investment
Highlights
• Solid
balance sheet with leverage reducing every quarter
• The
economy does not change the need for post-acute services
• Part
of the solution to lowering healthcare costs
• Attractive
industry fundamentals and reimbursement outlook
• Nationally
diversified portfolio of facilities
• Focus
on high-acuity patients
• Strong
financial performance
• Robust
cash flow
• Proven
and experienced management team

4
Sun
Healthcare Group
• SunBridge
– 205
inpatient facilities
19,700 patients/residents
19,700 patients/residents
– Significant
facility ownership
• 93
Facilities - 45%
• SunDance
– 440+
contracts/328 non-affiliated
– Contract
services, rehab agency,
management services
management services
• CareerStaff
– More
than 50% of business is in
hospital settings (also serves SNFs,
schools, prisons)
hospital settings (also serves SNFs,
schools, prisons)
– Primary
customer needs served are
for therapists
for therapists
• SolAmor
– Targeted
growth business
– Doubled
revenues in 9/30/09 LTM
Private
Pay
and Other
and Other
Skilled
Mix
Medicaid
CareerStaff
Inpatient
SunDance
9/30/09
LTM Net Revenue
9/30/09
LTM Net Revenue
Total: $ 1.9
billion
Total: $ 1.9
billion
%
of 9/30/09 LTM Net Revenue
%
of 9/30/09 LTM Net Revenue
By
Business Unit
By
Business Unit
25.0%
35.0%
40.0%
5.6%
88.9%
5.5%

5
Growth
Story
Revenue
EBITDA
(Normalized)
(Normalized)
($
in millions)
(a) Pro Forma with
Harborside
(b) Unaudited
estimate
(c) 2010 Guidance
Midpoint
$1,883.0
2008
2007
(a)
$1,718.7
2009
(b)
$1,823.5
($
in millions)
2008
$176.0
2007
(a)
$129.6
2009
(b)
$162.9
$1,942.0
2010
(c)
$171.1
2010
(c)
7.5%
margin
8.9%
margin
9.3%
margin
8.8%
margin
6.1%
increase
3.3%
increase
3.1%
increase
6
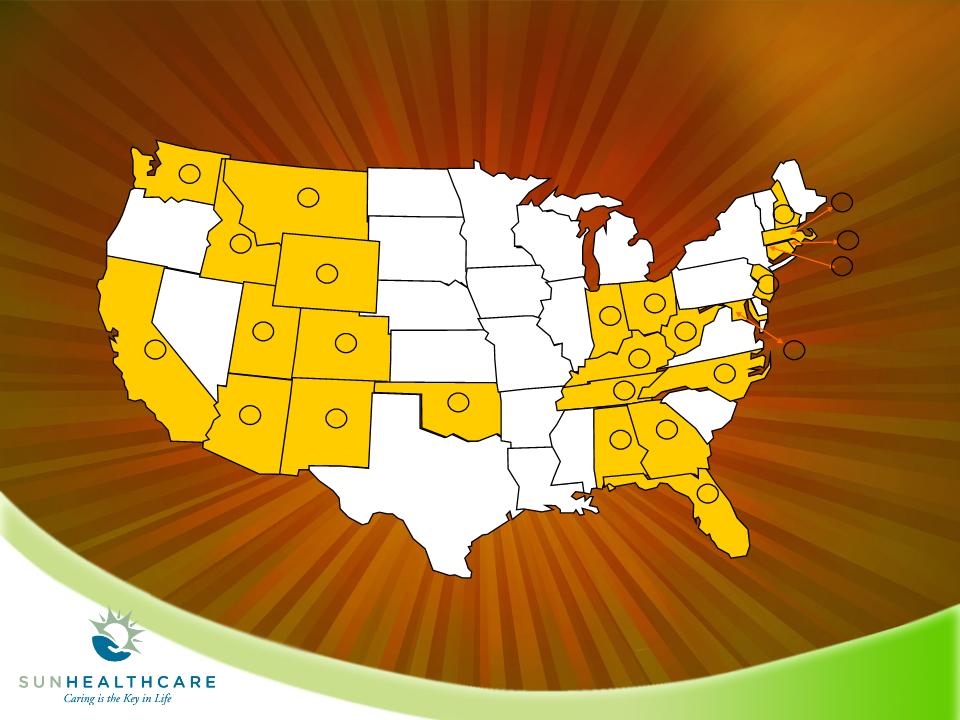
Nationally
Diversified Portfolio Of Facilities
6
5
10
15
1
1
9
1
12
9
2
20
3
18
10
1
15
2
17
7
9
8
8
9
7
23,205
Licensed Beds in 25 States
22,423
Available Beds
205
inpatient facilities - 93 owned (45%)

7
2010
Guidance
|
(Dollars
in millions, except EPS)
|
|
2010
Full-Year Guidance
|
|
|
|
|
Low
|
High
|
|
Revenue
|
|
$ 1,930.0
|
$ 1,954.0
|
|
EBITDAR
|
|
$ 244.0
|
$ 250.0
|
|
EBITDA
|
|
$ 168.2
|
$ 174.0
|
|
Pre-tax
earnings
|
|
$ 69.2
|
$ 73.8
|
|
Income
from continuing operations
|
|
$ 40.8
|
$ 43.5
|
|
Diluted
earnings per share
|
|
$ 0.92
|
$ 0.98
|
|
Diluted
weighted average shares
|
|
44.5
|
44.5
|
|
EBITDAR
margin
|
|
12.6%
|
12.8%
|
|
EBITDA
margin
|
|
8.7%
|
8.9%
|

8
2010
Guidance Assumptions:
• compensation
and benefits are expected to increase approximately 3 percent;
• center
lease costs are expected to increase approximately 3.8 percent:
– 1.5
percent for built-in increases
– 2.3
percent related to facility modernization in cooperation with certain
landlords
• non-recurring
costs in 2010 of $2.5 million associated with completing the installation of
the
first phase of our new clinical/billing platform, which will be fully
implemented and operational
in third quarter 2010; and
Non-Operating
Assumptions
• no
additional acquisitions or dispositions;
• an
average outstanding debt balance of $685 million with an average all-in interest
rate of 7.4
percent;
percent;
• annual
increase in depreciation and amortization of $5.0 million;
• capital
expenditures of between $50 million and $55 million, principally
for:
– routine
maintenance and renovations for facilities and IT systems;
– the
build-out of 570 suite beds for our Rehab Recovery Suites® in 2010, bringing
our
total suite bed count up to 2,100 by the end of 2010, an increase of almost 38
percent; and
– the
completion of our new clinical/billing platform.
• an
effective income tax rate of 41 percent and 2010 cash income taxes paid between
$8 million
and $10 million
and $10 million
Sun’s
2010 guidance is based on the continuing operations of the company and the
following
additional
assumptions:
Operating
Assumptions

9
Reimbursement
Update
Medicare
• Washington
Healthcare Reform Update
• STRIVE
(Staff Time and Resource Intensity
Verification project)
Verification project)
– Implementation
proposed for FY 2011
(October 2010)
(October 2010)
– Update
current Resource Utilization Group
(RUG) system to RUG - IV
(RUG) system to RUG - IV
Medicaid
• 20
out of 25 states have frozen or reduced rates
in CY 2009, resulting in an estimated $5.4
million loss of expected revenue
in CY 2009, resulting in an estimated $5.4
million loss of expected revenue

10
SunBridge
Key Strategies
• Enhance
our clinical product
– Focus
on specialty services -Solana/Rehab Recovery
Suites®
Suites®
– Execute
on systems/processes to ensure consistency
• Enhance
Business Development activities to define
markets and train team
markets and train team
– Obtain
strategic support data: demographics, hospital
sources
sources
– Provide
training, tools, tracking and standards to sales and
relationship management team
relationship management team
– Improve
intake and admission process
• Upgrade
physical assets and technology
– Reinvest
in the “bricks and mortar”
– Upgrade
clinical/billing and time and attendance technology
platforms
platforms

11
SunBridge
Performance Metrics
Occupancy
(1)
Occupancy excludes hospital
Q3
‘08
Q3
‘09
88.7%
87.9%
Q2
‘09
87.7%
(3)
Quality mix includes all non-Medicaid inpatient
revenues
revenues
Inpatient
Revenue Quality Mix
Q2
‘09
Q3
‘09
Q3
‘08
54.3%
54.9%
54.9%
$172
$171
$352
$458
Inpatient
Revenue Per Patient Day
$423
$371
$167
Medicaid
Private
and Other
(Percentages
represent change from prior period)
Q3
‘08
Q3
‘09
$175
Managed
Care/Comm
Medicare
Part A
3.0%
2.6%
5.4%
8.1%
(2)
SNF beds only
Managed
Care
Care
Skilled
Mix as a % of Revenue
Q2
‘09
32.2%
31.6 %
Q3
‘09
Q3
‘08
6.1%
37.4%
38.3%
Medicare
5.8%
6.5%
39.1%
32.6 %

12
Product
Diversification
Rehab
Recovery Suites®
• Separate
and distinct units within
a center
a center
• Enhanced
therapy and clinical product
• Hospitality
services - dedicated concierge
• Target
short-term
younger Medicare and
managed care patient
managed care patient
– Average
unit size: 21 beds per center
– Cost/bed
: $25,000/bed
– Development
time: 6-9 months
• 1530
beds in 63 centers at the end of 2009
– Target
570 additional beds in 2010
Solana
Alzheimer’s Care
• Separate
and distinct units within
47 centers
47 centers
• Designated
program directors
• Structured
schedule of activities
• 5.3
million U.S. citizens have
Alzheimer’s
Alzheimer’s
– 3.4
million over age 71 have
dementia
dementia
– 1
out 8 persons over age of 65
have Alzheimer’s
have Alzheimer’s
• Target
long-term
stay
residents through
community referrals
community referrals
– Average
unit size : 38 beds per
center
center
– Average
occupancy: 90.9%

13
Rehab
Recovery Suites
Skilled
Mix % Based on
Patient Days
Patient Days
Centers
w/ RRS units
Q3
‘08
Q3
‘08
Q3
‘09
Q3
‘09
5.2%
5.5%
15.9%
16.0%
2.9%
3.0%
15.5%
All
other centers
15.0%
21.1%
21.5%
18.4%
18.0%
Managed
Care
Medicare
Centers
w/ RRS units
All
other centers
89.8%
44.8%
88.4%
40.4%
Q3
‘09
Q3
‘09
REX
Rehab
3rd Quarter 2009 Rehab
%

14
SolAmor
Hospice Key Strategies
• Focus
on synergistic opportunity
– Approximately
10 percent of patients in each LTC center are
eligible for hospice services
eligible for hospice services
• Complete
rollout of new technology (Home Care Home Base)
• “A
Novel Approach”
– Individualizing
hospice care through alternative therapies and
final wishes
final wishes
• Add
Palliative Care as link from LTC to hospice
– Quality
of Life Specialist
• Grow
through acquisitions
– Focus
where we have a large concentration of SunBridge
affiliated centers
affiliated centers
– On
October 1, 2009 we acquired regional hospice company
with ADC of approximately 300, annual revenues of
$17 million, and EBITDA margins of 20%

15
SolAmor
Performance Metrics
Q3
‘08
Q3
‘09
340
546
ADC
Q3
‘09
Q3
‘08
Revenue
($
in millions)
$4.1
$7.2
EBITDA
Margin
22.2%
8.3%
Q3
‘08
Q3
‘09

16
SunDance
Key Strategies
• Enhance
recruitment and retention
• Accelerate
sales volume and new sales contribution
• Augment
customer service and contract retention
priorities
priorities
• Execute
product installation and standardization
– Customized
clinical products for growing ALF/CCRC market
segment
segment
• Improve
margin
– Exit
strategies for non-profitable business sites
– Grow
favorable payor mix
17
Q3
‘08
Q3
‘09
$44.5
$45.0
Revenue
($
in millions)
Q2
‘09
$38.3
Revenue
/ Contract
($
in thousands)
$86.9
$99.6
Q3
‘08
Q3
‘09
Q2
‘09
$100.2
Q3
‘09
Q2
‘09
7.3%
6.1%
EBITDA
Margin
Q3
‘08
5.0%
Non-Affiliated
Contracts
Q3
‘08
Q2
‘09
Q3
‘09
325
326
328

18
CareerStaff
Key Strategies
• Extend
service areas in all marketplaces
– Increased
focus on virtual markets to expand geographical
coverage
coverage
• Focus
on long term assignments
• New
service offerings
– Weekend
only therapy placements to acute care hospitals
• Strengthen
Locum Tenens
– Introduce
additional specialties: radiology, OB Gyn, and pediatrics
– Improve
growth in: general surgery, anesthesiology and primary
care
care
• Public
school system
• Home
healthcare
– Focus
on start-of-care evaluations
• Aggressive
implementation of Tax Free Advantage Program (TFAP)
– Intended
as a way to offset margin erosion

19
Q3
’09 Revenue
By Type
60.7%
25.4%
7.7%
6.2%
Pharmacy
Allied
Nursing
Physician
Services
CareerStaff
Unlimited Performance Metrics
EBITDA
Margin
8.9%
9.5%
Q3
‘08
Q3
‘09
Q2
‘09
9.3%
Q3
‘08
Q3
‘09
Revenue
($
in millions)
Q2
‘09
$30.1
$26.7
$24.4

Sun’s
Commitment to Quality
• Published
1st annual
report
on quality
on quality
– Quality
First Pledge
– Advancing
Excellence
Campaign
Campaign
• Key
metrics ahead of
national peers
national peers
p.
2 Letter
from Our CEO
p.
3 Our
Public Commitments to Quality Improvement
p.
7 About
Our Nursing Centers
p.
9 Our
Approach to Quality and its Measurement
p.
10 Quality
Information
p.
18 Enhancing
the Quality of Our Residents’ Lives
p.
20 About
Our Employees
p.
22 Employee
Spirit and Achievement
p.
24 Investing
in Our Future
(Can
be found on our website @ www.sunh.com)

21

22
|
(dollars
in thousands, except per share data)
|
2008
|
|||
|
|
2009
|
|||
|
Revenue
|
$470,893 |
$455,757
|
||
|
Depreciation
and amortization
|
11,460
|
10,165
|
||
|
Interest
expense, net
|
12,231
|
13,070
|
||
|
Income
from continuing operations
|
10,389
|
9,421
$ 57,351
|
||
|
EBITDAR
normalized
|
$ 60,366
|
|||
|
Margin
- EBITDAR normalized
|
12.8%
|
12.6%
|
||
|
|
||||
|
EBITDA
normalized
|
$ 42,172
|
$ 38,942
|
||
|
Margin
- EBITDA normalized
|
9.0%
|
8.5%
|
||
|
Income
from continuing operations -
normalized |
$ 10,903
|
$ 9,421
|
||
|
Diluted
earnings per share - normalized
|
$0.25
|
$0.21
|
||
Sun
3rd Quarter 2009 Results
3rd Quarter Ended
September 30,
Actual
Results

23
Interest
Rate
Rate
Debt
Table - September 2009
9.57%
5.21%
6.79%
11.76%
6.85%
5.76%
($
in millions)
330.0
Term
Loans
$ -
Revolving
Credit Facility - $50 million
$ 702.6
200.0
502.6
0.9
171.7
$ 117.4
Total
Debt
Subordinated
Debt
Senior
Secured Debt
Capital
Leases
Mortgage
Debt
Debt:
Cash
Debt

24
Credit
Statistics
<4.25x
2009
Credit
Statistics
174.9
172.3
EBITDA
(LTM Normalized Pro Forma)
53.5
54.2
Interest
Expense
3.59x
$618.6
June
30, 2009
Required
Bank Covenants
3.40x
Total
Net Debt/EBITDA
$595.2
Total
Net Debt (1)
Sept
30, 2009
(1) Total
Debt reduced by cash balances in excess of $10 million
Total
Net Debt/EBITDA
*All
amounts calculated as defined in Sun’s Credit Agreement
2010
<3.50x
($
in millions)

25
Average
Weighted Cost of Debt
|
Debt
Type
|
Outstanding
|
%
of
Total
|
Average
Rate (2)
|
|
Variable
|
$205.1
|
29%
|
3.40%
|
|
Fixed (1)
|
497.5
|
71%
|
8.27%
|
|
Total
|
$702.6
|
100%
|
6.85%
(3)
|
1) Includes
$150 million of term loans fixed via an interest rate swap
2) Includes
amortization of deferred financing costs
3) 17
basis points lower than June 30, 2009
Variable
vs. Fixed
As
of September 30, 2009
($
in millions)

26
Strong
Free Cash Flow
|
($
in millions)
|
|
|
|
Cash
flow from operations
|
$87.8
|
$92.0
|
|
Capital
expenditures
|
(42.5)
|
(41.5)
|
|
Free
cash flow
|
$45.3
|
$50.5
|
|
Projected
FYE 2009
|
|
$48
to $53
|
(1)
Includes $7.1 million related to converting a portion of restricted cash to a
letter of credit
Nine
Months
2009
(1)
FYE
2008
