Attached files
| file | filename |
|---|---|
| 8-K - FORM 8-K - DAKTRONICS INC /SD/ | a8kfy10needham.htm |
| EX-99.2 - EXHIBIT 99.2 NEWS RELEASE - DAKTRONICS INC /SD/ | ex99_2.htm |

Investor
Presentation
FY2010
Second Quarter
FY2010
Second Quarter

Cautionary
Notice
In addition to statements of fact, this presentation contains
forward-looking statements reflecting the company’s expectations or beliefs
concerning future events which could materially affect company performance in
the future. The company cautions that these and similar statements involve risk
and uncertainties including changes in economic and market conditions,
seasonality of business, timing and magnitude of future contracts, management of
growth, and other risks noted in the company’s SEC filings which may cause
actual results to differ materially. Forward-looking statements are made in the
context of information available as of the date stated. The company undertakes
no obligation to update or revise such statements to reflect new circumstances
or unanticipated events as they occur.

Why we
are No. 1 in our industry -
Executing against our mission to be the world
leader at informing people through dynamic
audio-visual communications systems
Executing against our mission to be the world
leader at informing people through dynamic
audio-visual communications systems
• 41 years of proven
track record in the industry
• Unparalleled sales
and service coverage
• Depth and breadth of
product offering
• Complete integrated
solution including software
• Engineering
capabilities
• Capacity to deliver:
5 plants in the United States

FINANCIAL
SUMMARY

Financial
History
117%
Revenue growth over the past 3 years
|
(Dollars
in thousands
except
per share data)
|
FY2005
|
FY2006
|
FY2007
|
FY2008
|
FY2009
|
|
5-Yr
CAGR |
|
Sales
|
$230,346
|
$309,370
|
$433,201
|
$499,677
|
$581,931
|
|
|
|
Operating
Income
|
$19,436
|
$31,815
|
$36,915
|
$38,243
|
$42,617
|
|
9.1%
|
|
Earnings
Per Share
|
$0.39
|
$0.52
|
$0.59
|
$0.63
|
$0.64
|
|
|
|
Dividend
Per Share
|
-
|
0.05
|
0.06
|
0.07
|
0.09
|
|
|
|
(Dollars
in thousands
except
per share data)
|
FY2005
|
FY2006
|
FY2007
|
FY2008
|
FY2009
|
|
|
|
Cash
from Operations
|
$22,377
|
$31,917
|
$14,606
|
$59,833
|
$48,730
|
|
18.3%
|
|
Capital
Expenditures,
net |
(12,981)
|
(18,588)
|
(58,528)
|
(33,393)
|
(18,221)
|
|
7.0%
|
|
Free
Cash Flow
|
$9,396
|
$13,329
|
$(43,922)
|
$26,440
|
$30,509
|
|
20.4%
|

Historical
Perspective: Revenue
more than doubled from FY2005
through FY2008 - 30% CAGR
more than doubled from FY2005
through FY2008 - 30% CAGR
During
this timeframe:
• Rapid growth:
capacity was the primary constraint
• Added two
manufacturing plants, Sioux Falls, and
Redwood Falls and reorganized existing plants to a
product focus
Redwood Falls and reorganized existing plants to a
product focus
• Set objective of
becoming world class manufacturing
organization using “lean” practices
organization using “lean” practices

Accomplishments
toward becoming
a World Class Manufacturing
Organization
a World Class Manufacturing
Organization
• Implementation of
lean practices in manufacturing
• Toyota lean
practices are the guide for this program
• Flow lines in every
factory
• Reliability lab,
quality engineering
• Decentralized
inventory
• Standardized product
design for “custom” products
• Implementation of
lean product development methods
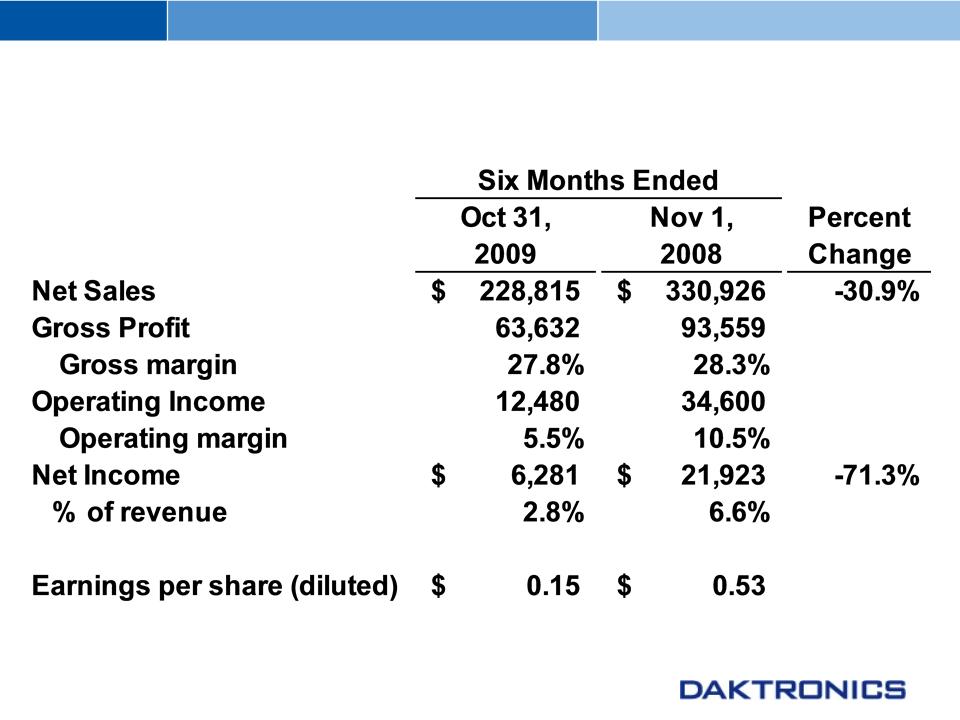
FY 2010
Second Quarter YTD Results*
*($
in thousands, except per share data)

FY2009
was a two-part story
• First half of year
revenues were $330 million, a $660
million run rate (10.5% operating margin).
million run rate (10.5% operating margin).
• Second half revenues
were $250 million, or a $500
million run rate (3.2% operating margin)
million run rate (3.2% operating margin)
• Billboard net sales
declined from $26 million in Q2 of
fiscal 2009 to $3 million in Q4 of fiscal 2009
fiscal 2009 to $3 million in Q4 of fiscal 2009
• Excess capacity in
third and fourth quarter hurt the
bottom line
bottom line
• Began cost reduction
initiatives in second half of fiscal
2009
2009

Strong
cash position
• Free cash
flow
• FY09 - $31
million
• FY10 through Q2 -
$23 million
• $57 million of net
cash at end of FY10 Q2
• Debt
free

Business is
Organized in 5
Business Units (“BU”)
Business Units (“BU”)
• Domestic (includes
Canada)
• Commercial
• Live
Events
• Schools and
Theaters
• Transportation
• International
• BUs provide focus,
but key strategy is to
leverage resources across the company
leverage resources across the company
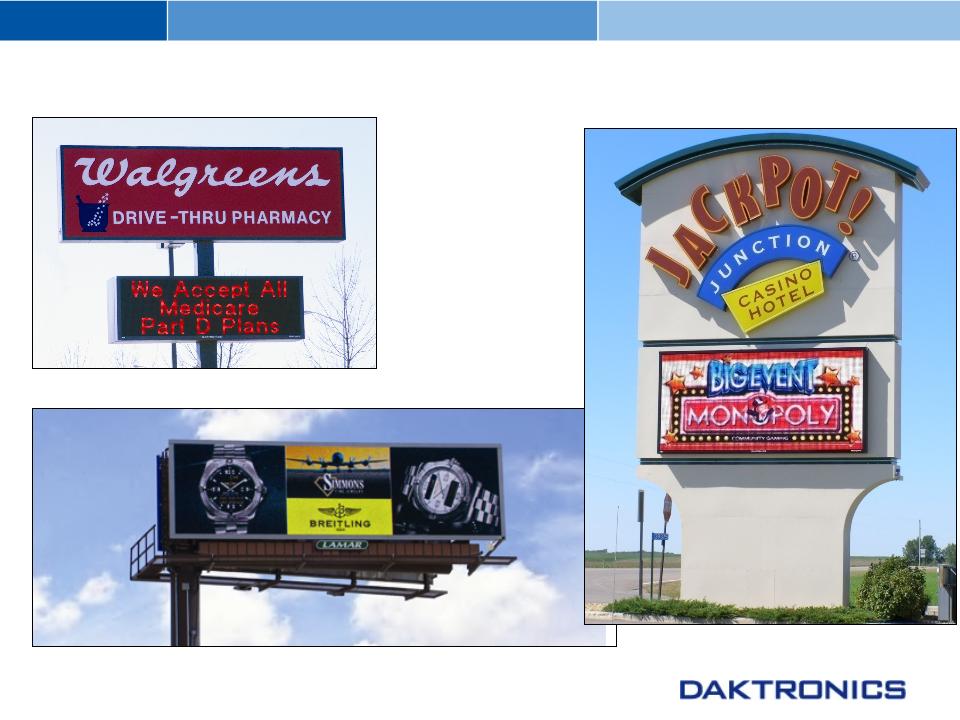
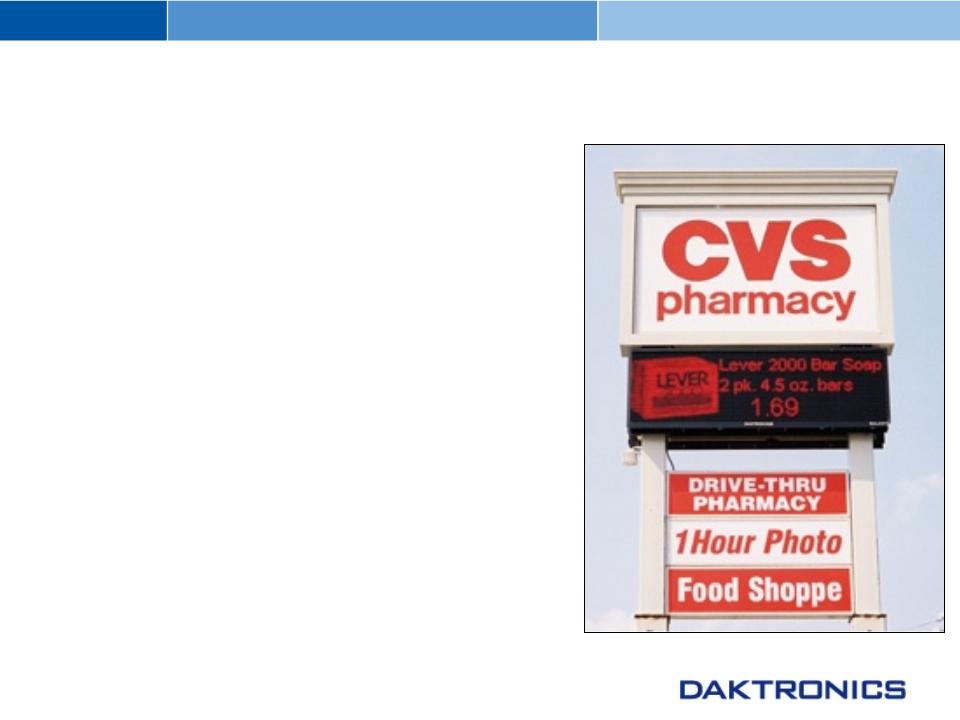
Commercial Business
Unit

Three
main areas
• Digital
billboard
• National
accounts
•
Resellers
Main
products
• ValoTM digital
displays
• GalaxyProTM
• PS-X and
HD-X
video
27% of
FY09 net sales
FY10
net sales down 47% YTD through Q2
Commercial
Overview
Long-term
Growth Drivers
• Greater acceptance
& increasing use
• Effective
advertising medium
Competitors
• Resellers - Optec,
Watchfire, EDS
• National Accounts -
Optec, Hi-Tech
• Digital Billboards -
Yesco, Optotec

Current
Outlook for Commercial
• Expect billboard
orders to remain weak
through at least calendar 2010
through at least calendar 2010
• Adversely impacted
by
• Current economic
environment
• Credit
availability
• Increased price
pressure


Live
Events Overview
• Large sports
venues
• Professional sports
facilities
• College and
university facilities
• Mobile and
modular:
• Rental and
staging
• Touring
companies
• Pari-mutuel
• 46% of net sales in
FY09
• FY09 net sales up
60% over FY08
• FY10 net sales down
27% YTD through Q2

Live
Events Long-term Growth Drivers
• Fan
experience
• High definition
(HD)
• Competition
between
venues
venues
• Improving
price/
performance of LED
technology
performance of LED
technology
• Revenue
generation

Large
Sports Venues - New Construction
• FY2009 was big year
for new construction
• Significant increase
in spending for display systems in new venues
• Large contracts in
FY2009:
• New Meadowlands
Stadium - $45 million
• Minnesota Twins - $8
million
• Kansas City Royals
-$10 million
• Cincinnati Reds - $9
million
• Kansas City Chiefs -
$9 million
• University of
Minnesota - $9 million
• New York Mets - $11
million
• New York Yankees -
$20 million
• Few construction
projects in FY2010
• Typical volatility
in the business
• Economic pressures
and competitive environment impacting FY10

Mobile
& Modular
• Designed
for ease of use, set-up and tear down

Live
Events Competition
Large
Sports Venues
• Mitsubishi,
Lighthouse, ANC, Barco, and others
• Competition
generally must partner with others to
compete with Daktronics breadth of product
compete with Daktronics breadth of product
• Increasingly
competitive environment
Mobile
and Modular
• Barco, Lighthouse,
Toshiba, Hibino
Seeing
increased pricing pressure

Schools
& Theatres
Business Unit
Business Unit

Schools
& Theatres Overview
Customers
• Elementary and high
schools, junior colleges
• Park and recreation
departments
• Theatres
Main
Products
• Scoring
Systems
• Galaxy®
displays
• Vortek® hoist
systems
11% of
net sales in FY09
Primary
funding is through local sponsors and advertising
FY2010
net sales down 6% YTD through Q2

International
Business Unit
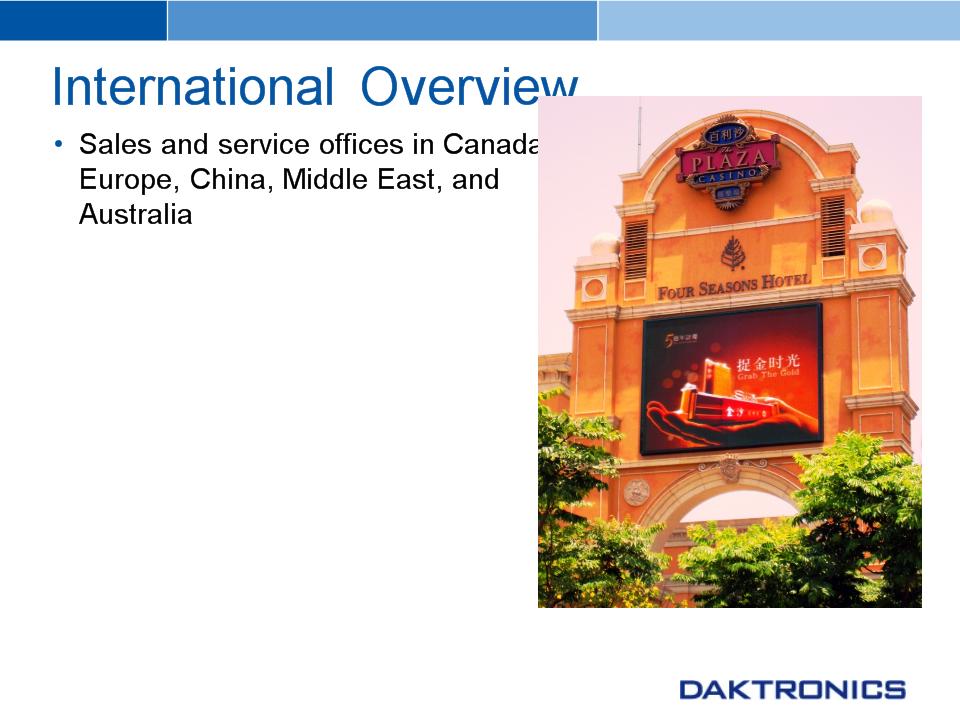
• Limited
manufacturing in China
• 10% of net sales in
FY09
• Large project
driven
• Similar drivers as
rest of business
• Current expectation
is for lower
sales in FY10 due to economic and
competitive factors
sales in FY10 due to economic and
competitive factors
• FY10 net sales down
50% YTD
through Q2
through Q2
• Improving pipeline,
increased
competition and pricing pressure
competition and pricing pressure

Transportation
Business Unit

Transportation
Overview
Three
main areas:
•Intelligent
transportation systems (ITS)
•Aviation, including
airports and airlines
•Mass
Transit
6% of
FY09 net sales
Strong
backlog going into FY2010
FY10
net sales up 27% YTD through Q2

Transportation
Overview
Long-term
Growth Drivers
• Government
spending
• Capacity constraints
on
highways, public transit,
airports and parking systems
highways, public transit,
airports and parking systems
• Limited ability to
build and
expand new roads
expand new roads
• Increased air
travel
• Work-zone
safety
Competitors
• ITS - Skyline,
Ledstar
• Aviation - TransLux,
AMS
• Increasing
competition

LOOKING
AHEAD

Maintaining
Long-Term Profitable Growth
Ongoing
product development - generally 4% of net
sales (higher in FY2010)
sales (higher in FY2010)
• New product for
existing markets
• Enhance existing
products while reducing costs
• Lean development
methods
Increase
market penetration in existing locations
Continued
emphasis on reducing costs and improving
quality through lean initiatives
quality through lean initiatives
• Improve
asset turns (inventory alignment, process
improvement)
improvement)
• Focus
on operating margin and free cash flow
• Leverage
service (process improvement)

Managing Through
Current Downturn
• Cost reduction is
ongoing process, not a one time event
• Overriding objective
to reduce cost without harm to
• Long-term growth
opportunities, and
• Orders
• Goal is to come out
of downturn stronger and leaner
• Focus on payroll
reductions through attrition, performance
and other measures.
and other measures.
• Strategic focus on
quality, service and process
improvements
improvements
• Expect continued
declines in costs
• Continue to generate
free cash flow
• Maintenance level
capital expenditures for FY10

Outlook
Overview - Challenging Factors
• Lighter ($90
million) backlog going into Q3
• Order bookings in Q3
lagging expectations due
to economic factors, impacting Q3 revenue
expectations
to economic factors, impacting Q3 revenue
expectations
• Now apparent that no
large (>$5 million)
baseball projects will go forward for
installation this season
baseball projects will go forward for
installation this season
• National accounts
orders slower than
anticipated
anticipated
• Large commercial
projects slow to close
• Extremely aggressive
pricing from competitors,
especially new competitors trying to enter the
market, is affecting margins
especially new competitors trying to enter the
market, is affecting margins

Outlook
Overview - Positive Factors
• Overall cost
reduction has been effective to date -
achieved 8% operating margin in Q2
achieved 8% operating margin in Q2
• Cost reduction
continues as an ongoing process
• Significant ongoing
improvements throughout the
company on lean initiatives
company on lean initiatives
• Improved
competitiveness in Live Events due to:
• New DVX outdoor
video product platform beginning to
ship Q4 - reduced cost, excellent viewing qualities,
streamlined manufacturing, increased commonality
across the product family.
ship Q4 - reduced cost, excellent viewing qualities,
streamlined manufacturing, increased commonality
across the product family.
• New Show Control
software for video systems beginning
to ship in Q4
to ship in Q4

QUESTIONS