Attached files
| file | filename |
|---|---|
| 8-K - 8-K - VITESSE SEMICONDUCTOR CORP | a10-1373_18k.htm |
| EX-3.1 - EX-3.1 - VITESSE SEMICONDUCTOR CORP | a10-1373_1ex3d1.htm |
| EX-99.1 - EX-99.1 - VITESSE SEMICONDUCTOR CORP | a10-1373_1ex99d1.htm |
Exhibit 99.2
|
|
Special Meeting of Shareholders Chris Gardner, CEO January 7, 2010 |
|
|
Safe Harbor Statement This presentation contains forward-looking statements that involve risks and uncertainties concerning Vitesse’s expected financial performance, as well as our strategic and operational plans. Actual results may differ materially from the results predicted and reported results should not be considered as an indication of future performance. The potential risks and uncertainties include, among others, risks relating to our business, liquidity, financing arrangements, and capital commitments. All information in this presentation is as of January 7, 2010 and Vitesse does not intend, and undertakes no duty, to update this information to reflect future results or circumstances. More information about potential factors that could affect Vitesse’s business and financial results is included under the captions “Risk Factors” and Management’s Discussion and Analysis of Financial Condition and Results of Operations” in Vitesse’s Annual Report on Form 10-K for the fiscal year ended September 30, 2009, which is on file with the U.S. Securities and Exchange Commission and available online at www.sec.gov. |
|
|
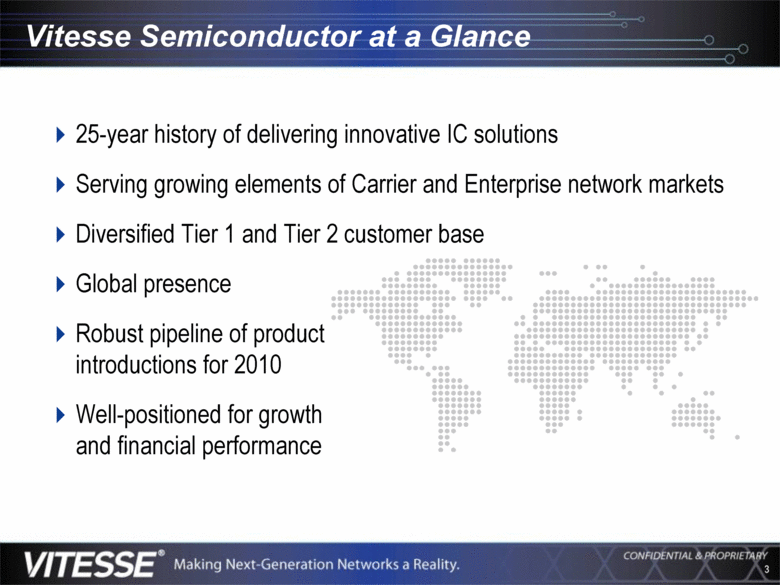
Vitesse Semiconductor at a Glance 25-year history of delivering innovative IC solutions Serving growing elements of Carrier and Enterprise network markets Diversified Tier 1 and Tier 2 customer base Global presence Robust pipeline of product introductions for 2010 Well-positioned for growth and financial performance |
|
|
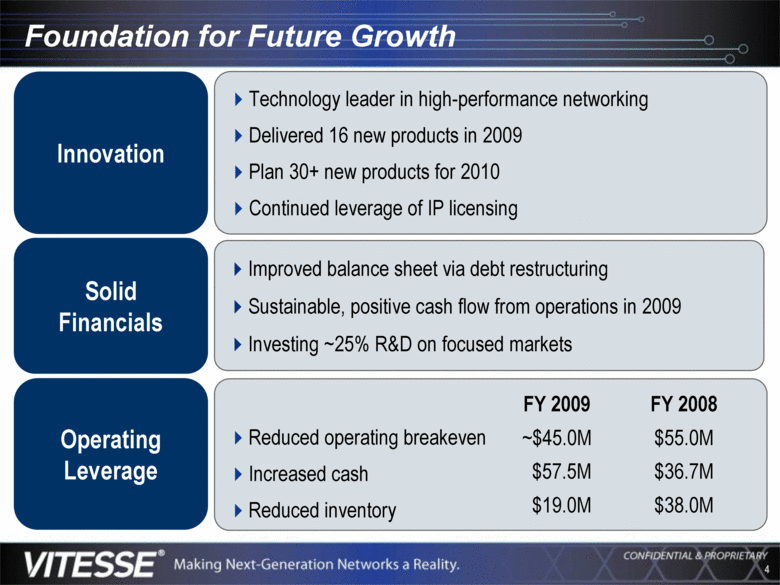
Foundation for Future Growth Solid Financials Improved balance sheet via debt restructuring Sustainable, positive cash flow from operations in 2009 Investing ~25% R&D on focused markets Operating Leverage Reduced operating breakeven Increased cash Reduced inventory Innovation Technology leader in high-performance networking Delivered 16 new products in 2009 Plan 30+ new products for 2010 Continued leverage of IP licensing $38.0M $19.0M $36.7M $57.5M $55.0M ~$45.0M FY 2008 FY 2009 |
|
|
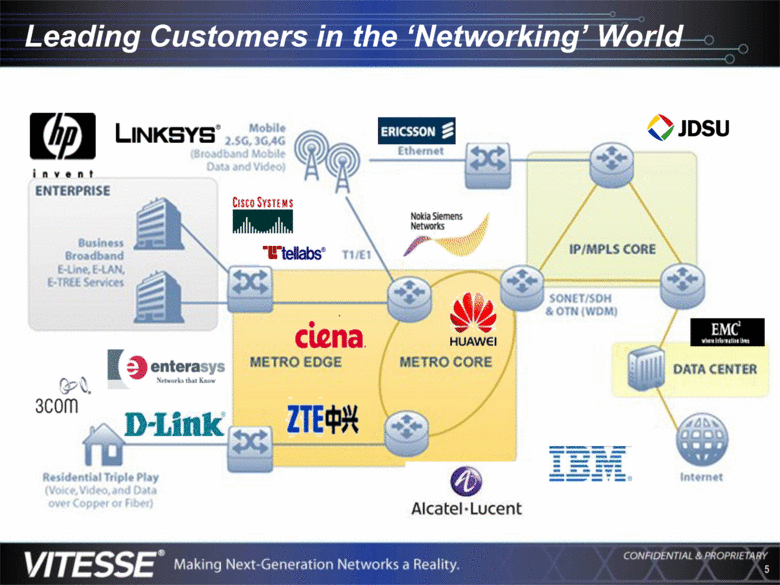
Leading Customers in the ‘Networking’ World |
|
|
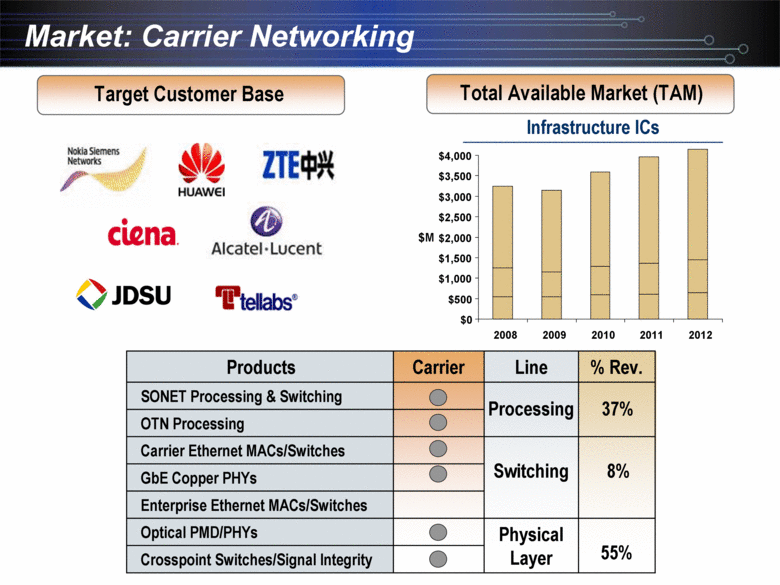
Market: Carrier Networking Physical Layer Switching Processing Line 8% Carrier Ethernet MACs/Switches OTN Processing Carrier 55% 37% % Rev. Products Crosspoint Switches/Signal Integrity Optical PMD/PHYs Enterprise Ethernet MACs/Switches GbE Copper PHYs SONET Processing & Switching Target Customer Base Total Available Market (TAM) Infrastructure ICs $0 $500 $1,000 $1,500 $2,000 $2,500 $3,000 $3,500 $4,000 2008 2009 2010 2011 2012 $M |
|
|
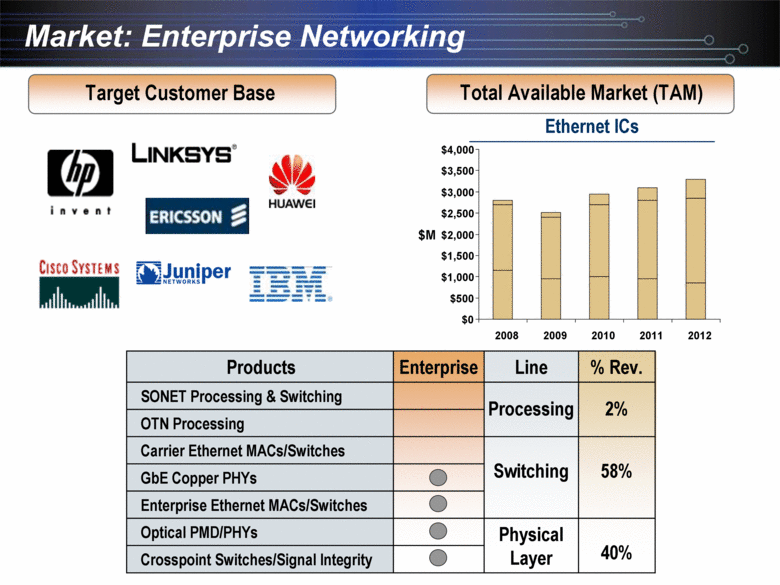
Market: Enterprise Networking Target Customer Base Total Available Market (TAM) Physical Layer Switching Processing Line 58% Carrier Ethernet MACs/Switches OTN Processing Enterprise 40% 2% % Rev. Products Crosspoint Switches/Signal Integrity Optical PMD/PHYs Enterprise Ethernet MACs/Switches GbE Copper PHYs SONET Processing & Switching Ethernet ICs $0 $500 $1,000 $1,500 $2,000 $2,500 $3,000 $3,500 $4,000 2008 2009 2010 2011 2012 $M |
|
|
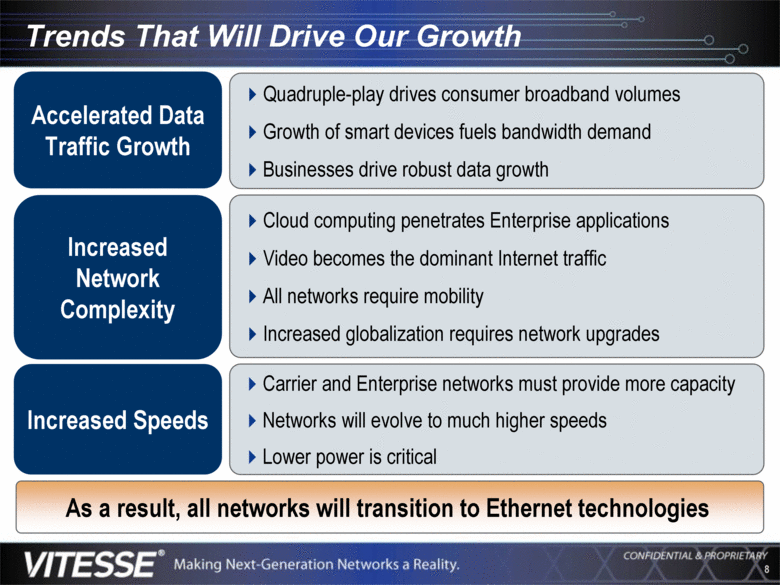
Trends That Will Drive Our Growth Accelerated Data Traffic Growth Quadruple-play drives consumer broadband volumes Growth of smart devices fuels bandwidth demand Businesses drive robust data growth Increased Speeds Carrier and Enterprise networks must provide more capacity Networks will evolve to much higher speeds Lower power is critical Cloud computing penetrates Enterprise applications Video becomes the dominant Internet traffic All networks require mobility Increased globalization requires network upgrades Increased Network Complexity As a result, all networks will transition to Ethernet technologies |
|
|
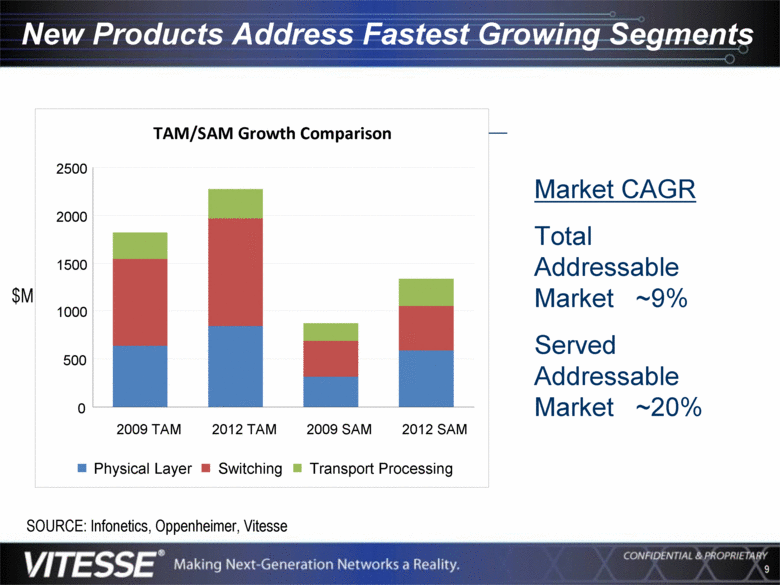
New Products Address Fastest Growing Segments TAM/SAM Growth Comparison Market CAGR Total Addressable Market ~9% Served Addressable Market ~20% $M SOURCE: Infonetics, Oppenheimer, Vitesse 0 500 1000 1500 2000 2500 2009 TAM 2012 TAM 2009 SAM 2012 SAM Physical Layer Switching Transport Processing |
|
|
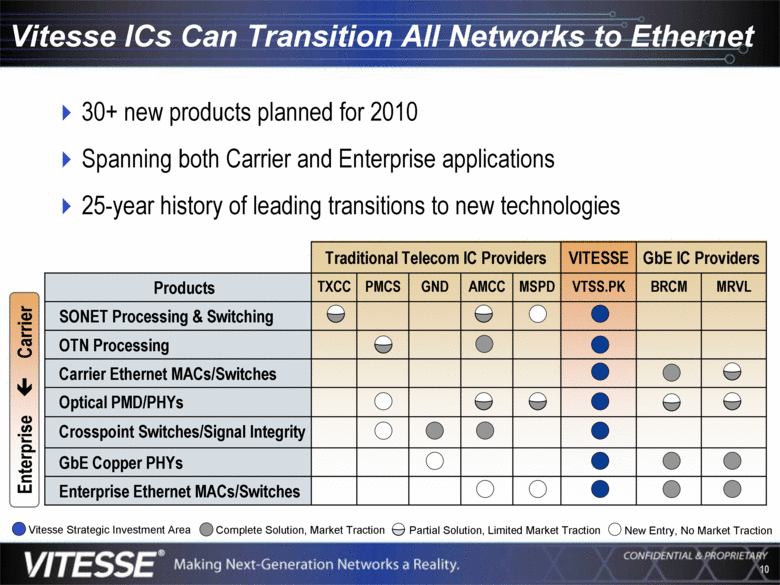
Vitesse ICs Can Transition All Networks to Ethernet 30+ new products planned for 2010 Spanning both Carrier and Enterprise applications 25-year history of leading transitions to new technologies MRVL BRCM VTSS.PK MSPD AMCC GND PMCS TXCC Products GbE IC Providers VITESSE Traditional Telecom IC Providers Enterprise Ethernet MACs/Switches GbE Copper PHYs Crosspoint Switches/Signal Integrity Optical PMD/PHYs Carrier Ethernet MACs/Switches OTN Processing SONET Processing & Switching New Entry, No Market Traction Partial Solution, Limited Market Traction Vitesse Strategic Investment Area Complete Solution, Market Traction Enterprise Carrier |
|
|
Financials |
|
|
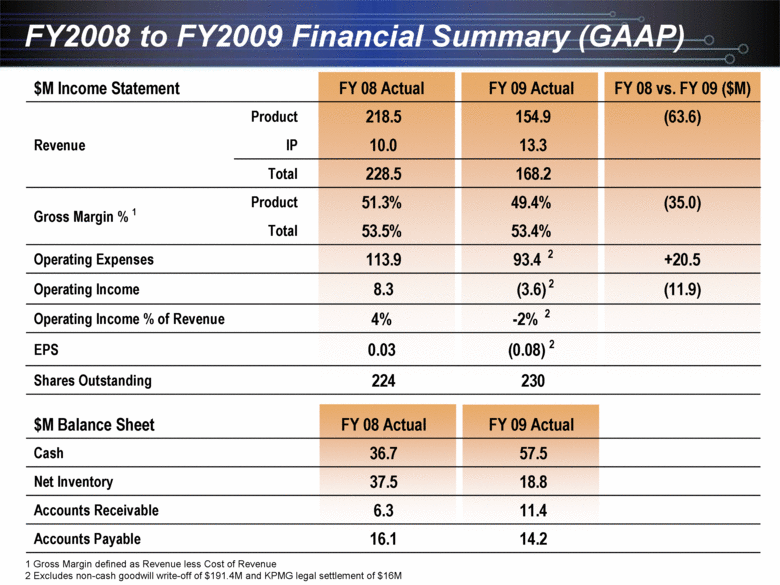
FY2008 to FY2009 Financial Summary (GAAP) 14.2 11.4 18.8 57.5 FY 09 Actual 230 (0.08) 2 -2% 2 (3.6) 2 93.4 2 53.4% 49.4% 168.2 13.3 154.9 FY 09 Actual 16.1 Accounts Payable 6.3 Accounts Receivable 37.5 Net Inventory 36.7 Cash FY 08 Actual $M Balance Sheet 224 Shares Outstanding 0.03 EPS 4% Operating Income % of Revenue (11.9) 8.3 Operating Income +20.5 113.9 Operating Expenses 53.5% Total (35.0) 51.3% Product Gross Margin % 1 228.5 Total 10.0 IP (63.6) 218.5 Product Revenue FY 08 vs. FY 09 ($M) FY 08 Actual $M Income Statement 1 Gross Margin defined as Revenue less Cost of Revenue 2 Excludes non-cash goodwill write-off of $191.4M and KPMG legal settlement of $16M |
|
|
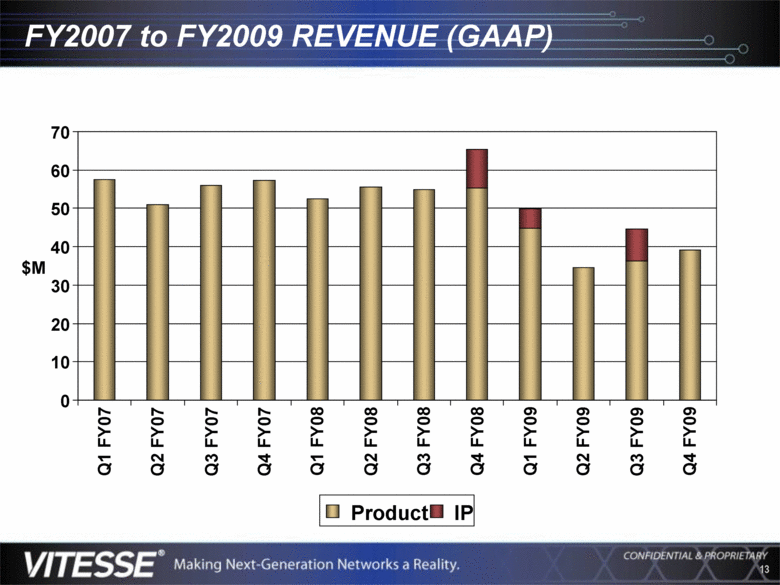
FY2007 to FY2009 REVENUE (GAAP) 0 10 20 30 40 50 60 70 Q1 FY07 Q2 FY07 Q3 FY07 Q4 FY07 Q1 FY08 Q2 FY08 Q3 FY08 Q4 FY08 Q1 FY09 Q2 FY09 Q3 FY09 Q4 FY09 $M Product IP |
|
|
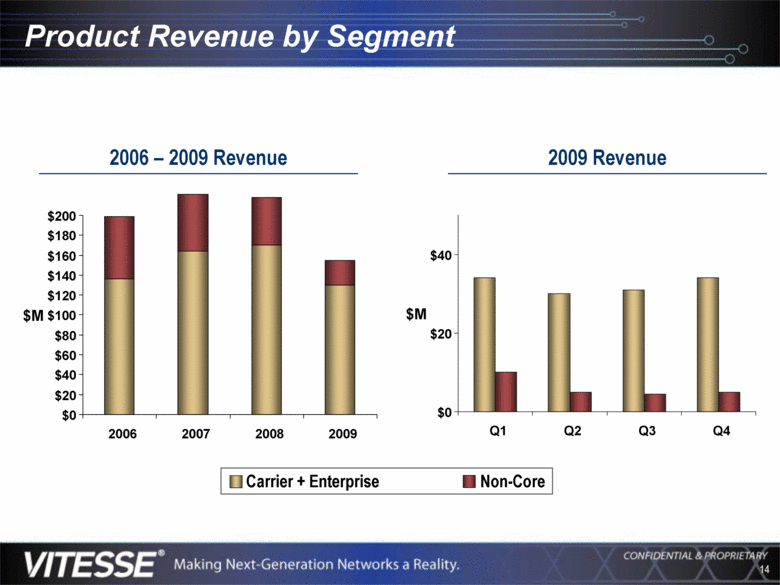
Product Revenue by Segment 2006 – 2009 Revenue 2009 Revenue Carrier + Enterprise Non-Core $0 $20 $40 $60 $80 $100 $120 $140 $160 $180 $200 2006 2007 2008 2009 $M $0 $20 $40 Q1 Q2 Q3 Q4 $M |
|
|
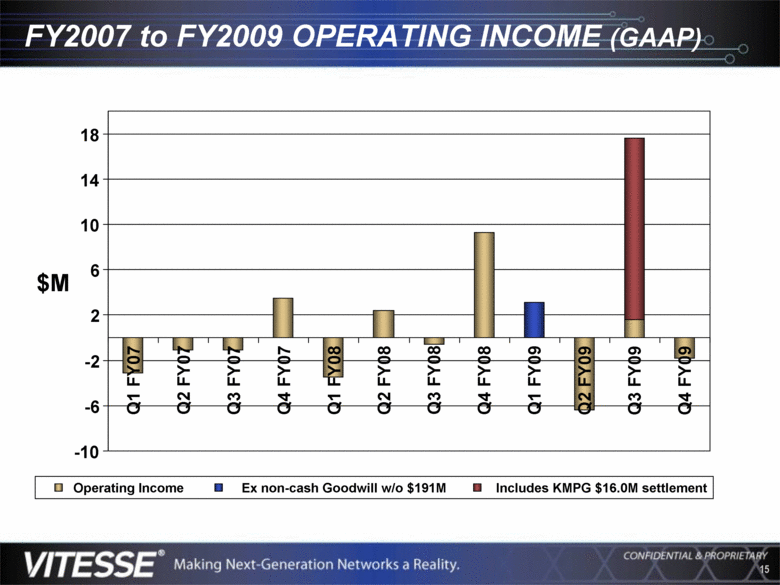
FY2007 to FY2009 OPERATING INCOME (GAAP) -10 -6 -2 2 6 10 14 18 Q1 FY07 Q2 FY07 Q3 FY07 Q4 FY07 Q1 FY08 Q2 FY08 Q3 FY08 Q4 FY08 Q1 FY09 Q2 FY09 Q3 FY09 Q4 FY09 $M Operating Income Ex non-cash Goodwill w/o $191M Includes KMPG $16.0M settlement |
|
|
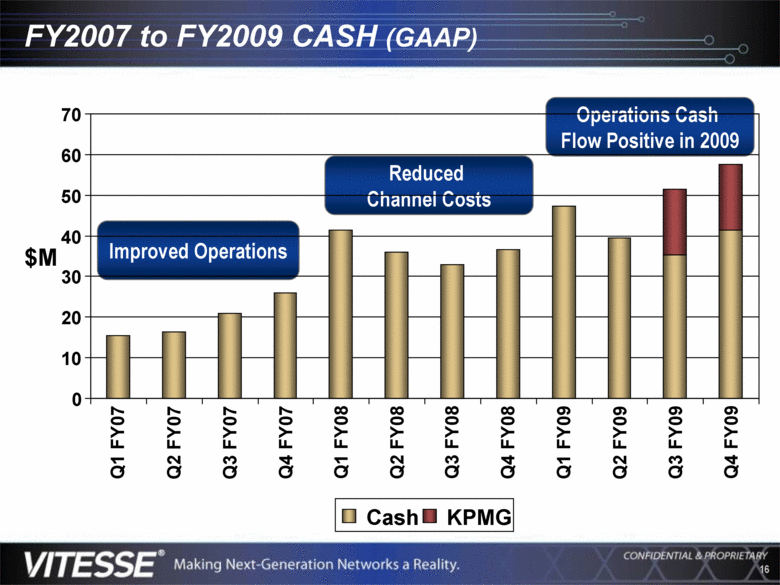
FY2007 to FY2009 CASH (GAAP) Improved Operations Reduced Channel Costs Operations Cash Flow Positive in 2009 0 10 20 30 40 50 60 70 Q1 FY07 Q2 FY07 Q3 FY07 Q4 FY07 Q1 FY08 Q2 FY08 Q3 FY08 Q4 FY08 Q1 FY09 Q2 FY09 Q3 FY09 Q4 FY09 $M Cash KPMG |
|
|
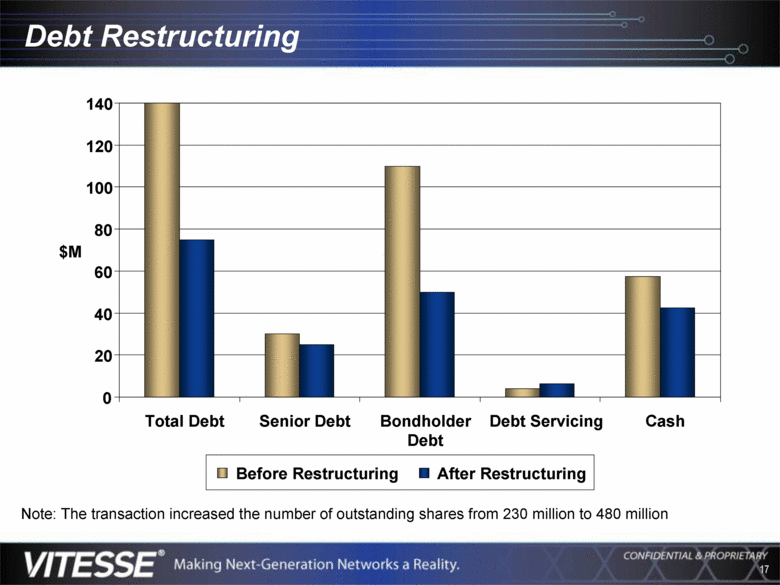
Debt Restructuring Note: The transaction increased the number of outstanding shares from 230 million to 480 million 0 20 40 60 80 100 120 140 Total Debt Senior Debt Bondholder Debt Debt Servicing Cash $M Before Restructuring After Restructuring |
|
|
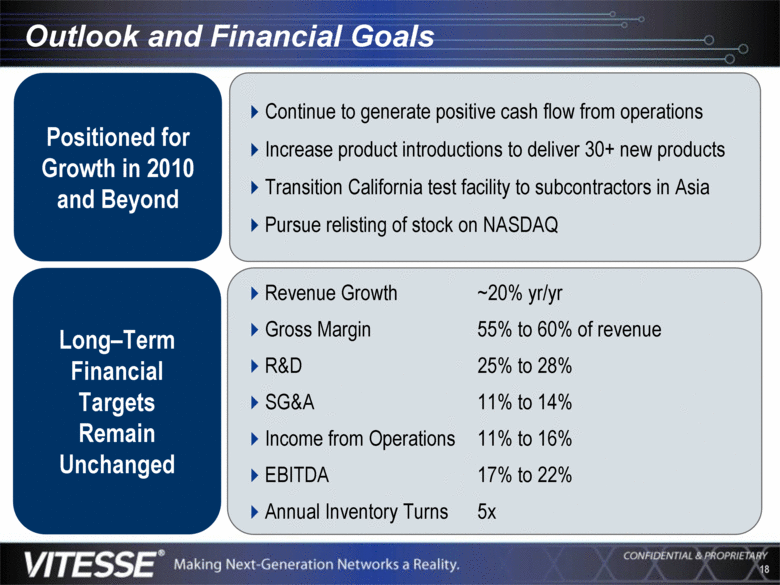
Outlook and Financial Goals Positioned for Growth in 2010 and Beyond Continue to generate positive cash flow from operations Increase product introductions to deliver 30+ new products Transition California test facility to subcontractors in Asia Pursue relisting of stock on NASDAQ Long–Term Financial Targets Remain Unchanged Revenue Growth ~20% yr/yr Gross Margin 55% to 60% of revenue R&D 25% to 28% SG&A 11% to 14% Income from Operations 11% to 16% EBITDA 17% to 22% Annual Inventory Turns 5x |
|
|
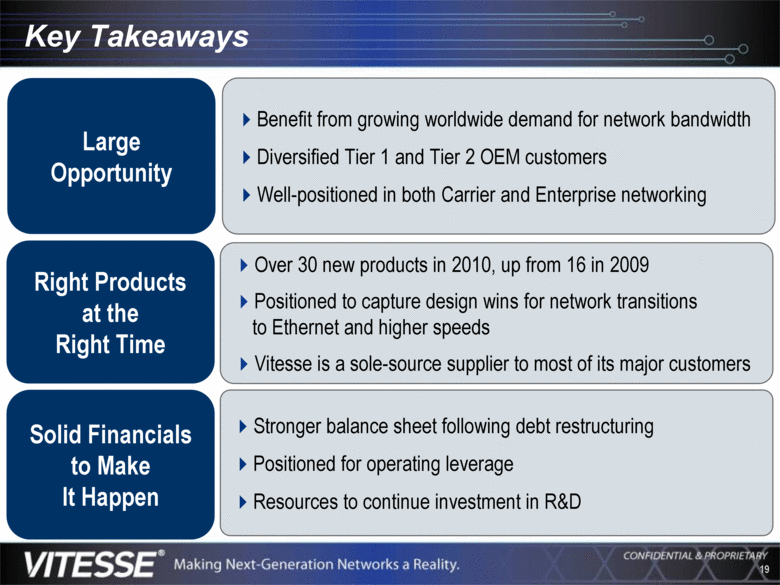
Key Takeaways Large Opportunity Benefit from growing worldwide demand for network bandwidth Diversified Tier 1 and Tier 2 OEM customers Well-positioned in both Carrier and Enterprise networking Right Products at the Right Time Over 30 new products in 2010, up from 16 in 2009 Positioned to capture design wins for network transitions to Ethernet and higher speeds Vitesse is a sole-source supplier to most of its major customers Stronger balance sheet following debt restructuring Positioned for operating leverage Resources to continue investment in R&D Solid Financials to Make It Happen |
|
|
Thank You |

