Attached files
| file | filename |
|---|---|
| 8-K - STERLING FINANCIAL CORP. 8-K - STERLING FINANCIAL CORP /WA/ | a6135561.htm |
Exhibit 99.1
STERLING Financial Corporation Ticker: STSA Spokane, Washington Overview January 2010
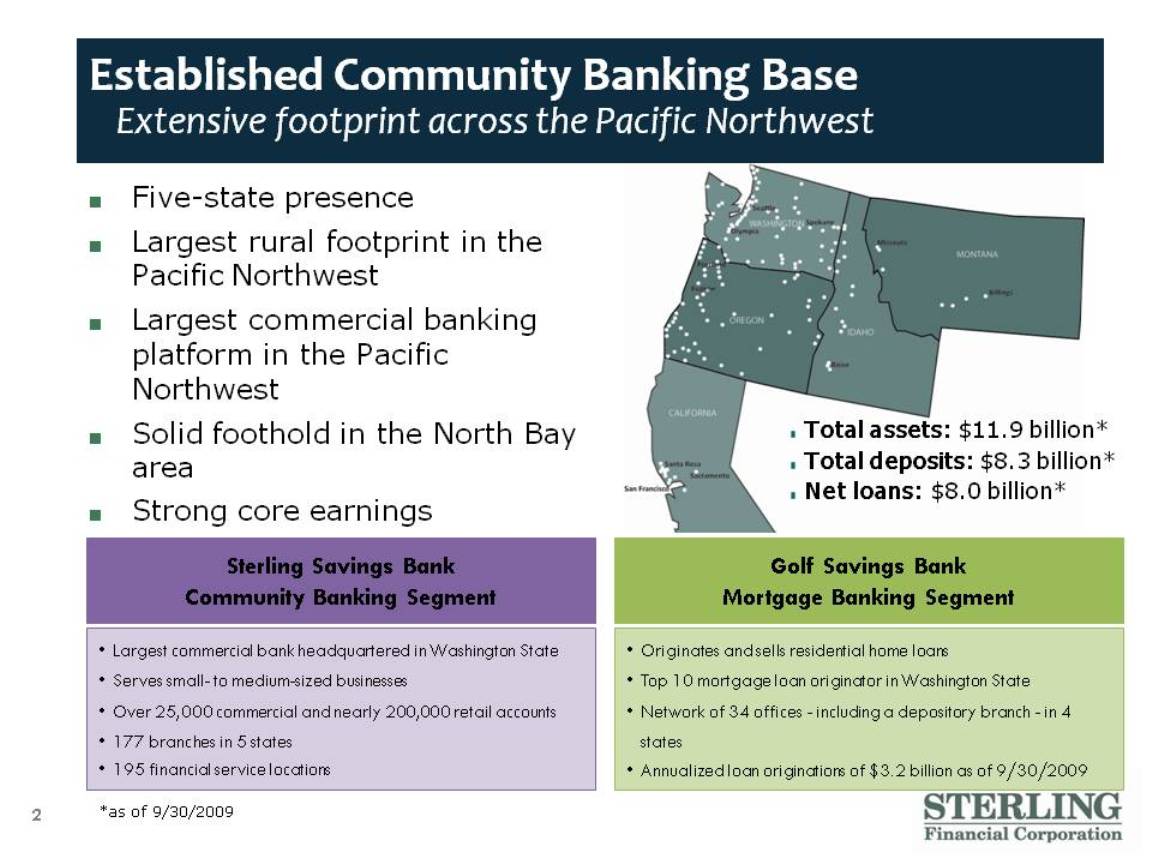
2 Established Community Banking Base Extensive footprint across the Pacific Northwest Total assets: $11.9 billion* Total deposits: $8.3 billion* Net loans: $8.0 billion* Sterling Savings Bank Community Banking Segment Golf Savings Bank Mortgage Banking Segment Largest commercial bank headquartered in Washington State Serves small- to medium-sized businessesOver 25,000 commercial and nearly 200,000 retail accounts 177 branches in 5 states 195 financial service locations Originates and sells residential home loans Top 10 mortgage loan originator in Washington StateNetwork of 34 offices - including a depository branch - in 4 states Annualized loan originations of $3.2 billion as of 9/30/2009 Five-state presenceLargest rural footprint in the Pacific Northwest Largest commercial banking platform in the Pacific NorthwestSolid foothold in the North Bay areaStrong core earnings *as of 9/30/2009
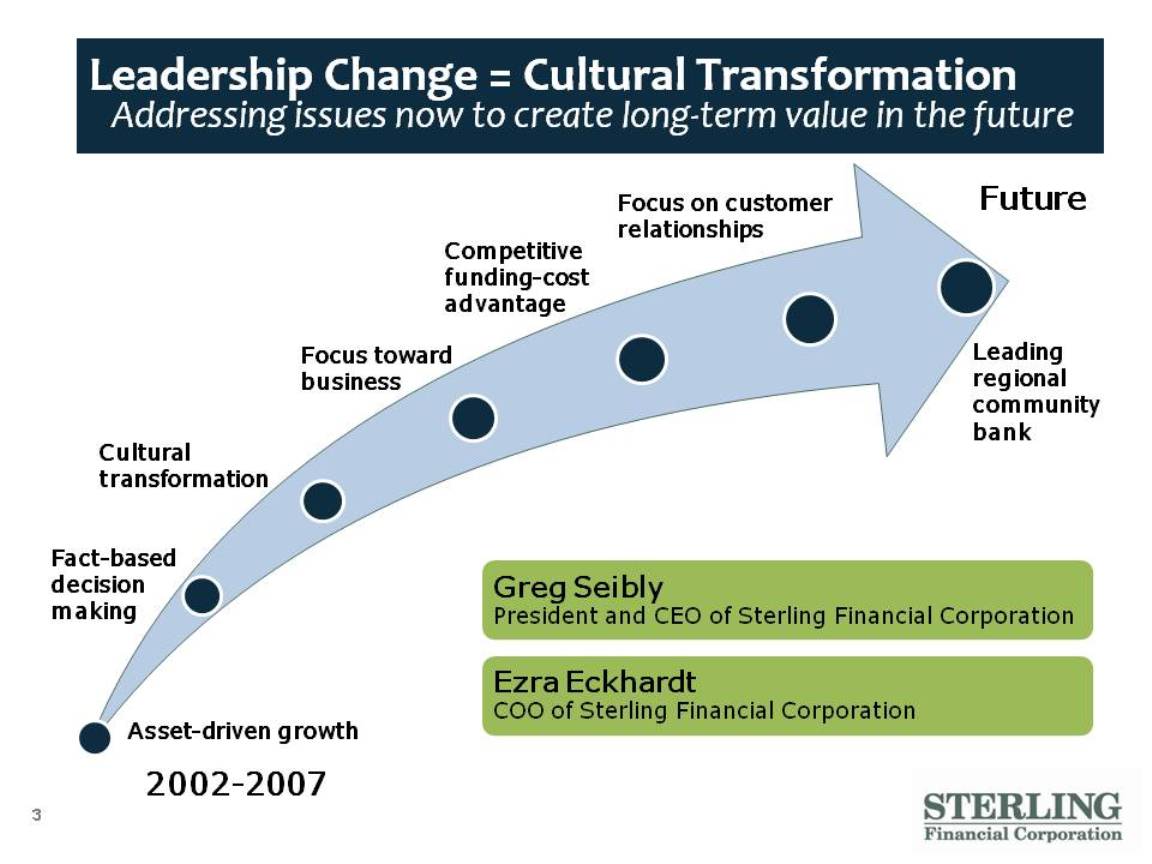
3 Leadership Change = Cultural Transformation Addressing issues now to create long-term value in the future Asset-driven growth Fact-based decision making Cultural transformation Focus toward business Competitive funding-cost advantage Focus on customer relationships Leading regional community bank 2002-2007 Future Greg Seibly President and CEO of Sterling Financial Corporation Ezra Eckhardt COO of Sterling Financial Corporation
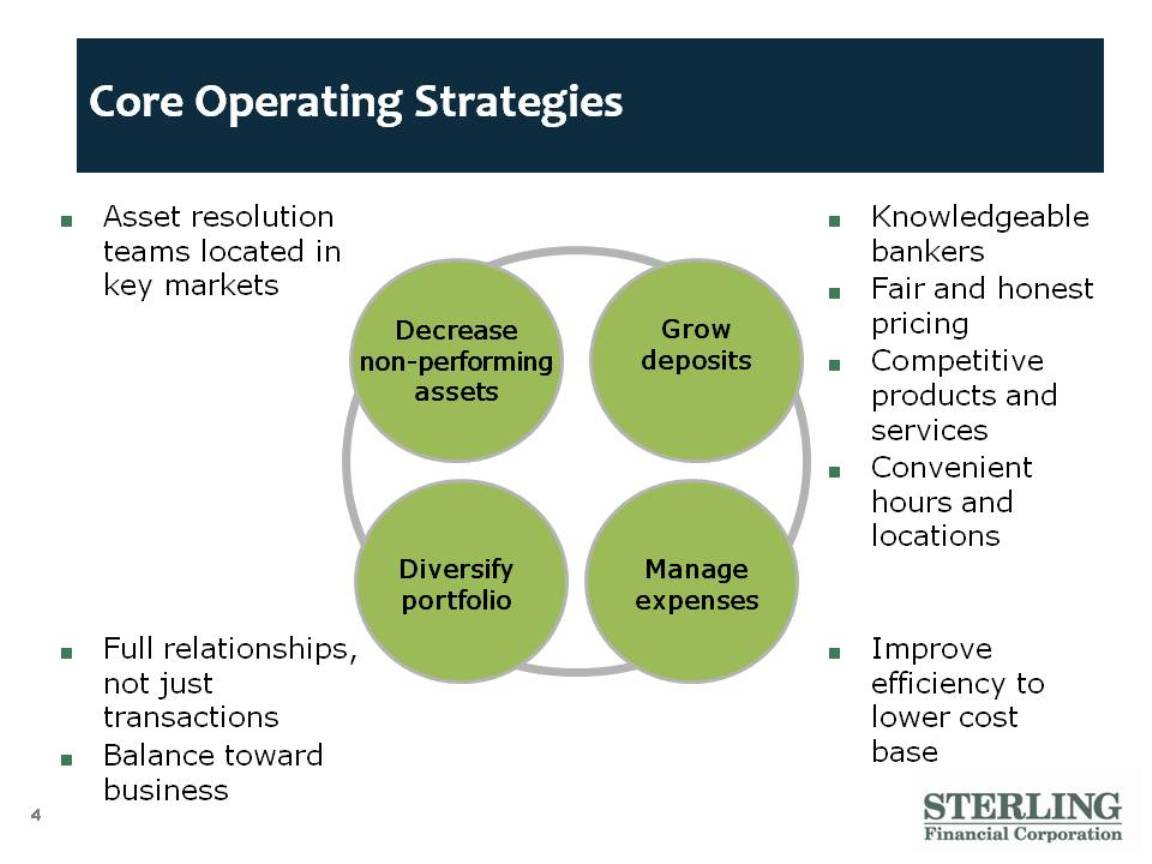
4 Core Operating Strategies Asset resolution teams located in key markets Full relationships, not just transactionsBalance toward business Improve efficiency to lower cost base Knowledgeable bankers Fair and honest pricing Competitive products and services Convenient hours and locations Decrease non-performing assets Grow deposits Diversify portfolio Manage expenses
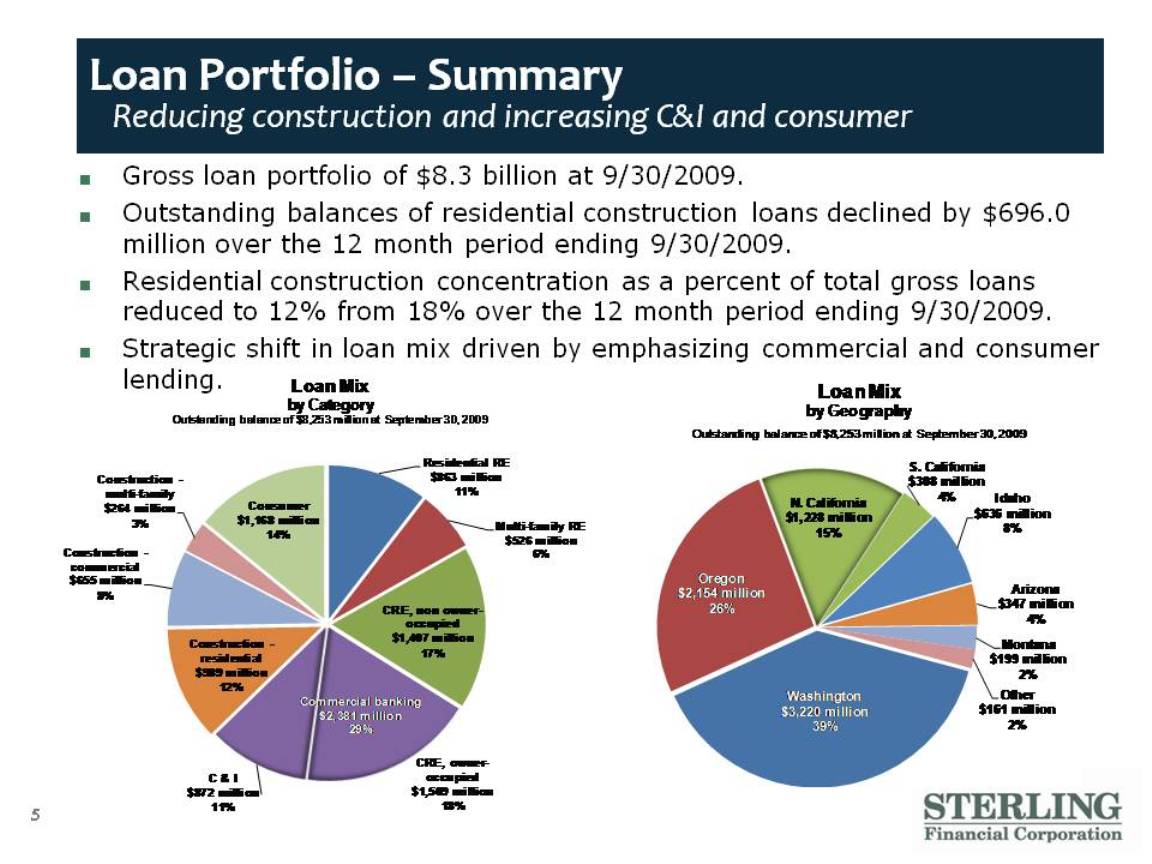
5 Loan Portfolio – Summary Reducing construction and increasing C&I and consumer Gross loan portfolio of $8.3 billion at 9/30/2009. Outstanding balances of residential construction loans declined by $696.0 million over the 12 month period ending 9/30/2009. Residential construction concentration as a percent of total gross loans reduced to 12% from 18% over the 12 month period ending 9/30/2009. Strategic shift in loan mix driven by emphasizing commercial and consumer lending. Loan Mix by Category Outstanding balance of $8,253 million at September 30, 2009 Construction – residential $989 million 12% Construction – commercial $655 million 8% Construction – multi-family $264 million 3% Consumer $1,168 million 14% Residential RE $863 million 11% Multi-family RE $526 million 6% CRE, non owner-occupied $1,407 million 17% CRE, owner-occupied $1,509 million 18% C & I $872 million 11% Commercial banking $2,381 million 29% Loan Mix by Geography Outstanding balance of $8,253 million at September 30, 2009 Washington $3,220 million 39% Oregon $2,154 million 26% N. California $1,228 million 15% S. California $308 million 4% Idaho $636 million 8% Arizona $347 million 4% Montana $199 million 2% Other $161 million 2%
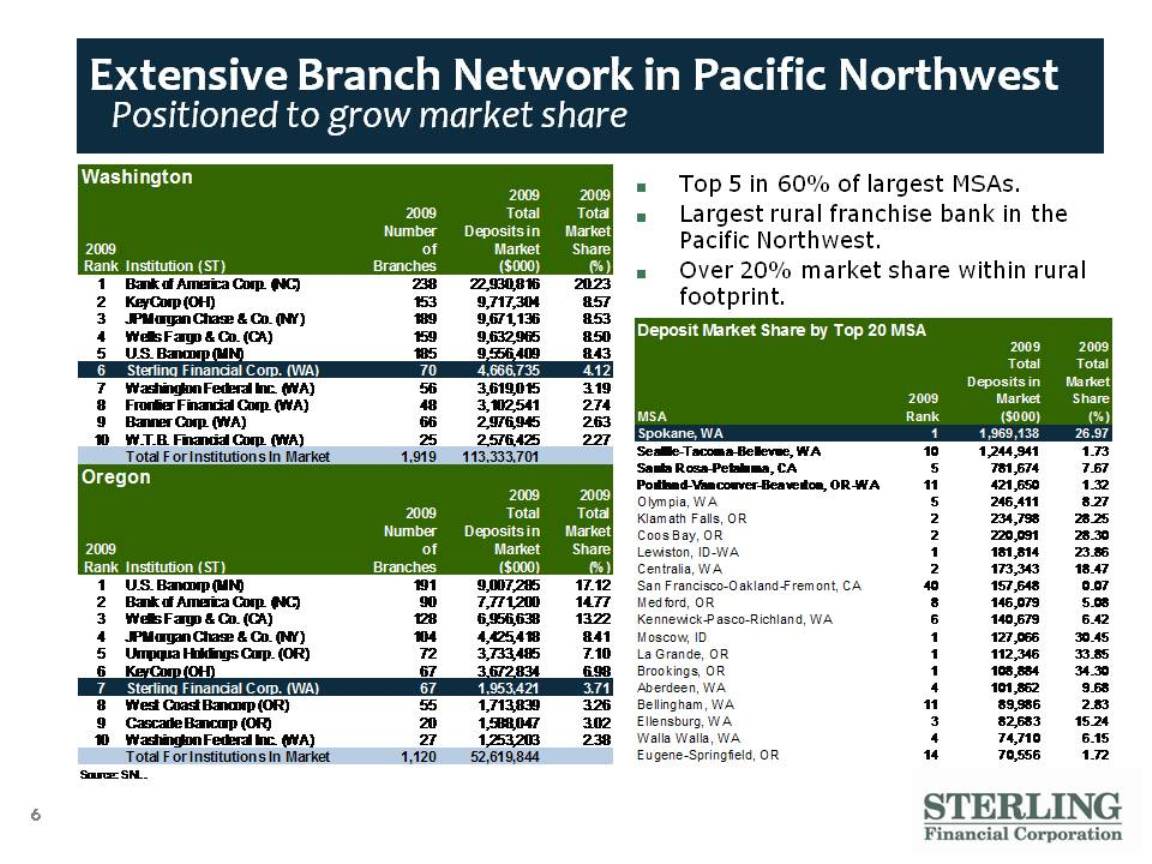
6 Extensive Branch Network in Pacific Northwest Positioned to grow market share Top 5 in 60% of largest MSAs. Largest rural franchise bank in the Pacific Northwest. Over 20% market share within rural footprint. Washington 2009 Rank Institution (ST) 2009 Number of Branches 2009 Total Deposits in Market ($000) 2009 Total Market Share (%) 1 Bank of America Corp. (NC) 238 22,930,816 20.23 2 KeyCorp (OH) 153 9,717,304 8.57 3 JPMorgan Chase & Co. (NY) 189 9,671,136 8.53 4 Wells Fargo & Co. (CA) 159 9,632,965 8.50 5 U.S. Bancorp (MN) 185 9,556,409 8.43 6 Sterling Financial Corp. (WA) 70 4,666,735 4.12 7 Washington Federal Inc. (WA) 56 3,619,015 3.19 8 Frontier Financial Corp. (WA) 48 3,102,541 2.74 9 Banner Corp. (WA) 66 2,976,945 2.63 10 W.T.B. Financial Corp. (WA) 25 2,576,425 2.27 Total For Institutions In Market 1,919 113,333,701 Oregon 2009 Rank Institution (ST) 2009 Number of Branches 2009 Total Deposits in Market ($000) 2009 Total Market Share (%) 1 U.S. Bancorp (MN) 191 9,007,285 17.12 2 Bank of America Corp. (NC) 90 7,771,200 14.77 3 Wells Fargo & Co. (CA) 128 6,956,638 13.22 4 JPMorgan Chase & Co. (NY) 104 4,425,418 8.41 5 Umpqua Holdings Corp. (OR) 72 3,733,485 7.10 6 KeyCorp (OH) 67 3,672,834 6.98 7 Sterling Financial Corp. (WA) 67 1,953,421 3.71 8 West Coast Bancorp (OR) 55 1,713,839 3.26 9 Cascade Bancorp (OR) 20 1,588,047 3.02 10 Washington Federal Inc. (WA) 27 1,253,203 2.38 Total For Institutions In Market 1,120 52,619,844 Deposit Market Share by Top 20 MSA MSA 2009 Rank 2009 Total Deposits in Market ($000) 2009 Total Market Share (%) Spokane, WA 1 1,969,138 26.97 Seattle-Tacoma-Bellevue, WA 10 1,244,941 1.73 Santa Rosa-Petaluma, CA 5 781,674 7.67 Portland-Vancouver-Beaverton, OR-WA 11 421,650 1.32 Olympia, WA 5 246,411 8.27 Klamath Falls, OR 2 234,798 28.25 Coos Bay, OR 2 220,091 28.30 Lewiston, ID-WA 1 181,814 23.86 Centralia, WA 2 173,343 18.47 San Francisco-Oakland-Fremont, CA 40 157,648 0.07 Medford, OR 8 146,079 5.08 Kennewick-Pasco-Richland, WA 6 140,679 6.42 Moscow, ID 1 127,066 30.45 La Grande, OR 1 112,346 33.85 Brookings, OR 1 108,884 34.30 Aberdeen, WA 4 101,862 9.68 Bellingham, WA 11 89,986 2.83 Ellensburg, WA 3 82,683 15.24 Walla Walla, WA 4 74,710 6.15 Eugene-Springfield, OR 14 70,556 1.72
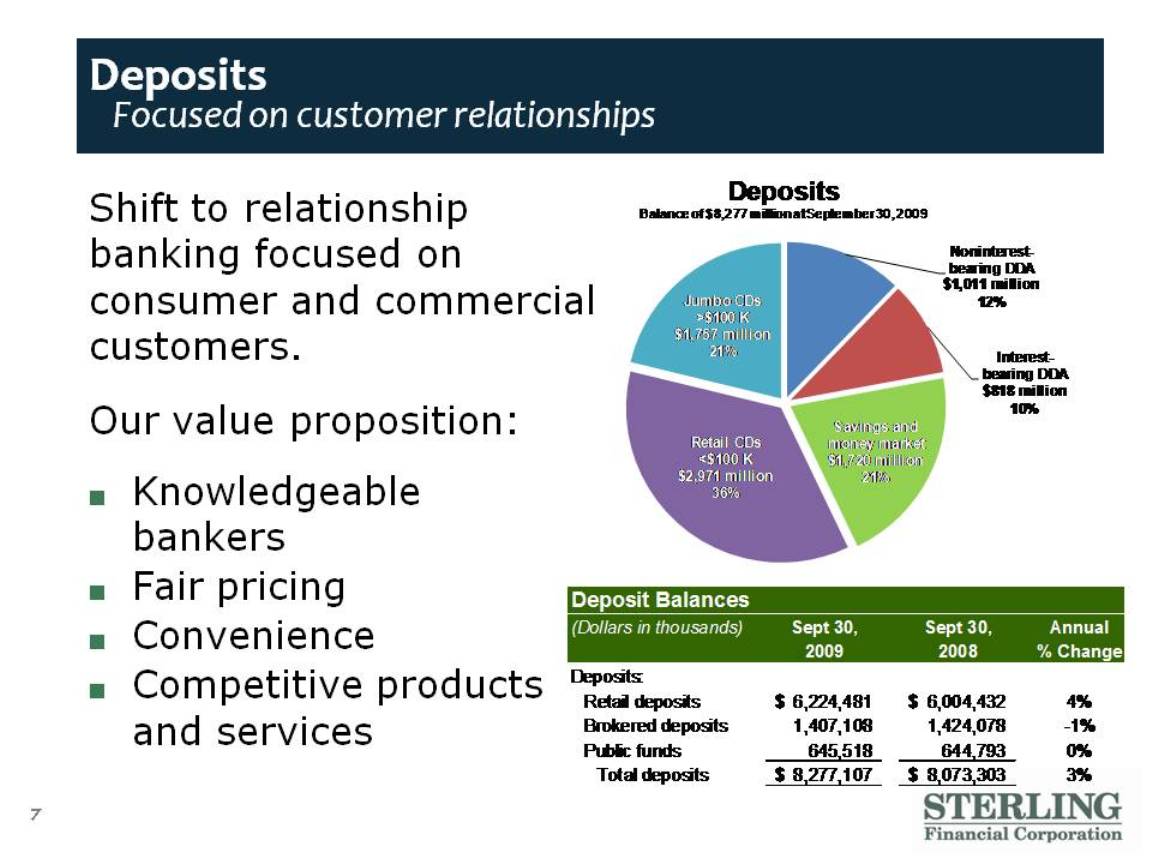
7 Deposits Focused on customer relationships Knowledgeable bankers Fair pricing Convenience Competitive products and services Shift to relationship banking focused on consumer and commercial customers.Our value proposition: Desposits Balance of $8,277 million at September 30, 2009 Retail CDs <$100 K $2,971 million 36% Jumbo CDs >$100 K $1,757 million 21% Savings and money market $1,720 million 21% Noninterest-bearing DDA $1,011 million 12% Interest-bearing DDA $818 million 10% Deposit Balances (Dollars in thousands) Sept. 30, 2009 Sept. 30, 2008 Annual % Change Deposits: Retail deposits Brokered deposits Public funds Total deposits $6,224,481 $6,004,432 4% 1,407,108 1,424,078 -1% 645,518 644,793 0% $8,277,107 $8,073,303 3%
8 Sterling Summary Franchise value Largest commercial bank headquartered in the Pacific Northwest Quality franchiseKnowledgeable, engaged employeesCommitted to and active in the communities we serveRecovery plan under way