Attached files
| file | filename |
|---|---|
| 8-K - BEST ENERGY SERVICES 8-K 1-6-2010 - BEST ENERGY SERVICES, INC. | form8k.htm |

BEST
Practices:
Back-to-Basics
Back-to-Basics
Corporate
Presentation:
January 2010
January 2010

Certain statements
contained in this presentation, which are not based on historical facts, are
forward-
looking statements as the term is defined in the Private Securities Litigation Reform Act of 1995 and, as
such, are subject to substantial uncertainties and risks that may cause actual results to materially differ
from projections. Although the Company believes that the expectations expressed herein are based on
reasonable assumptions within the bounds of the Company’s knowledge of its businesses, operations,
business plans, budgets and internal financial projections, there can be no assurance that actual results
will not differ materially from the expectations expressed herein. Important factors currently known to
management that could cause actual results to differ materially from those in forward-looking statements
include the Company's ability to (i) properly execute its business model, (ii) raise additional capital to
sustain its business model, (iii) attract and retain personnel, including highly qualified executives,
management and operational personnel, (iv) negotiate favorable current debt and future capital raises,
(v) manage the inherent risks associated with operating a diversified business to achieve and maintain
positive cash flow and net profitability, and (vi) get back into compliance, and remain in compliance, with
its current senior secured credit facility with PNC Bank, N.A. as well as the other risks detailed from time
to time in the SEC reports of Best Energy Services, Inc., including its annual report on Form 10-K/A for the
transition period from February 1, 2008 to December 31, 2008 and its quarterly reports on Form 10-Q for
the three months ended March 31, 2009, June 30, 2009 and September 30, 2009. In light of these risks
and uncertainties, there can be no assurance that the forward-looking information contained in this
presentation will, in fact, occur. The forward-looking statements made herein speak only as of the date
hereof and Best Energy disclaims any obligation to update these forward-looking statements.

OUR
REASON TO EXIST
Best believes
every company must earn a right to exist. Over the past
year, and in the face of the most severe contraction in two decades,
Best has:
year, and in the face of the most severe contraction in two decades,
Best has:
Ø Successfully
refocused on its core growth market in workover
services
services
— Grown Hugoton
Basin market share from 35% to
80%+
— Secured coveted
customers and new contracts
Ø Further reduced
annual corporate G&A from $5.4MM to
$960K
Ø Discontinued
3
of
4 business lines
with assets to be sold and
deleverage balance sheet
deleverage balance sheet
Ø Maintained a
strong working relationship with PNC Credit- our
senior lender
senior lender
Ø Developed
“outside the box” revenue generation initiatives for
implementation in the first half of 2010.
implementation in the first half of 2010.

OUR
REASON TO EXIST
In
short, Best has now earned its right to exist by developing a
highly functional, high margin model with organic growth
capability all developed around a highly capable team of its
people. Best’s performance in the execution of this model is
solely pointed to delivering fundamental performance for its
shareholders and lenders and enhancing their returns on
invested capital.
Ø Established in
February 2008
Ø
Acquisitions
• Best Well
Services
•Bob Beeman
Drilling
•Certain Housing
Accommodation assets
ØFailure of
prior management to execute
Ø Management
swap in 10/08
•Correctly
anticipated significant commodity price
and activity decline
and activity decline
•Immediately
discontinued failed rig redeployment
model
model
•Immediately cut
annual G&A to $1.8MM
from
$ 5.4MM (now $960K)
$ 5.4MM (now $960K)
•Immediately
implemented deep digging profit
models for all business units to gauge
fundamental viability
models for all business units to gauge
fundamental viability
•Subsequently
discontinued 3 of
4 business
units
Leadership:
Accomplished & Respected
Mark
Harrington, Chairman and CEO
•Aided in
formation of Best Energy Services
•Founding board
member; Appointed CEO December 2008
•30-years
experience -Oil and Gas; Financial Services; Business Development
•Chairman,
President, CEO and COO -Eight Energy and Private Equity Cos.
•Featured on
CNBC, Canada AM, Dow Jones News & Bloomberg
Eugene
Allen, General Manager, Best Well Services, Inc.
• A second
generation oilman with 4o-years hand-on experience in the
oil and gas industry.
oil and gas industry.
• Oversees
day-to-day operations, managing and coordinating all rigs,
equipment and personnel.
equipment and personnel.
Tony
Bruce, Director, President and COO
• Founder of
Best Well Services, largest subsidiary of Best Energy Services
•Founding board
member; Appointed President and COO February 2009
•30- year
veteran of U.S. oil and gas industry.
•Original family
drilling business founded in 1940’s

Strategic
Strengths of Our Core Workover Services Business
Ø
Longevity- BWS
established in 1991
Ø
Sustainability- Grew steadily
from 1 rig to 25 rigs
Ø
Reputation- A coveted
book of business
Ø
Customer Centric- A history of
value and service to our customers
Ø
Management- Significant
depth of management and continuity of
key employees
key employees

Why
Our Customers Choose Best
ØExceptional
Safety Record- Over one year
with not an hour lost due to a
safety incident
safety incident
ØAlways
Fair and Competitively Priced
•Market Peak: BWS
$240/hour Competitors
$360/hour
•Today’s
Pricing: BWS
$220/hour Competitors
$240/hour
ØContinuity
in our Crews- Historical
turnover<5%, industry norm >40%
ØSuperior
Depth of Knowledge and Experience- Faster execution
times for
our customers
our customers
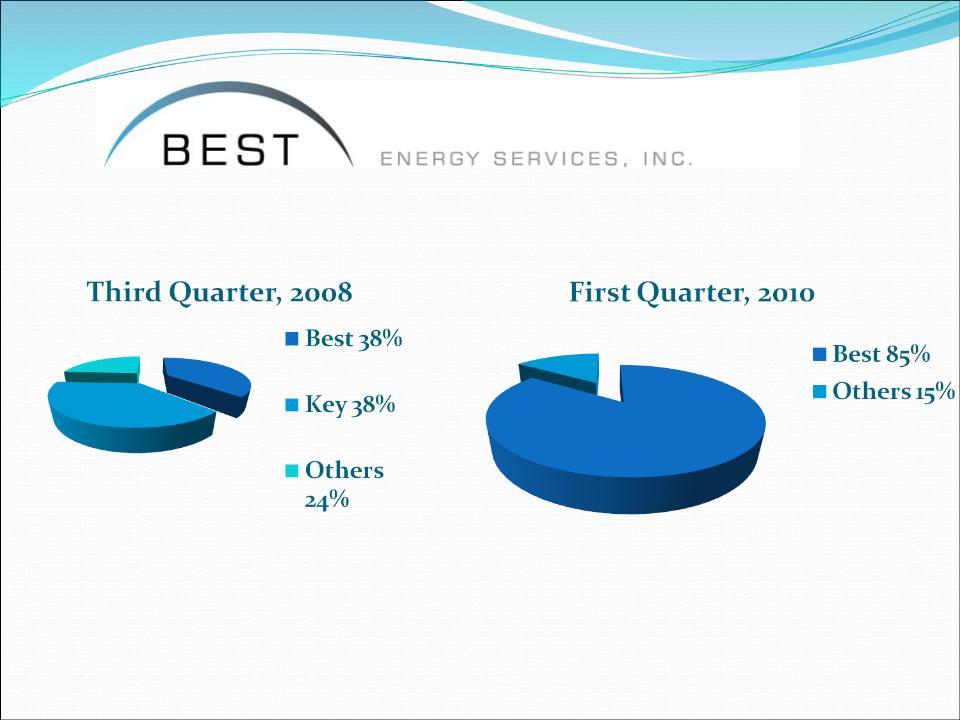

Best’s
Customers Represent
a Substantial Portion of Active Operators:
Ø
80%+
Market Share in Hugoton Basin
Ø
Customers
Include:
-Cleary
Petroleum -Anadarko
Petroleum
-Arena
Resources -Bengalia
Land and Cattle
-Ellora
Energy -EnerVest
Operating
-EOG -Kaiser-Francis
Oil
-Marlin
Oil -Merit
Energy
-Midwestern
Exploration -Noble
Energy
-OXY USA -Pioneer
Exploration
-Samson -XTO
-Dominion -Devon
-Pride
Energy -Linn
Energy

Our
First Focus: Scale
the Revenue Model
Ø STEP
ONE:
Capture Market Share
•Accomplished
•Now at 80%+ vs35%
in 2008
Ø STEP
TWO:
Capture New
Contracts
•Accomplished
•Awarded new
coveted 6 rig contract from major oil company
•Credited to safety
record and historical performance for customer
Ø STEP
THREE: Design and
Implement “outside the box” revenue
creation
model
model
•Hugoton Basin
Financing Partners
•Market Potential--
$20MM+
•Marries
proprietary financial product to asset base
•Highly
scalable

Our
Second Focus: Deleverage the Balance Sheet
Ø Sale
of Equipment from Discontinued Operations—Target
$4MM
Ø
Execute
on Best Energy Ventures
•Leverages use
of BWS equipment/expertise to secure niche
positions in promising E&P plays
positions in promising E&P plays
•No cash
exposure to Best
•Validate and
Flip Model

Financial
Performance: Key Considerations
Ø Operating and
Overhead Expense Containment Completed
ØKey Financial
Driver is Revenue Line
ØKey Drivers to
Revenue Generation are:
•Maintaining
Integrity of the Business Unit
o 19 Years in
business
o Continuity of key
management
o Exceptional
safety record
•Market Conditions
in Hugoton
o Natural Gas
Prices at Wellhead
o Capital
Allocations by customers
o Potential impact
from HBFP Product

Key
Drivers to Natural Gas Market
ØA contracting
supply side
•Decreased
supply lags a decreasing rig count
•Underperforming
shale economics
•Significant
deferred maintenance in bread and butter basins, e.g.
Hugoton
Hugoton
•LNG moving to
more price advantaged European markets
ØAn increasing
demand side
•Precipitous
drop in industrial demand now reversing
•Natural gas
favored to oil on BTU equivalency by wide margin, thus fuel
switching likely
switching likely
•Unexpected
weather events

Key
Thresholds in Best Rig Count
•10
Rigs-
Positive EBITDA
•15
Rigs-
1:1 coverage on debt service
•20
Rigs-Annual EBITDA
$3.2MM +
•25Rigs-Annual EBITDA
$5.0MM+
•35
Rigs-
Annual EBITDA $8.5MM+
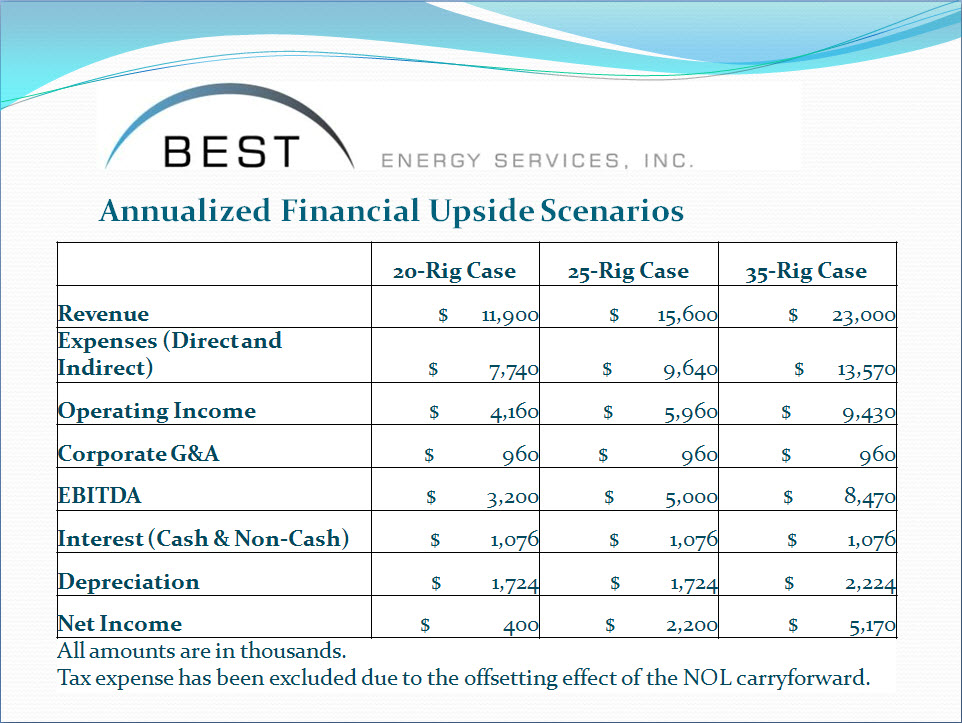
20-Rig
Case 25-Rig Case 35-Rig Case Annualized Financial Upside Scenarios Revenue
Expenses (Direct and Indirect) Operating Income Corporate G&A EBITDA
Interest (Cash & Non-Cash) Depreciation Net Income 11,900 15,600 23,000
7,740 9,640 13,570 4,160 5,960 9,430 960 3,200 5,000 8,470 1,076 1,724 2,224 400
2,200 5,170 All amounts are in thousands. Tax expense has been
excluded due to the offsetting effect of the NOL
carryforward.
Corporate
Headquarters
5433 Westheimer
Avenue, Suite 825
Houston, Texas
77056
Phone:
713-933-2600