Attached files
| file | filename |
|---|---|
| 8-K - FORM 8-K - PIONEER NATURAL RESOURCES CO | d70613e8vk.htm |
Exhibit 99.1

| Pritchard Capital Partners Energize 2010 Conference January 7, 2010 |
| 2 Forward-Looking Statements Except for historical information contained herein, the statements, charts and graphs in this presentation are forward-looking statements that are made pursuant to the Safe Harbor Provisions of the Private Securities Litigation Reform Act of 1995. Forward- looking statements and the business prospects of Pioneer are subject to a number of risks and uncertainties that may cause Pioneer's actual results in future periods to differ materially from the forward-looking statements. These risks and uncertainties include, among other things, volatility of commodity prices, product supply and demand, competition, the ability to obtain environmental and other permits and the timing thereof, other government regulation or action, the ability to obtain approvals from third parties and negotiate agreements with third parties on mutually acceptable terms, international operations and associated international political and economic instability, litigation, the costs and results of drilling and operations, access to and availability of drilling equipment and transportation, processing and refining facilities, Pioneer's ability to replace reserves, implement its business plans or complete its development activities as scheduled, access to and cost of capital, the financial strength of counterparties to Pioneer's credit facility and derivative contracts and the purchasers of Pioneer's oil, NGL and gas production, uncertainties about estimates of reserves and resource potential and the ability to add proved reserves in the future, the assumptions underlying production forecasts, quality of technical data, environmental and weather risks, and acts of war or terrorism. These and other risks are described in Pioneer's 10-K and 10-Q Reports and other filings with the Securities and Exchange Commission. In addition, Pioneer may be subject to currently unforeseen risks that may have a materially adverse impact on it. Pioneer undertakes no duty to publicly update these statements except as required by law. Please see the Appendix slides included in this presentation for other important information. |
| 3 Large drilling inventory and resource potential with >75% liquids Accelerating oil-focused drilling activity in the Spraberry field Added 2nd rig to exploit substantial Eagle Ford Shale resource potential Attractive derivative positions for 2010 and 2011 Will continue to deliver free cash flow Strong and improving financial flexibility Strong margins Large-scale, low-decline assets deliver stable cash flow Why Invest in PXD? |
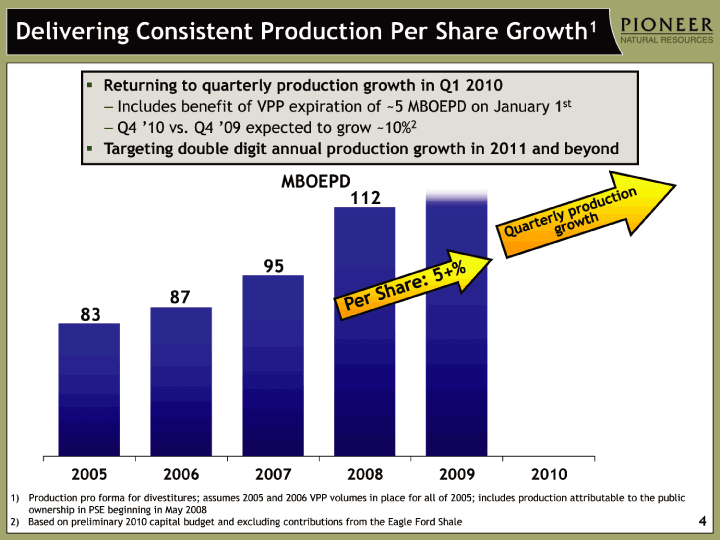
| 2005 2006 2007 2008 2009 2010 2011 Historical Production Production Outlook 83 87 95 112 112 0 62 5 0 7 4 Delivering Consistent Production Per Share Growth1 MBOEPD Production pro forma for divestitures; assumes 2005 and 2006 VPP volumes in place for all of 2005; includes production attributable to the public ownership in PSE beginning in May 2008 Based on preliminary 2010 capital budget and excluding contributions from the Eagle Ford Shale 87 83 95 112 Per Share: 5+% Quarterly production growth Returning to quarterly production growth in Q1 2010 Includes benefit of VPP expiration of ~5 MBOEPD on January 1st Q4 '10 vs. Q4 '09 expected to grow ~10%2 Targeting double digit annual production growth in 2011 and beyond |
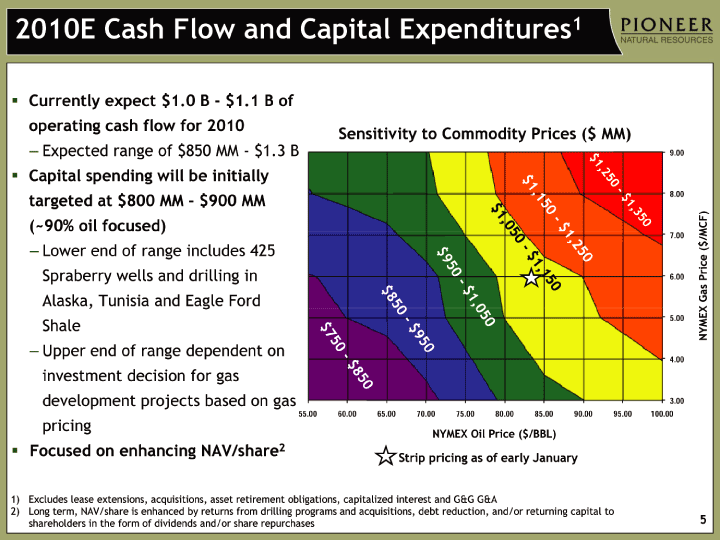
| Currently expect $1.0 B - $1.1 B of operating cash flow for 2010 Expected range of $850 MM - $1.3 B Capital spending will be initially targeted at $800 MM - $900 MM (~90% oil focused) Lower end of range includes 425 Spraberry wells and drilling in Alaska, Tunisia and Eagle Ford Shale Upper end of range dependent on investment decision for gas development projects based on gas pricing Focused on enhancing NAV/share2 NYMEX Oil Price ($/BBL) NYMEX Gas Price ($/MCF) Strip pricing as of early January Sensitivity to Commodity Prices ($ MM) 5 2010E Cash Flow and Capital Expenditures1 Excludes lease extensions, acquisitions, asset retirement obligations, capitalized interest and G&G G&A Long term, NAV/share is enhanced by returns from drilling programs and acquisitions, debt reduction, and/or returning capital to shareholders in the form of dividends and/or share repurchases $950 - $1,050 $1,050 - $1,150 $1,150 - $1,250 $750 - $850 $850 - $950 $1,250 - $1,350 |
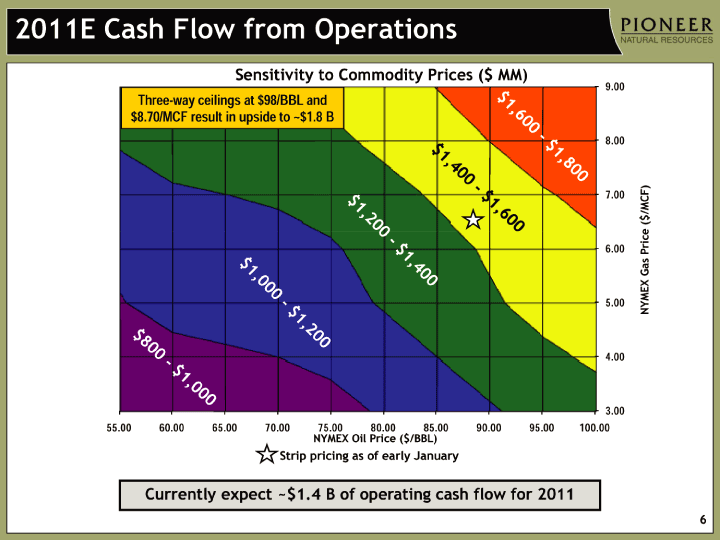
| 2011E Cash Flow from Operations NYMEX Oil Price ($/BBL) NYMEX Gas Price ($/MCF) $800 - $1,000 Strip pricing as of early January Sensitivity to Commodity Prices ($ MM) Three-way ceilings at $98/BBL and $8.70/MCF result in upside to ~$1.8 B 6 Currently expect ~$1.4 B of operating cash flow for 2011 $1,000 - $1,200 $1,200 - $1,400 $1,400 - $1,600 $1,600 - $1,800 |
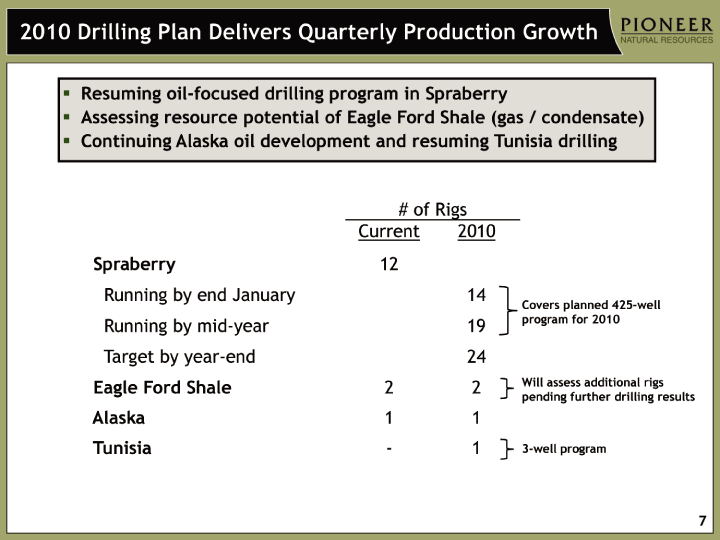
| 7 2010 Drilling Plan Delivers Quarterly Production Growth 2010 Drilling Plan Delivers Quarterly Production Growth Resuming oil-focused drilling program in Spraberry Assessing resource potential of Eagle Ford Shale (gas / condensate) Continuing Alaska oil development and resuming Tunisia drilling Will assess additional rigs pending further drilling results 3-well program Covers planned 425-well program for 2010 |
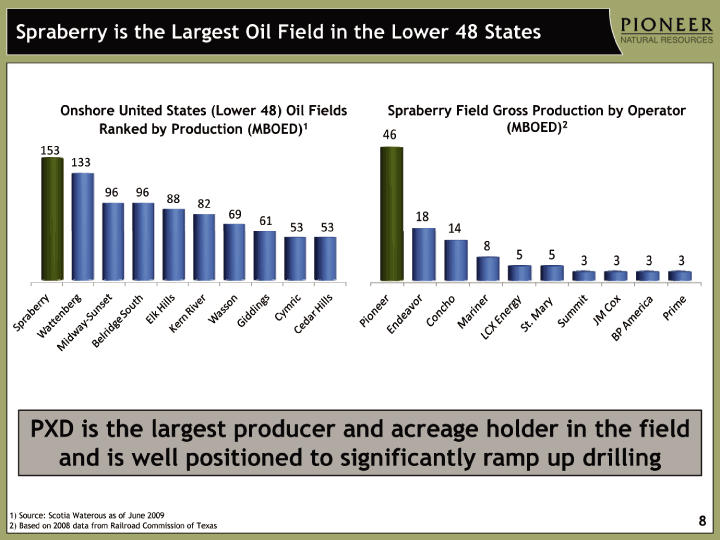
| Spraberry is the Largest Oil Field in the Lower 48 States 8 PXD is the largest producer and acreage holder in the field and is well positioned to significantly ramp up drilling Onshore United States (Lower 48) Oil Fields Ranked by Production (MBOED)1 Spraberry Field Gross Production by Operator (MBOED)2 1) Source: Scotia Waterous as of June 2009 2) Based on 2008 data from Railroad Commission of Texas |
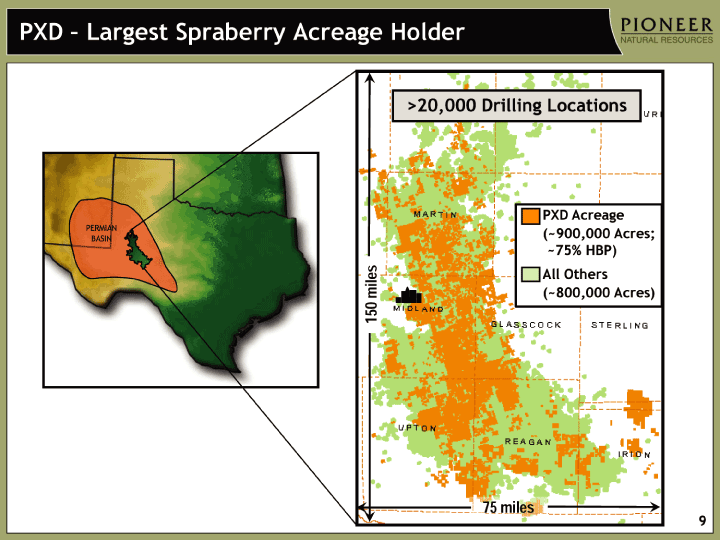
| PXD - Largest Spraberry Acreage Holder 9 PXD Acreage (~900,000 Acres; ~75% HBP) All Others (~800,000 Acres) 150 miles 75 miles PERMIAN BASIN >20,000 Drilling Locations |
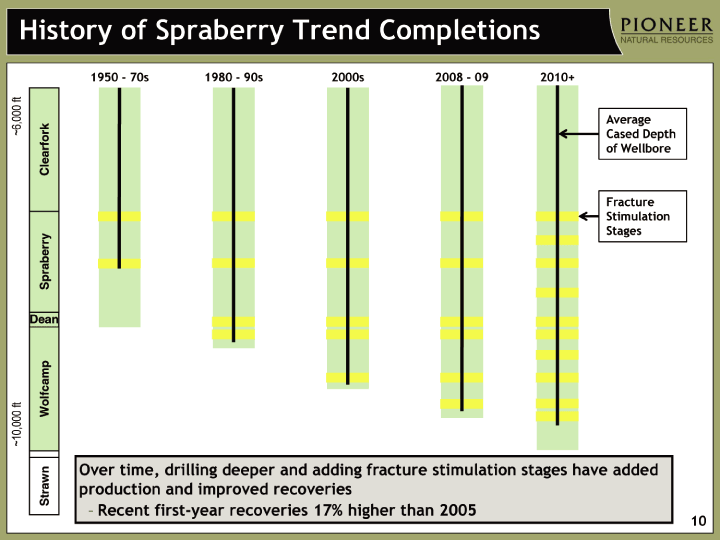
| 10 Dean Strawn Wolfcamp Spraberry Clearfork ~6,000 ft History of Spraberry Trend Completions 2010+ 2008 - 09 2000s 1980 - 90s ~10,000 ft 1950 - 70s Over time, drilling deeper and adding fracture stimulation stages have added production and improved recoveries Recent first-year recoveries 17% higher than 2005 Average Cased Depth of Wellbore Fracture Stimulation Stages |
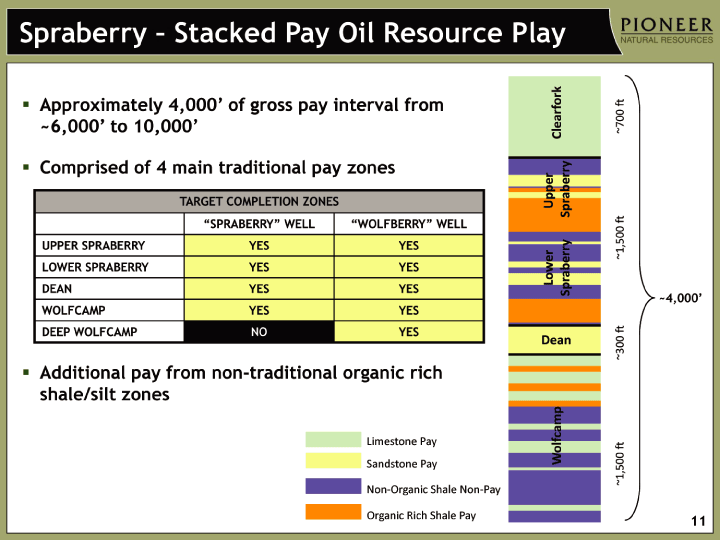
| 11 Approximately 4,000' of gross pay interval from ~6,000' to 10,000' Comprised of 4 main traditional pay zones Additional pay from non-traditional organic rich shale/silt zones TARGET COMPLETION ZONES TARGET COMPLETION ZONES TARGET COMPLETION ZONES "SPRABERRY" WELL "WOLFBERRY" WELL UPPER SPRABERRY YES YES LOWER SPRABERRY YES YES DEAN YES YES WOLFCAMP YES YES DEEP WOLFCAMP NO YES Spraberry Trend Limestone Pay Sandstone Pay Non-Organic Shale Non-Pay Organic Rich Shale Pay ~700 ft ~1,500 ft Clearfork Dean Upper Spraberry Wolfcamp ~300 ft ~1,500 ft ~4,000' Spraberry - Stacked Pay Oil Resource Play Lower Spraberry |
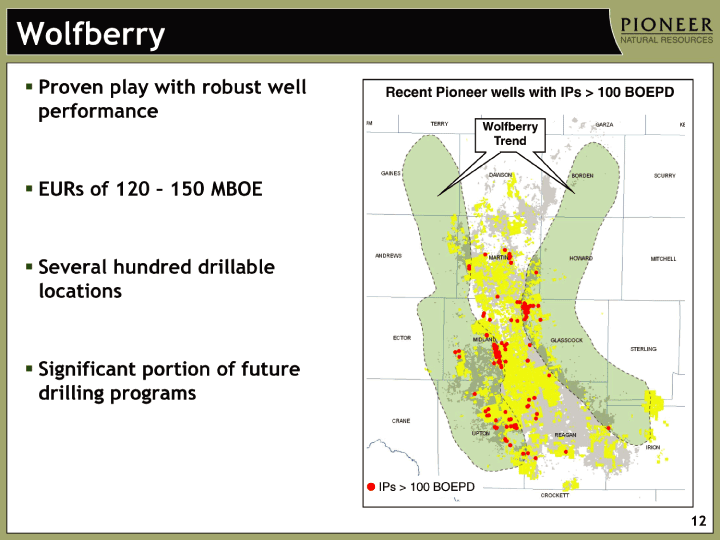
| 12 Wolfberry Proven play with robust well performance EURs of 120 - 150 MBOE Several hundred drillable locations Significant portion of future drilling programs Recent Pioneer wells with IPs > 100 BOEPD IPs > 100 BOEPD Wolfberry Trend Wolfberry Trend |
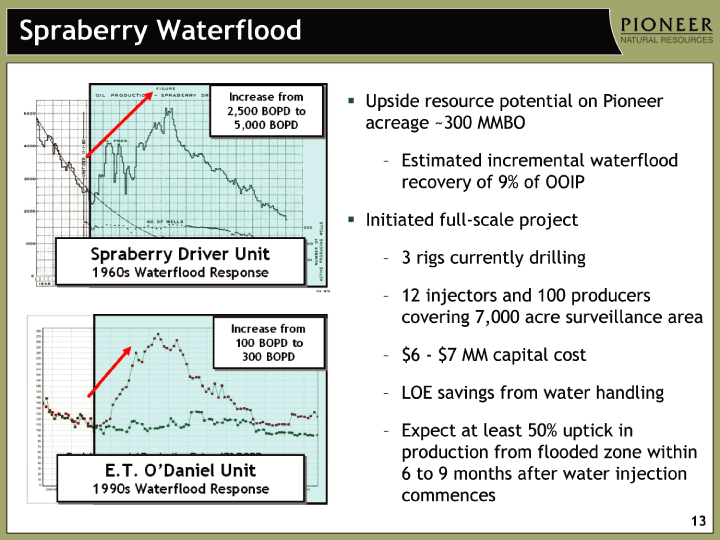
| 13 Spraberry Waterflood Upside resource potential on Pioneer acreage ~300 MMBO Estimated incremental waterflood recovery of 9% of OOIP Initiated full-scale project 3 rigs currently drilling 12 injectors and 100 producers covering 7,000 acre surveillance area $6 - $7 MM capital cost LOE savings from water handling Expect at least 50% uptick in production from flooded zone within 6 to 9 months after water injection commences |

| 14 Spraberry - Increasing Recovery Per Section 40-acre field development (200 MMBOE) 12% - 13% Ramping up drilling Capturing pay from shale/silt non-traditional intervals 20-acre spacing (500 MMBOE) 6% Field wide 20-acre down spacing approved by Railroad Commission of Texas Monitoring twenty 20-acre wells drilled in 2008 with encouraging results Capturing pay from shale/silt non-traditional intervals Waterflood (300 MMBO) 9% Initiated 7,000-acre waterflood under existing unit Total 27% - 28% Expected Recovery Per Section (% of OOIP) Exposure to 1 BBOE net resource potential |
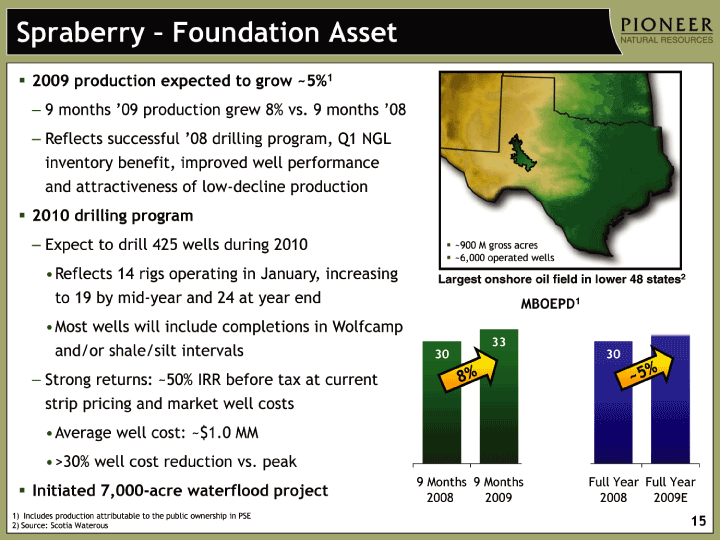
| 15 Spraberry - Foundation Asset 2009 production expected to grow ~5%1 9 months '09 production grew 8% vs. 9 months '08 Reflects successful '08 drilling program, Q1 NGL inventory benefit, improved well performance and attractiveness of low-decline production 2010 drilling program Expect to drill 425 wells during 2010 Reflects 14 rigs operating in January, increasing to 19 by mid-year and 24 at year end Most wells will include completions in Wolfcamp and/or shale/silt intervals Strong returns: ~50% IRR before tax at current strip pricing and market well costs Average well cost: ~$1.0 MM >30% well cost reduction vs. peak Initiated 7,000-acre waterflood project Includes production attributable to the public ownership in PSE Source: Scotia Waterous MBOEPD1 Largest onshore oil field in lower 48 states2 9 Months 2008 9 Months 2009 Full Year 2008 Full Year 2009E Spraberry 30 33 30 31 1 actuals 30.26 37.155 30.159 37.155 8% ~5% ~900 M gross acres ~6,000 operated wells |
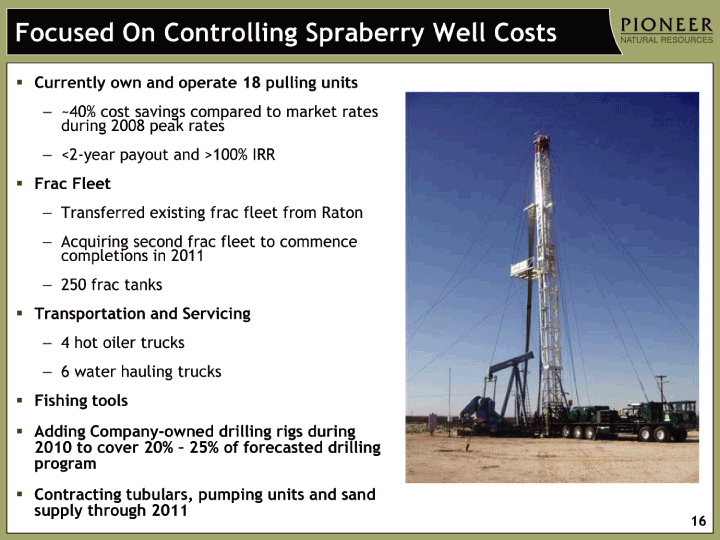
| 16 Focused On Controlling Spraberry Well Costs Currently own and operate 18 pulling units ~40% cost savings compared to market rates during 2008 peak rates <2-year payout and >100% IRR Frac Fleet Transferred existing frac fleet from Raton Acquiring second frac fleet to commence completions in 2011 250 frac tanks Transportation and Servicing 4 hot oiler trucks 6 water hauling trucks Fishing tools Adding Company-owned drilling rigs during 2010 to cover 20% - 25% of forecasted drilling program Contracting tubulars, pumping units and sand supply through 2011 |
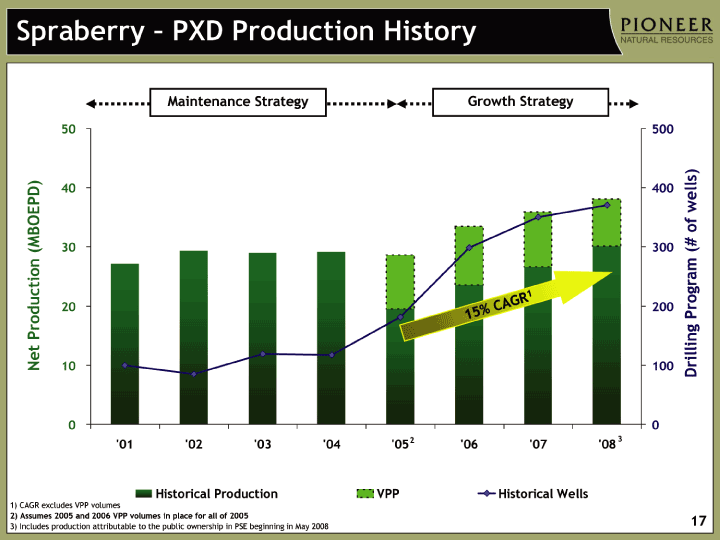
| 17 Spraberry - PXD Production History '00 '01 '02 '03 '04 '05 '06 '07 '08 '09E Historical Production 28.83333333 27.16666667 29.33333333 29 29.16666667 19.56 23.581 26.6 30.16 Production Outlook 36.096 VPP 9.1 9.9 9.3 7.9 7.487671233 6.832876712 3.747945205 3.509589041 Historical Wells 95 100 85 119 117 181 299 350 370 450 Net Production (MBOEPD) Drilling Program (# of wells) Maintenance Strategy Growth Strategy 15% CAGR1 3 1) CAGR excludes VPP volumes 2) Assumes 2005 and 2006 VPP volumes in place for all of 2005 3) Includes production attributable to the public ownership in PSE beginning in May 2008 2 |
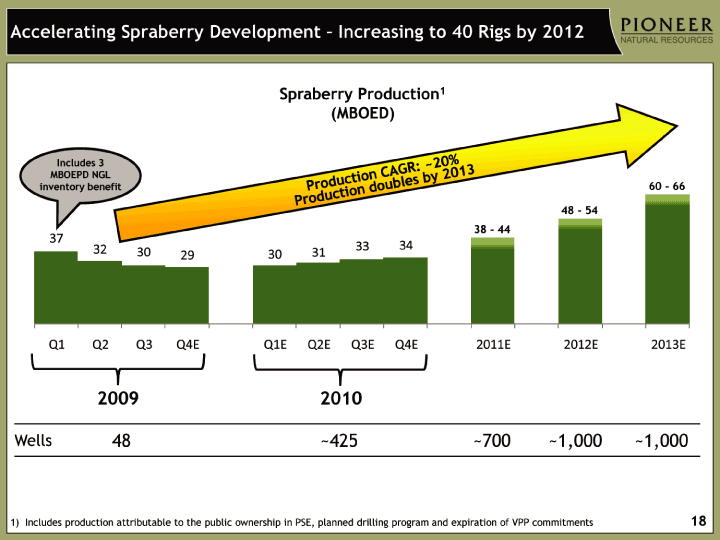
| Accelerating Spraberry Development - Increasing to 40 Rigs by 2012 18 Spraberry Production1 (MBOED) Includes 3 MBOEPD NGL inventory benefit 2009 2010 Wells 48 ~425 ~700 ~1,000 ~1,000 Production CAGR: ~20% Production doubles by 2013 38 - 44 48 - 54 60 - 66 1) Includes production attributable to the public ownership in PSE, planned drilling program and expiration of VPP commitments |
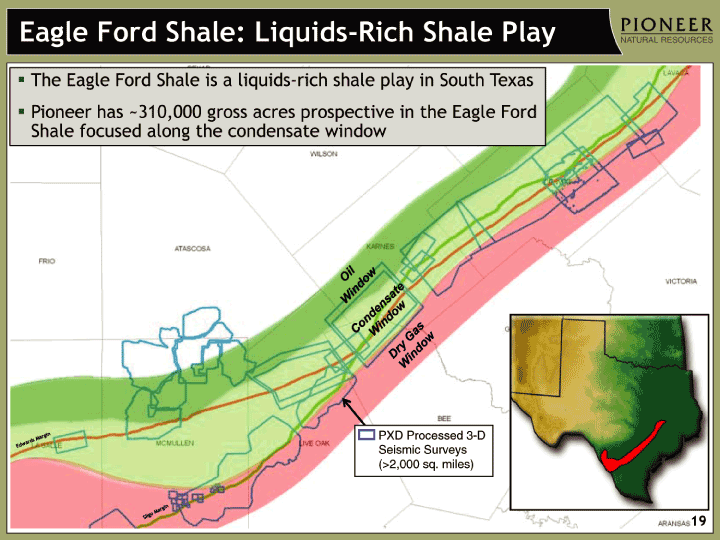
| The Eagle Ford Shale is a liquids-rich shale play in South Texas Pioneer has ~310,000 gross acres prospective in the Eagle Ford Shale focused along the condensate window Dry Gas Window Condensate Window Oil Window PXD Processed 3-D Seismic Surveys (>2,000 sq. miles) Sligo Margin Edwards Margin 19 Eagle Ford Shale: Liquids-Rich Shale Play |
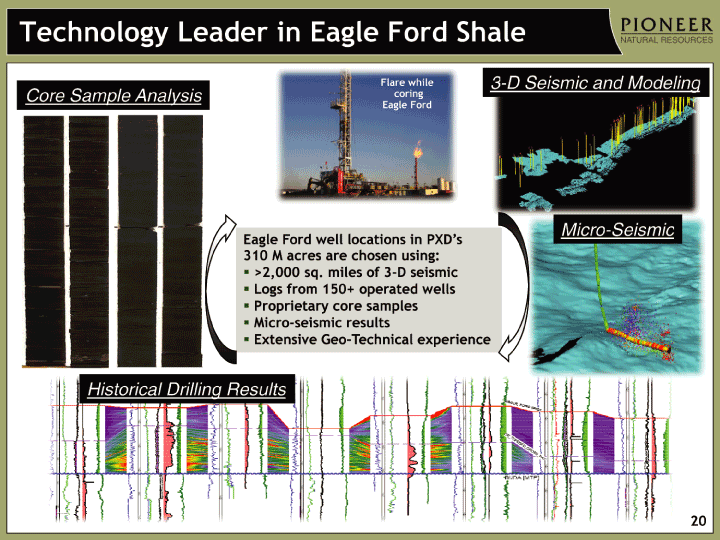
| 20 Technology Leader in Eagle Ford Shale Eagle Ford well locations in PXD's 310 M acres are chosen using: >2,000 sq. miles of 3-D seismic Logs from 150+ operated wells Proprietary core samples Micro-seismic results Extensive Geo-Technical experience Historical Drilling Results Flare while coring Eagle Ford 3-D Seismic and Modeling Micro-Seismic Core Sample Analysis |
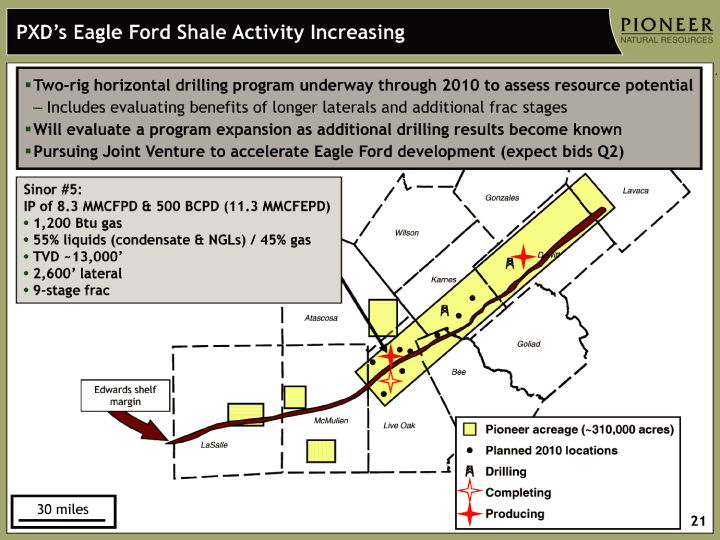
| 21 30 miles PXD's Eagle Ford Shale Activity Increasing Bee Goliad Live Oak Karnes McMullen LaSalle Atascosa Wilson Gonzales Lavaca Edwards shelf margin Dewitt Two-rig horizontal drilling program underway through 2010 to assess resource potential Includes evaluating benefits of longer laterals and additional frac stages Will evaluate a program expansion as additional drilling results become known Pursuing Joint Venture to accelerate Eagle Ford development (expect bids Q2) Sinor #5: IP of 8.3 MMCFPD & 500 BCPD (11.3 MMCFEPD) 1,200 Btu gas 55% liquids (condensate & NGLs) / 45% gas TVD ~13,000' 2,600' lateral 9-stage frac Pioneer acreage (~310,000 acres) Drilling Planned 2010 locations Producing Completing |
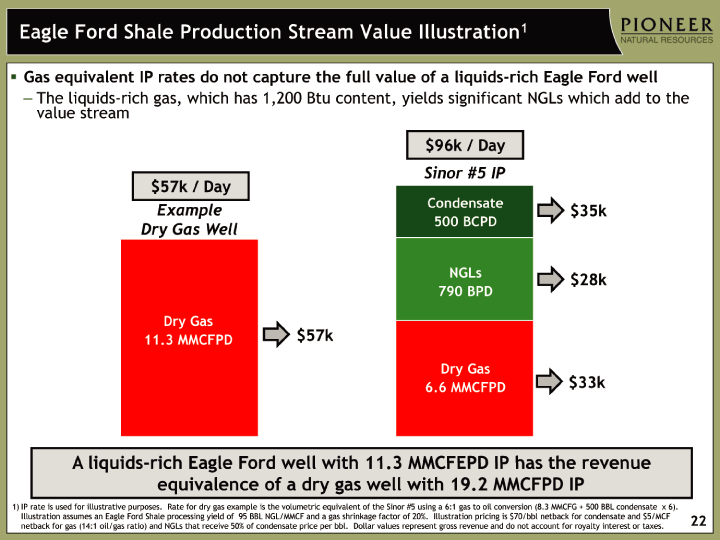
| (CHART) Eagle Ford Shale Production Stream Value Illustration1 22 (CHART) A liquids-rich Eagle Ford well with 11.3 MMCFEPD IP has the revenue equivalence of a dry gas well with 19.2 MMCFPD IP Dry Gas 11.3 MMCFPD $57k $33k $28k $35k Condensate 500 BCPD NGLs 790 BPD Dry Gas 6.6 MMCFPD $57k / Day $96k / Day Example Dry Gas Well Gas equivalent IP rates do not capture the full value of a liquids-rich Eagle Ford well The liquids-rich gas, which has 1,200 Btu content, yields significant NGLs which add to the value stream Sinor #5 IP IP rate is used for illustrative purposes. Rate for dry gas example is the volumetric equivalent of the Sinor #5 using a 6:1 gas to oil conversion (8.3 MMCFG + 500 BBL condensate x 6). Illustration assumes an Eagle Ford Shale processing yield of 95 BBL NGL/MMCF and a gas shrinkage factor of 20%. Illustration pricing is $70/bbl netback for condensate and $5/MCF netback for gas (14:1 oil/gas ratio) and NGLs that receive 50% of condensate price per bbl. Dollar values represent gross revenue and do not account for royalty interest or taxes. |
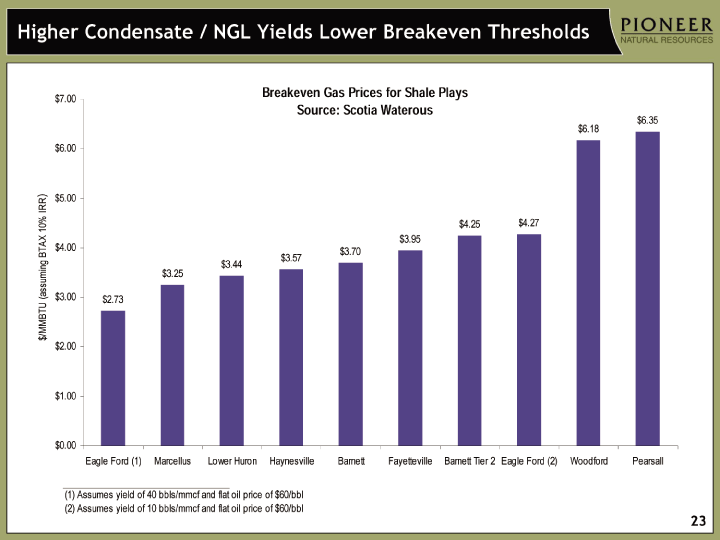
| Higher Condensate / NGL Yields Lower Breakeven Thresholds 23 ) |
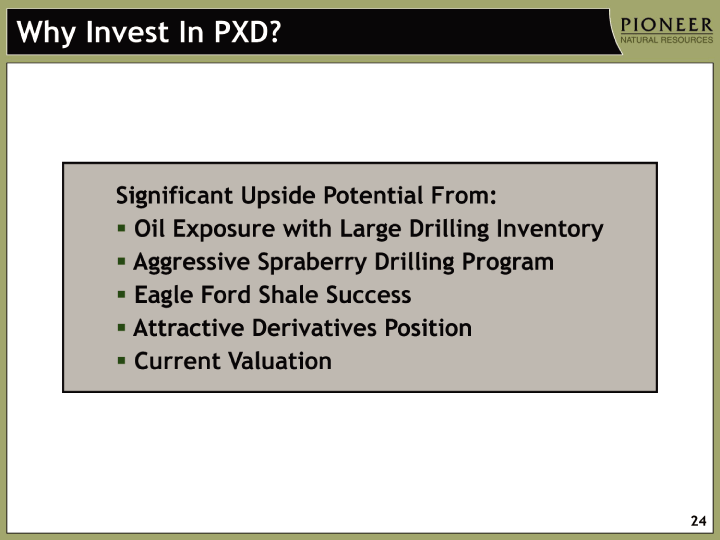
| 24 Why Invest In PXD? Significant Upside Potential From: Oil Exposure with Large Drilling Inventory Aggressive Spraberry Drilling Program Eagle Ford Shale Success Attractive Derivatives Position Current Valuation |

| 25 Appendix |
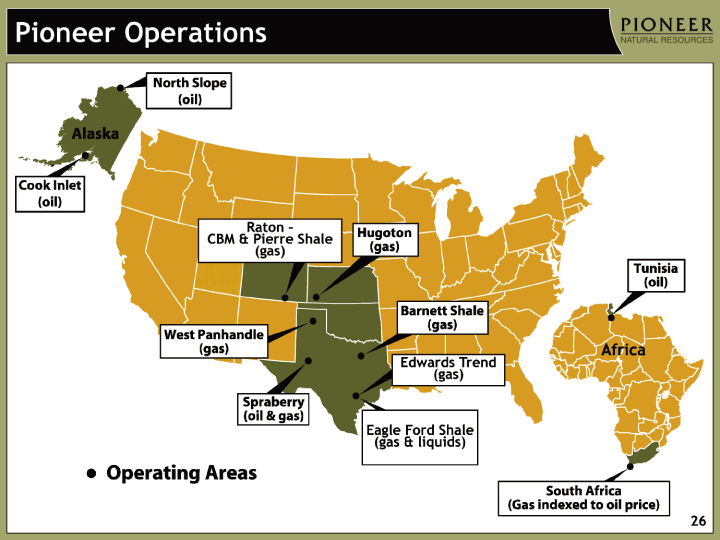
| 26 Pioneer Operations Raton - CBM & Pierre Shale (gas) Eagle Ford Shale (gas & liquids) Edwards Trend (gas) |
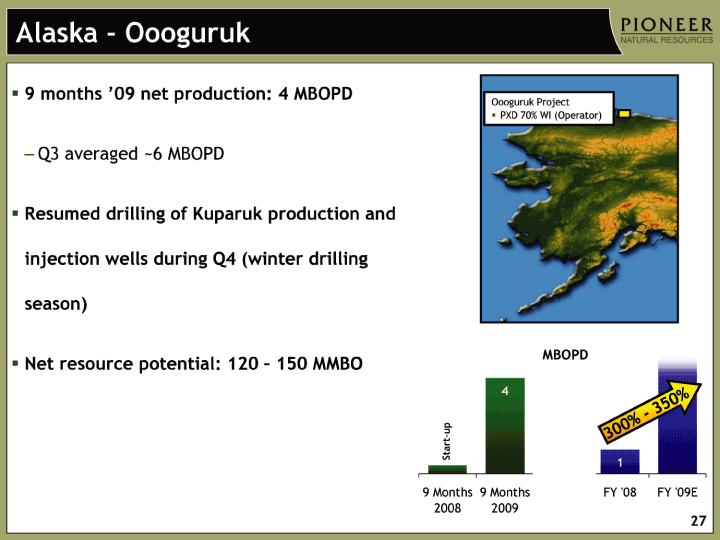
| 27 9 Months 2008 9 Months 2009 FY '08 FY '09E Alaska 0.345 4 1 4 1 actuals 0 3.889 1.13 5 300% - 350% Alaska - Oooguruk 9 months '09 net production: 4 MBOPD Q3 averaged ~6 MBOPD Resumed drilling of Kuparuk production and injection wells during Q4 (winter drilling season) Net resource potential: 120 - 150 MMBO Oooguruk Project PXD 70% WI (Operator) MBOPD Start-up |
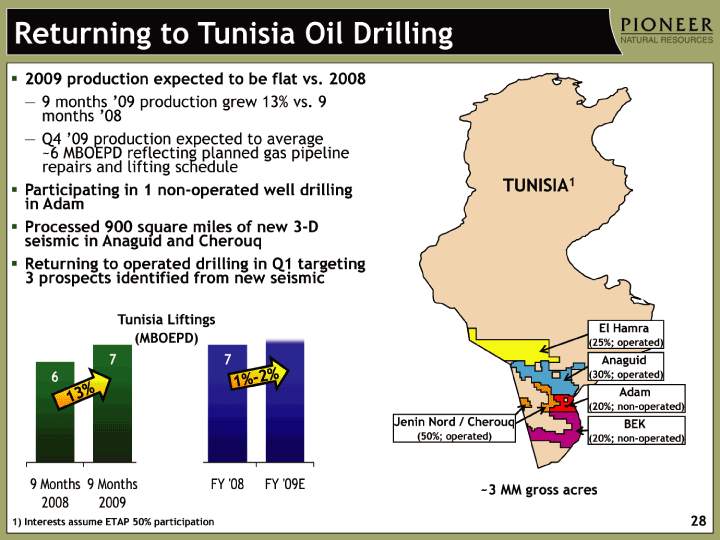
| 28 Returning to Tunisia Oil Drilling 1) Interests assume ETAP 50% participation 2009 production expected to be flat vs. 2008 9 months '09 production grew 13% vs. 9 months '08 Q4 '09 production expected to average ~6 MBOEPD reflecting planned gas pipeline repairs and lifting schedule Participating in 1 non-operated well drilling in Adam Processed 900 square miles of new 3-D seismic in Anaguid and Cherouq Returning to operated drilling in Q1 targeting 3 prospects identified from new seismic 9 Months 2008 9 Months 2009 FY '08 FY '09E Tunisia 6 7 7 7 0.5 actuals 4.167 6.74 6.573 Tunisia Liftings (MBOEPD) 13% 1%-2% ~3 MM gross acres El Hamra (25%; operated) Anaguid (30%; operated) Adam (20%; non-operated) BEK (20%; non-operated) Jenin Nord / Cherouq (50%; operated) TUNISIA1 |
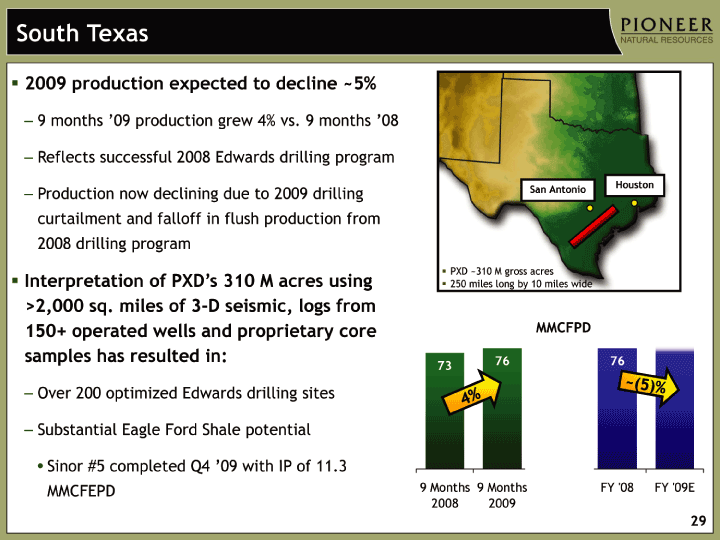
| 29 South Texas 2009 production expected to decline ~5% 9 months '09 production grew 4% vs. 9 months '08 Reflects successful 2008 Edwards drilling program Production now declining due to 2009 drilling curtailment and falloff in flush production from 2008 drilling program Interpretation of PXD's 310 M acres using >2,000 sq. miles of 3-D seismic, logs from 150+ operated wells and proprietary core samples has resulted in: Over 200 optimized Edwards drilling sites Substantial Eagle Ford Shale potential Sinor #5 completed Q4 '09 with IP of 11.3 MMCFEPD MMCFPD 9 Months 2008 9 Months 2009 FY '08 FY '09E Edwards 73 76 76 72 6 actuals 70.374 89.742 75.672 37.155 4% ~(5)% PXD ~310 M gross acres 250 miles long by 10 miles wide San Antonio Houston |
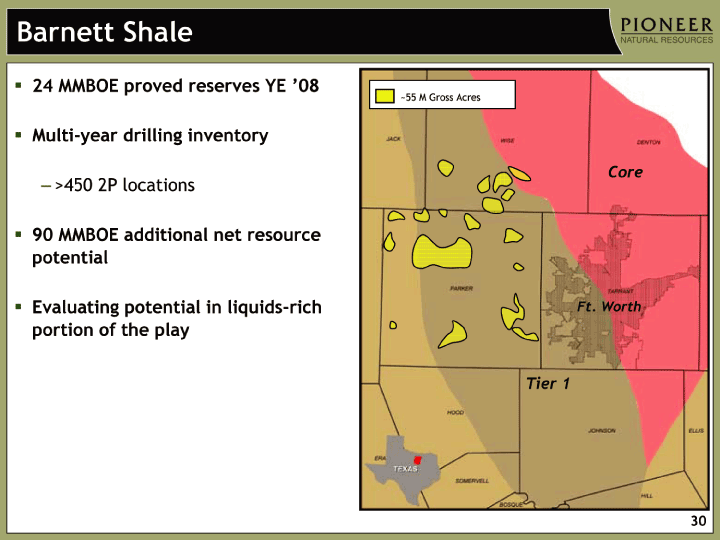
| 30 Barnett Shale Expansion / Tier 2 Area 24 MMBOE proved reserves YE '08 Multi-year drilling inventory >450 2P locations 90 MMBOE additional net resource potential Evaluating potential in liquids-rich portion of the play Tier 1 Core Ft. Worth ~55 M Gross Acres |
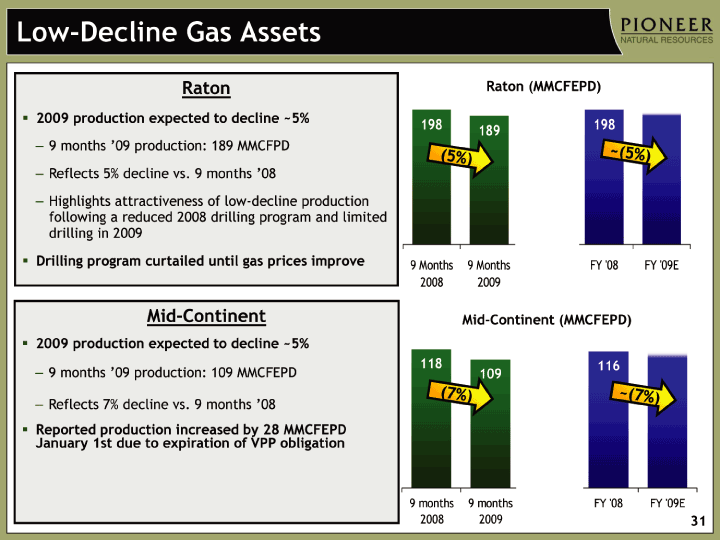
| 31 Mid-Continent 2009 production expected to decline ~5% 9 months '09 production: 109 MMCFEPD Reflects 7% decline vs. 9 months '08 Reported production increased by 28 MMCFEPD January 1st due to expiration of VPP obligation 9 Months 2008 9 Months 2009 FY '08 FY '09E Raton 198 189 198 188 6 actuals 4.167 6.74 6.573 9 months 2008 9 months 2009 FY '08 FY '09E Mid-Cont 118 109 116 110 6 actuals 22.014 31.752 24.66 Raton (MMCFEPD) Low-Decline Gas Assets Mid-Continent (MMCFEPD) Raton 2009 production expected to decline ~5% 9 months '09 production: 189 MMCFPD Reflects 5% decline vs. 9 months '08 Highlights attractiveness of low-decline production following a reduced 2008 drilling program and limited drilling in 2009 Drilling program curtailed until gas prices improve ~(7%) ~(5%) (5%) (7%) |
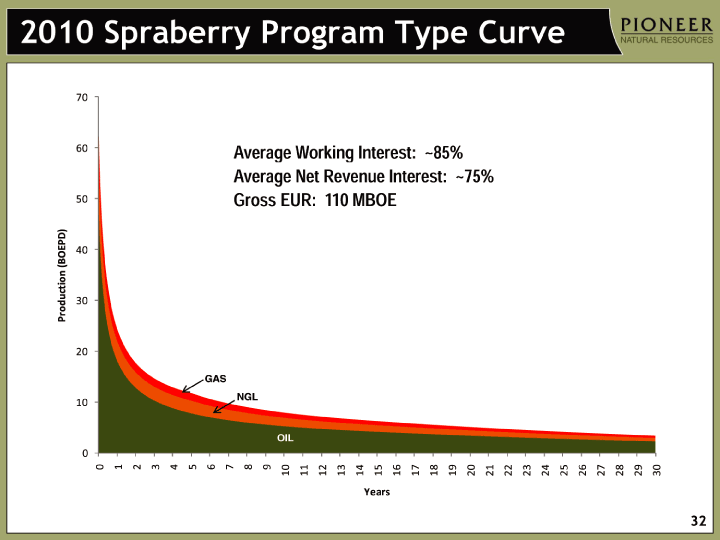
| 2010 Spraberry Program Type Curve 32 Average Working Interest: ~85% Average Net Revenue Interest: ~75% Gross EUR: 110 MBOE OIL NGL GAS OIL |
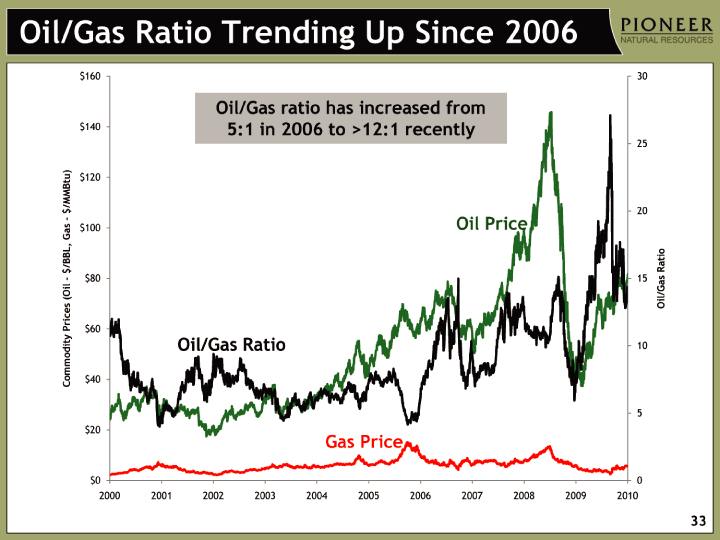
| (CHART) Oil/Gas Ratio Trending Up Since 2006 33 Oil Price Gas Price Oil/Gas Ratio Oil/Gas ratio has increased from 5:1 in 2006 to >12:1 recently |
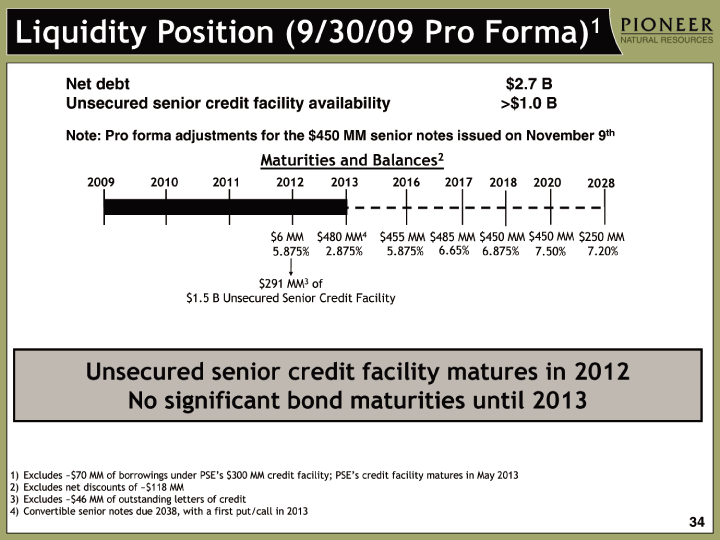
| 34 Liquidity Position (9/30/09 Pro Forma)1 Net debt $2.7 B Unsecured senior credit facility availability >$1.0 B Note: Pro forma adjustments for the $450 MM senior notes issued on November 9th Excludes ~$70 MM of borrowings under PSE's $300 MM credit facility; PSE's credit facility matures in May 2013 Excludes net discounts of ~$118 MM Excludes ~$46 MM of outstanding letters of credit Convertible senior notes due 2038, with a first put/call in 2013 2009 2010 2011 2012 2016 $6 MM 5.875% $250 MM 7.20% 2017 $455 MM 5.875% 2028 $450 MM 6.875% $291 MM3 of $1.5 B Unsecured Senior Credit Facility Maturities and Balances2 2018 $485 MM 6.65% 2013 $480 MM4 2.875% Unsecured senior credit facility matures in 2012 No significant bond maturities until 2013 2020 $450 MM 7.50% |
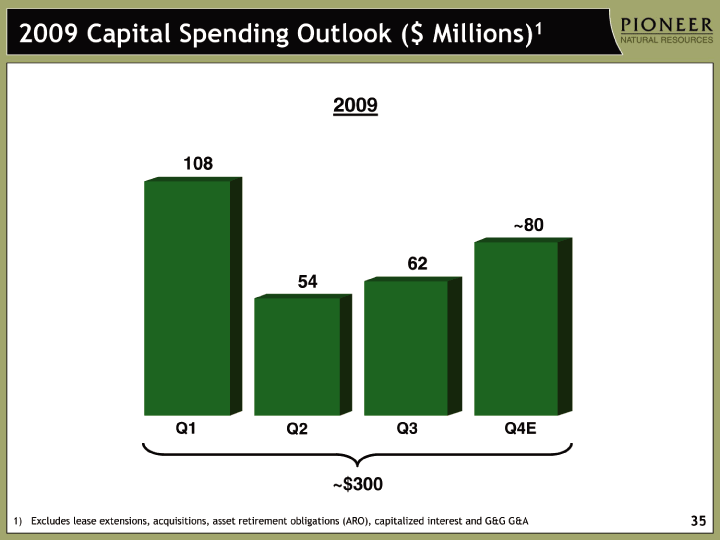
| 35 Volumes Q1 Q2 Q2P Q3 Q3P Q4 Q1 Q2 Q3 Q4 Q1 2001 Q2 01 Q3 01 4Q 01 Q1 02 Q2 02 Q3 02 Q4 02 Q1 03 Q2 03 Q3 03 Q4 03 Q1 04 Q2 04 Q3 04 Q4 04 Q1 05 Q2 05 Q3 05 Q4 05 Q1 2006 Q2 2006 Q3 2006 Q4 2006 Q1 2007 Q2 2007 Q3 2007 Q4 2007 Q1 2008 Q2 2008 Q3 2008 Q4 2008 Q1 2009 Q2 2009E Q3 2009E Q4 2009E Development Drilling 50.407 47.76 34.8 36.6 33.16 88.3 50 26 30 36 58 71 51 76 75 104 76 90 78 47 83 90 56 79 66 114 150 152 148 179 189 195 226 270 230 200 222 195 306 334 307 285 108 54 62 80 Development Projects 136 111 40 50 Resource Plays/ Exploration 27.54 26.2 24.16 24.03 23.96 22.93 15 31 31 53 49 69 63 40 30 41 26 36 85 56 50 82 102 54 46 41 102 64 70 124 74 50 110 113 91 86 103 111 98 101 73 60 High Impact Exploration 0 0 0 37 7 11 26 30 24 0 0 0 Acquisition 80.95 83.7 67.9 64.57 62.32 7.64 5 3 15 45 18 4 16 143 8 58 113 17 123 6 4 19 6 49 24 11 34 50 188 0 33 64 59 66 21 55 10 449 5 2009 Capital Spending Outlook ($ Millions)1 Excludes lease extensions, acquisitions, asset retirement obligations (ARO), capitalized interest and G&G G&A Q1 108 54 62 ~80 Q2 Q3 Q4E ~$300 2009 |
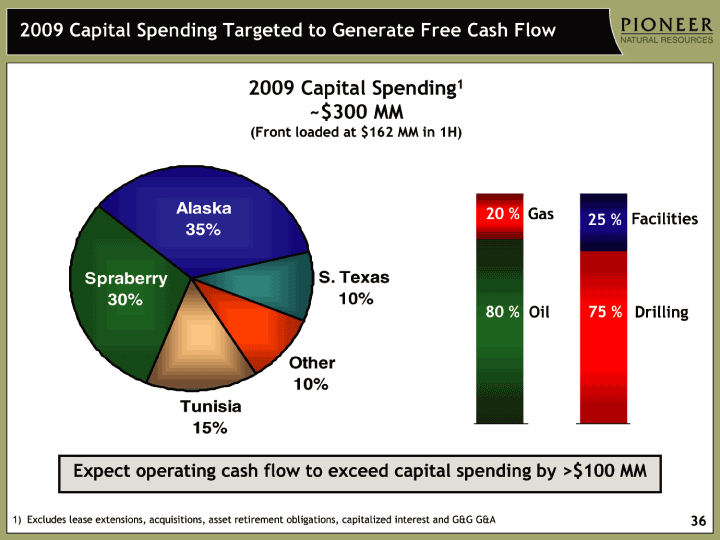
| 36 2009 Capital Spending Targeted to Generate Free Cash Flow Alaska S. Texas Barnett Other Raton Tunisia Spraberry Development Projects 0.35 0.1 0.05 0.1 0.1 0.15 0.3 1) Excludes lease extensions, acquisitions, asset retirement obligations, capitalized interest and G&G G&A 2009 Capital Spending1 ~$300 MM (Front loaded at $162 MM in 1H) 9 MOS '07 9 Mos '08 2005 2006 2007 2008 Oil Gas blank 2009 2011 Drilling 165 198 142 155 171 1130 0.8 0.75 268 Facilities 0.2 0.25 50 Facilities Drilling 25 % 75 % 20 % 80 % Oil Gas Expect operating cash flow to exceed capital spending by >$100 MM |
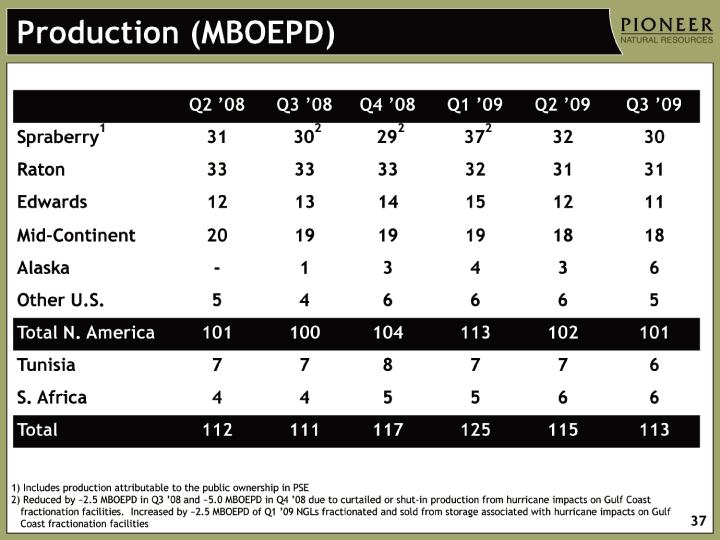
| 37 Production (MBOEPD) Production (MBOEPD) 1) Includes production attributable to the public ownership in PSE 2) Reduced by ~2.5 MBOEPD in Q3 '08 and ~5.0 MBOEPD in Q4 '08 due to curtailed or shut-in production from hurricane impacts on Gulf Coast fractionation facilities. Increased by ~2.5 MBOEPD of Q1 '09 NGLs fractionated and sold from storage associated with hurricane impacts on Gulf Coast fractionation facilities |
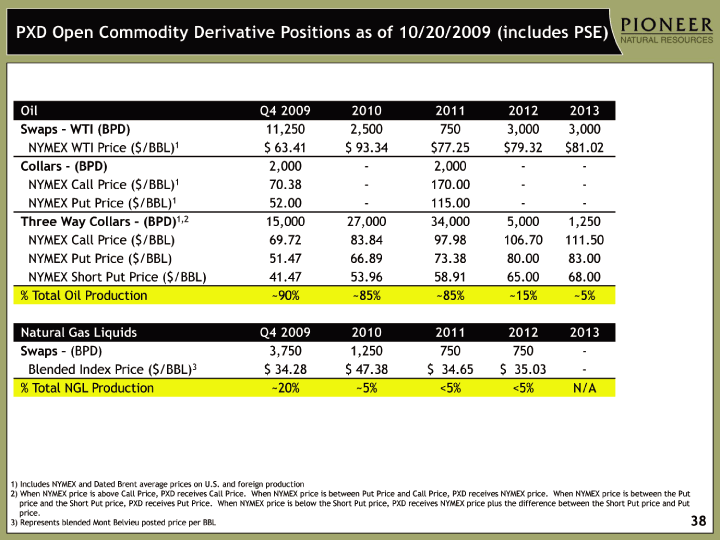
| 38 Oil Q4 2009 2010 2011 2012 2013 Swaps - WTI (BPD) 11,250 2,500 750 3,000 3,000 NYMEX WTI Price ($/BBL)1 $ 63.41 $ 93.34 $77.25 $79.32 $81.02 Collars - (BPD) 2,000 - 2,000 - - NYMEX Call Price ($/BBL)1 70.38 - 170.00 - - NYMEX Put Price ($/BBL)1 52.00 - 115.00 - - Three Way Collars - (BPD)1,2 15,000 27,000 34,000 5,000 1,250 NYMEX Call Price ($/BBL) 69.72 83.84 97.98 106.70 111.50 NYMEX Put Price ($/BBL) 51.47 66.89 73.38 80.00 83.00 NYMEX Short Put Price ($/BBL) 41.47 53.96 58.91 65.00 68.00 % Total Oil Production ~90% ~85% ~85% ~15% ~5% Natural Gas Liquids Q4 2009 2010 2011 2012 2013 Swaps - (BPD) 3,750 1,250 750 750 - Blended Index Price ($/BBL)3 $ 34.28 $ 47.38 $ 34.65 $ 35.03 - % Total NGL Production ~20% ~5% <5% <5% N/A PXD Open Commodity Derivative Positions as of 10/20/2009 (includes PSE) 1) Includes NYMEX and Dated Brent average prices on U.S. and foreign production 2) When NYMEX price is above Call Price, PXD receives Call Price. When NYMEX price is between Put Price and Call Price, PXD receives NYMEX price. When NYMEX price is between the Put price and the Short Put price, PXD receives Put Price. When NYMEX price is below the Short Put price, PXD receives NYMEX price plus the difference between the Short Put price and Put price. 3) Represents blended Mont Belvieu posted price per BBL |
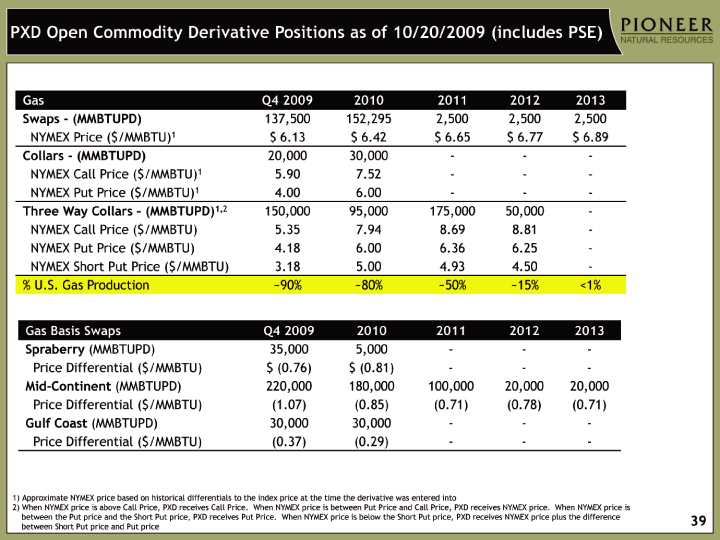
| 39 Gas Q4 2009 2010 2011 2012 2013 Swaps - (MMBTUPD) 137,500 152,295 2,500 2,500 2,500 NYMEX Price ($/MMBTU)1 $ 6.13 $ 6.42 $ 6.65 $ 6.77 $ 6.89 Collars - (MMBTUPD) 20,000 30,000 - - - NYMEX Call Price ($/MMBTU)1 5.90 7.52 - - - NYMEX Put Price ($/MMBTU)1 4.00 6.00 - - - Three Way Collars - (MMBTUPD)1,2 150,000 95,000 175,000 50,000 - NYMEX Call Price ($/MMBTU) 5.35 7.94 8.69 8.81 - NYMEX Put Price ($/MMBTU) 4.18 6.00 6.36 6.25 - NYMEX Short Put Price ($/MMBTU) 3.18 5.00 4.93 4.50 - % U.S. Gas Production ~90% ~80% ~50% ~15% <1% PXD Open Commodity Derivative Positions as of 10/20/2009 (includes PSE) 1) Approximate NYMEX price based on historical differentials to the index price at the time the derivative was entered into 2) When NYMEX price is above Call Price, PXD receives Call Price. When NYMEX price is between Put Price and Call Price, PXD receives NYMEX price. When NYMEX price is between the Put price and the Short Put price, PXD receives Put Price. When NYMEX price is below the Short Put price, PXD receives NYMEX price plus the difference between Short Put price and Put price between Short Put price and Put price between Short Put price and Put price between Short Put price and Put price between Short Put price and Put price |
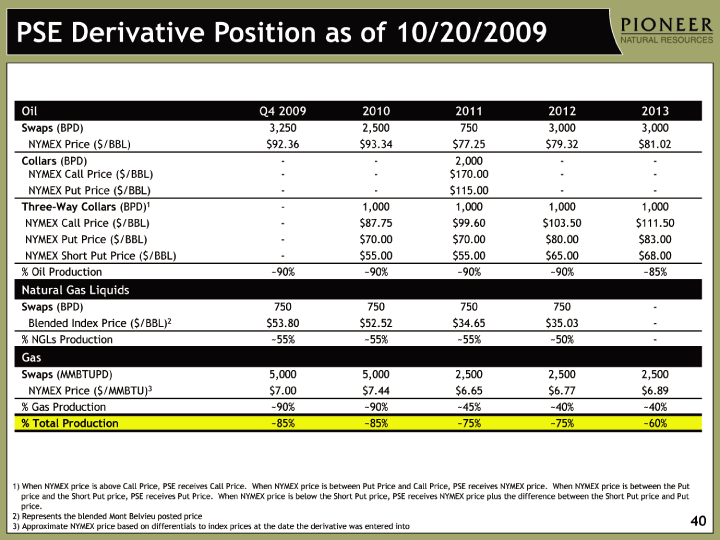
| 40 1) When NYMEX price is above Call Price, PSE receives Call Price. When NYMEX price is between Put Price and Call Price, PSE receives NYMEX price. When NYMEX price is between the Put price and the Short Put price, PSE receives Put Price. When NYMEX price is below the Short Put price, PSE receives NYMEX price plus the difference between the Short Put price and Put price. 2) Represents the blended Mont Belvieu posted price 3) Approximate NYMEX price based on differentials to index prices at the date the derivative was entered into Oil Q4 2009 2010 2011 2012 2013 Swaps (BPD) 3,250 2,500 750 3,000 3,000 NYMEX Price ($/BBL) $92.36 $93.34 $77.25 $79.32 $81.02 Collars (BPD) NYMEX Call Price ($/BBL) -- -- 2,000$170.00 -- -- NYMEX Put Price ($/BBL) - - $115.00 - - Three-Way Collars (BPD)1 - 1,000 1,000 1,000 1,000 NYMEX Call Price ($/BBL) - $87.75 $99.60 $103.50 $111.50 NYMEX Put Price ($/BBL) - $70.00 $70.00 $80.00 $83.00 NYMEX Short Put Price ($/BBL) - $55.00 $55.00 $65.00 $68.00 % Oil Production ~90% ~90% ~90% ~90% ~85% Natural Gas Liquids Swaps (BPD) 750 750 750 750 - Blended Index Price ($/BBL)2 $53.80 $52.52 $34.65 $35.03 - % NGLs Production ~55% ~55% ~55% ~50% - Gas Swaps (MMBTUPD) 5,000 5,000 2,500 2,500 2,500 NYMEX Price ($/MMBTU)3 $7.00 $7.44 $6.65 $6.77 $6.89 % Gas Production ~90% ~90% ~45% ~40% ~40% % Total Production ~85% ~85% ~75% ~75% ~60% PSE Derivative Position as of 10/20/2009 |
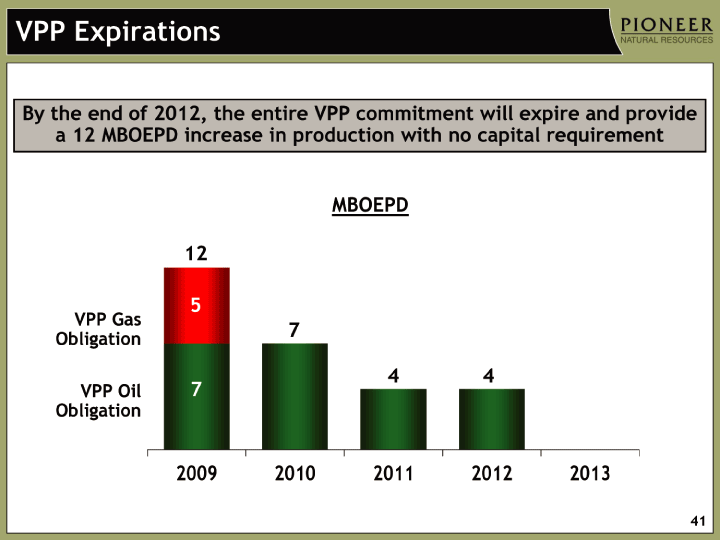
| 41 2008 2009 2010 2011 2012 2013 Historical Production VPP Oil 8 7 7 4 4 0 VPP Gas 5 5 Legacy Hedges VPP Expirations VPP Oil Obligation 12 7 4 MBOEPD 5 10 VPP Gas Obligation 7 4 By the end of 2012, the entire VPP commitment will expire and provide a 12 MBOEPD increase in production with no capital requirement |
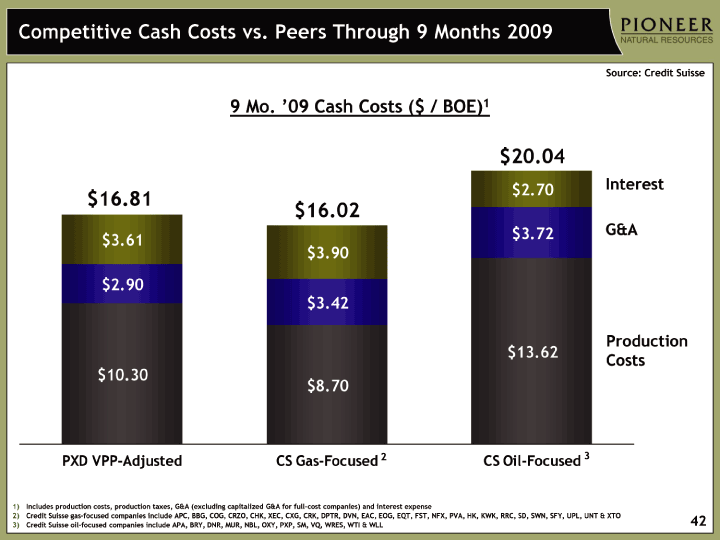
| Competitive Cash Costs vs. Peers Through 9 Months 2009 Source: Credit Suisse 9 Mo. '09 Cash Costs ($ / BOE)1 Includes production costs, production taxes, G&A (excluding capitalized G&A for full-cost companies) and interest expense Credit Suisse gas-focused companies include APC, BBG, COG, CRZO, CHK, XEC, CXG, CRK, DPTR, DVN, EAC, EOG, EQT, FST, NFX, PVA, HK, KWK, RRC, SD, SWN, SFY, UPL, UNT & XTO Credit Suisse oil-focused companies include APA, BRY, DNR, MUR, NBL, OXY, PXP, SM, VQ, WRES, WTI & WLL $16.02 G&A Interest $16.81 Production Costs $20.04 2 3 42 |
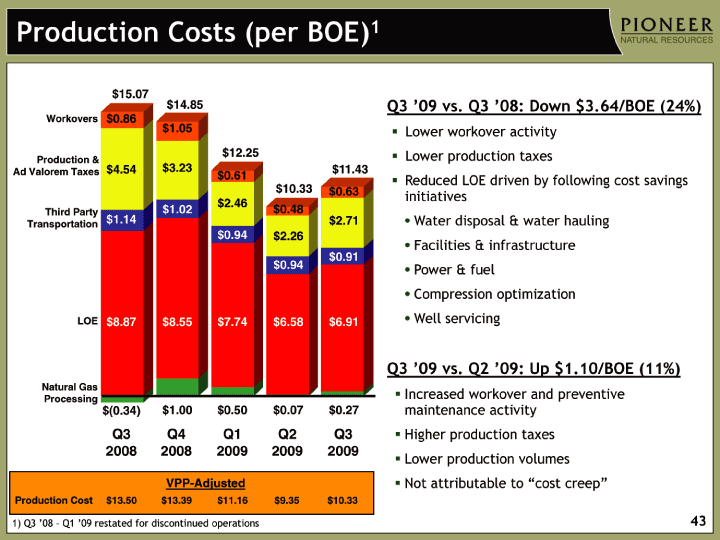
| 43 Q1 Q2 Q3 Q1 2000 Q2 2000 Q3 2000 Q4 2000 Q1 01 Q2 2001 Q3 01 Q4 01 Q1 02 Q2 02 Q3 02 Q4 02 Q1 03 Q2 03 Q3 03 Q4 03 Q1 04 Q2 04 Q3 04 Q4 04 Q1 05 Q2 05 Q3 05 Q4 05 Q1 06 Q2 06 Q3 06 Q4 06 Q1 2007 Q2 2007 Q3 2007 Q4 2007 Q1 2008 Q2 2008 Q3 2008 Q4 2008 Q1 2009 Q2 2009 Q3 2009 NGP 0.12 0.21 0.25 0.35 0.39 -0.02 0.21 -0.39 -0.37 0.96 0.47 0.07 0.27 LOE 2.99 2.42 2.47 2.18 2.05 2.2 2.33 2.36 2.58 2.89 3.19 3.29 2.88 2.63 2.68 3.02 3.3 3.29 3.44 3.43 3.71 3.81 4.22 4.8 5 5.63 4.81 6.15 6.23 5.61 6.19 6.28 6.94 7.18 7.19 7.56 8.09 9.02 8.74 7.87 6.58 6.91 Production Costs (per BOE)1 Production & Ad Valorem Taxes Q3 2008 VPP-Adjusted Workovers LOE Third Party Transportation Q4 2008 Production Cost Q2 2009 Q1 2009 $15.07 $4.54 $1.14 $0.86 $8.87 $13.39 Q3 '09 vs. Q3 '08: Down $3.64/BOE (24%) Lower workover activity Lower production taxes Reduced LOE driven by following cost savings initiatives Water disposal & water hauling Facilities & infrastructure Power & fuel Compression optimization Well servicing Q3 '09 vs. Q2 '09: Up $1.10/BOE (11%) Increased workover and preventive maintenance activity Higher production taxes Lower production volumes Not attributable to "cost creep" $13.50 $14.85 $3.23 $1.00 $1.05 $8.55 $1.02 Natural Gas Processing $(0.34) $12.25 $2.46 $0.50 $0.61 $7.74 $0.94 Q3 2009 $11.16 $10.33 $2.26 $0.07 $0.48 $6.58 $0.94 $9.35 1) Q3 '08 - Q1 '09 restated for discontinued operations $11.43 $2.71 $0.27 $0.63 $6.91 $0.91 $10.33 |
| 44 VPP - Adjusted Production Costs Pioneer presents VPP-Adjusted Production Costs (per BOE) to assist investors in considering the Company's costs in relation to the total BOEs (reported sales volumes plus VPP delivered volumes) in connection with which those costs were incurred. VPP-Production Costs (per BOE) are calculated as follows: Q3 '08 Q4 '08 Q1 '09 Q2 '09 Q3 '09 Production costs as reported (thousands) $153,282 $160,021 $138,128 $108,507 $118,483 Production (MBOE): As reported 10,169 10,773 11,279 10,506 10,361 VPP deliveries 1,185 1,180 1,093 1,101 1,109 VPP-adjusted production 11,474 12,027 12,523 11,606 11,470 Production costs per BOE: As reported $15.07 $14.85 $12.25 $10.33 $11.43 VPP-adjusted $13.50 $13.39 $11.16 $9.35 $10.33 |
| 45 Certain Reserve Information Cautionary Note to U.S. Investors -- The U.S. Securities and Exchange Commission (the "SEC") permits oil and gas companies, in their filings with the SEC, to disclose only proved reserves that a company has demonstrated by actual production or conclusive formation tests to be economically and legally producible under existing economic and operating conditions. In this presentation Pioneer uses certain terms, such as "resource potential", "EUR" or other descriptions of volumes of reserves, which the SEC's guidelines strictly prohibit including in filings with the SEC. These estimates are by their nature more speculative than estimates of proved reserves and accordingly are subject to substantially greater risk of being recovered by Pioneer. U.S. investors are urged to consider closely the disclosures in the Company's periodic filings with the SEC, available from the Company at 5205 N. O'Connor Blvd., Suite 200, Irving, Texas 75039, Attention Investor Relations, and the Company's website at www.pxd.com. These filings also can be obtained from the SEC by calling 1-800-SEC-0330. |