Attached files
| file | filename |
|---|---|
| 8-K - FORM 8-K - ABRAXAS PETROLEUM CORP | pc8k.htm |
| EX-99.1 - NEWS RELEASE - ABRAXAS PETROLEUM CORP | newsrelease.htm |

Energize 2010
January 6-8
San
Francisco
Exhibit
99.2

2
Forward-Looking
Statements
The
information presented herein may contain predictions, estimates and
other forward-looking statements within the meaning of Section 27A of the
Securities Act of 1933 and Section 21E of the Securities Exchange Act of
1934. Although the Company believes that its expectations are based on
reasonable assumptions, it can give no assurance that its goals will be
achieved.
other forward-looking statements within the meaning of Section 27A of the
Securities Act of 1933 and Section 21E of the Securities Exchange Act of
1934. Although the Company believes that its expectations are based on
reasonable assumptions, it can give no assurance that its goals will be
achieved.
Important factors
that could cause actual results to differ materially from
those included in the forward-looking statements include the timing and
extent of changes in commodity prices for oil and gas, the need to develop
and replace reserves, environmental risks, competition, government
regulation and the ability of the Company to meet its stated business
goals.
those included in the forward-looking statements include the timing and
extent of changes in commodity prices for oil and gas, the need to develop
and replace reserves, environmental risks, competition, government
regulation and the ability of the Company to meet its stated business
goals.

3
Bakken
producers Abraxas
operated wells
Bakken
permits Abraxas
non-operated wells
2008-2009
Bakken
Sleeper
Numerous
additional
opportunities
opportunities
(operated and
non-operated)
NO
LEASE EXPIRATIONS -
acreage principally held by
production
acreage principally held by
production
MINIMAL
RESERVES
BOOKED TO-DATE
BOOKED TO-DATE
10% WI
NON-OP WELL -
Completing
Completing
AXAS: 3
operated lease
blocks within 1 location of
commercial Bakken /
Three Forks production with
potential of:
blocks within 1 location of
commercial Bakken /
Three Forks production with
potential of:
>100
1st gross
Bakken
wells in unit *
Bakken
wells in unit *
Montana North
Dakota
Parshall
Nesson
Anticline
Elm
Coulee
Rough
Rider
* ~90 on
1280 acre unit spacing, excludes Lewis &
Clark Three Forks potential
Clark Three Forks potential

4
The
Bakken Advantage
Total enterprise
value - Proved PV10 =
Bakken acreage value
/ Net Bakken acres = Bakken value per acre
|
Small-cap
Bakken Players
|
||
|
|
Bakken
value
per
acre
|
Q3
2009
Boepd
|
|
Company
A
|
$
3,149
|
144
|
|
Company
B
|
$
4,498
|
5,200
|
|
Company
C
|
$
6,768
|
963
|
|
Company
D
|
$
6,839
|
751
|
|
Company
E
|
$15,244
|
5,348
|
|
|
|
|
|
AXAS
|
$
1,613
|
4,430
|
AXAS
utilizing mid-year proved reserves on a typical bank
price deck
price deck
Source:
Company filings with the SEC

5
Peer
Group Analysis
Source:
Company filings with the SEC and market capitalization on December 30,
2009
E&P
analysis includes market capitalization < $1B (AEZ, AREX, ATPG, AXAS, CFW,
CPE, CRZO, CWEI, DBLE, DNE, DPTR, END, EPM, EXXI, FXEN, GDP, GEOI, GMET,
GMXR,
GPOR, GPR, GST, GSX, KOG, MCF, MHR, MMR, NGAS, NOG, PETD, PHX, PINN, PQ, PVA, RAME, REXX, SFY, SGY, TMR, VQ, WRES)
GPOR, GPR, GST, GSX, KOG, MCF, MHR, MMR, NGAS, NOG, PETD, PHX, PINN, PQ, PVA, RAME, REXX, SFY, SGY, TMR, VQ, WRES)
Mean
equates to an AXAS share price of:
$19.42
Mean
equates to an AXAS share price of:
$5.56
48%
undervalued compared to E&P in analysis
6
Peer
Group Analysis
65%
under average of E&P in analysis
In-line
with average of E&P in analysis
In-line
with average of E&P in analysis
Source:
Company filings with the SEC
E&P
analysis includes market capitalization < $1B (AEZ, AREX, ATPG, AXAS, CFW,
CPE, CRZO, CWEI, DBLE, DNE, DPTR, END, EPM, EXXI, FXEN, GDP, GEOI, GMET,
GMXR,
GPOR, GPR, GST, GSX, KOG, MCF, MHR, MMR, NGAS, NOG, PETD, PHX, PINN, PQ, PVA, RAME, REXX, SFY, SGY, TMR, VQ, WRES)
GPOR, GPR, GST, GSX, KOG, MCF, MHR, MMR, NGAS, NOG, PETD, PHX, PINN, PQ, PVA, RAME, REXX, SFY, SGY, TMR, VQ, WRES)

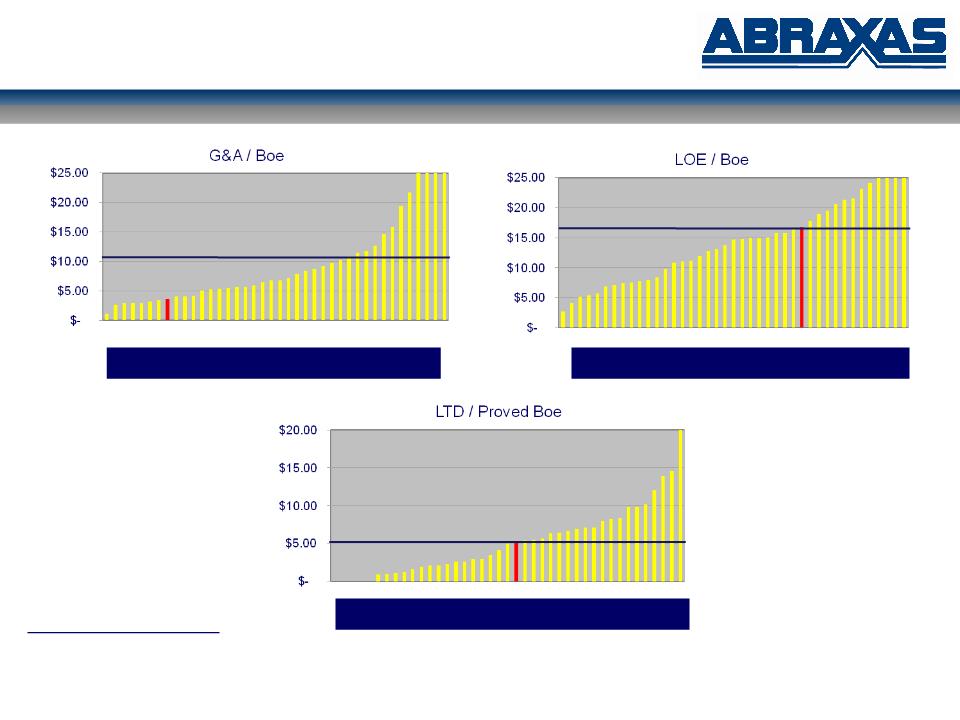
7
Special
Situation
§ Exciting upside (not
just the Bakken)
§ Undervalued
§ Why ?
§ 26 months in
SEC
§ Complicated
financials
§ Analyst &
investors don’t relish homework
§ Solution
!
§ Merger closed -
October 5, 2009
§ Tell the
story
§ Straight forward
financials (except MTM on commodity swaps)

8
Background
Ø Abraxas Petroleum
Corporation
§ Founded in
1977
§ NASDAQ:
AXAS
Ø 2006 - 2008:
Upstream MLPs were reincarnated
§ Attractive cost of
capital - yields < 10%
Ø Abraxas Energy was
formed in May 2007 as an upstream master limited
partnership (“MLP”) to produce, develop and acquire oil and gas properties
partnership (“MLP”) to produce, develop and acquire oil and gas properties
§ AXAS contributed
properties to MLP
– Sold 53% to
institutional investors ($100 million private placement)
§ Lehman Brothers /
Citigroup / Merrill Lynch
§ Top-tick market: 9%
yield
– AXAS retained 47% of
MLP
– AXAS owns 100% of
general partner, which manages MLP
§ MLP required to “go
public”

9
IPO
Timeline
2007
July 2007 - MLP
filed initial registration statement (S-1) for IPO
November 2007 -
cleared by the SEC (S-1/A #4)
November
2007 - won bid on large property acquisition from St. Mary - financed with
senior
bank debt & 2nd lien bridge (extension from private investors)
bank debt & 2nd lien bridge (extension from private investors)
2008
July 2008 - cleared
by the SEC (S-1/A #7)
July 2008 - lead
underwriter walked
September 2008 - new
underwriting syndicate in place (S-1/A #8)
September 2008 -
financial world started its collapse
(extension
from private investors)
2009
January 2009 -
maturity date of sub. debt extended to July 1
January 2009 - MLP
yields > 20% = downsize IPO, need 2nd lien
(underwriting
syndicate walks)
March 2009 - new
underwriting syndicate in place (S-1/A #9), launch 2nd lien
April 2009 - new
2nd lien terms
unacceptable / vicious circle / explore alternatives
(extension
from private investors)

10
Upstream MLP
Meltdown
Market darling
à ??
§ Last IPO - April
2008
§ 4 MLPs - suspended
distributions
§ Bank support
diminished for upstream MLPs
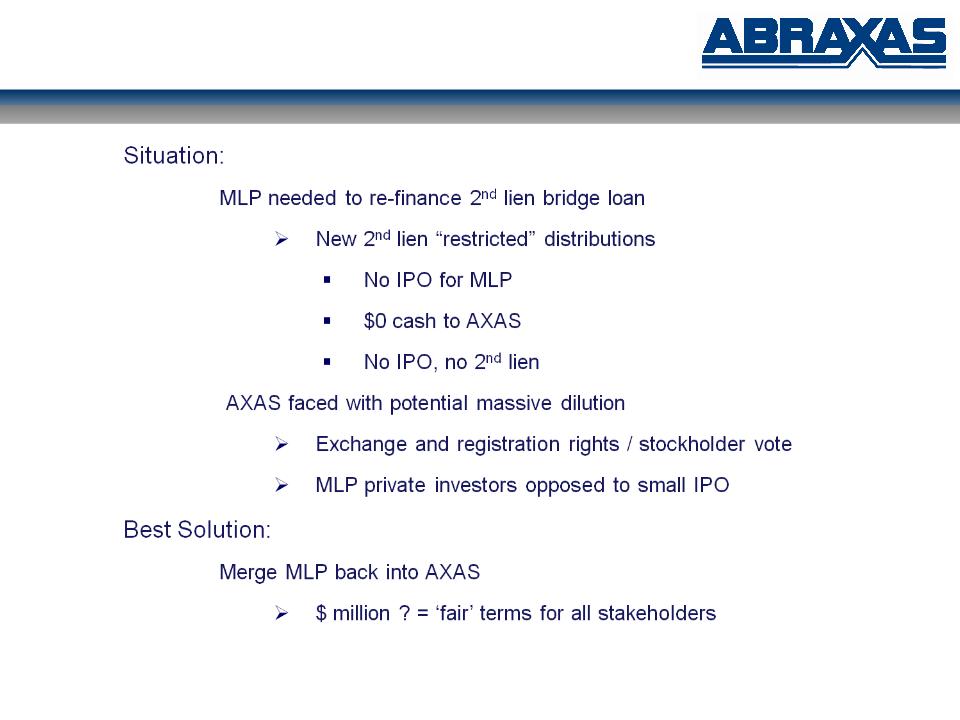
11
Alternatives

12
Merger
Events

13
New and
Improved AXAS
Abraxas
Petroleum Corporation
• High quality
assets
• Daily production of
4,430 Boe (26.6 MMcfe)
• Proved reserves of
27.9 MMBoe (167.3 Bcfe)
• Unparalleled upside
opportunities
§ 158 proved
undeveloped locations (excluding Bakken)
§ Numerous additional
identified locations
§ 85% of PDP hedged
through 2012 and 70% in 2013
§ $74.96 per barrel
and $6.38 per MMbtu
• NASDAQ:
AXAS
• Fully diluted shares
outstanding: ~76 million
§ ~50%
institutional
§ ~10%
insider
• Current average
trading volume: ~470,000 shares per day
• Total long-term
debt: ~$145
million

14
Overview of
Properties

15
Property
Overview
Ø Predictable,
long-lived production
§ R/P
ratio of 16.9 years (PD of 9.3
years)
§ Conventional and
unconventional reservoirs
Ø 1,811 gross (429
net) producing wells: average working interest 24%
§ ~690
gross (250 net) wells/units comprise top 90% by PV
Ø Substantial
inventory: 158 proved
undeveloped locations (plus Bakken)
§ Numerous additional
identified locations
Ø 307,310 gross
(160,141 net) acres
§ No
material lease expiry issues or drilling commitments
Ø Operational control
- over 80%
of PV10
§ Over 30 years of
operational history
§ Efficient, low-cost
operator
§ Long history of
drilling success

16
High
Quality Assets
ND
SD
MT
WY
CO
UT
TX
OK
AR
LA
Proved
Reserves (MMBoe): 27.9
-
Proved Developed: 55%
-
Gas/Oil %: 71/29%
-
Operated: 83%
Abraxas
Petroleum Corporation
Net
proved reserves as of June 1, 2009
Bakken
Shale
Play
Haynesville
Shale
Play
Central
Anadarko
Cana
- Woodford
Shale
Play
Barnett
/ Woodford
Shale
Play
Wolfberry
Trend
Rocky
Mountain
Mid-Continent
Permian
Basin
Gulf
Coast
Eagle
Ford Shale Play
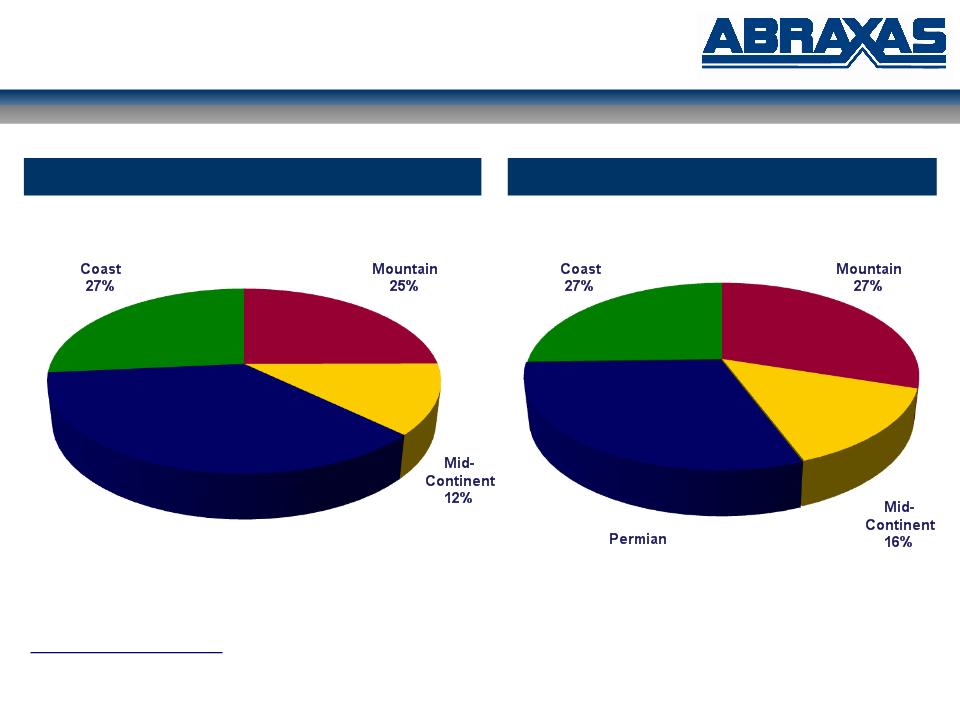
17
Reserve
/ Production Summary
Proved
Reserves - 27.9 MMBoe
Production
- 4,430 Boepd
Net
proved reserves as of June 1, 2009
Daily
net production for the quarter ended September 30, 2009
Rocky
Permian
Basin
36%
Gulf
Rocky
Basin
30%
Gulf

18
Production
Profile
Net
proved reserves as of June 1, 2009
Next
5 years - 9%
Thereafter
- 8%
Projected
Annual PDP Decline Rate

19
ND
SD
MT
WY
CO
UT
TX
OK
LA
Unparalleled Upside
Potential
Rocky
Mountain
Mid-Continent
Permian
Basin
Gulf
Coast
Medicine
Pole Hills Unit
Bowman
Co., ND
2
PUD
Red
River B: 9,350’
Operator:
Continental
Cow
Hollow Field
Lincoln
Co., WY
32
PUD
Frontier:
11,000’
Operator:
Kerr-McGee
Pittsburg
County CBM
Pittsburg
Co., OK
53
PUD
Hartshorne
Coal: 3,000’
Operator:
Chesapeake / Abraxas
Edwards
Trend
DeWitt
/ Lavaca Co., TX
10
PUD (4 PDNP)
Edwards:
13,500’
Operator:
Abraxas
Portilla
Field
San
Patricio Co., TX
3
PUD (2 PDNP)
Frio:
7,000’
Vicksburg: 9,000’
Vicksburg: 9,000’
Operator:
Abraxas
Oates
SW
Pecos
Co., TX
5
PUD
Devonian:
14,000’
Montoya: 16,000’
Montoya: 16,000’
Operator:
Abraxas
ROC
Complex
Ward
Co., TX
7
PUD
Devonian:
13,000’
Montoya:
14,000’
Operator:
Abraxas
Bakken
Shale
Play
Haynesville
Shale
Play
Central
Anadarko
Cana
- Woodford
Shale
Play
Wolfberry
Trend
Natural
Buttes Field
(Chapita
Wells Unit)
Uintah
Co., UT
20
PUD
Wasatch:
7,000’
Operator:
EOG Resources
Roosevelt
Field
Billings
Co., ND
4
PUD
Nisku:
10,000’
Operator:
Abraxas/Summit
North
Fork Field
McKenzie
Co., ND
6
PUD
Bakken:
10,000’
Red
River: 14,000’
Operator:
Abraxas
Comertown
South Field
Sheridan
Co., MT
2
PUD
Red
River: 11,000’
Operator:
Abraxas
Eastern
Shelf
Coke
Co., TX
3
PUD
Strawn
6,700’
Operator:
Abraxas
Beulah
Coleman
Midland
Co., TX
5
PUD
Devonian:
11,000’
Operator:
Abraxas
Barnett
/ Woodford
Shale
Play
Eagle
Ford
Shale
Play

20
Near-Term Drilling
Catalysts
|
AXAS
OPERATED:
|
OUTSIDE
OPERATED:
|
|
Portilla,
South Texas
• 2 vertical
wells
• 9,000’
Frio
• Q1
2010
• AXAS 100%
WI
|
Bakken/Three
Forks, North Dakota
• BTA
operated
• Completing
• AXAS 10%
WI
|
|
Normanna,
South Texas
• 10,000’
Wilcox
• Q1
2010
• AXAS 20%/40%
WI
|
Granite Wash,
Texas Panhandle
• 2
wells
• Cimarex /
Mewbourne operated
• Drilling
• AXAS <1-8%
WI
|
|
Spires Ranch,
West Texas
• 7,000’
Ellenburger
• Testing
• AXAS 100%
WI
|
|
Non-op
wells gather information
21
Business
Plan
§ Closed merger -
October 5th
§ Allocate portion of
2010 CapEx to Bakken
§ Investigate Bakken
acceleration
§ Financial
partner
§ Industry
farmout
§ Non-core asset
sales
§ Pay down
debt
§ 50/50 oil/gas
production mix by end of 2010
§ Awareness of NOL
preservation
§ Increase Eagle Ford
position
§ Principally in oil
leg
§ Increase investor
interest
§ Increase analyst
coverage

22
NASDAQ:
AXAS

23
Appendix
24
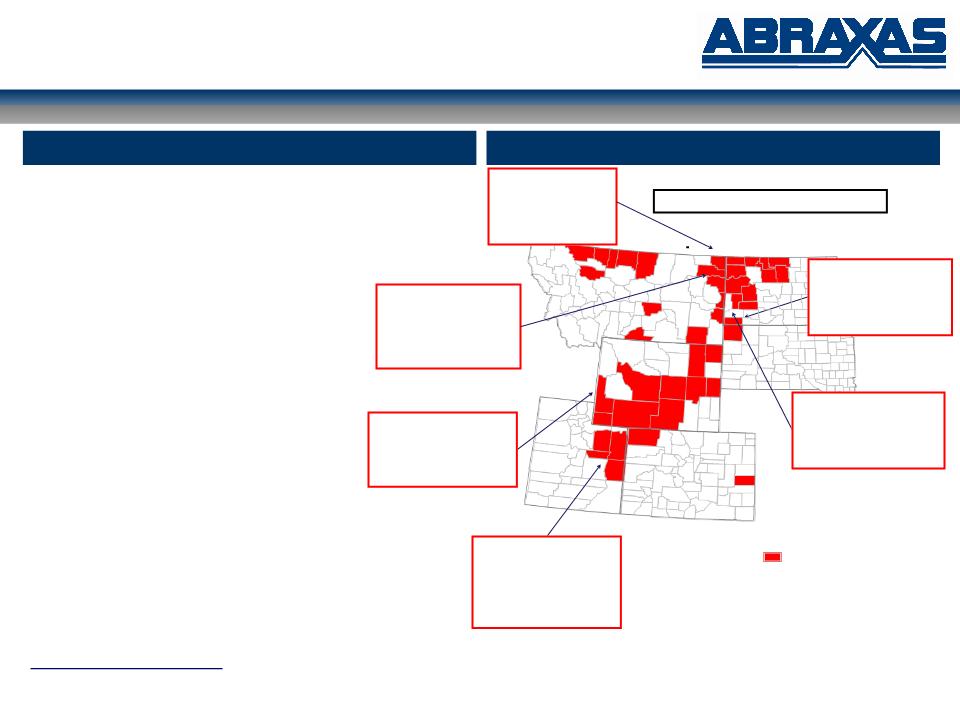
Rocky
Mountain
Ø 7.0 MMBoe of proved
reserves
Ø 75% proved
developed
Ø 75% crude
oil
Ø 1,175 Boepd of
production
Ø 15.7 R/P
ratio
Ø 894 gross (110 net)
producing wells
Ø 67 PUD
locations
Ø 97,279 net
acres
Ø Primary producing
basins include:
§ Williston Basin (MT
and ND)
§ Powder River &
Green River Basins (WY)
§ Unita Basin
(UT)
Ø Bakken / Three Forks
- HBP
Rocky
Mountain
ND
SD
MT
WY
CO
UT
Medicine
Pole Hills Unit
Bowman
Co., ND
2
PUD
Red
River B: 9,350’
Operator:
Continental
Natural
Buttes Field
(Chapita
Wells Unit)
Uintah
Co., UT
20
PUD
Wasatch:
7,000’
Operator:
EOG Resources
Cow
Hollow Field
Lincoln
Co., WY
32
PUD
Frontier:
11,000’
Operator:
Kerr-McGee
Bakken
Shale Play / Three Forks / Sanish
Area
of Operations
Overview
Net
proved reserves as of June 1, 2009
Daily
net production for the quarter ended September 30, 2009
Roosevelt
Field
Billings
Co., ND
4
PUD
Nisku:
10,000’
Operator:
Abraxas/Summit
North
Fork Field
McKenzie
Co., ND
6
PUD
Bakken:
10,000’
Red
River: 14,000’
Operator:
Abraxas
Comertown
South Field
Sheridan
Co., MT
2
PUD
Red
River: 11,000’
Operator:
Abraxas

25
Mid-Continent
Ø 3.4 MMBoe of proved
reserves
Ø 73% proved
developed
Ø 85% natural
gas
Ø 711 Boepd of
production
Ø 13.0 R/P
ratio
Ø 602 gross (103 net)
producing wells
Ø 53 PUD
locations
Ø 22,937 net
acres
Ø Primary producing
basins include:
§ Anadarko Basin
(Western OK)
§ Arkoma Basin
(Eastern OK)
§ ARK-LA-TEX
Ø Cana Shale (Cimarex,
Devon, Chesapeake) - HBP
Ø Haynesville Shale -
HBP
TX
KS
OK
AR
LA
Haynesville
Shale
Play
Central
Anadarko
Cana
- Woodford
Shale
Play
Pittsburg
County CBM
Pittsburg
Co., OK
53
PUD
Hartshorne
Coal: 3,000’
Operator:
Chesapeake / AXAS
Area
of Operations
Overview
Net
proved reserves as of June 1, 2009
Daily
net production for the quarter ended September 30, 2009
26
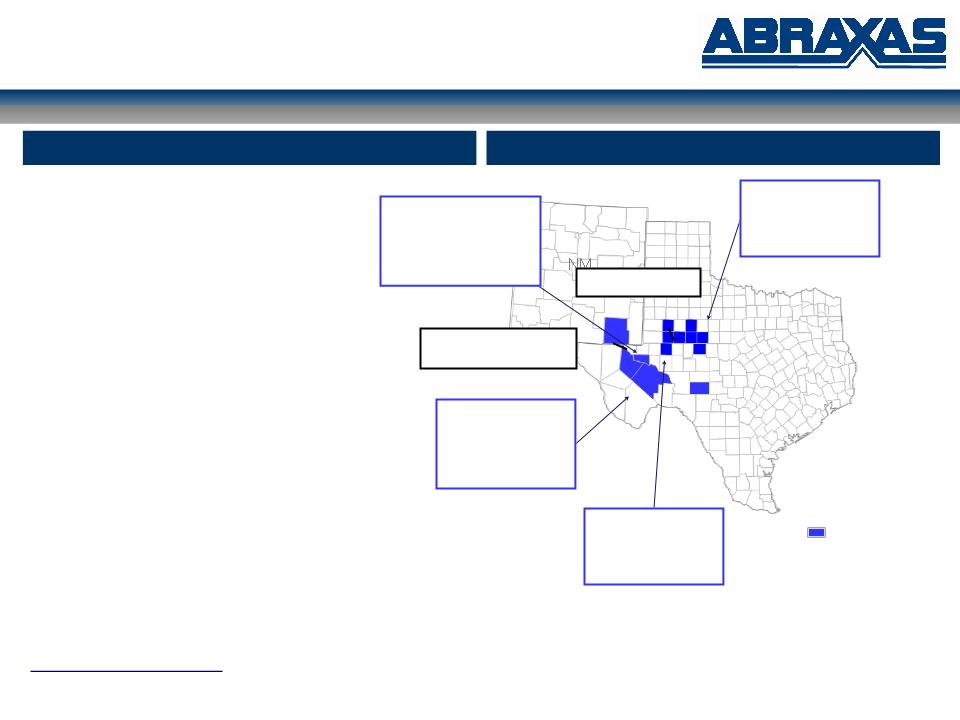
Permian
Basin
Permian
Basin
Ø 10.1 Bcfe of proved
reserves
Ø 39% proved
developed
Ø 83% natural
gas
Ø 1,330 Boepd of
production
Ø 19.7 R/P
ratio
Ø 236 gross (161 net)
producing wells
Ø 30 PUD
locations
Ø 31,237 net
acres
Ø Primary producing
sub-basins:
§ Delaware
Basin
§ Eastern
Shelf
Ø Barnett / Woodford
Shale - fee minerals
TX
Oates
SW
Pecos
Co., TX
5
PUD
Devonian:
14,000’
Montoya: 16,000’
Montoya: 16,000’
Operator:
Abraxas
ROC
Complex
Ward
Co., TX
7
PUD
Devonian:
13,000’
Montoya:
14,000’
Operator:
Abraxas
Area
of Operations
Overview
Beulah
Coleman
Midland
Co., TX
5
PUD
Devonian: 11,500’
Operator: Abraxas
Operator: Abraxas
Millican
Reef Unit
Coke
Co., TX
3
PUD
Strawn:
6,700’
Operator: Abraxas
Operator: Abraxas
Barnett
/ Woodford
Shale
Play
Wolfberry
Trend
Net
proved reserves as of June 1, 2009
Daily
net production for the quarter ended September 30, 2009

27
Gulf
Coast
Gulf
Coast
Ø 7.4 Bcfe of proved
reserves
Ø 49% proved
developed
Ø 92% natural
gas
Ø 1,214 Boepd of
production
Ø 17.2 R/P
ratio
Ø 79 gross (55 net)
producing wells
Ø 13 PUD
locations
Ø 8,688 net
acres
Ø Primary producing
sub-basin:
§ Onshore Gulf
Coast
Ø Eagle Ford Shale -
HBP
§ Currently leasing
addtional acreage
TX
LA
AL
MS
Portilla
Field
San
Patricio Co., TX
3
PUD (2 PDNP)
Frio:
7,000’
Vicksburg: 9,000’
Vicksburg: 9,000’
Operator:
Abraxas
Edwards
Trend
DeWitt
/ Lavaca Co., TX
10
PUD (4 PDNP)
Edwards:
13,500’
Operator:
Abraxas
Area
of Operations
Overview
Eagle
Ford
Shale
Play
Net
proved reserves as of June 1, 2009
Daily
net production for the quarter ended September 30, 2009

28
2008-2009 OBO
Drilling Activity
23
wells drilled in 2008
7
wells drilled in 2009
Chapita
Wells Unit
Uintah
County, UT
Operator:
EOG Resources
Average
IP: 1.1 MMcfepd
WI:
1%
7
wells drilled in 2008
Medicine
Pole Hills West Unit
Bowman
County, ND
3
wells drilled in 2008
1
well drilled in 2009
Mansfield
Prospect
Scott
County, AR
Operator:
XTO Energy
Average
IP: 2.2 MMcfepd
2
wells drilled in 2008
1
well drilled in 2009
Bear
Creek Field
Bienville
Parish, LA
Operator:
El Paso
Average
IP: 2.3 MMcfepd
WI:
2%
1
well drilled in 2008
Red
Oak Prospect
Latimer
County, OK
Operator:
Unit Petroleum
IP:
2.1 MMcfepd
WI:
12%
2
wells drilled in 2008
Cow
Creek / Moxa Arch
Lincoln
County, WY
Operator:
Kerr McGee
Average
IP: 1.2 MMcfepd
WI:
1%
1
well drilled in 2008
2
wells drilled in 2009
Sawyer
Field
Sutton
County, TX
Operator:
Highmount
Average
IP: 0.2 MMcfepd
WI:
4%
2
wells drilled in 2009
Bakken
/ Three Forks
McKenzie
/ Divide Counties, ND
Operator:
Continental Resources / BTA
IP:
760 Boepd / completing
WI:
1-10%
3
wells drilled in 2009
Granite
Wash
Hemphill
County, TX
Operator:
Cimarex /
Mewbourne
Mewbourne
WI:
1-8%

29
NASDAQ:
AXAS