Attached files
| file | filename |
|---|---|
| 10-K - FORM 10-K - MACC PEI LIQUIDATING TRUST | form10k_122809.htm |
| EX-10.4 - EXHIBIT 10.4 - MACC PEI LIQUIDATING TRUST | form10kexh14_122809.htm |
| EX-32.1 - EXHIBIT 32.1 - MACC PEI LIQUIDATING TRUST | form10kexh321_122809.htm |
| EX-31.1 - EXHIBIT 31.1 - MACC PEI LIQUIDATING TRUST | form10kexh311_122809.htm |
| EX-31.2 - EXHIBIT 31.2 - MACC PEI LIQUIDATING TRUST | form10kexh312_122809.htm |
| EX-32.2 - EXHIBIT 32.2 - MACC PEI LIQUIDATING TRUST | form10kexh322_122809.htm |
Exhibit
13
2009
Annual Report
|
|
 |
|
Annual
Report
September
30, 2009
|
TO OUR SHAREHOLDERS
Fiscal
year 2009 was a difficult year for MACC. The general economic
conditions and disruptions in the capital markets in particular decreased
liquidity, pressured global asset prices, made credit difficult to obtain, and
suppressed economic activity. The adverse environment we believe
affected MACC’s ability to liquidate portfolio assets at reasonable
valuations. Further, many of the companies in which MACC has
investments were also susceptible to the adverse environment causing their
performance to suffer. In this difficult environment, the company has
wrestled with the question of how to best maximize shareholder value and have
been actively reviewing the current course of the company and the various
options before it.
Part of
the stated plan going into fiscal year 2009 was to make no new investments in
the legacy investment strategy, continue to harvest legacy portfolio
investments, reduce expenses, and repay outstanding debt. During the
year, three legacy portfolio assets were sold and MACC collected on various
installment sales for a realized net gain of $146,807. The company
reduced operating expenses by 17%, and reduced outstanding debt from $4,750,405
to $4,618,659 as of September 30, 2008 and September 30, 2009,
respectively. This relatively good news however was tempered by
overall net realized and unrealized losses on portfolio assets of
$2,048,783. The write-downs were the result of negative economic and
credit conditions affecting the performance of MACC’s underlying portfolio
companies as well as the compression of multiples and lack of credit
availability.
In 2008,
MACC made the strategic decision to change investment advisers and pursue a new
investment strategy. Effective April 29, 2008 Eudaimonia Asset
Management, LLC (“EAM”) was appointed to serve as the investment adviser to
MACC. Concurrent with the hiring of EAM, InvestAmerica Investments
Advisors, Inc. was kept on as a sub-adviser to continue the process of
harvesting the legacy portfolio while maximizing its value.
EAM was
appointed the investment adviser based on the experience of their investment
professionals in the small and micro cap investment universe and because we
believe their strategy will offer a strong opportunity for capital appreciation
while increasing the liquidity profile of MACC’s portfolio. EAM’s
investment strategy for MACC was to seek capital appreciation by making direct
equity investments in public companies that are benefiting from positive
fundamental change. These investments were to be made in the form of
private placements and registered-direct equity offerings. Further,
the strategy would take advantage of recent regulatory changes that
significantly expand the types of assets eligible for BDC investment to include
domestic operating companies which are listed on a national securities exchange
having a market capitalization of less than $250 million.
With the
difficulties of raising new money in the fiscal year 2009, the new strategy
under EAM was put on hold. There simply was no money available to
execute. As we look forward into 2010, we believe the EAM strategy
provides us the best opportunity to maximize shareholder value. Disruptions in
credit and equity markets worldwide have created attractive valuations for
long-term investors, as well as increased the need for equity capital for small
and micro cap companies to grow, as normal avenues of capital formation have
become less available or non-existent. We are unaware of any other
BDC employing a similar strategy and believe the new investment strategy
provides an investment opportunity previously unavailable to most
investors. We also expect that the increased liquidity profile and
transparency of the new strategy portfolio assets will lead to a closer
relationship between MACC’s stock price and its underlying net asset
value. Currently, MACC is continuing to trade at a significant
discount to its book value.
[Missing Graphic Reference]
For
fiscal 2010, our plan is to continue to harvest legacy portfolio assets and to
continue the repayment of our outstanding debt. We also feel that it
will be important for MACC to raise new equity capital in the coming year in
order to execute on the new portfolio strategy. The process was begun
by commencing the registration of a rights offering which was approved by
shareholder vote on April 28, 2008. Looking into 2010 we expect to
commence the rights offering to raise funds to begin the new
strategy. Further, we believe that future capital raises will be
necessary and we are exploring those options. We expect that the
attractiveness of the new investment strategy, combined with the value
proposition of MACC’s current portfolio, will make additional capital raises
possible in the coming year. In light of challenging market
conditions, however, the Board will continue to review alternatives, including
seeking shareholder approval to liquidate, should additional capital raising
prospects prove unlikely or inadequate to effectively execute on the new
strategy.
 |
 |
|||
|
Michael W.
Dunn,
Chairman
of the Board
|
Travis
Prentice
President
and CEO
|
1
|
Contents
|
|
|
1
|
LETTER
TO SHAREHOLDERS; CORPORATE PROFILE
|
|
4
|
FINANCIAL
HIGHLIGHTS
|
|
6
|
SELECTED
FINANCIAL DATA
|
|
6
|
MANAGEMENT’S
DISCUSSION AND ANALYSIS OF FINANCIAL CONDITION AND RESULTS OF
OPERATIONS
|
|
17
|
REPORT
OF INDEPENDENT REGISTERED PUBLIC ACCOUNTING FIRM
|
|
37
|
SHAREHOLDER
INFORMATION
|
|
39
|
CORPORATE
INFORMATION
|
2
CORPORATE PROFILE
MACC PRIVATE EQUITIES INC.
MACC
Private Equities Inc. (Nasdaq Capital Market: MACC), a Delaware corporation, has
elected to be treated as a business development company (“BDC”) under the
Investment Company Act of 1940 (“1940
Act”). MACC’s primary goal has been to create long-term
appreciation of shareholder value based upon the successful management of later
stage venture capital activities.
MACC
generally has invested from $1,000,000 up to $3,800,000 in growth and later
stage manufacturing and service businesses with annual sales typically from
$10,000,000 to $100,000,000. These growth and buyout investments have
been made in the form of subordinated debt or preferred stock with warrants or
common stock. Since 1980, MACC has provided equity financing of over
$90,000,000 to more than 120 companies and has played a significant role in the
syndication of equity funding for later stage, middle market growth and buyout
financings. MACC, however, has not made any such investments for over
5 years and has been actively seeking to liquidate its legacy
portfolio.
Consistent
with shareholder approval of its new investment adviser, in April 2008, MACC
determined to change its investment focus to capital
appreciation. MACC intends to implement this strategy once new
capital is raised. Presently, it is reviewing the prudence of
conducting the rights offering approved by shareholders in April 2008 as well as
conducting future offerings of its common stock if the Board of Directors
determines market conditions favor such an offering.
EUDAIMONIA ASSET MANAGEMENT, LLC
Eudaimonia
Asset Management, LLC, a California limited liability company (“EAM” or the “Investment Adviser”),
with its executive offices at 580 Second Street, Suite 102, Encinitas,
California 92024, is the investment adviser to MACC under an Investment Advisory
Agreement dated April 29, 2008 (the “Advisory
Agreement”). EAM is registered as an investment adviser
with the Department of Corporations of the State of California. EAM
currently manages approximately $57 million of other assets under strategies
similar to that to be employed for all new investments made by MACC after the
effectiveness of the Advisory Agreement (the “New
Portfolio”). EAM’s sole focus is managing small- and micro-cap
growth investments using a behaviorally-based investment philosophy and
disciplined process. EAM’s three investment principals have
combined over 30 years of investment management experience.
INVESTAMERICA INVESTMENT ADVISORS, INC.
InvestAmerica
Investment Advisors, Inc. an Iowa Corporation (“InvestAmerica” or the
“Subadviser”),
has been retained by MACC and EAM to serve as a subadviser to MACC under a
Subadvisory Agreement dated April 29, 2008 among MACC, EAM and InvestAmerica
(the “Subadvisory
Agreement”) to manage MACC’s portfolio of investments in existence prior
to the effective date of the Advisory Agreement (the “Existing
Portfolio”). The Subadviser is affiliated with a group of
venture capital management companies (the “Investamerica
Group”), the first of which was organized in 1985. The
InvestAmerica Group manages more than $60 million in assets, including committed
capital, and the three InvestAmerica Group principals combined have over 80
years of venture capital fund experience. Prior to the effectiveness
of the Advisory and Subadvisory Agreements, InvestAmerica served as the
investment adviser for both MACC and MorAm.
3
|
FINANCIAL HIGHLIGHTS
|
[Dollars
in Thousands Except Per Share Data]
|
|||||
|
BALANCES
AT YEAR END SEPTEMBER 30
|
2009
|
2008
|
||||
|
Total
Assets
|
$
|
12,517
|
15,314
|
|||
|
Total
Long Term Debt
|
4,619
|
4,750
|
||||
|
Total
Net Assets
|
7,809
|
10,435
|
||||
|
OPERATIONS FOR THE YEAR
|
||||||
|
Total
Investment Income
|
$
|
587
|
956
|
|||
|
Investment
Expense, Net
|
(577)
|
(448)
|
||||
|
Net
Realized (Loss) Gain on Investments
|
(2,444)
|
687
|
||||
|
Net
Change in Unrealized Depreciation/
Appreciation on
Investments
|
395
|
(1,295)
|
||||
|
Realized
loss on other assets
|
---
|
(30)
|
||||
|
Net
Change in Net Assets from Operations
|
(2,626)
|
(1,086)
|
||||
|
PER SHARE DATA
|
||||||
|
Net
Assets Per Share
|
$
|
3.17
|
4.23
|
|||
FINANCIAL HISTORY
|
2009
|
2008
|
2007
|
2006
|
2005
|
|||||||
|
Total
Assets
|
$ 12,516,519
|
15,313,877
|
18,008,787
|
22,830,055
|
31,336,214
|
||||||
|
Total
Assets decreased
by
$2,797,358, or 18%,
in
fiscal 2009.
|
|||||||||||
|
Total
Long Term Debt
|
$ 4,618,659
|
4,750,405
|
6,108,373
|
10,790,000
|
16,790,000
|
||||||
|
Total
Long Term Debt
decreased
by $131,746, or
3%,
in fiscal 2009.
|
|||||||||||
|
Net
Asset Value Per Share
|
$ 3.17
|
4.23
|
4.67
|
4.71
|
5.54
|
||||||
|
Year
end Net Asset Value
Per
Share decreased by
$1.06,
or 25%, as of the
end
of fiscal 2009.
|
|||||||||||
|
Market
Bid Price Per Share
|
$ 0.80
|
1.36
|
2.45
|
1.78
|
2.57
|
||||||
|
Year
end Market Bid Price
Per
Share decreased by
$0.56,
or 41%, as of the
end
of fiscal 2009.
|
|||||||||||
|
Stock
Price as a Percentage of Net Asset Value Per Share
|
25.2%
|
32.2%
|
52.5%
|
37.8%
|
46.4%
|
||||||
|
Stock
Price as a Percentage of
Net
Asset Value Per Share
decreased
by 22% as of the
end
of fiscal 2009.
|
|||||||||||
|
Annual
Capital Invested
|
$ 139,586
|
52,000
|
65,000
|
333,325
|
781,611
|
||||||
|
Annual
capital invested
increased
by $87,586
or
168%, in fiscal 2009.
MACC
currently is doing
only
follow-on investing.
|
|||||||||||
|
Investment
Income
(Expense),
Net
|
($576,810)
|
(447,791)
|
(786,487)
|
(1,171,152)
|
(1,855,902)
|
||||||
|
Investment
Expense,
Net
increased by $129,019, or 29%, in fiscal 2009
|
4
FINANCIAL
REPORT
|
CONTENTS
|
||
|
6
|
SELECTED FINANCIAL DATA
|
|
|
6
|
MANAGEMENT’S DISCUSSION AND ANALYSIS
OF
FINANCIAL CONDITION AND RESULTS OF OPERATIONS
|
|
|
17
|
REPORT OF INDEPENDENT REGISTERED PUBLIC ACCOUNTING FIRM
|
|
|
37
|
SHAREHOLDER INFORMATION
|
|
|
39
|
Corporate
Information
|
5
SELECTED FINANCIAL DATA
FOR THE FISCAL YEARS ENDING SEPTEMBER 30
|
2009
|
2008
|
2007
|
2006
|
2005
|
||||||
|
Investment
expense, net
|
$
|
(576,810)
|
(447,791)
|
(786,487)
|
(1,171,152)
|
(1,855,902)
|
||||
|
Net
realized (loss)gain on investments
|
(2,444,130)
|
687,269
|
1,351,456
|
3,645
|
3,672,664
|
|||||
|
Net
change in unrealized depreciation/ appreciation
on
investments
|
395,347
|
(1,294,629)
|
(662,393)
|
(879,234)
|
771,576
|
|||||
|
Realized
loss on other assets
|
---
|
(30,678)
|
---
|
---
|
---
|
|||||
|
Net
change in net assets from operations
|
$
|
(2,625,593))
|
(1,085,829)
|
(97,424)
|
(2,046,741)
|
2,588,338
|
||||
|
Net
change in net assets from operations per common share
|
(1.061)
|
(0.441)
|
(0.041)
|
(0.831)
|
1.051
|
|||||
|
Total
assets
|
$
|
12,516,519
|
15,313,877
|
18,008,787
|
22,830,055
|
31,336,214
|
||||
|
Total
long term debt
|
$
|
4,618,659
|
4,750,405
|
6,108,373
|
10,790,000
|
16,790,000
|
1
Computed using 2,464,621 shares outstanding at September 30, 2009,
September 30, 2008, September 30, 2007, September 30, 2006 and September 30,
2005.
MANAGEMENT’S DISCUSSION AND ANALYSIS OF
FINANCIAL CONDITION AND RESULTS OF OPERATIONS
This
Annual Report contains certain forward-looking statements within the meaning of
the Private Securities Litigation Reform Act of 1995 (the “1995
Act”). Such statements are made in good faith by MACC pursuant
to the safe-harbor provisions of the 1995 Act, and are identified as including
terms such as “may,” “will,” “should,” “expects,” “anticipates,” “estimates,”
“plans,” or similar language. The
forward-looking statements contained in this Annual Report are excluded from the
safe harbor protection provided by Section 27A of the Securities Act of 1933, as
amended (the “1933
Act”) and Section 21E of the Securities Exchange Act of 1934, as amended
(the “Exchange
Act”). MACC has identified herein important factors that
could cause actual results to differ materially from those contained in any
forward-looking statement made by or on behalf of MACC, including, without
limitation, the high risk nature of MACC’s portfolio investments, the effects of
general economic conditions on MACC’s portfolio companies and MACC’s ability to
obtain future funding, changes in prevailing market interest rates, and
contractions in the markets for corporate acquisitions and initial public
offerings. MACC further cautions that such factors are not exhaustive
or exclusive. MACC does not undertake to update any forward-looking
statement which may be made from time to time by or on behalf of
MACC.
Overview
and Looking Ahead
Fiscal
year 2009 was a difficult year for the capital markets and for
MACC. MACC’s stated plan for fiscal year 2009 was to make no
new investments in its legacy investment strategy, continue to harvest the value
of the investments within the Existing Portfolio, repay its outstanding debt,
execute a rights offering and begin making investments in the new portfolio
strategy under EAM. Severe disruptions in the capital markets,
however, during the 2008 and the first half of the year made the execution of
MACC’s stated plan difficult. Falling global assets prices and
deteriorating economic and credit conditions made the prospect of raising new
capital to begin executing the new portfolio strategy
distant. Although three portfolio investments were sold during the
year, net proceeds were not adequate to provide sufficient capital to begin
EAM’s investment strategy. In addition portfolio assets were written
down to reflect the impact the economic conditions were having on portfolio
companies.
MACC also
experienced pressure on its operating cashflow in 2009 as income from existing
portfolio assets were insufficient to cover operating
expenses. Proceeds from portfolio sales were applied to outstanding
debt and toward operating cashflow needs. In April and May of 2009,
MACC’s investment advisor, EAM, voluntarily reduced its management fee from 2%
to 1% in recognition of the fact that the new portfolio strategy had been put on
hold and to help alleviate MACC’s cashflow difficulties.
6
MANAGEMENT’S
DISCUSSION AND ANALYSIS OF
FINANCIAL CONDITION AND RESULTS OF OPERATIONS CONTINUED…
Operating
expenses have been funded primarily from the sale of portfolio companies,
dividends, interest and other distributions from MACC’s portfolio companies and
from MACC’s bank financing. MACC continues to have an ongoing need to
raise cash from portfolio sales to fund operations and pay down outstanding
debt. MACC’s note payable with Cedar Rapids Bank & Trust Company
in the amount of $4,618,659 is due and payable March, 2010. MACC will
need to either extend the due date on the current note payable or consider
additional sources of financing and additional sales of investments in order to
meet current payment and operating requirements. No assurance can be
given that MACC will be successful in its efforts to extend its current
financing arrangement or raise additional funding in the near term and
accordingly these facts raise substantial doubt about MACC’s ability to continue
as a going concern.
MACC
continues to seek additional cash through future sales of portfolio equity and
debt securities and from other financing arrangements. Absent
financing amendments to the current note payable or additional sources of
financing, current working capital and cash will not be adequate for operations
at their current levels. If such efforts are not successful, MACC may
need to liquidate its current investment portfolio, to the extent possible,
which could result in significant realized losses due to the current economic
conditions.
MACC made
the strategic decision in 2008 upon the recommendation of the Board of Directors
and subsequent shareholder approval to contract with EAM to become the new
investment adviser of MACC. EAM’s investment strategy seeks to make
direct equity investments in very small and micro-cap public companies eligible
for investment by a BDC. EAM was appointed as the investment advisor
in part because its strategy is believed to offer a strong opportunity for
capital appreciation and because of the increased liquidity profile of its
investments.
EAM and
MACC believe that recent regulatory changes that have expanded the types of
investments available to BDCs may provide significant opportunities for MACC and
its shareholders under its new investment strategy. In 2006, the
Securities Exchange Commission (the “SEC”) adopted rule
2a-46 under the 1940 Act to revise the categories of companies that are eligible
for BDC investment. Rule 2a-46 defined the term “eligible portfolio
company” to include all private domestic operating companies and those public
domestic operating companies whose securities are not listed on a national
securities exchange (“Exchange”). In
2008, the SEC amended Rule 2a-46 by further expanding the exchange-based
definition of “eligible portfolio company” to include a market capitalization
based definition. Eligible portfolio companies now include domestic
operating companies that have a class of securities listed on an Exchange and
with a market capitalization of less than $250 million. EAM and MACC
believe that this action by the SEC not only unlocks capital to an under-served
segment of the U.S. economy, but provides significant opportunities for
long-term investors within the BDC structure.
EAM and
MACC further believe that the timing of its shift in investment strategy may be
particularly fortuitous for its investors and for very small- and micro-cap
companies generally. EAM believes that current disruptions in credit
and equity markets worldwide have created attractive valuations for long-term
investors, as well as increased the need for equity capital for small- and
micro-cap companies to grow as normal avenues of capital formation have become
less available or non-existent.
EAM and
MACC also believe that the new investment strategy provides an investment
opportunity previously unavailable to most investors. We are unaware
of any BDC employing a similar strategy. Because of its unique
nature, MACC believes that its new investment strategy will offer a better
opportunity to increase its capital base by more closely aligning MACC’s stock
price with its net asset value. EAM and MACC also believe that by
increasing its capital base, MACC may become a more attractive investment
vehicle, as its larger capital base should increase the liquidity profile of its
shares. Furthermore, the structure of a BDC within this investment
framework offers greater transparency than other investment vehicles available
to investors.
During
the year the Board continued to discuss various options to maximize shareholder
value. Looking forward to 2010 MACC will look to execute on its
stated goals of 2009. Although economic, market and credit
conditions continue to be difficult, they have improved somewhat, and MACC
believes that its best opportunity to maximize shareholder value is to move
forward with harvesting legacy investments when and at appropriate prices, pay
down outstanding debt, execute the rights offering and seek shareholder approval
for future capital raises, and finally to begin executing on the new portfolio
strategy under EAM.
It will
be important for MACC to raise new equity capital in the coming year for a
number of reasons. First, MACC’s current annual carrying costs as a
public company are burdensome relative to its available capital and operating
income from Existing Portfolio assets is inadequate to fund the company’s
operating expenses. Secondly, proceeds from the sale of Existing
Portfolio assets will not be significant enough to adequately initiate the new
strategy in a reasonable time period. Currently, in accordance with
the debt agreements 80% of the proceeds from the sale of Existing Portfolio
assets are required to be applied against the outstanding note
7
payable
of $4,618,659. Further, given the nature of the current market
environment and the Existing Portfolio assets, liquidating these assets to
derive maximum value may not be possible in the near-term. Lastly,
the new portfolio strategy will be most effective when MACC has adequate assets
available to build a well-diversified portfolio of small- and micro-cap
companies. EAM and MACC feel that the attractiveness of its new
investment strategy combined with the value proposition of its current portfolio
could make it possible in the coming year to make investments in the
New Portfolio.
MACC and
EAM have initiated the process of raising additional capital by filing a
registration statement to effect a rights offering, which was approved by
shareholder vote on April 28, 2008. EAM and MACC further believe that
future capital raises will be necessary. EAM and MACC feel that the
attractiveness of its new investment strategy combined with the value of its
current portfolio could make this possible in the coming year. As
discussed below, as capital constraints improve, we intend to continue our
strategy of making conservative investments in businesses that we believe will
weather the economy and that are likely to produce attractive long-term returns
for our stockholders.
The
impact of the recession on our portfolio investments may also continue to
decrease the value of collateral securing our note payable, which could impact
our ability to borrow under our existing credit facility and to obtain future
funding. Additionally, our credit facility contains covenants
regarding the maintenance of certain minimum net worth requirements, which are
affected by the
decrease
in the value of our portfolio. Failure to meet these requirements
would result in a default which, if we are unable to obtain a waiver from our
lenders, would result in the acceleration of our repayment obligations under our
credit facility. As of September 30, 2009, we are in compliance with
all of the facility covenants.
In
addition, our note payable in the amount of $4,618,659 as of September 30, 2009
is due and payable in March, 2010. MACC will need to either extend
the due date on the current note payable or consider additional sources of
financing and additional sales of investments in order to meet current payment
and operating requirements. Accordingly, the combination of these
facts raises substantial doubt as to MACC’s ability to continue as a going
concern. No assurance can be given that MACC will be successful in
its efforts to extend its current financing arrangement or raise additional
funding in the near term and accordingly these facts also raise substantial
doubt about MACC’s ability to continue as a going concern. The
financial statements included elsewhere in this report have been prepared
assuming that MACC will successfully refinance its credit terms and continue as
a going concern.
RESULTS
OF OPERATIONS
MACC’s
primary activities in 2009 were consistent with the legacy portfolio
strategy. MACC made no new investments and focused on selling
Existing Portfolio assets while closely monitoring and reducing where possible
current expenses. Total investment income includes income from
interest and dividends. Investment expense, net represents total
investment income minus net operating expenses and income tax
expense. The main objective of portfolio company investments is to
achieve capital appreciation and realized gains in the
portfolio. These gains and losses are not included in investment
expense, net and are reported as separate line items.
Fiscal 2009,
Fiscal 2008 and Fiscal 2007
|
For
the year ended
September 30,
|
||||||||||||
|
2009
|
2008
|
2007
|
||||||||||
|
Total
investment income
|
$ | 586,989 | 955,563 | 996,627 | ||||||||
|
Total
operating expenses
|
(1,163,799 | ) | (1,403,354 | ) | (1,853,607 | ) | ||||||
|
Income
tax benefit
|
--- | --- | 70,493 | |||||||||
|
Investment
expense, net
|
(576,810 | ) | (447,791 | ) | (786,487 | ) | ||||||
|
Net
realized (loss) gain on investments
|
(2,444,130 | ) | 687,269 | 1,351,456 | ||||||||
|
Net
change in unrealized depreciation/
appreciation
on investments
|
395,347 | (1,294,629 | ) | (662,393 | ) | |||||||
|
Realized
loss on other assets
|
--- | (30,678 | ) | --- | ||||||||
|
Net
(loss) gain on investments and other assets
|
(2,048,783 | ) | (638,038 | ) | 689,063 | |||||||
|
Net
change in net assets from operations
|
$ | (2,625,593 | ) | (1,085,829 | ) | (97,424 | ) | |||||
|
Net
asset value:
|
||||||||||||
|
Beginning
of period
|
$ | 4.23 | 4.67 | 4.71 | ||||||||
|
End
of period
|
$ | 3.17 | 4.23 | 4.67 | ||||||||
8
MANAGEMENT’S DISCUSSION AND ANALYSIS OF
FINANCIAL CONDITION AND RESULTS OF OPERATIONS CONTINUED…
Total
Investment Income
During
the fiscal year ended September 30, 2009, total investment income was $586,989,
a decrease of 39% from fiscal year 2008 total investment income of
$955,563. The decrease during the current year was the net result of
a decrease in interest income of $209,156, or 35%, and a decrease in dividend
income of $167,065, or 47%. MACC attributes the decrease in interest
income primarily to the repayments of principal on debt portfolio securities and
on two debt portfolio securities which have been placed on non-accrual of
interest status during fiscal year 2009. Dividend income for fiscal
year 2009 represents dividends received on three existing portfolio companies,
two of which were distributions from limited liability companies, as compared to
dividends received on four portfolio companies, two of which were distributions
from limited liability companies, during fiscal year 2008. The timing
and amount of dividend income is difficult to predict.
During
the fiscal year ended September 30, 2008, total investment income was $955,563,
a decrease of 4% from fiscal year 2007 total investment income of
$996,627. The decrease during the fiscal year ended September 30,
2008 was the net result of a decrease in interest income of $267,021, or 31%,
and an increase in dividend income of $225,951, or 175%. MACC
attributes the decrease in interest income primarily to the repayments of
principal on debt portfolio securities. Dividend income for fiscal
year 2008 represented dividends received on three existing portfolio companies
and one previously held portfolio company, two of which were distributions from
limited liability companies, as compared to dividends received on three
portfolio companies, two of which were distributions from limited liability
companies, during fiscal year 2007. Dividend income increased in
fiscal year 2008 because the distributions from limited liability companies
during fiscal 2008 were larger than the distributions in fiscal year 2007 and
the receipt of dividends in two other portfolio companies were larger than in
fiscal year 2007.
Net
Operating Expenses
Net
operating expenses of MACC decreased by 17% in fiscal year 2009 to $1,163,799
from $1,403,354 in fiscal year 2008. The relative decrease in net
operating expenses is the net result of decreases of $104,381, or 26%, in
interest expense, $58,653, or 21%, in management fees, $69,401, or 18%, in
professional fees, and $7,120, or 2%, in other operating
expenses. Interest expense decreased due to a combination of
the decrease in the interest rate and the principal balance of the Note Payable
with Cedar Rapids Bank & Trust Company in fiscal year 2009 as compared to
fiscal year 2008. Management fees decreased due to the investment
adviser, Eudaimonia Asset Management, LLC (“EAM”), having voluntarily waived its
management fee of 1% of net assets, effective in May, for an indefinite
period. The remaining 1% of the management fee continues to be paid
to our subadviser, InvestAmerica Investment Advisors, Inc.
(“InvestAmerica”). Professional fees decreased primarily due to the
absence of legal costs in 2009 compared to 2008 where the costs were
related to changes in the investment advisory structure, the merger and
exploration of capital raising options.
Net
operating expenses of MACC decreased by 24% in fiscal year 2008 to $1,403,354
from $1,853,607 in fiscal year 2007. The relative decrease in net
operating expenses was the net result of decreases of $390,866, or 49%, in
interest expense, $49,168, or 15%, in management fees, $143,732, or 100%, in
incentive fees, and increases of $9,923, or 3%, in other expenses and $123,590,
or 45%, in professional fees. Interest expense decreased due to
a decrease in long term debt and a lower rate of interest on the debt in fiscal
year 2008 as compared to fiscal year 2007. Management fees decreased
due to a decrease in capital under management, which was partially offset by the
increase in the management fee percentage from 1.5% to 2.0% under the Advisory
Agreement. Professional fees increased in 2008 compared to 2007
primarily due to the legal expenses incurred from the change in MACC’s
investment advisor, the merger, and the exploration of capital raising
options.
Investment
Expense, Net
MACC had
investment expense, net in fiscal year 2009 of $576,810, an increase of 29% from
investment expense, net of $447,791 in fiscal year 2008. The increase
in investment expense, net is the result of the decrease in investment income
and net operating expenses described above and the decrease of interest expense
to $303,794 in fiscal year 2009 from $408,175 in fiscal year 2008.
MACC had
investment expense, net in fiscal year 2008 of $447,791, a decrease of 43% from
investment expense, net of $786,487 in fiscal year 2007. The decrease
in investment expense, net was primarily the result of the decrease in operating
expenses in 2007 as a result of decreased interest expense, management fees, and
incentive fees. The net decrease in operating expenses is more fully
described above.
9
MANAGEMENT’S
DISCUSSION
AND ANALYSIS
OF
FINANCIAL CONDITION AND RESULTS OF OPERATIONS CONTINUED…
Net
Realized Gain (Loss) on Investments
MACC
recorded a net realized loss on investments in fiscal 2009 of $2,444,130 as
compared to a net realized gain of $687,269 in fiscal year 2008. The
fiscal year 2009 net realized loss is the net result of $245,179 of realized
gains from the sale of two portfolio companies, a realized gain of $1,620
from final distributions on two portfolio companies sold in a previous fiscal
year, a realized loss of $99,992 from the sale of one portfolio company, a
realized loss of $1,923,610 on the write-off of two portfolio investments which
had been previously written down to $1 through unrealized losses, and a realized
loss of $667,327 on the partial write-off of one portfolio
company. Management does not attempt to maintain a comparable level
of realized gains quarter to quarter but instead attempts to maximize total
investment portfolio appreciation through realizing gains in the disposition of
securities. Under the Advisory Agreement, the Investment Adviser is
entitled to be paid an incentive fee, which is calculated as a percentage of the
excess of MACC’s realized gains in a particular period, over the sum of net
realized losses, unrealized depreciation, and operating losses during the same
period. As a result, the timing of realized gains, realized losses
and unrealized depreciation can have an effect on the amount of the incentive
fee payable to the Investment Adviser under the Advisory Agreement.
MACC
recorded a net realized gain on investments in fiscal 2008 of $687,269, as
compared to a net realized gain of $1,351,456 in fiscal year
2007. The fiscal year 2008 net realized gain was a net result of
$571,028 of a realized gain from the sale of one portfolio company,
$104,120 from the sale of warrants in one portfolio company, $6,628 from final
distributions on one portfolio company sold in fiscal year 2007, and the receipt
of $5,493 of escrowed funds from two previously sold portfolio
companies. Under the Advisory Agreement, the Investment Adviser is
entitled to be paid an incentive fee, which is calculated as a percentage of the
excess of MACC’s realized gains in a particular period, over the sum of net
realized losses, unrealized depreciation, and operating losses during the same
period. As a result, the timing of realized gains, realized losses
and unrealized depreciation can have an effect on the amount of the incentive
fee payable to the Investment Adviser under the Advisory Agreement.
Changes
in Unrealized Depreciation/Appreciation of Investments
MACC had
unrealized depreciation of $2,543,635 at September 30, 2009, a change of
$395,347 from the $2,938,982 of unrealized depreciation at September 30,
2008. This, along with the net realized loss of $2,444,130, resulted
in a net loss on investments for fiscal year 2009 of $2,048,783, as compared to
a net loss on investments of $607,360 for fiscal year 2008. The
fiscal year 2009 change in unrealized depreciation/appreciation is the net
effect of increases in fair value of three portfolio companies totaling
$796,398, decreases in fair value of nine portfolio companies totaling
$2,517,636, the reversal of appreciation of $200,000 in one portfolio investment
from its sale resulting in a realized gain, the reversal of appreciation of
$24,951 in one portfolio investment from its sale resulting in a realized loss,
the reversal of $1,923,608 of depreciation from the write off of two portfolio
investments resulting in a realized loss, and the reversal of $417,928
depreciation resulting from the partial write off of one portfolio investment
resulting in a realized loss.
MACC had
unrealized depreciation of $2,938,982 at September 30, 2008, a change of
$1,294,629 from the $1,644,353 of unrealized depreciation at September 30,
2007. This, along with the net realized gain of $687,269, resulted in
a net loss on investments for fiscal year 2008 of $607,360, as compared to a net
gain on investments of $689,063 for fiscal year 2007. The fiscal year
2008 change in unrealized depreciation/appreciation is the net effect of
increases in fair value of four portfolio companies totaling $1,018,289 and
decreases in fair value of nine portfolio companies totaling
$2,312,918.
Net
change in unrealized depreciation/appreciation on investments represents the
change for the period in the unrealized appreciation, net of unrealized
depreciation on MACC’s total investment portfolio. When MACC
increases the fair value of a portfolio investment above its cost, the
unrealized appreciation for the portfolio as a whole increases, and when MACC
decreases the fair value of a portfolio investment below its cost, unrealized
depreciation for the portfolio as a whole increases. See accounting
policy for determining fair value on investments below under “Determination of
Net Asset Value.” When MACC sells an appreciated portfolio investment
for a gain, unrealized appreciation for the portfolio as a whole decreases as
the gain is realized. Similarly, when MACC sells or writes off a
depreciated portfolio investment for a loss, unrealized depreciation for the
portfolio as a whole decreases as the loss is realized.
Net
Change in Net Assets from Operations
As a
result of the items described above, MACC experienced a decrease of $2,625,593
in net assets during fiscal year 2009, and the resulting net asset value per
share was $3.17 at September 30, 2009, as compared to $4.23 at September 30,
2008 and $4.67 at September 30, 2007. Management attributes these
results to the write-down of portfolio assets and the operating loss incurred
in
10
MANAGEMENT’S DISCUSSION AND ANALYSIS OF
FINANCIAL CONDITION AND RESULTS OF OPERATIONS CONTINUED…
fiscal
2009. Although MACC realized gains on two portfolio companies and had
three portfolio investments increase in value during fiscal year 2009, nine
portfolio companies required a write-down in valuation.
The
current economic challenges and restrictive credit environment may pose
significant challenges to the Existing Portfolio operating performance and the
ability to exit Existing Portfolio positions. Many factors such
as the availability of credit, continued economic struggles, volatile commodity
markets, all could have major impacts on the Existing Portfolio
performance.
FINANCIAL
CONDITION, LIQUIDITY AND CAPITAL RESOURCES
MACC
relies upon several sources to fund its operating and investment activities,
including MACC’s cash and money market accounts, and proceeds from the sale of
portfolio assets, as further described below.
As of
September 30, 2009, MACC’s cash and money market accounts totaled
$173,521. MACC has a term loan in the amount of $4,618,659 with Cedar
Rapids Bank & Trust Company. The term loan is due and
payable March 31, 2010.
Currently MACC does not have sufficient cash flows from operations to pay
current operating expenses and to repay the term loan when it is
due. MACC therefore continue to have an ongoing need to raise cash
from portfolio sales and will need to either extend the due date on the current
term loan or seek additional sources of financing in order to meet current
payment and operating requirements. To date an extension on the term
loan and additional financing has not been secured, accordingly these facts
raise substantial doubt about MACC’s ability to continue as a going
concern.
MACC continues to seek additional cash through future sales of portfolio
equity and debt securities and from other financing
arrangements. Absent financing amendments to the current note payable
or additional sources of financing, current working capital and cash will not be
adequate for operations at their current levels. If such efforts are
not successful, MACC may need to liquidate its current investment portfolio, to
the extent possible, which could result in significant realized losses due to
the current economic conditions.
The
following table shows MACC’s significant contractual obligations as of September
30, 2009:
|
Payments due by
period
|
||||||||||||||||||||
|
Contractual
Obligations
|
||||||||||||||||||||
|
Total
|
Less
than
1
Year
|
1-3
Years
|
3-5
Years
|
More
than 5 Years
|
||||||||||||||||
|
Note
Payable
|
$ | 4,618,659 | 4,618,659 | --- | --- | --- | ||||||||||||||
|
Incentive
Fees Payable
|
$ | 16,361 | 16,361 | --- | --- | --- | ||||||||||||||
Although
we believe we will be able to refinance the term loan, failure to do so or find
alternative financing could pose significant financial risks to MACC given the
relative illiquid nature of the Existing Portfolio. In addition, we
anticipate that our current cash and money market accounts will not be adequate
enough to fund our cash flow short-fall from operation during fiscal year
2010. We will need to liquidate portfolio assets to fund the
operating cash short-fall. Although management believes we will be
able to liquidate portfolio assets sufficient to provide funds for MACC to meet
its fiscal year 2010 anticipated cash requirements, there can be no assurances
that MACC’s cash flows from portfolio sales, operations or cash requirements
will be as projected.
PORTFOLIO
ACTIVITY
MACC’s
primary business had been investing in and lending to businesses through
investments in subordinated debt (generally with detachable equity warrants),
preferred stock and common stock. As noted above, MACC did not make
any new investments in fiscal year 2009. The total portfolio value of
the Existing Portfolio was $11,775,272 and $14,501,851 at September 30, 2009 and
September 30, 2008, respectively. During fiscal year 2009, MACC
invested $139,586 in two follow-on investments in an Existing Portfolio
companies. The $139,586 of investments were co-investments with
another fund managed by InvestAmerica. When it makes any
co-investment with these related funds, MACC follows certain procedures
consistent with orders of the SEC for related party co-investments to mitigate
conflict of interest issues.
11
MANAGEMENT’S DISCUSSION AND ANALYSIS OF
FINANCIAL CONDITION AND RESULTS OF OPERATIONS CONTINUED…
VALUATION
CHANGES
The
following table presents those portfolio investments held at September 30, 2009
with respect to which the valuation changed from September 30,
2008:
|
F
A I R V A L U E
|
|||||
|
PORTFOLIO COMPANY
|
SEPTEMBER 30,
2009
|
SEPTEMBER 30, 2008(1)
|
|||
|
Aviation
Manufacturing Group, LLC
|
1,618,039
|
1,642,559
|
|||
|
Detroit
Tool Metal Products Co.
|
1,371,507
|
1,693,480
|
|||
|
Feed
Management Systems, Inc.
|
2,041,136
|
2,001,495
|
|||
|
Handy
Industries, LLC
|
67,042
|
269,093
|
|||
|
Linton
Truss Corporation
|
75,036
|
190,036
|
|||
|
M.A.
Gedney Company
|
1
|
146,000
|
|||
|
Magnum
Systems, Inc.
|
1,257,278
|
1,507,278
|
|||
|
Morgan
Ohare, Inc.
|
1,091,667
|
1,308,334
|
|||
|
Portrait
Displays, Inc.
|
685,068
|
361,017
|
|||
|
Pratt-Read
Corporation
|
1
|
905,577
|
|||
|
Spectrum
Products, LLC
|
1,510,355
|
1,077,649
|
|||
|
Superior
Holding, Inc.
|
1,137,608
|
1,473,458
|
|||
|
|
(1)
|
September
30, 2008 valuations have been adjusted for additional amounts invested or
partial disposition of the portfolio investment for purposes of
comparison.
|
CRITICAL
ACCOUNTING POLICY
Investments
in securities that are traded in the over-the-counter market or on a stock
exchange are valued by taking the average of the close (or bid price in the case
of over-the-counter equity securities) for the valuation date and the preceding
two days. The Board of Directors generally use market quotations to
assess the value of our investments for which market quotations are readily
available. We obtain these market values from an independent pricing
service or at the bid prices, if available, obtained from at least two
broker/dealers or by a principal market maker or a primary market
dealer. Restricted and other securities for which quotations are not
readily available are valued at fair value as determined by the Board of
Directors. Such determination of fair values involved subjective
judgments and estimates. Among the factors considered in determining
the fair value of investments are the cost of the investment; developments,
including recent financing transactions, since the acquisition of the
investment; the financial condition and operating results of the portfolio
company; discounted cash flow models, comparisons of multiples of peer companies
that are public, the long-term potential of the business of the portfolio
company; market interest rates for similar debt securities; overall market
conditions and other factors generally pertinent to the valuation of
investments. When an external event such as a purchase transaction,
public offering or subsequent equity sale occurs in connection with one of our
portfolio companies, our board of directors uses the pricing indicated by the
external event to corroborate and/or assist us in our valuation of our
investment in such portfolio company. However, because of the
inherent uncertainty of valuation, those estimated values may differ
significantly from the values that would have been used had a ready market for
the securities existed, and the differences could be material.
In the
valuation process, MACC uses financial information received monthly, quarterly,
and annually from its portfolio companies which includes both audited and
unaudited financial statements. This information is used to determine
financial condition, performance, and valuation of the portfolio
investments.
Realization
of the carrying value of investments is subject to future
developments. Investment transactions are recorded on the trade date
and identified cost is used to determine realized gains and
losses. Under the provisions of authoritative guidance, the fair
value of loans and investments in portfolio securities on February 15, 1995,
MACC’s fresh-start date, is considered the cost basis for financial statement
purposes.
The
preparation of financial statements in conformity with GAAP requires management
to estimates and assumptions that affect the reported amounts of assets and
liabilities and disclosure of contingent assets and liabilities at the date of
the financial statements, and the reported amounts of revenues and expenses
during the reporting period. Actual results could differ from those
estimates.
12
MANAGEMENT’S DISCUSSION AND ANALYSIS OF
FINANCIAL CONDITION AND RESULTS OF OPERATIONS CONTINUED…
DETERMINATION
OF NET ASSET VALUE
The net
asset value per share of MACC’s outstanding common stock is determined
quarterly, as soon as practicable after and as of the end of each calendar
quarter, by dividing the value of total assets minus total liabilities by the
total number of shares outstanding at the date as of which the determination is
made.
In
calculating the value of total assets, securities that are traded in the
over-the-counter market or on a stock exchange are valued in accordance with the
current guidelines of the SEC. Under SEC Regulations, publicly-traded
equity securities are valued by taking the close (or bid price in the case of
over-the-counter equity securities) for the valuation date. MACC did
not have any publicly-traded equity securities as of September 30,
2009.
All other
investments are valued at fair value as determined in good faith by the Board of
Directors. The Board of Directors has determined that all other
investments will be valued initially at cost, but such valuation will be subject
to quarterly adjustments and on such other interim periods as are justified by
material portfolio company events if the Board of Directors determines in good
faith that cost no longer represents fair value
We
currently have a portfolio of debt and equity securities for which no regular
trading market exists. The fair value of these investments may not be
readily determinable. We value these investments quarterly at fair
value as determined in good faith under the direction of our board of directors
pursuant to a valuation policy and consistently applied valuation process
utilizing the input of our investment advisers and audit
committee. The types of factors that may be considered in fair value
pricing of these investments include the nature and realizable value of any
collateral, the portfolio company’s ability to make payments and its earnings,
the markets in which the portfolio company does business, comparison to more
liquid securities, indices and other market related inputs, discounted cash flow
and other relevant factors. Because such valuations and particularly
valuations of private securities and private companies, are inherently
uncertain, may fluctuate over short periods of time and may be based on
estimates, our determinations of fair value may differ materially from the
values that would have been used if a readily available market for these
investments existed and may differ materially from the amounts we realize on any
disposition of such investments. Our net asset value could be adversely affected
if our determinations regarding the fair value of these investments were
materially higher than the values that we ultimately realize upon the disposal
of such investments. In addition, decreases in the market values or
fair values of our investments are recorded as unrealized
depreciation. Continued declines in prices and liquidity in the debt
markets could result in substantial unrealized/realized losses, which could have
a material adverse impact on our business, financial condition and results of
operations.
We are
required to record our assets at fair value, as determined in good faith by our
board of directors in accordance with our valuation policy. As a
result, volatility in the capital markets may adversely affect our valuations
and our net asset value, even if we intend to hold respective investments to
maturity. Volatility or dislocation in the capital markets may
depress our stock price below our net asset value per share and create a
challenging environment in which to raise debt and equity capital. As
a business development company, we are generally not able to issue additional
shares of our common stock at a price less than net asset value without first
obtaining approval for such issuance from our stockholders and our independent
directors. Additionally, our ability to incur indebtedness is limited
by applicable regulations such that our assets coverage under the 1940 Act must
equal to at least 200% of total indebtedness immediately after each time we
incur indebtedness. Shrinking portfolio values negatively impact our
ability to borrow our ability to borrow additional funds under our credit
facility because our net asset value is reduced for purposes of the 200% asset
leverage test. If the fair value of our assets declines
substantially, we may fail to maintain the asset coverage ratios stipulate by
the 1940 Act, which could, in turn, cause us to lose our status as a business
development company and materially impair our business operations. A
protracted disruption in the credit markets could also materially decrease
demand for our investments.
The
significant disruption in the capital markets has had and may continue to have a
negative effect on the valuations of our investments and on the potential for
liquidity events involving our investments. The debt capital that
will be available to use, if at all, may be at a higher cost and on less
favorable terms and conditions in the future. A prolonged inability
to raise capital will further delay any opportunity to execute the New Portfolio
strategy, and/or could have a material adverse impact on our business, financial
conditions or results of operations.
The
current economic conditions generally and the disruptions in the capital markets
in particular have decreased liquidity, where available. The longer these
conditions persist, the greater the probability that these factors
could reduce our ability to effectively liquidate portfolio
positions, increase our cost and significantly limit our access to debt and
equity capital, and thus have an adverse
13
MANAGEMENT’S
DISCUSSION AND ANALYSIS OF
FINANCIAL CONDITION AND RESULTS OF OPERATIONS CONTINUED…
effect on
our operations and financial results. Many of our portfolio companies may also
be susceptible to the economic downturn, which could affect the ability of one
or more of our portfolio companies to repay our loans or engage in a liquidity
event, such as a sale or recapitalization.
A
continued economic downturn could also disproportionately impact some of the
industries in which we invest, causing us to be more vulnerable to further
losses in our portfolio. Therefore, the number of our non-performing assets
could increase and the fair market value of our portfolio decrease during these
periods. The economic downturn has affected the availability of credit
generally and may prevent us from replacing or renewing our credit facility on
reasonable terms, if at all. If market instability persists or
intensifies, we may continue to experience difficulty in raising
capital.
Recent
market conditions have also affected the trading price of our common stock and
thus our ability to finance new investments through the issuance of
equity. The economic downturn may also continue to decrease the value
of collateral securing the Note Payable, as well as the value of our equity
investments.
For the
year ended September 30, 2009, we recorded net unrealized appreciation on our
portfolio of investments of $395,347, of which the increase was primarily due to
the reversal of unrealized depreciation from the write off of two portfolio
investments resulting in a realized loss. Overall, the investments
held in the portfolio as of the reporting date generally reflect a decrease in
fair value and we may continue to see further decreases in the value of our
portfolio in the event that the economic downturn continues and the general
illiquidity of capital markets continues.
We are
also subject to financial market risks from changes in market interest
rates. The Note Payable is subject to a variable interest rate that
is based on an independent index. Therefore, general interest rate
fluctuations may have a materially adverse effect on our investment
expense.
QUANTITATIVE
AND QUALITATIVE DISCLOSURE ABOUT MARKET RISK
MACC is
subject to market risk from changes in market prices of publicly-traded equity
securities held from time to time in the MACC investment
portfolio. At September 30, 2009, MACC had no publicly-traded equity
securities in the MACC investment portfolio.
MACC is
also subject to financial market risks from changes in market interest
rates. MACC currently has an outstanding note payable with a variable
interest rate that is based on an independent index. Therefore,
general interest rate fluctuations may have a materially adverse effect on our
investment expense.
We are
also subject to financial market risk from the short term nature of our credit
facilities in combination with current market conditions and the relatively
illiquid nature of our Existing Portfolio. Our Note Payable is due
March 31, 2010. Given the currently challenging market environment as
discussed elsewhere, we may have difficultly refinancing our Note Payable, or
finding alternative sources of financing. Failure to refinance the
Note Payable could result in significant financial difficulties for us including
the seizure and sale of Existing Portfolio assets at prices which would likely
be at prices significantly less than fair value. Further, the cost of
financing could be significantly more costly than our current financing which
could have a material impact on our financial condition
PORTFOLIO
RISKS
Pursuant
to Section 64(b)(1) of the 1940 Act, a BDC is required to describe the risk
factors involved in an investment in the securities of such company due to the
nature of MACC’s investment portfolio. Accordingly, MACC states
that:
Existing
Portfolio:
The
Existing Portfolio securities of MACC consist primarily of securities issued by
small, privately held companies. Generally, little or no public
information is available concerning the companies in which MACC is currently
invested in, and MACC must rely on the diligence of the Investment Adviser to
obtain the information necessary for MACC’s investment decisions. In
order to maintain their status as a BDC, MACC must invest at least 70% of its
total assets in the types of portfolio investments described by Section 55(a) of
the 1940 Act, as amended. These investments generally are securities
purchased in private placement transactions from small privately held
companies. Typically, the success or failure of such companies
depends on the management talents and efforts of one
14
MANAGEMENT’S
DISCUSSION AND ANALYSIS OF
FINANCIAL CONDITION AND RESULTS OF OPERATIONS CONTINUED…
person or
a small group of persons, so that the death, disability or resignation of such
person or persons could have a materially adverse impact on such
companies. Moreover, smaller companies frequently have smaller
product lines and smaller market shares
than
larger companies and may be more vulnerable to economic
downturns. Because these companies will generally have highly
leveraged capital structures, reduced cash flows resulting from an economic
downturn may adversely affect the return on, or the recovery of, MACC’s
investments. Investment in these companies therefore involves a high
degree of business and financial risk, which can result in substantial losses
and should be considered speculative.
MACC’s
Existing Portfolio investments primarily consist of securities acquired from the
issuers in private transactions, which are usually subject to restrictions on
resale and are generally illiquid. No established trading market
generally exists with regard to such securities, and most of such securities are
not available for sale to the public without registration under the Securities
Act of 1933, as amended, which involves significant delay and
expense.
The
Existing Portfolio investments of MACC are generally long-term in
nature. Some existing investments do not bear a current yield and a
return on such investments will be earned only after the investment matures or
is sold. Although most investments are structured so as to return a
current yield throughout most of their term, these investments will typically
produce gains only when sold in five to seven years. There can be no
assurance, however, that any of MACC’s investments will produce current yields
or gains.
New
Portfolio:
MACC’s
New Portfolio will primarily consist of equity investments in smaller company
growth stocks. Investments in growth stocks involves certain risks,
in part, because the value of the securities is based upon future expectations
that may or may not be met. We will therefore be particularly
sensitive to the risks associated with small companies. The general risks
associated with equity securities are particularly pronounced for securities
issued by companies with small market capitalizations. Micro-cap and other small
capitalization companies may offer greater opportunities for capital
appreciation than larger companies, but may also involve certain special risks.
They are more likely than larger companies to have limited product lines,
markets or financial resources, or to depend on a small, inexperienced
management group. Securities of smaller companies may trade less frequently and
in lesser volume than more widely held securities and their values may fluctuate
more sharply than other securities. They may also trade in the over-the-counter
market or on a regional exchange, or may otherwise have limited liquidity. These
securities may therefore be more vulnerable to adverse developments than
securities of larger companies, and we may have difficulty establishing or
closing out our securities positions in smaller companies at prevailing market
prices. Also, there may be less publicly-available information about smaller
companies or less market interest in their securities as compared to larger
companies, and it may take longer for the prices of the securities to reflect
the full value of the issuers’ earnings potential or assets.
The
majority of our New Portfolio investments will primarily consist of, securities
acquired from the issuers in private transactions, which are usually subject to
restrictions on resale and are generally illiquid. Often, no
established trading market exists with regard to such securities, and most of
such securities are not available for sale to the public without registration
under the Securities Act 1933, which involves significant delay and expense. In
addition, unregistered shares sold in a private transaction will typically sell
at a discount to the price of publicly available registered
shares. As of September 30, 2009, we do not have any securities in
the New Portfolio.
OPERATIONS
RISKS
MACC
generally relies on portfolio investment divestitures and liquidity events, as
well as increases in fair value of portfolio investments, to provide for
increases in net asset value in any period. MACC typically relies on
the sale of portfolio companies in negotiated transactions and on the initial
public offering of portfolio company securities to provide for portfolio
investment divestitures and liquidity events. Accordingly, a general
contraction in the markets for corporate acquisitions and/or initial public
offerings could adversely affect MACC’s ability to realize capital gains, if
any, from the sale of its Existing Portfolio company securities. The
SEC guidelines under which MACC operates permit the MACC Board of Directors to
determine increases in fair value of unliquidated Existing Portfolio investments
based upon a number of factors, including subsequent financings provided to
Existing Portfolio companies. Accordingly, decreases in the supply of
additional capital to MACC’s Existing Portfolio companies could adversely affect
MACC’s ability to achieve increases, if any, in fair value of its Existing
Portfolio investments.
15
MANAGEMENT’S DISCUSSION AND ANALYSIS OF
FINANCIAL CONDITION AND RESULTS OF OPERATIONS CONTINUED…
INTEREST
RATE RISKS
MACC
faces risks in relation to changes in prevailing market interest
rates. First, at September 30, 2009, MACC had outstanding $4,618,659
in principal amount of a note payable, which matures in March of
2010. This note has a variable rate of interest, and accordingly,
changes in market interest rates will have an effect on the amount of interest
paid by MACC with respect to the note. At September 30, 2009, the
interest rate on the note was 6.0%.
Second,
MACC’s Existing Portfolio companies have or may issue debt senior to MACC’s
investment. The payment of principal and interest due on MACC’s
investment, therefore, will generally be subordinate to payments due on any such
senior debt. Moreover, senior debt typically bears interest at a
floating rate, whereas MACC’s investments generally do not. Any
increase in market interest rates may put significant economic pressure on those
Existing Portfolio companies that have issued senior debt which bears interest
at a floating rate. Accordingly, MACC’s ability to achieve net
operating income and generally to realize gains from its Existing Portfolio
investments may be adversely affected by an increase in market interest
rates.
16
REPORT OF INDEPENDENT REGISTERED PUBLIC ACCOUNTING FIRM
The Board
of Directors and Shareholders
MACC
Private Equities Inc.:
We have
audited the accompanying balance sheets of MACC Private Equities Inc.
(the Company), including the schedule of investments, as of
September 30, 2009 and 2008, and the related statements of operations,
changes in net assets, and cash flows for each of the years in the three-year
period ended September 30, 2009, and the financial highlights for each of
the years in the five-year period ended September 30, 2009. These financial
statements and financial highlights are the responsibility of the Company’s
management. Our responsibility is to express an opinion on these financial
statements and financial highlights based on our audits.
We
conducted our audits in accordance with the standards of the Public Company
Accounting Oversight Board (United States). Those standards require that we
plan and perform the audit to obtain reasonable assurance about whether the
financial statements and financial highlights are free of material misstatement.
An audit includes examining, on a test basis, evidence supporting the amounts
and disclosures in the financial statements. Our procedures included
confirmation or examination of securities owned as of September 30, 2009.
An audit also includes assessing the accounting principles used and significant
estimates made by management, as well as evaluating the overall financial
statement presentation. We believe that our audits provide a reasonable basis
for our opinion.
In our
opinion, the financial statements and financial highlights referred to above
present fairly, in all material respects, the financial position of MACC Private
Equities Inc. as of September 30, 2009 and 2008, the results of its
operations, the changes in its net assets, and its cash flows for each of the
years in the three-year period ended September 30, 2009, and the financial
highlights for each of the years in the five-year period ended
September 30, 2009, in conformity with U.S. generally accepted
accounting principles.
The
accompanying financial statements have been prepared assuming that the Company
will continue as a going concern. As discussed in note 1 to the financial
statements, the Company does not have sufficient cash on hand to meet current
obligations, which raise substantial doubt about its ability to continue as a
going concern. Management’s plans in regard to these matters are also described
in note 1. The financial statements do not include any adjustments that
might result from the outcome of this uncertainty.
/s/ KPMG
San
Diego, California
December 28,
2009
17
MACC PRIVATE EQUITIES INC.
BALANCE SHEETS
SEPTEMBER
30, 2009 AND 2008
|
Assets
|
2009
|
2008
|
||||||
|
Loans
and investments in portfolio securities, at market or fair value (note
2):
|
||||||||
|
Unaffiliated
companies (cost of $779,807 for 2009; $2,274,595 for 2008)
|
$ | 1,199,388 | 1,530,127 | |||||
|
Affiliated
companies (cost of $10,664,161 for 2009; $12,234,007 for
2008)
|
7,973,862 | 10,528,449 | ||||||
|
Controlled
companies (cost of $2,874,939 for 2009; $2,932,231 for
2008)
|
2,602,022 | 2,443,275 | ||||||
|
Cash
and money market accounts
|
173,521 | 145,790 | ||||||
|
Interest
receivable
|
303,656 | 313,561 | ||||||
|
Other
assets (note 1)
|
264,070 | 352,675 | ||||||
|
Total
assets
|
$ | 12,516,519 | 15,313,877 | |||||
|
Liabilities
and net assets
|
||||||||
|
Liabilities:
|
||||||||
|
Note
payable (note 3)
|
$ | 4,618,659 | 4,750,405 | |||||
|
Incentive
fees payable (note 5)
|
16,361 | 16,361 | ||||||
|
Accounts
payable and other liabilities
|
72,111 | 112,130 | ||||||
|
Total
liabilities
|
4,707,131 | 4,878,896 | ||||||
|
Net
assets:
|
||||||||
|
Common
stock, $.01 par value per share; authorized 10,000,000
shares;
issued
and outstanding 2,464,621 shares for each 2009 and 2008
|
24,646 | 24,646 | ||||||
|
Additional
paid-in-capital
|
10,328,377 | 13,349,317 | ||||||
|
Unrealized
depreciation on investments (note 2)
|
(2,543,635 | ) | (2,938,982 | ) | ||||
|
Total
net assets
|
7,809,388 | 10,434,981 | ||||||
|
Commitments
and contingency (note 6)
|
||||||||
|
Total
liabilities and net assets
|
$ | 12,516,519 | 15,313,877 | |||||
|
Net
assets per share
|
$ | 3.17 | 4.23 | |||||
SEE
ACCOMPANYING NOTES TO FINANCIAL STATEMENTS
18
MACC PRIVATE EQUITIES INC.
STATEMENTS OF OPERATIONS
YEARS ENDED SEPTEMBER
30, 2009, 2008
AND 2007
|
2009
|
2008
|
2007
|
|||||||||||||||
|
Investment
income:
|
|||||||||||||||||
|
Interest
|
|||||||||||||||||
|
Unaffiliated
companies
|
$
|
129,334
|
33,315
|
52,362
|
|||||||||||||
|
Affiliated
companies
|
236,787
|
516,387
|
587,390
|
||||||||||||||
|
Controlled
companies
|
24,957
|
47,933
|
129,591
|
||||||||||||||
|
Other
|
318
|
2,917
|
98,230
|
||||||||||||||
|
Dividends
|
|||||||||||||||||
|
Affiliated
companies
|
161,174
|
355,005
|
129,054
|
||||||||||||||
|
Unaffiliated
companies
|
26,766
|
---
|
---
|
||||||||||||||
|
Other
|
7,653
|
6
|
---
|
||||||||||||||
|
Total
investment income
|
586,989
|
955,563
|
996,627
|
||||||||||||||
|
Operating
expenses:
|
|||||||||||||||||
|
Interest
expenses (note 3)
|
303,794
|
408,175
|
799,041
|
||||||||||||||
|
Management
fees (note 5)
|
223,804
|
282,457
|
331,625
|
||||||||||||||
|
Incentive
fees
|
---
|
---
|
143,732
|
||||||||||||||
|
Professional
fees
|
325,839
|
395,240
|
271,650
|
||||||||||||||
|
Other
|
310,362
|
317,482
|
307,559
|
||||||||||||||
|
Total
operating expenses
|
1,163,799
|
1,403,354
|
1,853,607
|
||||||||||||||
|
|
|||||||||||||||||
|
Investment
expense, net before tax expense
|
(576,810)
|
(447,791)
|
(856,980)
|
||||||||||||||
| Income tax benefit (note 4) | --- | --- | 70,493 | ||||||||||||||
| Investment expense, net | (576,810) |
(447,791)
|
(786,487)
|
||||||||||||||
| Realized and unrealized loss on investments (note 2): | |||||||||||||||||
| Net realized (loss) gain on investments: | |||||||||||||||||
| Unaffiliated companies | (908,201) |
106,664
|
(134,044)
|
||||||||||||||
| Affiliated companies | (1,535,929) |
580,605
|
1,485,500
|
||||||||||||||
| Net change in unrealized depreciation/appreciation investments |
395,347
|
(1,294,629)
|
(662,393)
|
||||||||||||||
| Realized loss on other assets | --- | (30,678) | --- | ||||||||||||||
| Net (loss) income on investments | (2,048,783) |
(638,038)
|
689,063
|
||||||||||||||
| Net change in net assets from operations |
$
|
(2,625,593) |
(1,085,829)
|
(97,424) |
SEE
ACCOMPANYING NOTES TO FINANCIAL STATEMENTS
19
MACC PRIVATE EQUITIES INC.
STATEMENTS OF CHANGES IN NET ASSETS
YEARS ENDED SEPTEMBER
30, 2009, 2008
AND 2007
|
2009
|
2008
|
2007
|
||||||||||||
| Operations: | |||||||
|
Investment
expense, net
|
$
|
(576,810)
|
(447,791)
|
(786,487)
|
|||
| Net realized (loss) gain on investments |
(2,444,130)
|
687,269
|
1,351,456
|
||||
| Net
change in unrealized depreciation/appreciation
on investments and other
assets
|
395,347
|
(1,294,629)
|
(662,393)
|
||||
| Realized loss on other assets |
---
|
(30,678)
|
---
|
||||
| Net change in net assets from operations |
(2,625,593)
|
(1,085,829)
|
(97,424)
|
||||
| Net assets: |
|
|
|
||||
| Beginning of period |
10,434,981
|
11,520,810
|
11,618,234
|
||||
| End of period | $ | 7,809,388 |
10,434,981
|
11,520,810
|
|||
SEE
ACCOMPANYING NOTES TO FINANCIAL STATEMENTS
20
MACC PRIVATE EQUITIES INC.
STATEMENTS OF CASH FLOWS
YEARS ENDED SEPTEMBER 30, 2009, 2008 AND 2007
|
2009
|
2008
|
2007
|
||||||||||
|
Cash
flows from operating activities:
|
||||||||||||
|
Decrease
in net assets from operations
|
$ | (2,625,593 | ) | (1,085,829 | ) | (97,424 | ) | |||||
|
Adjustments
to reconcile decrease in net assets from operations to
|
||||||||||||
|
net
cash provided by operating activities:
|
||||||||||||
|
Net
realized and unrealized loss (gain) on investments, net of incentive
fees
|
2,048,783 | 607,360 | (612,858 | ) | ||||||||
|
Net
realized and unrealized gain on other assets
|
--- | 30,678 | 67,527 | |||||||||
|
Proceeds
from disposition of and payments on
|
||||||||||||
|
loans
and investments in portfolio securities
|
817,382 | 1,647,743 | 3,062,958 | |||||||||
|
Purchases
of loans and investments in portfolio securities
|
(139,586 | ) | (52,000 | ) | (65,000 | ) | ||||||
|
Change
in interest receivable
|
9,905 | (44,963 | ) | 90,119 | ||||||||
|
Change
in other assets
|
88,605 | (170,413 | ) | 968,467 | ||||||||
|
Change
in accrued interest, deferred incentive fees payable,
|
||||||||||||
|
accounts
payable and other liabilities
|
(40,019 | ) | (251,113 | ) | (42,217 | ) | ||||||
|
Total
adjustments
|
2,785,070 | 1,767,292 | 3,468,996 | |||||||||
|
Net
cash provided by operating activities
|
159,477 | 681,463 | 3,371,572 | |||||||||
|
Cash
flows from financing activities:
|
||||||||||||
|
Proceeds
from note payable
|
--- | --- | 6,250,000 | |||||||||
|
Debt
repayment
|
--- | --- | (10,790,000 | ) | ||||||||
|
Line
of credit draws
|
522,160 | --- | --- | |||||||||
|
Note
repayment
|
(653,906 | ) | (1,357,968 | ) | (141,627 | ) | ||||||
|
Net
cash used in financing activities
|
(131,746 | ) | (1,357,968 | ) | (4,681,627 | ) | ||||||
|
Net
increase (decrease) in cash and cash equivalents
|
27,731 | (676,505 | ) | (1,310,055 | ) | |||||||
|
Cash
and cash equivalents at beginning of period
|
145,790 | 822,295 | 2,132,350 | |||||||||
|
Cash
and cash equivalents at end of period
|
$ | 173,521 | 145,790 | 822,295 | ||||||||
|
Supplemental
disclosure of cash flow information -
Cash
paid during the period for interest
|
$ | 288,632 | 391,907 | 710,939 | ||||||||
SEE
ACCOMPANYING NOTES TO FINANCIAL STATEMENTS
21
MACC
PRIVATE EQUITIES INC.
NOTES TO FINANCIAL STATEMENTS
SEPTEMBER 30, 2009
AND
2008
|
(1)
|
SUMMARY OF SIGNIFICANT ACCOUNTING POLICES AND RELATED MATTERS
|
|
|
(a)
|
Basis
of Presentation
|
The
financial statements include the accounts of MACC Private Equities Inc.
(“MACC”). MACC has elected to be treated as a business development company under
the Investment Company Act of 1940. The financial statements have been prepared
in accordance with accounting principles generally accepted in the United States
of America (“GAAP”) for investment companies.
On
February 15, 1995, MACC consummated a plan of reorganization as confirmed by the
United States Bankruptcy Court for the Northern District of Iowa on December 28,
1993. As of February 15, 1995, MACC adopted fresh-start reporting resulting in
MACC’s assets and liabilities being adjusted to fair values.
Effective
April 30, 3008, MACC’s wholly owned subsidiary, MorAmerica Capital Corporation
(“MorAm”), was
merged into MACC.
|
|
(b)
|
Going
Concern Uncertainty and Liquidity
|
MACC has
a negative net change in net assets from operations of $2,625,593 for the year
ended September 30, 2009. Operating expenses have been funded
primarily from the sale of portfolio companies, dividends, interest and other
distributions from MACC’s portfolio companies and from MACC’s bank
financing.
MACC
continues to have an ongoing need to raise cash from portfolio sales to fund
operations and pay down outstanding debt. MACC’s effort to sell
certain investments has taken longer than initially anticipated while
performance of the underlying portfolio companies in certain cases has
deteriorated. MACC’s ability to liquidate positions has been
adversely affected by current credit conditions and the downturn in the
financial markets and the global economy throughout the current fiscal
year. In addition, MACC’s note payable with Cedar Rapids Bank &
Trust Company in the amount of $4,618,659 is due and payable March,
2010. MACC will need to either extend the due date on the current
note payable or consider additional sources of financing and additional sales of
investments in order to meet current payment and operating
requirements. No assurance can be given that MACC will be successful
in its efforts to extend its current financing arrangement or raise additional
funding in the near term and accordingly these facts raise substantial doubt
about MACC’s ability to continue as a going concern. The accompanying
financial statements have been prepared assuming that MACC will continue as a
going concern.
MACC
continues to seek additional cash through future sales of portfolio equity and
debt securities and from other financing arrangements. Absent
financing amendments to the current note payable or additional sources of
financing, current working capital and cash will not be adequate for operations
at their current levels. If such efforts are not successful, MACC may
need to liquidate its current investment portfolio, to the extent possible,
which could result in significant realized losses due to the current economic
conditions. MACC continues to review its current investment portfolio
and evaluate potential exit opportunities at the maximum return on initial
investment.
|
|
(c)
|
Use
of Estimates
|
The
preparation of the financial statements in conformity with GAAP requires
management to make estimates and assumptions that affect the reported amounts of
assets and liabilities and disclosure of contingent assets and liabilities at
the date of the financial statements, and the reported amounts of revenues and
expenses during the reporting period. Actual results could differ from those
estimates.
The
financial statements are prepared in accordance with GAAP and pursuant to the
requirements for reporting on Form 10-K and Article 6 or 10 of the Regulation
S-X, as appropriate. In accordance with Article 6-09 of Regulation
S-X under the Exchange Act, we are providing a Statement of Changes in Net
Assets in lieu of a Statement of Changes in Stockholders’ Equity.
22
NOTES TO FINANCIAL STATEMENTS CONTINUED…
SEPTEMBER 30, 2009
AND
2008
|
|
(d)
|
Cash
Equivalents
|
For
purposes of reporting cash flows, MACC considers certificates of deposit and U.
S. treasury bills with maturities of three months or less from the date of
purchase and money market accounts to be cash equivalents. At September 30,
2009, and 2008, cash equivalents consisted of $171,831 of money market funds and
$111,793, respectively.
|
|
(e)
|
Loans
and Investments in Portfolio
Securities
|
Investments
in securities that are traded in the over-the-counter market or on a stock
exchange are valued by taking the close (or bid price in the case of
over-the-counter equity securities) for the valuation date. Restricted and other
securities for which quotations are not readily available are valued at fair
value as determined by the Board of Directors. Among the factors considered by
MACC in determining the fair value of investments were the cost of the
investment; developments, including recent financing transactions, since the
acquisition of the investment; the financial condition and operating results of
the portfolio company; discounted cash flow models, comparisons of multiples of
peer companies that are public, the long-term potential of the business of the
portfolio company; market interest rates for similar debt securities; overall
market conditions and other factors generally pertinent to the valuation of
investments. When an external event such as a purchase transaction,
public offering or subsequent equity sale occurs in connection with one of our
portfolio companies, our board of directors uses the pricing indicated by the
external event to corroborate and/or assist us in our valuation of our
investment in such portfolio company. However, because of the
inherent uncertainty of valuation, those estimated values may differ
significantly from the values that would have been used had a ready market for
the securities existed, and the differences could be material.
In the
valuation process, MACC uses financial information received quarterly and
annually from the portfolio companies which includes both audited and unaudited
financial statements. This information is used to assist in assessing
financial condition, performance, and valuation of the portfolio
investments.
Realization
of the carrying value of investments is subject to future developments (see note
2). Investment transactions are recorded on the trade date. Identified cost is
used to determine realized gains and losses. Under fresh start reporting, the
fair value of loans and investments in portfolio securities on February 15,
1995, is considered the cost basis for financial statement
purposes.
|
|
(f)
|
Other
Assets, Net
|
For the
year ended September 30, 2009, other assets include deferred fees on the note
payable of $1,250, which are amortized over the life of the loan, prepaid taxes
and insurance of $40,605, fees associated with the Rights Offering of $41,609,
$131,000 held in escrow and other receivables of $49,606.
For the
year ended September 30, 2008, other assets included deferred fees on the note
payable of $14,912, which are amortized over the life of the loan, prepaid taxes
and insurance of $79,260, fees associated with the Rights Offering of $41,609,
$131,000 held in escrow and other receivables of $85,894.
|
|
(g)
|
Revenue
Recognition
|
Dividend
income is recognized on the ex-dividend date and interest income is accrued on a
daily basis.
Debt
obligations may be placed on non-accrual status and related interest income may
be reduced by ceasing current accruals and writing off interest receivables when
the collection of all or a portion of interest has become doubtful based on
consistently applied procedures. A debt obligation is removed from
non-accrual status when the issuer resumes interest payments and when
collectability of interest is reasonably assured.
In
conjunction with the investment process, MACC negotiates non-refundable
processing fees with many companies it evaluates for
investment. These fees are compensation for time and efforts of the
investment advisory personnel and for reimbursement of expenses related to the
due diligence, and are recognized as income when received.
In-kind
interest income is recorded in connection with debt to equity conversions or in
the case of certain debt security reorganizations.
23
NOTES
TO FINANCIAL STATEMENTS CONTINUED…
SEPTEMBER 30, 2009
AND
2008
|
|
(h)
|
Income
Taxes
|
Deferred
tax assets and liabilities are recognized for the future tax consequences
attributable to differences between the consolidated financial statement
carrying amounts of existing assets and liabilities and their respective tax
basis and net operating and capital loss carryforwards. Deferred tax assets and
liabilities are measured using enacted tax rates expected to apply to taxable
income in the years in which those temporary differences are expected to be
recovered or settled. The effect of a change in tax rates on deferred tax assets
and liabilities is recognized in the period that includes the enactment
date.
Effective
October 1, 2007, MACC adopted a reporting standard that clarifies the accounting
and disclosure for uncertain tax positions by requiring that a tax position meet
a “more likely than not threshold” for the benefit of the tax position to be
recognized in the financial statements. A tax position that fails to meet the
more likely than not recognition threshold will result in either a reduction of
a current or deferred tax asset or receivable, or the recording of a current or
deferred tax liability. The standard also provides guidance on measurement,
recognition of tax benefits, classification, interim period accounting
disclosure, and transition requirements in accounting for uncertain tax
positions. The adoption of the standard had no impact on the balance
sheet or statement of operations.
|
|
(i)
|
Disclosures
About Fair Value of Financial
Instruments
|
Disclosures
are required to be made regarding the estimated fair value of financial
instruments, which are generally described as cash, contractual obligations, or
rights to pay or receive cash. The carrying amount approximates fair value for
certain financial instruments because of the short-term maturity of these
instruments, including cash and money market, deferred incentive fees payable,
accrued interest, accounts payable and other liabilities.
Portfolio
investments are recorded at fair value. The consolidated schedule of investments
(schedule 1) discloses the applicable fair value and cost for each security
investment, which aggregated to $11,775,272 and $14,501,851 at September 30,
2009 and September 30, 2008, respectively.
|
|
(j)
|
Recent
Accounting Pronouncements
|
In
September 2006, the Financial Accounting Standards Board (“FASB”) issued
authoritative guidance for fair value measurements and disclosures which defines
fair value, establishes a framework for measuring fair value and expands
disclosures related to assets and liabilities measured at fair value. In
February 2008, the FASB issued additional authoritative guidance for fair value
measurements which delayed the effective date of the authoritative guidance for
fair value measurements to fiscal years beginning after November 15, 2008
for all nonfinancial assets and nonfinancial liabilities that are recognized or
disclosed at fair value in the financial statements on a nonrecurring basis. We
adopted the provisions of the authoritative guidance for fair value measurements
on January 1, 2008 with the exception of the application of the guidance to
non-recurring nonfinancial assets and nonfinancial liabilities which we will
adopt on October 1, 2009. Our disclosures on the use of fair value measurements
for our nonfinancial assets and liabilities are included in Note 2, “Fair
Value Measurements”.
In
February 2007, standards were adopted that permit entities to choose to measure
many financial instruments and certain other items at fair value. The
provisions of this standard was effective as of the beginning of our 2009 fiscal
year. This pronouncement had no impact on MACC’s financial
statements.
In
October 2008, the FASB issued authoritative guidance which clarifies the
application of determining fair value of financial assets when the market for
that asset is not active. More specifically, the pronouncement states
that significant judgment should be applied to determine if observable data in a
disclosed market represents forced liquidations or distressed sales and are not
representative of fair value in an orderly transaction. The
pronouncement also provides further guidance that the use of a reporting
entity’s own assumptions about the future cash flows and appropriately
risk-adjusted discount rates is acceptable when relevant observable inputs are
not available. In addition, the pronouncement provides guidance on
the level of reliance of broker quotes or pricing services when measuring fair
value in a non-active market stating that less reliance should be placed on a
quote that does not reflect actual market transactions and a quote that is not a
binding offer. The guidance was effective upon issuance for all
financial statements that had not been issued and any changes in valuation
techniques as a result of applying this pronouncement was accounted for as a
change in accounting estimate. MACC adopted this pronouncement during
the quarter ended December 31, 2008. The adoption of this
pronouncement had no impact on the financial statements.
24
NOTES TO FINANCIAL STATEMENTS CONTINUED…
SEPTEMBER 30, 2009
AND
2008
In April
2009, the FASB issued authoritative guidance for investments which provided
recognition guidance for other than temporary impairments for debt securities
classified as available-for-sale and held-to-maturity securities, and
presentation and disclosure guidance for both debt and equity securities. This
guidance requires significant additional disclosures for both annual and interim
periods, including the amortized cost basis of available-for-sale and
held-to-maturity debt, the methodology and key inputs used to measure the credit
portion of other-than –temporary impairment, and a rollforward of amounts
recognized in earnings for securities by major security type. The
pronouncement requires that entities identify major security classes consistent
with how the securities are managed based on the nature and risks of the
security, and also expands, for disclosure purposes, the list of major security
types identified in the pronouncement. This pronouncement was
effective for interim and annual reporting periods ended after June 15,
2009. MACC’s adoption of this pronouncement did not have a material
impact on the financial statements.
In April
2009, the FASB issued authoritative guidance for fair value measurements and
disclosures. This guidance provides companies with guidelines on how to
determine fair value measurements when the volume and level of activity for an
asset or liability have significantly decreased and how to identify transactions
that are not orderly. This guidance is effective for interim reporting periods
ending after June 15, 2009, with early adoption permitted for periods
ending after March 15, 2009. We adopted this guidance for the quarter ended
June 30, 2009, which did not have any impact on our financial
statements.
In May
2009, the FASB issued authoritative guidance for subsequent events which
provides rules on recognition and disclosure for events and transactions
occurring after the balance sheet date but before the financial statements are
issued or available to be issued. In addition, the guidance requires a reporting
entity to disclose the date through which subsequent events have been evaluated,
as well as whether that date is the date the financial statements are issued or
the date the financial statements are available to be issued. This guidance is
effective for interim and annual periods ending after June 15, 2009. We
adopted this guidance for the quarter ended June 30, 2009 and have included
the required additional disclosures in Note 7, “Subsequent Events.”
In June
2009, the FASB issued authoritative guidance on the Accounting Standards
Codification (“Codification”) and the Hierarchy of Generally Accepted Accounting
Principles (“U.S. GAAP”), which establishes the Codification as the single
source for nongovernmental financial statements prepared in accordance with U.S.
GAAP, except for SEC rules and interpretive releases, which is also
authoritative guidance for SEC registrants. This guidance is effective for
financial statements issued for interim and annual periods ending after
September 15, 2009 and will supersede all then existing non-SEC accounting
and reporting standards. The guidance is not intended to change or alter
existing U.S. GAAP and will only impact references to accounting guidance.
Accordingly, we have removed references to legacy U.S. GAAP in our publicly
issued consolidated financial statements, starting with the accompanying
financial statements and disclosures for the period ended September 30,
2009.
|
(2)
|
Investments
|
MACC
adopted guidance for fair value measurements on October 1, 2008. In
part, this guidance defines fair value, establishes a framework for measuring
fair value and expands disclosures about assets and liabilities measured at fair
value. The guidance establishes a hierarchal disclosure framework
which prioritizes and ranks the level of market price observability used in
measuring investments at fair value. Market price observability is affected by a
number of factors, including the type of investment and the characteristics
specific to the investment. Investments with readily available active quoted
prices or for which fair value can be measured from actively quoted prices
generally will have a higher degree of market price observability and a lesser
degree of judgment used in measuring fair value.
Investments
measured and reported at fair value are classified and disclosed in one of the
following categories:
Level I –
Quoted prices are available in active markets for identical investments as of
the reporting date. The type of investments included in Level 1 include listed
equities and listed derivatives.
Level II
– Pricing inputs to the valuation methodology include quoted prices for similar
assets and liabilities in active markets, and inputs that are observable for the
asset or liability, either directly or indirectly, for substantially the full
term of the financial instruments. Level 2 inputs are in those markets for which
there are few transactions, the prices are not current, little public
information exists or instances where prices vary substantially over time or
among brokered market makers.
25
NOTES TO FINANCIAL STATEMENTS CONTINUED…
SEPTEMBER 30, 2009
AND
2008
Investments
which are generally included in this category include corporate debt and less
liquid and restricted equity securities.
Level III
– Pricing inputs are unobservable for the investments and includes situations
where there is little, if any, market activity for the investment. The inputs
into the determination of fair value require significant management judgment or
estimation and are based on the Board of Director’s own assumptions about the
assumptions that a market participant would use, including inputs derived from
extrapolation and interpolation that are not corroborated by observable market
data. Investments that are included in this category generally
include corporate private equity.
In
certain cases, the inputs used to measure fair value may fall into different
levels of the fair value hierarchy. In such cases, the determination of which
category within the fair value hierarchy is appropriate for any given investment
is based on the lowest level of input that is significant to the fair value
measurement. MACC’s assessment of the significance of a particular input to the
fair value measurement in its entirety requires judgment and considers factors
specific to the investment.
All of
MACC’s investments at September 30, 2009 were classified and disclosed under the
Level III category. Investments are stated at fair value as
determined by the Board of Directors according to the procedures of MACC’s
Valuation Policy. Securities are valued individually and in the
aggregate as of the end of each quarter of each fiscal year and as of the end of
each fiscal year. Interest-bearing securities are valued in an amount
not greater than cost, with adjustments to their carrying value made to reflect
changes in interest rates. Loan valuation determinations take into
account portfolio companies’ financial condition, outlook, payment histories and
other factors. Equity security valuations take into account the
following factors, among others: the portfolio company’s performance, the
prospects of a portfolio company’s future equity financing and the character of
participants in such financing, and the utilization of various financial
measures, including cash flow multiples, as appropriate. If a
portfolio company appears likely to discontinue operations, a liquidation
valuation technique may be employed. The Board of Directors also
considers credit market conditions, and the risks and uncertainties associated
with those conditions in determining the values of its portfolio
securities. Valuations established by the Board of Directors are not
necessarily indicative of amounts which may ultimately be realized as a result
of future sales or other dispositions of portfolio assets, and these favorable
or unfavorable differences could be material.
Loans and
investments in portfolio securities include debt and equity securities in small
business concerns located throughout the continental United States, with a
concentration in the Midwest. MACC determined that the fair value of its
portfolio securities was $11,775,272 at September 30, 2009.
The
following table presents the investments at fair value as of September 30, 2009
by type of investment:
|
Fair
Value Based on
|
Corporate
Private Debt
|
Corporate
Private Equity
|
Total
|
||||
|
Investment
Level III
|
$ 7,111,912
|
$ 4,663,360(1)
|
100%
|
||||
(1) represents $3,074,045 in
preferred shares; $817,925 in common shares; and $771,390 in membership
interests.
26
NOTES TO FINANCIAL STATEMENTS CONTINUED…
SEPTEMBER 30, 2009
AND
2008
The
following table provides a rollforward in the changes in fair value during year
ending September 30, 2009 for all investments which MACC has determined using
unobservable (Level III) factors.
|
For
the year ended September 30, 2009
|
Total
|
||||
|
Balance,
October 1, 2008
|
$14,501,851
|
||||
|
Purchases
(Debt Repayment)
|
|||||
|
Central
Fiber Corporation
|
($258,222)
|
||||
|
Handy
Industries, LLC
|
100,565
|
||||
|
Linton
Truss Corporation
|
21
|
||||
|
MainStream
Data, Inc.
|
(100,057)
|
||||
|
Morgan
Ohare, Inc.
|
(57,292)
|
||||
|
Portrait
Displays, Inc.
|
(81,575)
|
||||
|
SMWC
Acquisition Co., Inc
|
(73,425)
|
||||
|
Superior
Holding, Inc.
|
39,000
|
||||
|
Warren
Family Funeral Homes, Inc.
|
(12)
|
||||
|
Total
Purchases (Debt Repayment)
|
(430,997)
|
||||
|
UnRealized
Gain (Loss)
|
|||||
|
Handy
Industries, LLC
|
(667,327)
|
||||
|
Kwik-Way
Products, Inc.
|
(768,610)
|
||||
|
MainStream
Data, Inc.
|
(99,992)
|
||||
|
Phonex
Broadband Corporation
|
(1,155,000)
|
||||
|
TotaTotal
Realized Gain (Loss)
|
(2,690,929)
|
||||
|
Un
rUnrealized Gain (Loss)
|
|||||
|
Aviation
Manufacturing Group, LLC
|
(24,520)
|
||||
|
Detroit
Tool Metal Products Co.
|
(321,973)
|
||||
|
Feed
Management Systems, Inc.
|
39,641
|
||||
|
Handy
Industries, LLC
|
215,877
|
||||
|
Kwik-Way
Products, Inc.
|
768,610
|
||||
|
Linton
Truss Corporation
|
(115,000)
|
||||
|
M.A.
Gedney Company
|
(145,999)
|
||||
|
Magnum
Systems, Inc.
|
(250,000)
|
||||
|
MainStream
Data, Inc.
|
(24,951)
|
||||
|
Morgan
Ohare, Inc.
|
(216,667)
|
||||
|
Phonex
Broadband Corporation
|
1,154,999
|
||||
|
Portrait
Displays, Inc.
|
324,050
|
||||
|
Pratt-Read
Corporation
|
(905,576)
|
||||
|
Spectrum
Products, LLC
|
432,706
|
||||
|
Superior
Holding, Inc.
|
(335,850)
|
||||
|
Warren
Family Funeral Homes, Inc.
|
(200,000)
|
||||
|
Total
Unrealized Gain (Loss)
|
395,347
|
||||
|
Balance,
September 30, 2009
|
$11,775,272
|
||||
|
The
The amount of total gains (losses) for the period included on the
statement of operations attributable to changes in unrealized gains/losses
relating to investments still held at the reporting date.
|
$395,347
|
||||
Total
unrealized gains and losses recorded for Level III investments are reported in
Net Change in Unrealized Loss in the Statements of Operations.
27
NOTES TO FINANCIAL STATEMENTS CONTINUED…
SEPTEMBER 30, 2009
AND
2008
INVESTMENT CONCENTRATIONS
At
September 30, 2009, the Company has aggregate investments in 14 Portfolio
Companies and approximately 60% of the aggregate fair value of such investments
was senior subordinated debt and 40% was in equity instruments. The
following table outlines the Company’s investment by type at September 30, 2009
and 2008.
|
September 30, 2009
|
September 30, 2008
|
|||
|
Cost
|
Fair
Value
|
Cost
|
Fair
Value
|
|
|
Senior
Subordinated Debt
|
7,949,900
|
7,111,912
|
9,597,790
|
8,391,261
|
|
Preferred
Equity Securities
|
4,686,768
|
3,074,045
|
5,939,895
|
2,468,610
|
|
Common
Equity Securities
|
1,681,849
|
817,925
|
1,901,401
|
2,846,421
|
|
Membership
Interests
|
390
|
771,390
|
1,747
|
795,559
|
MACC
acquired its portfolio securities by direct purchase from the issuers under
investment representation and values the securities on the premise that, in most
instances, they may not be sold without registration under the Securities Act of
1933. The price of securities purchased was determined by direct negotiation
between MACC and the seller. All portfolio securities are considered to be
restricted in their disposition and illiquid at September 30, 2009 and
2008.
|
(3)
|
NOTES PAYABLE
|
MACC has
a term loan in the amount of $4,618,659 with Cedar Rapids Bank & Trust
Company as of September 30, 2009. This note is a variable interest
rate note secured by a Security Agreement, Commercial Pledge Agreement and a
Master Business Loan Agreement. The interest rate fluctuates daily
and is the greater of the Wall Street Journal prime rate plus 0.5% or
6.0%. The interest rate on the note at September 30, 2009 was
6.0%. The note has a stated maturity of March 31, 2010.
During
the year ended September 30, 2008, MACC had a term loan in the amount of
$4,750,405 with Cedar Rapids Bank & Trust Company. The note was a
variable interest rate note secured by a Security Agreement, Commercial Pledge
Agreement and a Master Business Loan Agreement. The interest rate on
the note at September 30, 2008 was 6.0%. The note has a stated
maturity of August 28, 2009.
|
(4)
|
INCOME TAXES
|
Income
tax expense differed from the amounts computed by applying the United States
federal income tax rate of 34% to pretax loss due to the following (rounded to
thousands):
|
2009
|
2008
|
2007
|
||||||||||
|
Computed
“expected” tax expense
|
$ | (914,000 | ) | (369,000 | ) | (57,000 | ) | |||||
|
Increase
(reduction) in income taxes resulting from:
|
||||||||||||
|
Nontaxable
dividend income
|
(26,000 | ) | (59,000 | ) | (24,000 | ) | ||||||
|
Expiration
of Federal Net Operating Losses Unused
|
--- | 1,824,000 | --- | |||||||||
|
Decrease
in excess tax accrual
|
--- | --- | (70,000 | ) | ||||||||
|
Change
in the beginning of the period valuation allowance for
deferred tax
assets
|
940,000 | (1,396,000 | ) | 81,000 | ||||||||
|
Income
tax expense / (benefit)
|
$ | --- | --- | (70,000 | ) | |||||||
28
NOTES TO FINANCIAL STATEMENTS CONTINUED…
SEPTEMBER 30, 2009
AND
2008
The tax
effects of temporary differences that give rise to significant portions of the
deferred tax assets at September 30, 2009 and 2008 are as follows (rounded to
thousands):
|
2009
|
2008
|
|||||||
|
Deferred
tax assets:
|
||||||||
|
Net
operating and capital loss carryforwards
|
$ | 7,953,000 | 6,618,000 | |||||
|
Unrealized
depreciation on investments
|
1,460,000 | 1,588,000 | ||||||
|
Other
|
586,000 | 659,000 | ||||||
|
Total
gross deferred tax assets
|
9,999,000 | 8,865,000 | ||||||
|
Less
valuation allowance
|
(9,451,000 | ) | (8,382,000 | ) | ||||
|
Net
deferred tax assets
|
548,000 | 483,000 | ||||||
|
Deferred
tax liabilities:
|
||||||||
|
Equity
investments
|
(427,000 | ) | (362,000 | ) | ||||
|
Other
assets received in lieu of cash
|
(121,000 | ) | (121,000 | ) | ||||
|
Net
deferred tax assets
|
$ | --- | --- | |||||
The net
change in the total valuation allowance for the year ended September 30, 2009
was an increase of $1,069,000 as compared with $522,000 at the year ended
September 30, 2008. In assessing the realizability of deferred tax assets,
management considers whether it is more likely than not that some portion or all
of the deferred tax assets will not be realized. The ultimate realization of
deferred tax assets is dependent upon the generation of future taxable income
during the periods in which those temporary differences become deductible.
Management considers projected future taxable income and tax planning strategies
in making this assessment. In order to fully realize the gross deferred tax
assets, MACC will need to generate future taxable income of approximately $20
million prior to the expiration of the loss carryforwards in
2008-2025.
At
September 30, 2009, MACC has net operating and capital loss carryforwards for
federal income tax purposes of approximately $20 million, which are available to
offset future federal taxable income, if any, through 2025. At
September 30, 3008 MACC had approximately $16.5 million in net operating and
capital loss carryforwards. Approximately $7.6 million of the
carryforwards are available for the year ending September 30, 2010, of which
approximately $0.4 million are projected to expire unused at September 30,
2010.
The
Company files income tax returns in the U.S. federal jurisdiction, and
approximately three state jurisdictions. Tax years ending September
30 of 2008, 2007, and 2006 are currently open for examination by federal and
state tax authorities.
The
Company has no unrecognized tax benefits as of September 30,
2009. The Company does not believe that the amount of unrecognized
tax benefits will significantly increase within the next 12 months.
|
(5)
|
MANAGEMENT AGREEMENTS
|
|
|
(a)
|
Eudaimonia
|
MACC
entered into an investment advisory agreement (the “Agreement”) with Eudaimonia
Asset Management, LLC (“EAM”) on April 29, 2008. The management fee
is equal to an annual rate of 2.0% of Assets Under Management (as defined in the
Agreement), payable in arrears. In April, 2009, EAM elected to reduce
their fee to 1.5% and additionally in May, 2009, to reduce their fee to 1.0%
until further notice. In addition to the management fee, MACC
contracted to pay an incentive fee of 13.4% of Net Capital Gains on Existing
Portfolio Companies (as defined in the Agreement) and an incentive fee of 20.0%
of Net Capital Gains on New Portfolio Companies (as defined in the Agreement),
before taxes. The Agreement may be terminated by either party upon
sixty days’ written notice. Total management fees under the Agreement amounted
to $81,525 for the year ended September 30, 2009 and $32,921 for the year ended
September 30, 2008. There were $0 incentive fees paid under the Agreement in
2009 and 2008.
29
NOTES
TO FINANCIAL STATEMENTS CONTINUED…
SEPTEMBER 30, 2009
AND
2008
|
|
(b)
|
InvestAmerica
|
MACC and
EAM entered into an investment sub-advisory agreement (the “Subadvisory
Agreement”) with InvestAmerica on April 29, 2008. The management fee
(as defined in the SubadvisoryAgreement) is equal to 50% of the management fee
actually paid by MACC to EAM attributable to Existing Portfolio Companies,
payable in arrears. EAM elected to reduce their fees, however InvestAmerica
continues to receive a management fee equal to 50% of the original agreement or
an annual rate of 1% of Assets under Management attributable to Existing
Portfolio Companies. The Subadvisory Agreement may be terminated by any party
upon sixty days’ written notice. Total management fees paid to InvestAmerica
amounted to $142,279 for the year ended September 30, 2009 and $98,763 for the
year ended September 30, 2008. There were $0 incentive fees paid under the
Subadvisory Agreement for the year ended September 30, 2009 and $232,499 for the
year ended September 30, 2008.
|
(6)
|
Commitments and
Contingencies
|
As of
September 30, 2009, the Company was not party to any signed and non-binding term
sheets for potential investments.
|
(7)
|
Subsequent
events
|
The
Company evaluated all events that have occurred subsequent to September 30, 2009
through the date of the filing of this Annual Report on December 28,
2009.
30
NOTES TO FINANCIAL STATEMENTS CONTINUED…
SEPTEMBER 30, 2009
AND
2008
(8) FINANCIAL HIGHLIGHTS
The
Company has presented the following disclosures pertaining to common
stockholders, as required by the AICPA Audit and Accounting Guide for Investment
Companies, for the years ended September 30:
|
2009
|
2008
|
2007
|
2006
|
2005
|
||||||||||||||||
|
Per
Share Operating Performance
(For
a share of capital stock outstanding
throughout
the period):
Net
asset value, beginning of period
|
$ | 4.23 | 4.67 | 4.71 | 5.54 | 4.61 | ||||||||||||||
|
Income
from investment operations:
|
||||||||||||||||||||
|
Investment
expense, net
|
(0.23 | ) | (0.18 | ) | (0.32 | ) | (0.48 | ) | (0.75 | ) | ||||||||||
|
Net
realized and unrealized (loss)
|
||||||||||||||||||||
|
gain
on investment transactions
|
(0.83 | ) | (0.26 | ) | 0.28 | (0.35 | ) | 1.80 | ||||||||||||
|
Conversion
of note payable and accrued
interest
to shares of common stock
|
--- | --- | --- | --- | (0.12 | ) | ||||||||||||||
|
Total
from investment operations
|
(1.06 | ) | (0.44 | ) | (0.04 | ) | (0.83 | ) | 0.93 | |||||||||||
|
Net
asset value, end of period
|
$ | 3.17 | 4.23 | 4.67 | 4.71 | 5.54 | ||||||||||||||
|
Closing
market price
|
$ | 0.80 | 1.36 | 2.45 | 1.78 | 2.57 | ||||||||||||||
| 2009 | 2008 | 2007 | 2006 | 2005 | ||||||||||||||||
|
Total
return
|
||||||||||||||||||||
|
Net
asset value basis (1)(2)
|
(25.16 | ) % | (9.42 | ) | (0.84 | ) | (14.98 | ) | 27.26 | |||||||||||
|
Market
price basis
|
(41.18 | ) % | (44.49 | ) | 37.64 | (30.74 | ) | (25.51 | ) | |||||||||||
|
Net
asset value, end of period
(in
thousands)
|
$ | 7,809 | 10,435 | 11,521 | 11,618 | 13,665 | ||||||||||||||
|
Ratio
to average net assets:
|
||||||||||||||||||||
|
Investment
(expense) income, net (1)(2)
|
(6.09 | ) % | (4.12 | ) | (6.71 | ) | (8.53 | ) | (15.81 | ) | ||||||||||
|
Operating
and income tax expense (1)(2)
|
12.29 | % | 12.92 | 15.22 | 18.46 | 37.86 | ||||||||||||||
(1) MACC’s investment
advisor, EAM elected to voluntarily waive its management fees during April
through September, 2009. Due to the election, the investment advisor
voluntarily waived $60,753 as of September 30, 2009. The effects of
the waiver as of September 30, 2009 would be, total return on net assets value
basis would be 25.74%; the investment (expense) income, net ratio would be
(6.75%); and the operating and income expense ratio would be
12.97%.
(2)
MorAm’s investment advisor agreed to a waive management fees during March and
April 2005. Due to the agreement, the investment advisor voluntarily
waived $103,867 as of September 30, 2005. Excluding the effects of
the waiver as of September 30, 2005, total return on a net assets value basis
would be 26.29%; the investment (expense) income, net ratio would be
(16.80)%; and the operating and income expense ratio would be
38.96%. EAM has voluntarily waived its management fees during the
year ended September 30, 2009.
The
ratios of investment (expense) income, net to average net assets, of operating
and income tax expenses to average net assets and total return are calculated
for common stockholders as a class. Total return, which reflects the
annual change in net assets, was calculated using the change in net assets
between the beginning and end of the year. An individual common
stockholder’s return may vary from these returns.
31
NOTES TO FINANCIAL STATEMENTS CONTINUED…
SEPTEMBER 30, 2009
AND
2008
(9) SELECTED QUARTERLY DATA (unaudited)
|
2009
|
||||
|
4th
Quarter
|
3rd
Quarter
|
2nd
Quarter
|
1st
Quarter
|
|
|
Total
Investment Income
|
$141,403
|
$152,445
|
$81,763
|
$211,379
|
|
Interest
Expense
|
74,647
|
85,745
|
70,895
|
72,507
|
|
Management
and Professional Fees
|
127,877
|
95,909
|
184,686
|
132,171
|
|
Other
Expenses
|
95,008
|
70,903
|
64,731
|
88,721
|
|
Tax
Expense (benefit)
|
(156,129)
|
(100,112)
|
(238,549)
|
(82,020)
|
|
Net
gain (loss) on investments
|
(91,979)
|
(1,075,523)
|
(1,150,381)
|
269,100
|
|
Net
Change in Net Assets from Operations
|
(248,108)
|
(1,175,635)
|
(1,175,635)
|
187,080
|
|
Net
Change in Net Assets from Operations per Share
|
$(0.10)
|
$(0.48)
|
$(0.56)
|
$0.08
|
|
Net
Asset Value per Share
|
$3.17
|
$3.27
|
$3.75
|
$4.31
|
|
2008
|
||||
|
4th
Quarter
|
3rd
Quarter
|
2nd
Quarter
|
1st
Quarter
|
|
|
Total
Investment Income
|
$219,400
|
$281,861
|
$194,298
|
$260,004
|
|
Interest
Expense
|
77,871
|
93,377
|
108,812
|
128,115
|
|
Management
and Professional Fees
|
118,538
|
174,370
|
262,105
|
122,684
|
|
Other
Expenses
|
71,579
|
94,274
|
94,865
|
56,764
|
|
Tax
Expense (benefit)
|
(48,588)
|
(80,160)
|
(271,484)
|
(47,559)
|
|
Net
gain (loss) on investments
|
(339,926)
|
611,097
|
(187,855)
|
(721,354)
|
|
Net
Change in Net Assets from Operations
|
(388,514)
|
530,937
|
(459,339)
|
(768,913)
|
|
Net
Change in Net Assets from Operations per Share
|
$(0.16)
|
$0.21
|
$(0.18)
|
$(0.31)
|
|
Net
Asset Value per Share
|
$4.23
|
$4.39
|
$4.18
|
$4.36
|
(10) PORTFOLIO CHANGES DURING THE YEAR
|
ADDITIONS
TO PREVIOUS INVESTMENTS
|
DISPOSITIONS
|
|||||||||||
|
Amount
Invested
|
Cost
|
Amount
Received
|
||||||||||
|
Handy
Industries, LLC
|
$
|
100,565
|
Central
Fiber Corporation
|
$
|
258,222
|
$
|
272,412
|
|||||
|
Linton
Truss Corporation
|
21
|
Mainstream
Data, Inc.
|
200,049
|
100,057
|
||||||||
|
Superior
Holding, Inc.
|
39,000
|
Warren
Family Funeral Homes, Inc.
|
12
|
231,001
|
||||||||
|
|
||||||||||||
| $ | 139,586 | $ | 458,283 |
$
|
603,470 | |||||||
| REPAYMENTS RECEIVED | $ | 213,912 | ||||||||||
32
SCHEDULE OF INVESTMENTS
SCHEDULE 1 - SEPTEMBER 30, 2009
|
Manufacturing:
|
|||||||||||||
|
Company
|
Security
|
Percent
of
Net assets
|
Value
|
Cost
(d)
|
|||||||||
|
Aviation
Manufacturing Group, LLC (a)
|
14%
debt security, due October 1, 2010 (c)
|
$ | 616,000 | 616,000 | |||||||||
|
Yankton,
South Dakota
|
154,000
units preferred
|
154,000 | 154,000 | ||||||||||
| Manufacturer of flight critical parts | Membership interest | 771,039 | 39 | ||||||||||
|
for
aircraft
|
14%
note, due October 1, 2010
|
77,000 | 77,000 | ||||||||||
| 1,618,039 | 847,039 | ||||||||||||
|
Detroit
Tool Metal Products Co. (a)
|
12%
debt security, due November 18, 2009
|
1,371,507 | 1,371,507 | ||||||||||
|
Lebanon,
Missouri
|
19,853.94
shares Series A preferred (c)
|
---- | 195,231 | ||||||||||
|
Metal
stamping
|
7,887.17
shares common (c)
|
---- | 126,742 | ||||||||||
| 1,371,507 | 1,693,480 | ||||||||||||
|
Handy
Industries, LLC (a)
|
1,015.79
units Class A1 preferred (c)
|
67,042 | 269,093 | ||||||||||
|
Marshalltown,
Iowa
|
|||||||||||||
|
Manufacturer
of lifts for
|
|
||||||||||||
|
motorcycles,
trucks and
|
|||||||||||||
|
industrial
metal products
|
|
||||||||||||
|
Linton
Truss Corporation
|
542.8
common shares (c)
|
---- | ---- | ||||||||||
|
Delray
Beach, Florida
|
400
shares Series 1 preferred (c)
|
75,000 | 40,000 | ||||||||||
|
Manufacturer
of residential roof and floor truss systems
|
Warrants
to purchase common shares (c)
|
36 | 36 | ||||||||||
| 75,036 | 40,036 | ||||||||||||
|
M.A.
Gedney Company (a)
|
648,783
shares preferred (c)
|
---- | 1,450,601 | ||||||||||
|
Chaska,
Minnesota
|
12%
debt security, due June 30, 2012
|
1 | 76,000 | ||||||||||
|
Pickle
Processor
|
Warrant
to purchase 83,573 preferred shares (c)
|
---- | ---- | ||||||||||
| 1 | 1,526,601 | ||||||||||||
|
Magnum
Systems, Inc. (a)
|
12%
debt security, due November 1, 2011
|
574,163 | 574,163 | ||||||||||
|
Parsons,
Kansas
|
48,038
common shares (c)
|
48,038 | 48,038 | ||||||||||
| Manufacturer of industrial bagging | 292,800 shares preferred (c) | 304,512 | 304,512 | ||||||||||
|
equipment
|
Warrant
to purchase 56,529 common shares (c)
|
330,565 | 565 | ||||||||||
| 1,257,278 | 927,278 | ||||||||||||
| Pratt-Read Corporation (a) | 13,889 shares Series A Preferred (c) | ---- | 750,000 | ||||||||||
| Bridgeport, Connecticut | 7,718 shares Services A preferred (c) | ---- | 416,667 | ||||||||||
| Manufacturer of screwdriver shafts | 13% debt security, due January 7, 2009 (c) | 1 | 277,800 | ||||||||||
| and handles and other hand tools | Warrants to purchase common shares (c) | ---- | ---- | ||||||||||
| 1 | 1,444,467 | ||||||||||||
| Spectrum Products, LLC (b) | 13% debt security, due January 1, 2011 (c) | 1,077,649 | 1,077,649 | ||||||||||
| Missoula, Montana | 385,000 units Series A preferred (c) | 385,000 | 385,000 | ||||||||||
| Manufacturer of equipment for the | Membership interest (c) | 351 | 351 | ||||||||||
| swimming pool industry | 35,073.50 units Class B preferred (c) | 47,355 | 47,355 | ||||||||||
| 1,510,355 | 1,510,355 | ||||||||||||
33
SCHEDULE OF INVESTMENTS CONTINUED…
SCHEDULE 1 - SEPTEMBER 30, 2009
|
Manufacturing
Continued:
|
|||||||||||||||||
|
Company
|
Security
|
Percent
of
Net
assets
|
Value
|
Cost (d) |
|
||||||||||||
|
Superior
Holding, Inc.
|
6%
debt security, due April 1, 2010 (c)
|
568,727 | 780,000 | ||||||||||||||
|
Wichita,
Kansas
|
Warrant
to purchase 11,143 common shares (c)
|
1 | 1 | ||||||||||||||
|
Manufacturer
of industrial and
|
6%
debt security, due April 1, 2010 (c)
|
221,000 | 221,000 | ||||||||||||||
|
commercial
boilers and shower
|
121,457
common shares (c)
|
---- | 121,457 | ||||||||||||||
|
doors,
frames and enclosures
|
6%
debt security, due April 1, 2010 (c)
|
308,880 | 308,880 | ||||||||||||||
|
312,000
common shares (c)
|
---- | 3,120 | |||||||||||||||
|
19%
debt security, January 31, 2010 (c)
|
39,000 | 39,000 | |||||||||||||||
| 1,137,608 | 1,473,458 | ||||||||||||||||
|
Total
manufacturing
|
60% | 7,036,867 | 9,731,807 | ||||||||||||||
|
Service:
|
|||||||||||||||||
|
Monitronics
International, Inc.
|
73,214
common shares (c)
|
439,284 | 54,703 | ||||||||||||||
|
Dallas,
Texas
|
|||||||||||||||||
|
Provides
home security systems monitoring services
|
|||||||||||||||||
|
Morgan
Ohare, Inc. (b)
|
0%
debt security, due January 1, 2010 (c)
|
900,000 | 1,125,000 | ||||||||||||||
|
Addison,
Illinois
|
10%
debt security, due January 1, 2010
|
191,666 | 239,583 | ||||||||||||||
|
Fastener
plating and heat treating
|
57
common shares (c)
|
1 | 1 | ||||||||||||||
| 1,091,667 | 1,364,584 | ||||||||||||||||
|
SMWC
Acquisition Co., Inc. (a)
Kansas
City, Missouri
Steel
warehouse distribution and
processing
|
13%
debt security due September 30, 2011
|
68,750 | 68,750 | ||||||||||||||
|
12%
debt security due September 30, 2011
|
412,500 | 412,500 | |||||||||||||||
| 481,250 | 481,250 | ||||||||||||||||
|
|
|||||||||||||||||
|
Total Service
|
17% | 2,012,201 | 1,900,537 | ||||||||||||||
|
Technology
and Communications:
|
|||||||||||||||||
|
Feed
Management Systems, Inc. (a)
|
540,551
common shares (c)
|
---- | 1,327,186 | ||||||||||||||
|
Brooklyn
Center, Minnesota
|
674,309
shares Series A preferred (c)
|
2,041,136 | 674,309 | ||||||||||||||
|
and
B2B internet services
|
2,041,136 | 2,001,495 | |||||||||||||||
|
Portrait
Displays, Inc.
|
10%
debt security, due April 1, 2012
|
685,068 | 685,068 | ||||||||||||||
|
Pleasanton,
California
|
Warrant
to purchase 39,400 common shares (c)
|
---- | ---- | ||||||||||||||
|
Designs
and markets pivot enabling
|
685,068 | 685,068 | |||||||||||||||
|
software
for LCD computer monitors
|
|||||||||||||||||
|
Total
technology and communications
|
23% | 2,726,204 | 2,686,563 | ||||||||||||||
| $ | 11,775,272 | 14,318,907 | |||||||||||||||
SEE ACCOMPANYING NOTES TO SCHEDULE OF
INVESTMENTS.
34
SCHEDULE OF INVESTMENTS CONTINUED…
SCHEDULE 1 - SEPTEMBER 30, 2009
(a) Affiliated
company. Represents ownership of greater than 5% to 25% of the
outstanding voting securities of the issuer, and is or was an affiliate of MACC
Private Equities Inc. as defined in the Investment Company Act of 1940 at or
during the period ended September 30, 2009. Transactions during the
period in which the issuers were affiliated companies are as
follows:
|
Description
|
Beginning
Cost
|
Purchases
|
Sales
|
Ending
Cost
|
Dividend
Income
|
Interest
Income
|
Net
Realized Gains/Losses
|
|
|
Aviation
Manufacturing Group, LLC
|
$
|
847,039
|
---
|
---
|
847,039
|
51,550
|
97,020
|
---
|
|
Detroit
Tool Metal Products Co.
|
1,693,480
|
---
|
---
|
1,693,480
|
---
|
26,529
|
---
|
|
|
Feed
Management Systems, Inc.
|
2,001,495
|
---
|
---
|
2,001,495
|
---
|
---
|
---
|
|
|
Handy
Industries, LLC
|
835,855
|
100,565
|
667,327
|
269,093
|
---
|
---
|
(667,327)
|
|
|
Kwik-Way
Products, Inc.
|
768,610
|
---
|
768,610
|
---
|
---
|
---
|
(768,610)
|
|
|
M.A.
Gedney Company
|
1,526,601
|
---
|
---
|
1,526,601
|
---
|
(21,609)
|
---
|
|
|
Magnum
Systems, Inc.
|
927,278
|
---
|
---
|
927,278
|
109,624
|
68,899
|
---
|
|
|
MainStream
Data, Inc.
|
200,049
|
---
|
200,049
|
---
|
---
|
---
|
(99,992)
|
|
|
Pratt-Read
Corporation
|
1,444,467
|
---
|
---
|
1,444,467
|
---
|
---
|
---
|
|
|
SMWC
Acquisition Co., Inc
|
554,675
|
---
|
73,425
|
481,250
|
---
|
61,537
|
---
|
|
|
Superior
Holding, Inc.
|
1,434,458
|
39,000
|
---
|
1,473,458
|
---
|
4,411
|
---
|
|
|
Total
|
$
|
12,234,007
|
139,565
|
1,709,411
|
10,664,161
|
161,174
|
236,787
|
(1,535,929)
|
(b)
Controlled company. Represents ownership of greater than 25% of the
outstanding voting securities of the issuer, and is or was a controlled
affiliate of MACC as defined in the Investment Company Act of 1940 at or during
the period ended September 30, 2009. Transactions during the period
in which the issuers were controlled affiliates are as follows:
|
Description
|
Beginning
Cost
|
Purchase
Cost
|
Sales
Cost
|
Ending
Cost
|
Dividend
Income
|
Interest
Income
|
Net
Realized Gains/Losses
|
|||||||||||||||||||||
|
Morgan
Ohare, Inc.
|
$ | 1,421,876 | --- | 57,292 | 1,364,584 | --- | 24,957 | --- | ||||||||||||||||||||
|
Spectrum
Products, LLC
|
1,510,355 | --- | --- | 1,510,355 | 26,766 | --- | --- | |||||||||||||||||||||
|
Total
|
$ | 2,932,231 | --- | 57,292 | 2,874,939 | 26,766 | 24,957 | --- | ||||||||||||||||||||
(c)
Presently nonincome producing.
(d) For
all debt securities presented, the cost is equal to the principal
balance.
Notes to SCHEDULE OF INVESTMENTS
(A) For
investments held at the February 15, 1995 fresh-start date, the stated cost
represents the fair value at the fresh-start date.
(B) At
September 30, 2009, all securities are considered to be restricted in their
disposition and are stated at what the Board of Directors considers to be fair
value.
(C) At
September 30, 2009, the cost of securities for federal income tax purposes was
$13,897,452, and the aggregate unrealized appreciation/depreciation (including
other basis differences) based on that cost was:
|
Unrealized
appreciation
|
$ | 1,634,049 | ||
|
Unrealized
depreciation
|
(3,831,092 | ) | ||
|
Net
unrealized depreciation
|
$ | (2,197,043 | ) |
35
Notes to SCHEDULE OF INVESTMENTS CONTINUED…
SCHEDULE 1 - SEPTEMBER 30, 2009
(D)
MACC owns a portfolio which includes investments in restricted securities of
small businesses. Within this portfolio, eight of these restricted securities
include registration rights and six of these restricted securities do not
include registration rights. Within the eight securities that include
registration rights, the actual rights include the following general
characteristics:
1. The
securities generally provide for demand rights as follows:
a.
The demand rights may only be required from a low of 25% of the security holders
to a high of a majority of the security holders.
b.
The security holders may require from one to two demand
registrations.
c. The small businesses are generally only required to use “best efforts” to
comply with the demands.
2. The securities generally allow the security holders
to register securities if the small business registers its securities, i.e.
“piggyback rights.”
a.
Piggyback rights generally may be accessed by individual security
holders.
b.
Under piggyback rights, the small business and its investment bankers are only
required to use best efforts to comply with the right.
3. The Company expects that, in general, the securities
that they will acquire in the future will include demand and piggyback
rights.
36
SHAREHOLDER INFORMATION
(UNAUDITED)
|
|
§
|
Stock Transfer
Agent
|
Mellon
Investor Services LLC, 480 Washington Blvd, Jersey City, New Jersey 07310
(telephone (800) 288-9541 and (800) 231-5469 (TDD), www.melloninvestor.com,
and shrrelations@mellon.com)
serves as transfer agent and registrar for MACC's common
stock. Certificates to be transferred should be mailed directly to
the transfer agent, preferably by registered mail.
|
|
§
|
Shareholders
|
MACC had
approximately 1,723 record holders of its common stock at November 30,
2009.
|
|
§
|
Dividends
|
MACC has
no history of paying cash dividends and during fiscal year 2009 MACC did not
declare a dividend payment. The payment of dividends, if any, in the
future is within the discretion of the Board of Directors and will depend upon
MACC's earnings, capital requirements, financial condition and other relevant
factors. MACC does not presently have any type of dividend
reinvestment plan.
|
|
§
|
Market
Prices
|
The
common stock of MACC is traded on the over-the-counter market through the
National Association of Securities Dealers Automated Quotation (“NASDAQ”)
Capital Market under the symbol “MACC.” At the close of business
on October 31, 2009, the bid price for shares of MACC's common stock was
$0.82. The following high and low bid quotations for the shares
during each quarterly period ended on the date shown below of MACC's fiscal
years 2009 and 2008 were taken from quotations provided to MACC by the
NASDAQ:
|
High
|
Low
|
||
|
September
30, 2007
|
$
|
2.50
|
1.86
|
|
December
31, 2007
|
4.20
|
2.05
|
|
|
March
31, 2008
|
2.77
|
1.42
|
|
|
June
30, 2008
|
2.40
|
1.70
|
|
|
September
30, 2008
|
2.16
|
1.20
|
|
|
December
31, 2008
|
1.46
|
0.50
|
|
|
March
31, 2009
|
0.84
|
0.52
|
|
|
June
30, 2009
|
1.74
|
0.40
|
|
|
September
30, 2009
|
1.15
|
0.65
|
|
Such
over-the-counter market quotations reflect inter-dealer prices without retail
markup, markdown or commission and may not represent actual
transactions.
37
SHAREHOLDER INFORMATION (UNAUDITED) CONTINUED…
|
|
§
|
Performance
Graph
|
The
following graph compares the semi-annual percentage change in cumulative
stockholder return on the Common Stock of MACC since September 30, 2004, with
the cumulative total return over the same period of (i) the NASDAQ Stock
Market Total Return Index (U.S. Companies), and (ii) MACC’s peer group selected
in good faith by MACC and which it composed of the following ten business
development companies or other funds known by MACC to have similar investment
objectives to the Corporation: Ares Capital Corporation (ARCC), Brantley Capital
Corporation (BBDC), Capital Southwest Corp (CSWC), Equus Total Return Inc.
(EQS), Gladstone Investment Corporation (GAIN), Harris & Harris Group, Inc.
(TINY), MVC Capital (MVC), NGP Capital Resources Company (NGPC), Rand
Capital Corp (RAND), and Winfield Capital Corp (WCAP) (the “Peer
Group”).
In the
graph, the comparison assumes $100 was invested on October 1, 2005, in shares of
MACC’s Common Stock and in each of the indices. The comparison is
based upon the closing market bid price for shares of MACC’s Common Stock, and
assumes the reinvestment of all dividends, if any. The returns of
each of the companies in the Peer Group are weighted according to the respective
company’s stock market capitalization at the beginning of each period for which
a return is indicated.
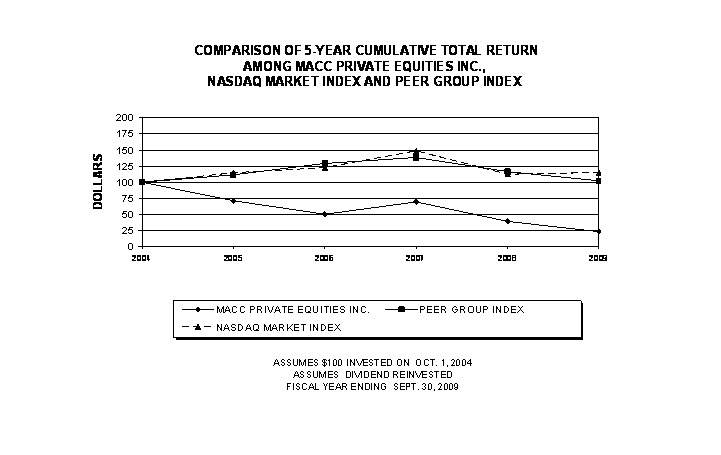
38
Corporate
Information
___________________________________________________________________
|
Fund Manager
|
Subadviser
|
|
Eudaimonia
Asset Management, LLC
|
InvestAmerica
Investment Advisors, Inc.
|
|
Officers
|
||||
|
TRAVIS PRENTICE
President
and CEO
|
MONTIE WEISENBERGER
Senior
Vice President, Treasurer, Secretary
|
DEREK GAERTNER
Vice
President, CFO, CCO
|
||
|
Board of Directors
|
||||
|
MICHAEL W. DUNN –
MANCHESTER, IOWA
President,
Farmers and Merchants Savings Bank, Vice President, Security Savings
Bank
|
JAMES W. EILER –
WEST DES MOINES, IOWA
Principal,
Eiler Capital Advisors, LLC
|
GORDON J. ROTH –
NEWPORT BEACH, CALIFORNIA
Chief
Operating Officer and Chief Financial Officer, Roth Capital Partners,
LLC
|
||
|
Office Locations
|
||||
|
▪
Headquarters
MACC
Private Equities Inc.
Eudaimonia
Asset Management, LLC
580
2nd
Street, Suite 102
Encinitas,
California 92024
(760)
479-5072
|
▪ Regional
Office
MACC
Private Equities Inc.
InvestAmerica
Investment Advisors, Inc.
101
Second Street SE, Suite 800
Cedar
Rapids, Iowa 52401
(319)
363-8249
|
|||
|
Stock Transfer Agent
|
||||
|
Mellon
Investor Services LLC
P.O.
Box 3315 • South Hackensack •
NJ 07606
OR 480 Washington Blvd • Jersey
City • NJ 07310
Phone: (800)
288-9541
Hearing
Impaired Shareholder Number: (800) 231-5469 or (201) 680-6610
Foreign
Shareholder Number: (201) 680-6578
Website:
www.melloninvestor.com
Email
Contact: shrrelations@mellon.com
|
||||
39
MACC PRIVATE EQUITIES INC.
PRIVACY NOTICE
As a
result of Federal legislation, we are required to notify each of our individual
shareholders of record of our policies with regard to privacy of our
shareholders’ personal financial information. Accordingly, we wanted
to take this opportunity to show our dedication to the privacy of the personal
information of our shareholders and to provide a description of our privacy
policies and the procedures we take in order to protect your personal financial
information.
Types
of nonpublic personal information collected:
The only
types of nonpublic personal information that we collect with respect to our
shareholders are the name of each shareholder, the address and telephone number
of each shareholder, the social security number of each shareholder, and the
total number of shares held by each of our shareholders. This
information is gathered only for those shareholders whose shares are registered
in their own names (as opposed to being registered in your broker’s or other
“street” name).
Types
of nonpublic personal information disclosed:
As we
place the privacy of our current and former shareholders’ personal financial
information at a premium, we do not disclose any nonpublic personal information
about our current or former shareholders to anyone, except as may be permitted
by law.
Security
of our nonpublic personal information:
In our
efforts to protect your personal financial information, we restrict access to
nonpublic personal information about you those parties within our company who
need to know the information in order to provide products or services to
you. We maintain physical and procedural safeguards that comply with
federal regulations to guard your nonpublic personal information.
40