Attached files
| file | filename |
|---|---|
| EX-10.5 - EX-10.5 - ALTIGEN COMMUNICATIONS INC | a2195915zex-10_5.htm |
| EX-23.1 - EX-23.1 - ALTIGEN COMMUNICATIONS INC | a2195915zex-23_1.htm |
| EX-31.1 - EX-31.1 - ALTIGEN COMMUNICATIONS INC | a2195915zex-31_1.htm |
| EX-32.1 - EX-32.1 - ALTIGEN COMMUNICATIONS INC | a2195915zex-32_1.htm |
| EX-31.2 - EX-31.2 - ALTIGEN COMMUNICATIONS INC | a2195915zex-31_2.htm |
| EX-32.2 - EX-32.2 - ALTIGEN COMMUNICATIONS INC | a2195915zex-32_2.htm |
| EX-10.14 - EXHIBIT 10.14 - ALTIGEN COMMUNICATIONS INC | a2195915zex-10_14.htm |
Use these links to rapidly review the document
TABLE OF CONTENTS
Item 8. FINANCIAL STATEMENTS AND SUPPLEMENTARY DATA
PART IV
UNITED STATES
SECURITIES AND EXCHANGE COMMISSION
Washington, D.C. 20549
FORM 10-K
| (Mark One) | ||
ý |
ANNUAL REPORT PURSUANT TO SECTION 13 OR 15(d) OF THE SECURITIES EXCHANGE ACT OF 1934 |
|
For the fiscal year ended September 30, 2009 |
||
Or |
||
o |
TRANSITION REPORT PURSUANT TO SECTION 13 Or 15(d) OF THE SECURITIES EXCHANGE ACT OF 1934 |
|
For the transition period from to |
||
Commission file number: 000-27427
ALTIGEN COMMUNICATIONS, INC.
(Exact name of registrant as specified in its charter)
| Delaware (State or other jurisdiction of incorporation or organization) |
94-3204299 (I.R.S. Employer Identification Number) |
|
410 East Plumeria Drive San Jose, CA (Address of principal executive offices) |
95134 (Zip Code)) |
Registrant's telephone number, including area code: (408) 597-9000
Securities registered pursuant to Section 12(b) of the Act:
| Title of Each Class | Name of Each Exchange on Which Registered | |
|---|---|---|
| Common Stock, $0.001 par value, and associated preferred stock purchase rights |
The NASDAQ Capital Market |
Securities registered pursuant to Section 12(g) of the Act: None
Indicate by check mark if the registrant is a well-known seasoned issuer, as defined in Rule 405 of the Securities Act. Yes o No ý
Indicate by check mark if the registrant is not required to file reports pursuant to Section 13 or Section 15(d) of the Act. Yes o No ý
Indicate by check mark whether the registrant (1) has filed all reports required to be filed by Section 13 or 15(d) of the Securities Exchange Act of 1934 during the preceding 12 months (or for such shorter period that the registrant was required to file such reports), and (2) has been subject to such filing requirements for the past 90 days. Yes ý No o
Indicate by check mark if disclosure of delinquent filers pursuant to Item 405 of Regulation S-K is not contained herein, and will not be contained, to the best of the registrant's knowledge, in definitive proxy or information statements incorporated by reference in Part III of this Form 10-K or any amendment to this Form 10-K. o
Indicate by check mark whether the registrant has submitted electronically and posted on its corporate Web site, if any, every Interactive Data File required to be submitted and posted pursuant to Rule 405 of Regulation S-T during the preceding 12 months (or for such shorter period that the registrant was required to submit and post such files). Yes o NO o
Indicate by check mark whether the registrant is a large accelerated filer, an accelerated filer, a non-accelerated filer, or a smaller reporting company. See definitions of "large accelerated filer," "accelerated filer" and "smaller reporting company" in Rule 12b-2 of the Exchange Act. (Check one):
| Large accelerated filer o | Accelerated filer o | Non-accelerated filer o (Do not check if a smaller reporting company) |
Smaller reporting company ý |
Indicate by check mark whether the registrant is a shell company (as defined in Rule 12b-2 of the Exchange Act). Yes o No ý
The aggregate market value of the common stock held by non-affiliates of the registrant was approximately $10,609,541 as of March 31, 2009, based on the closing price of our common stock as reported on The NASDAQ Capital Market on such date. Shares of common stock held by each officer and director and by each person known to own 5% or more of our outstanding common stock have been excluded in that such persons may be deemed to be affiliates. This determination of affiliate status is not necessarily a conclusive determination for other purposes. As of March 31, 2009, there were 15,861,680 shares of our common stock issued and outstanding.
The number of shares outstanding of the registrant's common stock as of December 23, 2009 was 16,299,843.
DOCUMENTS INCORPORATED BY REFERENCE
Certain sections of AltiGen Communications, Inc.'s definitive Proxy Statement for the 2010 Annual Meeting of Stockholders to be held on March 11, 2010 are incorporated by reference in Part III of this Form 10-K to the extent stated herein.
ALTIGEN COMMUNICATIONS, INC.
Form 10-K for the Year Ended September 30, 2009
Note About Forward-Looking Statements
Our disclosure and analysis in this Annual Report on Form 10-K contains some forward-looking statements within the meaning of the Private Securities Litigation Reform Act of 1995, Section 27A of the Securities Act of 1933 and Section 21E of the Securities Exchange Act of 1934. Forward-looking statements give our current expectations or forecasts of future events. You can identify these statements by the fact that they do not relate strictly to historical or current facts. They use words such as "anticipate," "estimate," "expect," "project," "intend," "plan," "believe" and other words and terms of similar meaning in connection with any discussion of future operating or financial performance. These forward-looking statements rely on assumptions, estimates and predictions that could be inaccurate and that are subject to risks and uncertainties that could cause actual results to differ materially. Important factors that may cause our actual results to differ materially from expectations reflected in our forward-looking statements include those described in Item 1A. "Risk Factors." Forward-looking statements speak only as of the date of this report, and we undertake no obligation to update or revise such statements to reflect new circumstances or unanticipated events as they occur.
INTRODUCTION
AltiGen Communications, Inc. (NASDAQ: ATGN) is a pioneer and market leader in Voice over Internet Protocol (VoIP) telephone systems and Unified Communications solutions. We design and manufacture advanced phone systems and call center products that use both the Internet and the public telephone network.
AltiGen Communications, or AltiGen, was founded by current CEO Gilbert Hu in 1994, and the first products began shipping in 1996. Our telephony products are primarily sold to small-to-medium sized businesses, multi-site businesses, corporate branch offices, call centers, credit unions and community banks.
AltiGen's products enable an array of applications like VoIP phones and servers, voicemail, call recording, call activity reporting, and mobility solutions that take advantage of the convergence of voice and data communications to achieve cost reduction. Our systems are designed with an open architecture and are built on an industry standard platform. This adherence to widely-used standards allows our products to integrate with and leverage a company's existing technology investment.
AltiGen's hardware and software products are available from independent authorized resellers and strategic partners. AltiGen's family of telephony solutions has been recognized for excellence with more than 40 industry awards since 1996.
We generated net revenue of $17.4 million with a net loss of $4.7 million during fiscal year 2009. As of September 30, 2009, we had an accumulated deficit of $60.7 million. Net cash used in operating activities was $2.3 million in fiscal year 2009.
Our principal executive office is located at 410 East Plumeria Drive, San Jose, California 95134. Our telephone number is (408) 597-9000. We were incorporated in California in May 1994, and we reincorporated into Delaware in June 1999.
We maintain an Internet website at http://www.altigen.com. Our most recent annual report on Form 10-K and certain of our other filings with the Securities and Exchange Commission (SEC) are available through the Investor Relations section of our website. Our annual reports on Form 10-K, quarterly reports on Form 10-Q, current reports on Form 8-K and other required filings and amendments to these filings are available on the SEC website at http://www.sec.gov, which can be reached from the Investor Relations section of our website. In addition, you may read and copy any
1
material we file with the SEC at the SEC's Public Reference Room at 450 Fifth Street, NW, Washington, DC 20549. You may obtain information on the operation of the Public Reference Room by calling the SEC at 1-800-SEC-0330.
INDUSTRY BACKGROUND
We focus our sales efforts on medium and enterprise sized businesses, multi-site businesses, corporate branch offices, and call centers.
Convergence of Voice and Data
Traditionally, businesses have supported two separate, incompatible networks to handle their communications needs. The first network has been the traditional telephone network, which relies on a technology called "circuit-switching." A circuit-switched network establishes and maintains a dedicated (i.e. not shared) line between calling parties for the duration of a call. The second type of network on which businesses have traditionally relied is a "packet-switched" network, such as an internal local area network or an external network, like the Internet, where voice, video, images or data is divided into small Internet protocol packets of information for transmission that are simultaneously combined with other unrelated packets of information and routed to a final destination where this process is reversed. Packet-switched networks are more efficient than the traditional circuit-switched telephone network, because network paths are not dedicated to a single user, but instead are available to be shared by all users. As a result, network capacity is allocated more efficiently. It is commonplace for networks installed today to be able to support both voice and data usage with Internet protocol packet-switching.
Most telecommunications systems do not address the needs of businesses that need to transmit voice communications over both traditional telephone networks and packet-switching networks. For example, businesses may wish to route internal calls over their existing voice network and route calls between offices over packet-switched networks, all using the same telecommunications system. We believe a significant opportunity exists to provide medium and enterprise sized businesses with an integrated phone system that delivers the benefits of integrated, multi-function telecommunications systems using Internet protocol packet switching networks as well as traditional circuit-switched telephone networks.
THE ALTIGEN PRODUCT OFFERING
AltiGen's VoIP phone systems are designed with an open architecture, built on industry standard Intel-based servers, Session Initiation Protocol ("SIP") based platform, and Microsoft Windows-based applications. This adherence to widely-used standards allows our solutions to both integrate with and leverage a company's existing technology investment. AltiGen's award winning, integrated IP applications suite provides customers with a complete business communications solution. Voicemail, Unified Messaging, Automatic Call Distribution, Call Recording, Call Activity Reporting, and Mobility solutions take advantage of the convergence of voice and data communications to achieve superior business results.
The AltiGen phone systems work with digital, analog and internet protocol trunks, and internet protocol and analog telephone extensions. The systems can be configured with digital, analog or VoIP, or a combination of the three. By allowing the customer to choose what best fits their current and future requirement, we provide a practical and cost effective solution to future growth.
Each system includes a comprehensive voicemail system with over 2,500 hours of storage, 255 auto attendant menus with unlimited levels, automatic call distribution, call detail reporting, call recording on demand, meet-me conference bridges, and a standard PBX (Private Branch Exchange) functionality. A PBX is a telephone system within an enterprise that switches calls between enterprise users on local lines while allowing all users to share a certain number of external telephone lines. Additionally, the
2
system provides intuitive and easy to use system administration software to allow for customer self-administration or remote administration by our authorized reseller partners.
Individual systems can be affordably scaled to customer needs, and multiple systems may be networked together for greater expansion. These networked systems can be at a single site, a campus environment or multiple locations throughout the world using Internet protocol technology to link them. AltiGen phone systems allow affordable entry point while maintaining logical system growth.
For customers with more advanced requirements, we provide AltiContact Manager. The product is available as a software upgrade to an existing MAXCommunications Server System (MAXCS System). For additional information regarding MAXCS System, see the section entitled "Product." This product is capable of skills-based routing, priority queuing, centralized call recording and advanced monitoring and reporting. This capability may be added on a per agent/supervisor basis as the customer grows. This allows a smaller business or branch office to enjoy the same capability as a large professional call center organization. If a customer has more than one location, call center calls can automatically be routed to other locations based on conditions the customer chooses.
Key features of our phone systems include:
- •
- Scalability. AltiGen's software based MAXCS 6.0 softswitch architecture was designed
to scale in both size and capability to the meet the evolving needs of the small and medium-sized business (SMB) market. As a software-based system, AltiGen can rapidly deploy new features to our
customers without requiring expensive hardware upgrades.
- •
- Native Microsoft Exchange Server
Integration. MAXCS 6.0 fully supports native integration into Microsoft Exchange Server 2007 to unlock the embedded Unified Messaging
capabilities of Exchange. As the "Voice of Microsoft Exchange", mutual Microsoft and AltiGen customers now have voice access to e-mails, calendar events, and personal and global company
contact information via Text-to-Speech services.
- •
- Measurable Information to Ensure Best Business
Practices. We provide a complete view into individual and group performance. The amount, type and duration of calls can be tracked and
analyzed. An individual can record a call for later review, or a company can centrally record all or a percentage of calls for quality control.
- •
- Reduced Administration
Costs. Our easy to use self administration software allows customers to manage their own telephone system. This reduces or eliminates
ongoing operating cost of any business telephone system typically referred to as adds, moves and changes. AltiGen phone systems allow administrators to perform many of these tasks on site or remotely
without assistance from third parties.
- •
- Lower Toll
Costs. By routing voice over data networks, our systems reduce toll charges associated with long-distance calls between
locations. Using our products, businesses can send and receive voice communications over the Internet or a private data network.
- •
- Unified Company
Locations. For companies with AltiGen systems in multiple locations, we provide a seamless dialing plan. Customers calling into one
location can automatically be routed to the correct group or individual. This allows a multi-site business to operate under a unified dialing plan and allows users in different sites to
operate as if they were supported by a single system rather than an individual system for each location.
- •
- Survivability Options. Our systems allow practical and cost efficient options for disaster recovery planning. Redundant system hard drives allow all voicemail and configuration information to be copied to a spare hard drive. The system allows nightly backup to another network drive. If weather or other problems prevent employees from reaching the office, ExtensionAnywhere™,
3
- •
- Innovative Desktop Productivity
Software. Our systems provide desktop software applications to increase user productivity. Call control, changes in extension
configuration and the ability to view and manage voicemail messages improve an employee's ability to process calls. In addition, we provide software for group supervisors, agents, system
administrators and operators. Applications are centrally upgraded from the phone system to allow for quick and efficient deployment.
- •
- Integration with Customer Relationship Management
Software. The MAXCommunicator Agent Edition and MAXCommunicator desktop interface provide automatic contact record retrieval and "screen
pops" of contact records to a user's desktop. Microsoft Outlook users can type in a name to automatically retrieve telephone numbers and click and dial from an integrated contact record directory. We
provide built-in integration with other Microsoft software applications like Microsoft Outlook and Microsoft Exchange.
- •
- Ease of Installation, Use and
Maintenance. AltiGen phone systems allow easy installation and system maintenance. Administrators can manage call routing, extension
management, voice messaging, email and Internet features of our products through a single AltiWare administrator interface. By using industry standards we believe that AltiGen systems make it easier
for resellers and end-user customers to implement and maintain systems.
- •
- Improved Customer Service
Capabilities. AltiGen phone systems provide integrated call center functionality. For more advanced call center or centralized call
recording requirements, we offer the AltiContact Manager software application. Both contact center applications are designed to enhance our customers' communications with their customers by employing
comprehensive contact center and call center routing, reporting and recording technologies.
- •
- Integrated Centralized Call
Recording. Voice calls can be recorded on demand by employees, agents and supervisors or automatically centrally recorded by the phone
system. Traditional phone systems require a separate system to be tied to a PBX to centrally record calls. Modular feature licensing allows businesses to add capabilities on a per-feature
or per-user basis offering a reduced up-front investment.
- •
- True Employee Mobility. We provide flexible and useable mobility options while retaining accountability. We provide several powerful options. ExtensionAnywhere™ allows any phone with a direct telephone number to be enabled as a live extension on the system. Call handling, call transfer, conferencing and voicemail capability are retained. Our "One Number Access" feature allows the system to search and then transfer a call at up to four numbers. For remote employees, we offer a VoIP telephone to connect to an employee's high speed Internet access. Our mobility options are flexible and simple to use.
One Number Access and VoIP telephones can be utilized to keep operations running. We provide multiple options based upon what best fits the customer environment.
4
PRODUCTS
The following is a list of our products that are material to our current operations from a financial standpoint:
Product
|
Description | |
|---|---|---|
MAXCS |
MAXCS server software consists of a comprehensive suite of software applications to provide a high value, all-in-one solution. The systems include software and licensing necessary to support analog and VoIP telephones, operator software, and desktop call control software for each extension on the system. By providing a bundled approach, we maintain quality and reliability while providing for easy deployment. The platforms are scalable, and are packaged according to the size of the customer. | |
AltiContact Manager |
AltiContact Manager is available as a software upgrade to an existing AltiGen phone system. This product is capable of skills-based routing, priority queuing, centralized call recording and advanced monitoring and reporting. This capability may be added on a per agent/supervisor basis as a company's needs grow. This allows a smaller business or branch office to enjoy the same capability as a larger organization with a professional call center. If a company has more than one location, calls to call centers can automatically be routed to other locations based on conditions the customer chooses. |
|
IP720 Voice over IP Telephone |
The IP720 is a fully featured SIP-compatible IP telephone designed to empower the user. Bringing stylish form and functionality to the desktop, the IP720 makes sophisticated features simple and intuitive to use. Users have single button access to voicemail, activity/presence selection, voicemail greeting selections, call recording, call conferencing, call transferring, and even placing calls to employees in other countries. The IP720 has integrated Power over Ethernet and Gigabit Ethernet support. |
|
IP710 Voice over IP Telephone |
The IP710 is a fully featured SIP-compatible, IP telephone designed to empower the user. Bringing stylish form and functionality to the desktop, the IP710 makes sophisticated features simple and intuitive to use. Users have single button access to voicemail, activity/presence selection, voicemail greeting selections, call recording, call conferencing, call transferring, and even placing calls to employees in other countries. Our IP710 Telephone was recognized in Internet Telephony Magazine as Product of Year for 2005. In the first quarter of fiscal year 2010, the IP710 is expected to reach end-of-life cycle and will be replaced by the IP720. |
|
IP705 Voice over IP Telephone |
The IP705 provides a subset of the IP710 VoIP telephone's features while offering the same level of voice quality at a reduced price. The IP705 was recognized as a 2006 Product of the Year by Internet Telephony Magazine. |
5
Product
|
Description | |
|---|---|---|
MAXCommunicator |
MAXCommunicator is a Windows-based desktop application that provides call control and visual voice mail management to the desktop. It allows users to receive and place calls, listen to voicemail messages, identify the caller phone number and manage extension configuration. MAXCommunicator is standard with all AltiGen systems. |
|
MAXCommunicator, Agent Edition |
MAXCommunicator, Agent Edition is a Windows-based desktop application to bring call control and workgroup information to call center agents. Users can view a call queue, monitor work group status, check caller identification, measure performance, review log-on history, receive and place calls and listen to and manage voicemail messages. |
|
MAXCommunicator, Supervisor Edition |
MAXCommunicator, Supervisor Edition is a Windows-based desktop application for call center supervisors. The application allows a call center or workgroup supervisor to effectively manage a workgroup. MAXCommunicator, Supervisor Edition provides four major real time module views for workgroup management: agent status, agent statistics, group statistics, and queue status with a quality of services capability. MAXCommunicator, Supervisor Edition allows coaching, silent monitoring of agents with barge-in call participation and call recording functionality. |
|
Triton IP Board |
The Triton IP Board is a microprocessor-controlled board supporting VoIP communications. This allows voice conversations to be carried over public and private data networks that support Internet protocol. The Triton IP Board is a 12-port board that can be software configured to 30 ports. The Triton IP Board can be used for Internet protocol trunks connecting multiple networked MAXCS systems or to support VoIP telephone extensions and VoIP agent extensions. |
|
Triton T1, E1, T1/PRI Board |
The Triton T1, E1, T1/PRI Board is a microprocessor-controlled board that allows MAXCS systems to connect to T1, E1 or T1/PRI digital high-capacity central office telephone lines. This board can be configured with software to support provisioning for T1, E1 or T1/PRI communication protocols. |
|
Triton Trunk Board |
The Triton Trunk Board is 12 port, microprocessor-controlled board that allows MAXCS systems to connect to analog central office telephone lines. This allows outbound and inbound calls to be carried over traditional analog central office telephone lines. |
|
Triton Extension Board |
The Triton Extension Board is a 12 port, microprocessor-controlled board that allows MAXCS systems to support 12 analog telephone extensions with each Triton Extension Board. |
|
Triton Conference Board |
The Triton Conference Board allows up to 30 simultaneous callers per conference and includes a scheduling application to control access and attendees. |
6
Product
|
Description | |
|---|---|---|
MAX 4x4xT1 Access Board |
The MAX 4x4xT1 Access Board is a microprocessor-controlled board that allows the MAX1000 phone system to connect to four analog trunk lines, four analog telephone extensions, and one (1) T1/E1/PRI digital central office telephone line. |
|
MAX 4x8 Access Board |
The MAX 4x8 Access Board is a microprocessor-controlled board that allows the MAX1000 phone system to connect to four analog trunk lines and eight analog telephone extensions. |
|
MAX 8x4 Access Board |
The MAX 8x4 Access Board is a microprocessor-controlled board that allows the MAX1000 phone system to connect to eight analog trunk lines and four analog telephone extension. |
|
MAX 0x12 Access Board |
The MAX 0x12 Access Board is a microprocessor-controlled board that allows the MAX1000 phone system to connect twelve analog telephone extensions. |
AltiGen Hardware and Firmware
We have developed a single base circuit board with high performance digital signal processing technology, which means that the circuit board has an integrated computer built on it that can run special, high-speed software programs, called firmware. Firmware can receive, send and modify digital information for communications with network services. Our digital signal processing boards, Triton and MAX are designed to allow us to create different circuit boards to meet many communication requirements by simply adding a few hardware and/or software components to the basic board. For example, the Triton digital signal processing board can become a T1, E1 or Integrated Services Digital Network communication circuit board or a circuit board supporting VoIP with simple changes in on-board software and, in some cases, new circuits.
This modular design not only enables us to provide new capabilities, but we also believe that it enables our products to achieve a high degree of reliability and cost reduction since the underlying technology is consistent across our products.
AltiGen Modular Software
Our software products are based on modular software components similar to the concept described above for our hardware and firmware. The service provider layer of software is composed of separate software components, each of which communicates with a hardware circuit board within the AltiGen phone system. The middleware layer interacts with all the service providers in the system and manages their resources. This middleware layer communicates with the hardware and allows application programs to provide specific features. The application program layer consists of components that implement the application logic, such as voicemail and auto attendant menus. These applications do not depend on any particular hardware integration.
We believe that the layered architectural structure of our MAXCS products provides important benefits:
- •
- New features can be developed without changing hardware.
- •
- Development time is generally shorter.
- •
- New hardware and software features can be added to installed systems.
- •
- Changing one component in the system does not require other components to be changed.
7
The following table sets forth percentages of net revenue by product type with respect to such revenue for the periods indicated:
| |
Fiscal Year Ended September 30, |
|||||||||
|---|---|---|---|---|---|---|---|---|---|---|
| |
2009 | 2008 | 2007 | |||||||
Hardware |
71 | % | 86 | % | 91 | % | ||||
Software |
13 | % | 14 | % | 9 | % | ||||
Service Support Plans(1) |
16 | % | — | — | ||||||
Total |
100 | % | 100 | % | 100 | % | ||||
- (1)
- In fiscal year 2008, revenue generated from these service support plans accounted for less than 1% of our total revenue. Our hardware revenue in the consolidated statements of operations includes service support revenue generated primarily from our service support plans starting in September 2007. We did not generate revenue from these service support plans in fiscal year 2007.
MARKETING, SALES AND CUSTOMER SUPPORT
Marketing
Our marketing efforts currently focus on increasing demand for our products in the Americas, Europe and Asia Pacific. We are working to increase market awareness of our technology and demand for our products for medium and enterprise sized businesses and call center markets through public relations, print, email and web campaigns.
To assist our distributors, dealers and strategic partners, we provide market development funds, marketing tools and technical and sales training developed specifically for our products. We expect that these programs will allow us to leverage the expertise and contacts of the local and regional reseller channels to create strong lead generation.
Sales
In the United States, in fiscal year 2009, we added additional strategic account managers and business development personnel. In addition, we added new resellers and a distribution partner in the United Kingdom and Italy.
We are organized and operate as two operating segments, the Americas and International. The Americas segment is comprised of the United States, Canada, Mexico, Central America and the Caribbean. The International segment is comprised of China, the United Kingdom, Italy and Holland. Our two geographical segments both sell the same products to the same types of customers.
The following table sets forth percentages of net revenue by geographic region with respect to such revenue for the periods indicated:
| |
Fiscal Year Ended September 30, |
|||||||||
|---|---|---|---|---|---|---|---|---|---|---|
| |
2009 | 2008 | 2007 | |||||||
Americas |
86 | % | 87 | % | 90 | % | ||||
International |
14 | % | 13 | % | 10 | % | ||||
Total |
100 | % | 100 | % | 100 | % | ||||
8
The following table sets forth a measure of profit or loss for each operating segment for the periods indicated (in thousands):
| |
Fiscal Year Ended September 30, |
|||||||||
|---|---|---|---|---|---|---|---|---|---|---|
| |
2009 | 2008 | 2007 | |||||||
Americas |
$ | (3 | ) | $ | (211 | ) | $ | (194 | ) | |
International |
$ | (4,707 | ) | $ | (3,726 | ) | $ | (742 | ) | |
Total |
$ | (4,710 | ) | $ | (3,937 | ) | $ | (936 | ) | |
The following table sets forth the total assets for each operating segment as of the periods indicated (in thousands):
| |
Fiscal Year Ended September 30, |
|||||||||
|---|---|---|---|---|---|---|---|---|---|---|
| |
2009 | 2008 | 2007 | |||||||
Americas |
$ | 8,060 | $ | 11,438 | $ | 13,450 | ||||
International |
$ | 3,271 | $ | 3,338 | $ | 1,800 | ||||
Total |
$ | 11,331 | $ | 14,776 | $ | 15,250 | ||||
We currently have sales and support staff in more than 10 locations in the United States. Our inside sales group answers incoming calls from end users and refers new leads to a qualified dealer near each end user's location. The inside sales group is also responsible for account management of our smaller resellers. Our outside sales force, which is primarily based in the Americas, includes regional sales managers and technology solutions managers who work with our larger resellers and recruit new reseller partners. In fiscal year 2009, we continued our expansion to a more scalable reseller community by signing on an increasing number of resellers that currently sell traditional and Internet protocol telephone systems manufactured by companies such as Avaya Communications (Avaya) and Mitel Networks Corporation.
Customers
Our customers are primarily end-users, resellers and distributors. We have distribution agreements with Altisys Communications, Inc., Synnex Corporation and Jenne Distributors, Inc., in the Americas. Our agreements with Altisys and Synnex have initial terms of one year and our agreement with Jenne had an initial term of two years. Each of these agreements are renewed automatically for additional one year terms, provided that each party shall have the right to terminate the agreement for convenience upon ninety (90) days' written notice prior to the end of the initial term or any subsequent term of the agreement. In addition, our agreements with Altisys, Synnex and Jenne also provide for termination, with or without cause and without penalty, by either party upon 30 days' written notice to the other party or upon insolvency or bankruptcy. For a period of 60 days' following termination of the agreement, Altisys, Synnex and Jenne may distribute any products in their possession at the time of termination or, at their option, return any products to us that are in their inventories. Upon termination of the distribution agreement, all outstanding invoices for the products will become due and payable within 30 days' of the termination.
9
The following table sets forth our net revenue by customers that individually accounted for more than 10% of our revenue for the periods indicated:
| |
Fiscal Year Ended September 30, |
|||||||||
|---|---|---|---|---|---|---|---|---|---|---|
| |
2009 | 2008 | 2007 | |||||||
Synnex |
30 | % | 34 | % | 50 | % | ||||
Jenne(1) |
15 | % | 12 | % | — | |||||
Fiserv(2) |
10 | % | — | — | ||||||
Altisys(3) |
— | 12 | % | 16 | % | |||||
Graybar(4) |
— | — | 15 | % | ||||||
Total |
55 | % | 58 | % | 81 | % | ||||
- (1)
- We
did not generate revenue from Jenne during fiscal year ended 2007. Additionally, in September 2009, we terminated our distribution agreement with Jenne.
We believe the termination of our relationship with Jenne will not have a material impact on our business because we anticipate that revenue from other distributors will offset a portion of the lost
revenue.
- (2)
- In
August 2009, we entered into a reseller agreement with Fiserv Solutions, Inc. Our agreement with Fiserv has an initial term of ten years and will
renew automatically for additional five year terms, provided that each party has the right to terminate the agreement for convenience upon ninety (90) days' written notice prior to the end of
the initial term or any subsequent term of the agreement. We believe this relationship will contribute to revenue growth in fiscal 2010.
- (3)
- During
fiscal year 2009, revenue generated from Altisys was less than 10% of our total revenue.
- (4)
- During fiscal year 2008, revenue generated through Graybar was less than 10% of our total revenue. Additionally, in April 2008, we terminated our distribution agreement with Graybar. The termination of our relationship with Graybar did not have a material impact on our business.
We also have over 200 authorized resellers who sell our products directly to a broad range of end-users. We review our resellers' performance quarterly and discontinue distribution for those who do not meet our revenue or technical standards.
Customer Support
We believe that consistent, high-quality service and support are key factors in attracting and retaining customers. Our customer support groups, located in California, Texas, Colorado, Minnesota and Shanghai, China coordinate service and technical support of our products and provide service twenty-four hours a day, seven days a week. Our support personnel assist our distributors and resellers in resolving installation and support issues that arise from their sales to end users and also provide limited support to end-users to supplement dealer support. Resellers and end-user customers can also access technical information and receive technical support through our web site.
RESEARCH AND DEVELOPMENT
The market for our products is characterized by rapidly changing technology, evolving industry standards and frequent product introductions. We believe that our future success depends in large part upon our ability to continue to enhance the functionality and uses of our core technology. We intend to
10
extend the functionality and uses of our hardware and software technology and develop new products by continuing to invest in research and development.
We are currently developing enhancements to our products to provide greater functionality and increased capacity that we expect will enable us to enhance our position in the Internet protocol phone system market space, enter new geographical markets, and allow us to continue to penetrate the call center market.
We currently conduct the majority of our product development in-house. We also use a small number of independent contractors to assist with certain product development and testing activities. We intend to continue working with our strategic partners to enhance our products. As of September 30, 2009, we employed 55employees in engineering, research and development and support. A total of 31 of those employees were located in Shanghai, China.
During fiscal years 2009, 2008, and 2007, our research and development expense was approximately $4.9 million, $4.2 million, and $3.4 million, respectively.
COMPETITION
The markets for our products are intensely competitive, continually evolving and subject to changing technologies. We currently compete with Internet protocol and Internet protocol-enabled telecommunications systems, such as Avaya Inc., Mitel Networks Corporation, Shoretel Inc, and Cisco Systems, Inc. Many of our competitors are substantially larger than us and have significantly greater name recognition, financial, sales and marketing, technical, customer support, manufacturing and other resources. These competitors also may have more established distribution channels and stronger relationships with local, long distance and Internet service providers. These competitors may be able to respond more rapidly to new or emerging technologies and changes in customer requirements or to devote greater resources to the development, promotion and sale of their products.
These competitors may enter our existing or future markets with products that may be less expensive, that may provide higher performance or additional features or that may be introduced more quickly than our products. In fiscal 2009, we believe that we continued to be both feature and price competitive. Additionally, we believe we provide a low ongoing cost of ownership. We believe that our principal competitive advantages include:
- •
- Leading provider of 100 percent Microsoft-based VoIP business phone systems and Unified Communications solutions;
- •
- Ability to reduce communications costs;
- •
- Ease of system manageability;
- •
- Ease of use;
- •
- Simple deployment in single and multi-site implementations;
- •
- Ability to achieve rapid product development;
- •
- Experience in service and technical support of Internet protocol telephony;
- •
- Complete call center application now standard with all MAXCS systems;
- •
- Decentralized voice processing support for advanced and integrated telephony application;
- •
- Innovative mobility capabilities supporting mobile telephone devices such as the telephone system extensions; and
- •
- Reliable redundant configurations supported.
11
We believe that we compete favorably with our competitors on the basis of these factors. However, if we are not able to compete successfully against our current and future competitors, it will be difficult to acquire and retain customers, and we may experience revenue declines, reduced operating margins, loss of market share and diminished value in our services.
INTELLECTUAL PROPERTY
We generally rely upon patent, copyright, trademark and trade secret laws to protect and maintain our proprietary rights for our technology and products. As of September 30, 2009, we have been issued three registered trademarks, "AltiGen™," "AltiServ™" and "Zoomerang™." In addition, the AltiGen logo is a trademark of ours in the United States and other jurisdictions. All other trademarks and trade names used in this Form 10-K are the property of their respective owners.
We have filed several U.S. patent applications relating to various aspects of our client and server software, mixed-media communications and computer telephony. As of September 30, 2009, we have been issued sixteen U.S. patents. We expect to continue to file patent applications to protect our technology and products. We cannot be sure that our patent applications will result in the issuance of patents, or that any issued patents will provide commercially significant protection for our technology. We maintain a policy requiring our employees, consultants and other third parties to enter into confidentiality and proprietary rights agreements and to control access to software, documentation and other proprietary information. Notwithstanding the steps we have taken to protect our intellectual property rights, third parties may infringe or misappropriate our proprietary rights. Competitors may also independently develop technologies that are substantially equivalent or superior to the technologies we employ in our services.
MANUFACTURING AND ASSEMBLY
Our manufacturing operations consist of two phases. In the first phase, we send out components of our products to a third party assembler. The third party assembler auto-inserts the components into the printed circuit boards. In the second phase, we insert the assembled circuit boards into the burn-in process for a minimum of two weeks and after that we perform the final test of the circuit boards. In fiscal year 2009, we engaged All Quality Services in Fremont, California and ISIS Surface Mounting, Inc. in San Jose, California as our third party assemblers. During fiscal 2009, four suppliers, Advantech Corporation, BCM Communications, Inc., Avnet Electronics and AAEON Electronics, Inc., provided us with approximately 79% of our hardware product components. We purchase fully-assembled chassis from Advantech Corporation, Internet protocol phones from BCM Communications, Inc., single board computers for our MAX product from AAEON Electronics, Inc. and raw material components from Avnet Electronics. As of September 30, 2009, our in-house manufacturing operations occupied approximately 6,000 square feet of our corporate headquarters in San Jose, California.
We test our products after the assembly process using internally developed product assurance testing procedures, which include visual inspection, functional testing and final systems testing. Although we generally use standard components for our products and try to maintain alternative sources of supply, we purchase some key components from sole source suppliers for which alternative sources are not currently available. We incorporate the following sole-sourced components in our products:
- •
- Zarlink Corporation chips are included in all of our boards and are the means by which our boards communicate with each
other to enable our products to function correctly.
- •
- Texas Instruments' digital signal processor ("DSP") chips are included in our Triton family of boards. The DSP chip is designed to perform the mathematics, data compression and other tasks required to manipulate voice communications that are routed through our products.
12
- •
- Xilinx, Inc provides chips for our Triton family of boards which allow our boards to work with digital communications
lines.
- •
- Infineon Technologies provides chips for our Triton Analog product line which allow our board to work with analog
communications lines.
- •
- PMC Sierra, Inc. provides chips for our Triton Digital product line which allow our board to work with digital
communications lines.
- •
- Advantech Corporation provides the chassis for our MAXCS Office products and some of our larger systems based on our
specifications.
- •
- BCM Communications, Inc. manufactures our Internet protocol phone loaded with customized firmware to work with our
system.
- •
- AAEON Electronics, Inc. manufactures single board computers for our MAX products.
The loss of any key component supplier would adversely impact our business.
EMPLOYEES
As of September 30, 2009, we had 115 full-time employees, including 55 in research and development and support, 39 in marketing and sales, 8 in operations, and 13 in finance and administration. Of these full-time employees, 66 were located in the United States and 49 in China. Our future success will depend, in part, on our ability to continue to attract, retain and motivate highly qualified technical, marketing, engineering and management personnel.
We were incorporated in California in May 1994, and we reincorporated into Delaware in June 1999. Our corporate headquarters are located at 410 East Plumeria Drive, San Jose, California 95134. Our telephone number is (408) 597-9000. We maintain an Internet website at http://www.altigen.com. Our most recent annual report on Form 10-K and certain of our other filings with the Securities and Exchange Commission (SEC) are available through the Investor Relations section of our website. Our annual reports on Form 10-K, quarterly reports on Form 10-Q, current reports on Form 8-K and other required filings and amendments to these filings are available on the SEC website at http://www.sec.gov, which can be reached from our Investor Relations website. In addition, you may read and copy any material we file with the SEC at the SEC's Public Reference Room at 450 Fifth Street, NW, Washington, DC 20549. You may obtain information on the operation of the Public Reference Room by calling the SEC at 1-800-SEC-0330.
CERTAIN FACTORS AFFECTING BUSINESS, OPERATING RESULTS, AND FINANCIAL CONDITION
In addition to other information contained in this Form 10-K, investors should carefully consider the following factors that could adversely affect our business, financial condition and operating results as well as adversely affect the value of an investment in our common stock. This Annual Report on Form 10-K includes "forward-looking statements" within the meaning of Section 27A of the Securities Act and Section 21E of the Exchange Act. All statements other than statements of historical fact are "forward-looking statements" for purposes of these provisions, including any statements regarding: projections of revenues, future research and development expenses, future selling, general and administrative expenses, other expenses, gross profit, gross margin, or other financial items; the plans and objectives of management for future operations; our exposure to interest rate risk; future economic conditions or performance; plans to focus on cost control; In some cases, forward-looking statements can be identified by the use of terminology such as "may," "will," "expects," "plans," "anticipates," "estimates," "potential," or "continue," or the negative thereof or other comparable terminology.
13
Although we believe that the expectations reflected in the forward-looking statements contained herein are reasonable, there can be no assurance that such expectations or any of the forward-looking statements will prove to be correct, and actual results could differ materially from those projected or assumed in the forward-looking statements. Our future financial condition and results of operations, as well as any forward-looking statements, are subject to risks and uncertainties, including but not limited to the factors set forth below and elsewhere in this report. All forward-looking statements and reasons why results may differ included in this Annual Report are made as of the date hereof, and we assume no obligation to update any such forward-looking statement or reason why actual results may differ.
Risks Related to Our Business
Our business could be harmed by adverse global economic conditions in our target markets or reduced spending on information technology and telecommunication products.
Current uncertainty in global economic conditions pose a risk to the overall economy as consumers and businesses may defer purchases in response to tighter credit and negative financial news, which could negatively affect product demand and other related matters. Our business depends on the overall demand for information technology, and in particular for telecommunications systems. The market we serve is emerging and the purchase of our products involves significant upfront expenditures. In addition, the purchase of our products can be discretionary and may involve a significant commitment of capital and other resources. Weak economic conditions in our target markets, or a reduction in information technology or telecommunications spending even if economic conditions improve, would likely adversely impact our business, operating results and financial condition in a number of ways, including longer sales cycles, lower prices for our products and reduced unit sales.
We have had a history of losses and may incur future losses, which may prevent us from attaining profitability.
We have had a history of operating losses since our inception and, as of September 30, 2009, we had an accumulated deficit of $60.7 million. We may incur operating losses in the future, and these losses could be substantial and impact our ability to attain profitability. We do not expect to significantly increase expenditures for product development, general and administrative expenses, and sales and marketing expenses; however, if we cannot maintain current revenue or revenue growth, we will not achieve or sustain profitability or positive operating cash flows. Even if we achieve profitability and positive operating cash flows, we may not be able to sustain or increase profitability or positive operating cash flows on a quarterly or annual basis.
Our operating results vary, making future operating results difficult to predict.
Our quarterly and annual operating results have varied significantly in the past and likely will vary significantly in the future. A number of factors, many of which are beyond our control, have caused and may cause our operating results to vary, including:
- •
- our ability to respond effectively to competitive pricing pressures;
- •
- our ability to establish or increase market acceptance of our technology, products and systems;
- •
- our success in expanding our network of distributors, dealers and companies that buy our products in bulk, customize them
for particular applications or customers, and resell them under their own names;
- •
- market acceptance of products and systems incorporating our technology and enhancements to our product applications on a
timely basis;
- •
- our success in supporting our products and systems;
14
- •
- our sales cycle, which may vary substantially from customer to customer;
- •
- unfavorable changes in the prices and delivery of the components we purchase;
- •
- the size and timing of orders for our products, which may vary depending on the season, and the contractual terms of the
orders;
- •
- the size and timing of our expenses, including operating expenses and expenses of developing new products and product
enhancements;
- •
- deferrals of customer orders in anticipation of new products, services or product enhancements introduced by us or by our
competitors; and
- •
- our ability to attain and maintain production volumes and quality levels for our products.
Our future projected budgets and commitments are based in part on our expectations of future sales. If our sales do not meet expectations, it will be difficult for us to reduce our expenses quickly and, consequently, our operating results may suffer.
Our dealers often require immediate shipment and installation of our products. As a result, we have historically operated with limited backlog, and our sales and operating results in any quarter primarily depend on orders booked and shipped during that quarter.
Any of the above factors could harm our business, financial condition and results of operations. We believe that period-to-period comparisons of our results of operations are not meaningful, and you should not rely upon them as indicators of our future performance.
Our market is highly competitive and we may not have the resources to adequately compete.
The market for our integrated, multifunction telecommunications systems is new, rapidly evolving and highly competitive. We expect competition to intensify in the future as existing competitors develop new products and new competitors enter the market. We believe that a critical component to success in this market is the ability to establish and maintain strong partner and customer relationships with a wide variety of domestic and international providers. If we fail to establish or maintain these relationships, we will be at a serious competitive disadvantage.
We face competition from companies providing traditional private telephone systems. Our principal competitors that produce these telephone systems are Avaya Communications and Mitel Networks Corporation. We also compete against providers of multi-function telecommunications systems, including Shoretel and Cisco Systems, as well as any number of future competitors. Many of our competitors are substantially larger than we are and have significantly greater name recognition, financial resources, sales and marketing teams, technical and customer support, manufacturing capabilities and other resources. These competitors also may have more established distribution channels and stronger relationships with service providers. These competitors may be able to respond more rapidly to new or emerging technologies and changes in customer requirements or to devote greater resources to the development, promotion and sale of their products. These competitors may enter our existing or future markets with products that may be less expensive, provide higher performance or additional features or be introduced earlier than our phone systems. We also expect that other companies may enter our market with better products and technologies. If any technology that is competing with ours is more reliable, faster, less expensive or has other advantages over our technology, then the demand for our products and services could decrease and harm our business.
We expect our competitors to continue to improve the performance of their current products and introduce new products or new technologies. If our competitors successfully introduce new products or enhance their existing products, our sales or market acceptance of our products and services could be reduced, price competition could be increased or our products could become obsolete. To remain
15
competitive, therefore, we must continue to invest significant resources in research and development, sales and marketing and customer support. We may not have sufficient resources to make these investments or to make the technological advances necessary to be competitive, which in turn will cause our business to suffer.
We sell the majority of our products through dealers and distributors, which limits our ability to control the timing of our sales, and which makes it more difficult to predict our revenue.
We do not recognize revenue from the sale of our products to our distributors until these products are sold to either resellers or end-users. We have little control over the timing of product sales to resellers and end users. Our lack of control over the revenue that we recognize from our distributors' sales to resellers and end-users limits our ability to predict revenue for any given period. Our future projected budgets and commitments are based in part on our expectations of future sales. If our sales do not meet expectations, it will be difficult for us to reduce our expenses quickly, and consequently our operating results may suffer.
We rely on resellers to promote, sell, install and support our products, and their failure to do so or our inability to recruit or retain resellers may substantially reduce our sales and thus seriously harm our business.
We rely on resellers who can provide high quality sales and support services. As with our distributors, we compete with other telecommunications systems providers for our resellers' business as our resellers generally market competing products. If a reseller promotes a competitor's products to the detriment of our products or otherwise fails to market our products and services effectively, we could lose market share. In addition, the loss of a key reseller or the failure of resellers to provide adequate customer service could cause our business to suffer. If we do not properly train our resellers to sell, install and service our products, our business will suffer.
Software or hardware errors may seriously harm our business and damage our reputation, causing loss of customers and revenue.
Users expect telephone systems to provide a high level of reliability. Our products are inherently complex and may have undetected software or hardware errors. We have detected and may continue to detect errors and product defects in our installed base of products, new product releases and product upgrades. End users may install, maintain and use our products improperly or for purposes for which they were not designed. These problems may degrade or terminate the operation of our products, which could cause end users to lose telephone service, cause us to incur significant warranty and repair costs, damage our reputation and cause significant customer relations problems. Any significant delay in the commercial introduction of our products due to errors or defects, any design modifications required to correct these errors or defects or any negative effect on customer satisfaction as a result of errors or defects could seriously harm our business, financial condition and results of operations.
Any claims brought because of problems with our products or services could seriously harm our business, financial condition and results of operations. We currently offer a one-year hardware guarantee to end-users. If our products fail within the first year, we face replacement costs. Our insurance policies may not provide sufficient or any coverage should a claim be asserted. In addition, our introduction of products and systems with reliability, quality or compatibility problems could result in reduced revenue, uncollectible accounts receivable, delays in collecting accounts receivable, warranties and additional costs. Our customers, end users or employees could find errors in our products and systems after we have begun to sell them, resulting in product redevelopment costs and loss of, or delay in, their acceptance by the markets in which we compete. Further, we may experience significant product returns in the future. Any of these events could have a material adverse effect on our business, financial condition and results of operations.
16
Our market is subject to changing preferences; failure to keep up with these changes would result in our losing market share, thus seriously harming our business, financial condition and results of operations.
Our customers and end users expect frequent product introductions and have changing requirements for new products and features. In order to be competitive, we need to develop and market new products and product enhancements that respond to these changing requirements on a timely and cost-effective basis. Our failure to do so promptly and cost effectively would seriously harm our business, financial condition and results of operations. Also, introducing new products could require us to write-off existing inventory as obsolete, which could harm our results of operations.
We depend on attracting and retaining qualified personnel to maintain and expand our business; our failure to promptly attract and retain qualified personnel may seriously harm our business, financial condition and results of operations.
We depend, in large part, on our ability to attract and retain highly skilled personnel, particularly engineers and sales and marketing personnel. We need highly trained technical personnel to design and support our server-based telecommunications systems. In addition, we need highly trained sales and marketing personnel to expand our marketing and sales operations in order to increase market awareness of our products and generate increased revenue. Competition for highly trained personnel can at times be intense, especially in the San Francisco Bay Area where most of our operations are located. We cannot be certain that we will be successful in our recruitment and retention efforts. If we fail to attract or retain qualified personnel or suffer from delays in hiring required personnel, our business, financial condition and results of operations may be seriously harmed.
Losing any of our key distributors would harm our business. We also need to establish and maintain relationships with additional distributors and original equipment manufacturers.
Sales through our three key distributors, Altisys Communications, Inc., Synnex Corporation and Jenne Distributors, Inc., accounted for 52% of our net revenue in fiscal year ended September 30, 2009. Our business and operating results will suffer if any one of these distributors does not continue distributing our products, fails to distribute the volume of our products that it currently distributes or fails to expand our customer base. We also need to establish and maintain relationships with additional distributors and original equipment manufacturers. In September 2009, we terminated our distribution agreement with Jenne. We believe the termination of our relationship with Jenne will not have a material impact on our business because we anticipate that revenue from other distributors will offset a portion of the lost revenue.
We may not be able to establish, or successfully manage, relationships with additional distribution partners. In addition, our agreements with distributors typically provide for termination by either party upon written notice to the other party. For example, our agreement with Synnex provides for termination, with or without cause, by either party upon 30 days' written notice to the other party, or upon insolvency or bankruptcy. Generally, these agreements are non-exclusive and distributors sell products that compete with ours. If we fail to establish or maintain relationships with distributors and original equipment manufacturers, our ability to increase or maintain our sales and our customer base will be substantially harmed.
We rely on sole-sourced components and third party technology and products; if these components are not available, our business may suffer.
We purchase technology that is incorporated into many of our products, including virtually all of our hardware products, from a single third-party supplier. We order sole-sourced components using purchase orders and do not have supply contracts for them. One sole-sourced component, a TI DSP chip, is particularly important to our business because it is included in virtually all of our hardware
17
products. If we were unable to purchase an adequate supply of these sole-sourced components on a timely basis, we would be required to develop alternative products, which could entail qualifying an alternative source or redesigning our products based on different components. Our inability to obtain these sole-sourced components, especially the TI DSP chip, could significantly delay shipment of our products, which could have a negative effect on our business, financial condition and results of operations.
Compliance with changing regulations of corporate governance and public disclosure may result in additional expenses.
Changing laws, regulations and standards relating to corporate governance and public disclosure, including the Sarbanes-Oxley Act of 2002, new SEC regulations and NASDAQ National Market rules, are creating uncertainty for companies such as ours. These new or changed laws, regulations and standards are subject to varying interpretations in many cases due to their lack of specificity, and as a result, their application in practice may evolve over time as new guidance is provided by regulatory and governing bodies, which could result in continuing uncertainty regarding compliance matters and higher costs necessitated by ongoing revisions to disclosure and governance practices. As a result, our efforts to comply with evolving laws, regulations and standards have resulted in, and are likely to continue to result in, increased general and administrative expenses and a diversion of management time and attention from revenue-generating activities to compliance activities. In particular, our efforts to comply with Section 404 of the Sarbanes-Oxley Act of 2002 and the related regulations regarding our required assessment of our internal controls over financial reporting and beginning with the year ended September 30, 2010, our external auditor's audit of the effectiveness of our internal controls over financial reporting has required the commitment of significant financial and managerial resources. We expect these efforts to require the continued commitment of significant resources. Further, our board members, chief executive officer, and chief financial officer could face an increased risk of personal liability in connection with the performance of their duties. As a result, we may have difficulty attracting and retaining qualified board members and executive officers, which could harm our business. If our efforts to comply with new or changed laws, regulations and standards differ from the activities intended by regulatory or governing bodies due to ambiguities related to practice, our reputation may be harmed.
Our facility is vulnerable to damage from earthquakes and other natural disasters and other business interruptions; any such damage could seriously or completely impair our business.
We perform final assembly, software installation and testing of our products at our facility in San Jose, California. Our facility is located on or near known earthquake fault zones and may be subject to rolling electrical blackouts and is vulnerable to damage or interruption from fire, floods, earthquakes, power loss, telecommunications failures and similar events. If such a disaster or interruption occurs, our ability to perform final assembly, software installation and testing of our products at our facility would be seriously, if not completely, impaired. If we were unable to obtain an alternative place or way to perform these functions, our business, financial condition and results of operations would suffer. The insurance we maintain may not be adequate to cover our losses against fires, floods, earthquakes and general business interruptions.
Our strategy to outsource assembly and test functions in the future could delay delivery of products, decrease quality or increase costs.
We may begin to outsource a substantial amount of our product assembly and test functions. This outsourcing strategy involves certain risks, including the potential lack of adequate capacity and reduced control over delivery schedules, manufacturing yield, quality and costs. In the event that any significant subcontractors were to become unable or unwilling to continue to manufacture or test our
18
products in the required volumes, we would have to identify and qualify acceptable replacements. Finding replacements could take time and we cannot be sure that additional sources would be available to us on a timely basis. Any delay or increase in costs in the assembly and testing of products by third-party subcontractors could seriously harm our business, financial condition and results of operations.
Our expansion in international markets has been slow and steady. However, our plan is to accelerate this growth rate and will involve new risks that our previous domestic operations have not prepared us to address; our failure to address these risks could harm our business, financial condition and results of operations.
For fiscal year 2009, approximately 14% of our net revenue came from customers outside of the Americas. We intend to expand our international sales and marketing efforts. Our efforts are subject to a variety of risks associated with conducting business internationally, any of which could seriously harm our business, financial condition and results of operations. These risks include:
- •
- tariffs, duties, price controls or other restrictions on foreign currencies or trade barriers, such as import or export
licensing imposed by foreign countries, especially on technology;
- •
- potential adverse tax consequences, including restrictions on repatriation of cash or earnings;
- •
- fluctuations in foreign currency exchange rates, which could make our products relatively more expensive in foreign
markets; and
- •
- conflicting regulatory requirements in different countries that may require us to invest significant resources customizing our products for each country.
Any failure by us to protect our intellectual property could harm our business and competitive position.
Our success depends, to a certain extent, upon our proprietary technology. We currently rely on a combination of patent, trade secret, copyright and trademark law, together with non-disclosure and invention assignment agreements, to establish and protect the proprietary rights in the technology used in our products.
Although we have been issued sixteen patents and expect to continue to file patent applications, we are not certain that our patent applications will result in the issuance of patents, or that any patents issued will provide commercially significant protection of our technology. In addition, other individuals or companies may independently develop substantially equivalent proprietary information not covered by the patents to which we own rights, may obtain access to our know-how or may claim to have issued patents that prevent the sale of one or more of our products. Also, it may be possible for third parties to obtain and use our proprietary information without our authorization. Further, the laws of some countries, such as those in Japan, one of our target markets, may not adequately protect our intellectual property or such protection may be uncertain. Our success also depends on trade secrets that cannot be patented and are difficult to protect. If we fail to protect our proprietary information effectively, or if third parties use our proprietary technology without authorization, our competitive position and business will suffer.
If we are unable to raise additional capital when needed, we may be unable to develop or enhance our products and services.
We may seek additional funding in the future. If we cannot raise funds on acceptable terms, we may be unable to develop or enhance our products and services, take advantage of future opportunities or respond to competitive pressures or unanticipated requirements. We also may be required to reduce operating costs through lay-offs or reduce our sales and marketing or research and development efforts. If we issue equity securities, stockholders may experience additional dilution or the new equity securities may have rights, preferences or privileges senior to those of our common stock.
19
We may face infringement issues that could harm our business by requiring us to license technology on unfavorable terms or temporarily or permanently cease sales of key products.
We may become parties to litigation in the normal course of our business. Litigation in general, and intellectual property and securities litigation in particular, can be expensive and disruptive to normal business operations. Moreover, the results of complex litigation are difficult to predict. We were previously a defendant in a patent infringement suit brought by Vertical Networks. On October 4, 2007, the parties entered into a stipulation dismissing the lawsuit in its entirety without prejudice. Consequently, Vertical Networks may reassert these or related claims in one or more separate proceedings.
More generally, litigation related to these types of claims may require us to acquire licenses under third party patents that may not be available on acceptable terms, if at all. We believe that an increasing portion of our revenue in the future will come from sales of software applications for our hardware products. The software market traditionally has experienced widespread unauthorized reproduction of products in violation of developers' intellectual property rights. This activity is difficult to detect, and legal proceedings to enforce developers' intellectual property rights are often burdensome and involve a high degree of uncertainty and substantial costs.
Our products may not meet the legal standards required for their sale in some countries; if we cannot sell our products in these countries, our results of operations may be seriously harmed.
The United States and other countries in which we intend to sell our products have standards for safety and other certifications that must be met for our products to be legally sold in those countries. We have tried to design our products to meet the requirements of the countries where we sell or plan to sell them. We also have obtained or are trying to obtain the certifications that we believe are required to sell our products in these countries. We cannot, however, guarantee that our products meet all of these standards or that we will be able to obtain any certifications required. In addition, there is, and will likely continue to be, an increasing number of laws and regulations pertaining to the products we offer and may offer in the future. These laws or regulations may include, for example, more stringent safety standards, requirements for additional or more burdensome certifications or more stringent consumer protection laws.
If our products do not meet a country's standards or we do not receive the certifications required by a country's laws or regulations, then we may not be able to sell our products in that country. This inability to sell our products may seriously harm our results of operation by reducing our sales or requiring us to invest significant resources to conform our products to these standards.
Risks Related to the Industry
Integrated, multifunction telecommunications systems may not achieve widespread acceptance.
The market for integrated, multifunction telecommunications systems is relatively new and rapidly evolving. Businesses have invested substantial resources in the existing telecommunications infrastructure, including traditional private telephone systems, and may be unwilling to replace these systems in the near term or at all. Businesses also may be reluctant to adopt integrated, multifunction telecommunications systems because of their concern about the current limitations of data networks, including the Internet. For example, end users sometimes experience delays in receiving calls and reduced voice quality during calls when routing calls over data networks. Moreover, businesses that begin to route calls over the same networks that currently carry only their data also may experience these problems if the networks do not have sufficient capacity to carry all of these communications at the same time.
20
Evolving standards may delay our product introductions, increase our product development costs or cause end users to defer or cancel plans to purchase our products, any of which could adversely affect our business.
The standards in our market are still evolving. These standards are designed to ensure that integrated, multifunction telecommunications products from different manufacturers can operate together. Some of these standards are proposed by other participants in our market, including some of our competitors, and include proprietary technology. In recent years, these standards have changed, and new standards have been proposed, in response to developments in our market. Our failure to conform our products to existing or future standards may limit their acceptance by market participants. We may not anticipate which standards will achieve the broadest acceptance in our market in the future, and we may take a significant amount of time and expense to adapt our products to these standards. We also may have to pay additional royalties to developers of proprietary technologies that become standards in our market. These delays and expenses may seriously harm our results of operations. In addition, customers and users may defer or cancel plans to purchase our products due to concerns about the ability of our products to conform to existing standards or to adapt to new or changed standards, and this could seriously harm our results of operations.
Future regulation or legislation could harm our business or increase our cost of doing business.
The Federal Communications Commission (FCC) has submitted a report to Congress stating that it may regulate certain Internet services if it determines that such Internet services are functionally equivalent to conventional telecommunications services. The increasing growth of the voice over data network market and the popularity of supporting products and services, heighten the risk that national governments will seek to regulate the transmission of voice communications over networks such as the Internet. In addition, large telecommunications companies may devote substantial lobbying efforts to influence the regulation of this market so as to benefit their interests, which may be contrary to our interests. These regulations may include, for example, assessing access or settlement charges, imposing tariffs or imposing regulations based on encryption concerns or the characteristics and quality of products and services. In February 2004, the FCC found that an entirely Internet based voice over Internet protocol service was an unregulated information service. At the same time, the FCC began a broader proceeding to examine what its role should be in this new environment of increased consumer choice and what can be done to meet its role of safeguarding the public interest. Future laws, legal decisions or regulations, as well as changes in interpretations of existing laws and regulations, could require us to expend significant resources to comply with them. In addition, these future events or changes may create uncertainty in our market that could reduce demand for our products.
Risks Related to Ownership of our Common Stock
Our stock price may be volatile.
The trading price of our common stock has been and may continue to be volatile and could be subject to wide fluctuations in response to various factors, some of which are beyond our control. Factors that could affect the trading price of our common stock could include:
- •
- variations in our operating results;
- •
- announcements of technological innovations, new products or product enhancements, strategic alliances or significant
agreements by us or by our competitors;
- •
- the gain or loss of significant customers;
- •
- recruitment or departure of key personnel;
- •
- the impact of unfavorable worldwide economic and market conditions, including the restricted credit environment impacting credit of our customers;
21
- •
- changes in estimates of our operating results or changes in recommendations by any securities analysts who follow our
common stock;
- •
- significant sales, or announcement of significant sales, of our common stock by us or our stockholders; and
- •
- adoption or modification of regulations, policies, procedures or programs applicable to our business.
In addition, the stock market in general, and the market for technology companies in particular, has experienced extreme price and volume fluctuations that have often been unrelated or disproportionate to the operating performance of those companies. Broad market and industry factors may seriously affect the market price of our common stock, regardless of our actual operating performance. In addition, in the past, following periods of volatility in the overall market and the market price of a particular company's securities, securities class action litigation has often been instituted against these companies. This litigation, if instituted against us, could result in substantial costs and a diversion of our management's attention and resources.
If securities or industry analysts do not publish research or reports about our business, or if they issue an adverse or misleading opinion regarding our stock, our stock price and trading volume could decline.
The trading market for our common stock will be influenced by the research and reports that industry or securities analysts publish about us or our business. If any of the analysts who cover us issue an adverse or misleading opinion regarding our stock, our stock price would likely decline. If one or more of these analysts cease coverage of our company or fail to publish reports on us regularly, we could lose visibility in the financial markets, which in turn could cause our stock price or trading volume to decline.
We may choose to raise additional capital. Such capital may not be available, or may be available on unfavorable terms, which would adversely affect our ability to operate our business.
We expect that our existing cash balances will be sufficient to meet our working capital and capital expenditure needs for the foreseeable future. If we choose to raise additional funds, due to unforeseen circumstances or material expenditures, we cannot be certain that we will be able to obtain additional financing on favorable terms, if at all, and any additional financings could result in additional dilution to our existing stockholders.
Provisions in our charter documents, Delaware law, employment arrangements with certain of our executive officers and Preferred Stock Rights Agreement could discourage a takeover that stockholders may consider favorable.
Provisions in our certificate of incorporation and bylaws may have the effect of delaying or preventing a change of control or changes in our management. These provisions include but are not limited to the following:
- •
- our board of directors has the right to increase the size of the board of directors and to elect directors to fill a
vacancy created by the expansion of the board of directors or the resignation, death or removal of a director, which prevents stockholders from being able to fill vacancies on our board of directors;
- •
- our board of directors is staggered into three (3) classes and each member is elected for a term of 3 years, which prevents stockholders from being able to assume control of the board of directors;
22
- •
- our stockholders may not act by written consent and are limited in their ability to call special stockholders' meetings;
as a result, a holder, or holders, controlling a majority of our capital stock would be limited in their ability to take certain actions other than at annual stockholders' meetings or special
stockholders' meetings called by the board of directors, the chairman of the board or the president;
- •
- our certificate of incorporation prohibits cumulative voting in the election of directors, which limits the ability of
minority stockholders to elect director candidates;
- •
- stockholders must provide advance notice to nominate individuals for election to the board of directors or to propose
matters that can be acted upon at a stockholders' meeting, which may discourage or deter a potential acquiror from conducting a solicitation of proxies to elect the acquiror's own slate of directors
or otherwise attempting to obtain control of our company; and
- •
- our board of directors may issue, without stockholder approval, shares of undesignated preferred stock; the ability to issue undesignated preferred stock makes it possible for our board of directors to issue preferred stock with voting or other rights or preferences that could impede the success of any attempt to acquire us.
As a Delaware corporation, we are also subject to certain Delaware anti-takeover provisions. Under Delaware law, a corporation may not engage in a business combination with any holder of 15% or more of its capital stock unless the holder has held the stock for three years or, among other things, the board of directors has approved the transaction. Our board of directors could rely on Delaware law to prevent or delay an acquisition of us.
Certain of our executive officers may be entitled to accelerated vesting of their options pursuant to the terms of their employment arrangements upon a change of control of AltiGen. In addition to the arrangements currently in place with some of our executive officers, we may enter into similar arrangements in the future with other officers. Such arrangements could delay or discourage a potential acquisition of AltiGen.
Our board of directors declared a dividend of one (1) right for each share of Common Stock under the terms and conditions of a Preferred Stock Rights Agreement by and between AltiGen and Computershare Trust Company, N.A. dated April 21, 2009, which right is exercisable for shares of AltiGen's Preferred Stock after the date on which a hostile acquiror obtains, or announces a tender offer for, 15% or more of the Company's Common Stock. If an acquiror obtains 15% or more of the Company's Common Stock, each stockholder (except the acquiror) may purchase either our Common Stock or in certain circumstances, the acquiror's Common Stock, at a discount, resulting in substantial dilution to the acquiror's interest. Such rights could delay or discourage a potential acquisition of AltiGen.
Our common stock could be delisted from the NASDAQ Capital Market.
The price of our common stock has traded below $1.00 per share for a significant period of time. On September 15, 2009, we received notification from the NASDAQ Capital Market that the bid price of our common stock has been below $1.00 per share for 30 consecutive trading days. We have been granted 180 days, or until March 14, 2010, to regain compliance with the minimum bid requirement by maintaining a closing bid price of $1.00 per share or higher for a minimum of 10 consecutive trading days. If we fail to meet the minimum bid price requirement of $1.00 for 10 consecutive trading dates, our common stock may be delisted from the NASDAQ Capital Market. We cannot assure you that we will be able to maintain out listing on the NASDAQ Capital Market.
If our common stock is delisted from the NASDAQ Capital Market, trading, if any, in our common stock may then continue to be conducted in the over-the-counter market in what are commonly referred to as the electronic bulletin board and the "pink sheets." As a result, investors may
23
find it more difficult to dispose of or obtain accurate quotations as to the market value of our common stock. In addition, we would be subject to rules promulgated by the SEC that, if we fail to meet criteria set forth in such rules, impose various practice requirements on broker-dealers who sell securities governed by those rules to persons other than established customers and accredited investors. Consequently, those rules may have a material adverse effect on the ability of broker-dealers to sell our securities, which may materially limit the market liquidity of our common stock and the ability of our stockholders to sell our securities in the secondary market.
A delisting of our common stock will also make us ineligible to use Form S-3 to register the sale of shares of our common stock or to register the resale of our securities with the SEC, thereby making it more difficult and expensive for us to register our common stock or other securities and raise additional capital.
Item 1B. UNRESOLVED STAFF COMMENTS
Not applicable.
We lease approximately 27,576 square feet of space in San Jose, California in which our headquarters, sales, manufacturing and research and development facilities are located and which is used primarily by our Americas Segment. We have a lease agreement covering this property through June 2014. The agreement contains renewal options. Outside the United States, we lease approximately 8,201 square feet of a facility in Shanghai, China, where we conduct administration, research and development, sales and marketing, and another 4,841 square feet of a facility in Beijing, China to serve sales and marketing functions, which is used primarily by our International segment. We believe that our existing facilities both in the United States and China are adequate for our present needs in all material respects. If we require additional space, we believe that we will be able to obtain this space on commercially reasonable terms.
From time to time, we may become party to litigation and subject to various routine claims and legal proceedings that arise in the ordinary course of our business. In accordance with SFAS No. 5, Accounting Contingencies, we make a provision for liability when it is both probable that the liability has been incurred and the amount of the loss can be reasonably estimated. To date, these actions have not had a material adverse effect on our financial position, result of operations or cash flows. Although the results of litigation and claims cannot be predicted with certainty, we believe that the final outcome of such matters would not have a material adverse effect on our business, financial position, results of operation and cash flows. However, litigation is inherently unpredictable, and depending on the amount and timing, an unfavorable resolution of a matter could materially affect our future results of operations, cash flows or financial position in a particular period.
Item 4. SUBMISSION OF MATTERS TO A VOTE OF SECURITY HOLDERS
No matters were submitted to a vote of security holders during the fourth quarter of the Company's fiscal year ended September 30, 2009.
24
Item 5. MARKET FOR REGISTRANT'S COMMON EQUITY, RELATED STOCKHOLDER MATTERS AND ISSUER PURCHASES OF EQUITY SECURITIES
The information required by this item regarding equity compensation plans is incorporated by reference to the information set forth in Item 12 of this Annual Report on Form 10-K.
COMMON STOCK PRICE RANGE
From October 4, 1999, the date of our initial public offering, to June 11, 2002, our common stock was traded on the NASDAQ National Market under the symbol "ATGN". Since June 12, 2002, our common stock has traded on the NASDAQ Capital Market under the symbol "ATGN." The following table sets forth, for the periods indicated, the high and low closing prices of our common stock on the NASDAQ Capital Market. As of September 30, 2009, we had approximately 77 stockholders of record of our common stock. We have never declared or paid any cash dividends on our capital stock. We currently expect to retain future earnings, if any, to support operations and to finance the growth and development of our business. We do not expect to pay cash dividends in the foreseeable future.
The following table shows, for the periods indicated, the high and low intraday sales price per share of our common stock as reported by the NASDAQ Capital Market:
| |
Fiscal 2009 | Fiscal 2008 | |||||||||||
|---|---|---|---|---|---|---|---|---|---|---|---|---|---|
| |
High | Low | High | Low | |||||||||
1st Quarter |
$ | 1.00 | $ | 0.50 | $ | 1.64 | $ | 1.24 | |||||
2nd Quarter |
$ | 0.96 | $ | 0.62 | $ | 1.68 | $ | 1.32 | |||||
3rd Quarter |
$ | 0.80 | $ | 0.61 | $ | 1.61 | $ | 1.11 | |||||
4th Quarter |
$ | 1.10 | $ | 0.62 | $ | 1.30 | $ | 0.66 | |||||
COMPANY STOCK PERFORMANCE
The following performance graph and related information shall not be deemed "soliciting material" or to be "filed" with the Securities and Exchange Commission, nor shall such information be incorporated by reference into any future filing under the Securities Act of 1933 or Securities Exchange Act of 1934, each as amended, except to the extent that we specifically incorporate it by reference into such filing.
25
The following graph compares the cumulative total stockholder return data for our stock for the period beginning September 30, 2004 and ending on September 30, 2009 to the cumulative return over such period of (i) The NASDAQ National Market Composite Index and (ii) the NASDAQ Telecommunications Index. The graph assumes $100 was invested on September 30, 2004 in our Common Stock and in each of the comparative indices, assuming the reinvestment of any dividends. Note that the historic stock price performance on the following graph is not necessarily indicative of future stock price performance.
COMPARISON OF 5 YEAR CUMULATIVE TOTAL RETURN
Among AltiGen Communications, Inc., The NASDAQ Composite Index
and The NASDAQ Telecommunications Index
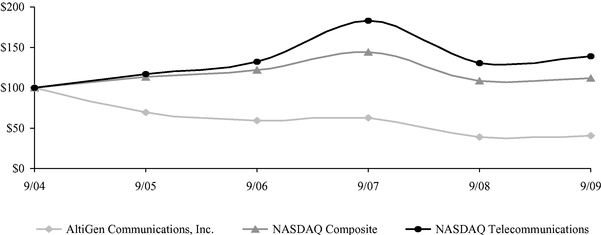
| |
9/04 | 9/05 | 9/06 | 9/07 | 9/08 | 9/09 | |||||||||||||
|---|---|---|---|---|---|---|---|---|---|---|---|---|---|---|---|---|---|---|---|
AltiGen Communications, Inc. |
100.00 | 69.32 | 60.16 | 62.55 | 39.44 | 39.84 | |||||||||||||
NASDAQ Composite |
100.00 | 113.78 | 121.50 | 143.37 | 109.15 | 112.55 | |||||||||||||
NASDAQ Telecommunications |
100.00 | 117.46 | 132.97 | 183.38 | 129.72 | 139.70 | |||||||||||||
- *
- $100 invested on 9/30/04 in stock & index-including reinvestment of dividends. Fiscal year ending September 30.
STOCK REPURCHASE PLAN
On October 23, 2007, our Board of Directors approved the repurchase of up to $2.0 million of our common stock in the open market through November 12, 2008. On November 11, 2008, our Board of Directors extended the repurchase program by another year to November 14, 2009. Stock repurchases under this program were made from time to time at our management's discretion through November 14, 2009. When exercising such discretion, management considered a variety of factors such as our stock price, general business and market conditions and other investment opportunities. The repurchases were made in the open market and funded from available working capital. Pursuant to the 2007 authority, we repurchased 231,135 shares during the twelve months ended September 30, 2008 at an aggregate cost of $367,000. Pursuant to the 2008 authority, we repurchased 23,800 shares during the twelve months ended September 30, 2009 at an aggregate cost of $19,000. In April 2009, we suspended further purchases of stock under this program.
26
Repurchases of our common stock under the latest Board of Directors' authorization is represented in the following table:
Period
|
Total Number of Shares Purchased |
Average Price Paid per Share |
Shares Purchased as Part of Publicly Announced Program |
Approximate Dollar Value of Shares that May Yet be Purchased as Part of the Program |
|||||||||
|---|---|---|---|---|---|---|---|---|---|---|---|---|---|
November 1, 2007 through November 30, 2007 |
16,413 | $ | 1.59 | 16,413 | $ | 1,973,965 | |||||||
December 1, 2007 through December 31, 2007 |
92,965 | 1.60 | 92,965 | 1,825,685 | |||||||||
February 1, 2008 through February 29, 2008 |
80,218 | 1.66 | 80,218 | 1,692,660 | |||||||||
March 1, 2008 through March 31, 2008 |
23,919 | 1.61 | 23,919 | 1,654,084 | |||||||||
August 1, 2008 through August 31, 2008 |
7,211 | 1.21 | 7,211 | 1,645,374 | |||||||||
September 1, 2008 through September 30, 2008 |
10,409 | 1.16 | 10,409 | 1,633,338 | |||||||||
December 1, 2008 through December 31, 2008 |
10,400 | 0.77 | 10,400 | 1,625,311 | |||||||||
January 1, 2009 through January 31, 2009 |
4,275 | 0.79 | 4,275 | 1,621,953 | |||||||||
February 1, 2009 through February 28, 2009 |
3,325 | 0.87 | 3,325 | 1,619,045 | |||||||||
March 1, 2009 through March 31, 2009 |
5,800 | 0.79 | 5,800 | 1,614,461 | |||||||||
April 1, 2009 through September 30, 2009 |
— | — | — | — | |||||||||
Total |
254,935 | $ | 1.51 | 254,935 | $ | 1,614,461 | |||||||
STOCK OPTION EXCHANGE
On September 1, 2009, we completed a stock option exchange program (the "Exchange Offer"). Pursuant to the Exchange Offer, eligible employees tendered, and we accepted for cancellation, eligible options to purchase 2,927,300 shares of our common stock, representing approximately 95% of the total shares of common stock underlying options eligible for exchange in the Exchange Offer. On September 1, 2009, the Company granted new options to eligible employees to purchase 2,927,300 shares of common stock in exchange for the cancellation of the tendered eligible options. The exercise price per share of the new options granted in the Exchange Offer was $0.86, the closing price of our common stock as reported by the NASDAQ Capital Market on September 1, 2009.
27
Item 6. SELECTED FINANCIAL DATA
This section presents selected historical financial data of AltiGen Communications, Inc. This section should be read carefully in conjunction with "Management's Discussion and Analysis of Financial Conditions and Results of Operations" and the consolidated financial statements included in this Form 10-K, including the notes to the consolidated financial statements. The selected data in this section is not intended to replace our consolidated financial statements.
| |
Fiscal Year Ended September 30, | |||||||||||||||
|---|---|---|---|---|---|---|---|---|---|---|---|---|---|---|---|---|
| |
2009 | 2008 | 2007 | 2006 | 2005 | |||||||||||
| |
(In thousands, except per share data) |
|||||||||||||||
Consolidated Statements of Operations Data: |
||||||||||||||||
Net revenue |
$ | 17,385 | $ | 18,897 | $ | 17,888 | $ | 17,896 | $ | 15,441 | ||||||
Cost of revenue |
6,604 | 8,059 | 8,123 | 8,082 | 6,592 | |||||||||||
Gross profit |
10,781 | 10,838 | 9,765 | 9,814 | 8,849 | |||||||||||
Operating expenses: |
||||||||||||||||
Research and development |
4,924 | 4,216 | 3,373 | 3,740 | 3,496 | |||||||||||
Sales and marketing |
7,037 | 7,552 | 5,277 | 4,353 | 3,943 | |||||||||||
General and administrative |
3,654 | 3,322 | 2,497 | 2,058 | 1,946 | |||||||||||
Total operating expenses |
15,615 | 15,090 | 11,147 | 10,151 | 9,385 | |||||||||||
Loss from operations |
(4,834 | ) | (4,252 | ) | (1,382 | ) | (337 | ) | (536 | ) | ||||||
Equity in net income (loss) of investee |
(9 | ) | 5 | (4 | ) | (36 | ) | (12 | ) | |||||||
Interest and other income, net |
118 | 310 | 461 | 380 | 237 | |||||||||||
Net income (loss) before income taxes |
(4,725 | ) | (3,937 | ) | (925 | ) | 7 | (311 | ) | |||||||
Income taxes |
15 | — | (11 | ) | (19 | ) | — | |||||||||
Net loss |
$ | (4,710 | ) | $ | (3,937 | ) | $ | (936 | ) | $ | (12 | ) | $ | (311 | ) | |
Basic and diluted net loss per share |
$ | (0.30 | ) | $ | (0.25 | ) | $ | (0.06 | ) | $ | (0.00 | ) | $ | (0.02 | ) | |
Weighted average and diluted shares used in computing basic net loss per share |
15,937 | 15,745 | 15,363 | 14,964 | 14,605 | |||||||||||
| |
2009 | 2008 | 2007 | 2006 | 2005 | |||||||||||
|---|---|---|---|---|---|---|---|---|---|---|---|---|---|---|---|---|
| |
(In thousands) |
|||||||||||||||
Consolidated Balance Sheets Data: |
||||||||||||||||
Cash, cash equivalents and short-term investments |
$ | 7,397 | $ | 9,867 | $ | 9,907 | $ | 9,922 | $ | 9,422 | ||||||
Working capital(1) |
4,994 | 8,687 | 11,551 | 11,027 | 10,133 | |||||||||||
Total long-term obligations |
5,574 | 5,479 | 2,905 | 2,807 | 2,617 | |||||||||||
Total assets |
11,331 | 14,776 | 15,250 | 14,644 | 13,335 | |||||||||||
Accumulated deficit |
(60,741 | ) | (56,031 | ) | (52,094 | ) | (51,158 | ) | (51,146 | ) | ||||||
Total stockholders' equity |
5,757 | 9,297 | 12,345 | 11,837 | 10,718 | |||||||||||
- (1)
- Working capital is defined as total current assets less total current liabilities.
28
Item 7. MANAGEMENT'S DISCUSSION AND ANALYSIS OF FINANCIAL CONDITION AND RESULTS OF OPERATIONS
FORWARD-LOOKING INFORMATION
This Annual Report on Form 10-K includes "forward-looking statements" within the meaning of Section 27A of the Securities Act and Section 21E of the Exchange Act. All statements other than statements of historical fact are "forward-looking statements" for purposes of these provisions, including any statements regarding: projections of revenues, future research and development expenses, future selling, general and administrative expenses, other expenses, gross profit, gross margin, or other financial items; the plans and objectives of management for future operations; our exposure to interest rate risk; future economic conditions or performance; plans to focus on cost control. In some cases, forward-looking statements can be identified by the use of terminology such as "may," "will," "expects," "plans," "anticipates," "estimates," "potential," or "continue," or the negative thereof or other comparable terminology. These statements are based on the beliefs and assumptions of our management based on information currently available to management. Such forward-looking statements are subject to risks, uncertainties and other important factors that could cause actual results and the timing of certain events to differ materially from future results expressed or implied by such forward-looking statements. Factors that could cause or contribute to such differences include, but are not limited to, those identified below, and those discussed in Item 1A "Risk Factors" included elsewhere in this Annual Report on Form 10-K and in our other filings with the SEC. Furthermore, such forward-looking statements speak only as of the date of this report. We undertake no obligation to update any forward-looking statements to reflect events or circumstances after the date of such statements.
OVERVIEW
AltiGen Communications, Inc. ("we" or the "Company") is a leading provider of 100% Microsoft-based VoIP business phone systems and Unified Communications solutions. We design, deliver and support VoIP phone systems and call center solutions that combine high reliability with integrated IP communications applications. As one of the first companies to offer VoIP solutions, AltiGen has been deploying systems since 1996. We have more than 10,000 customers worldwide with over 15,000 systems in use. Our telephony solutions are primarily used by medium and enterprise sized businesses, companies with multiple locations, corporate branch offices, and call centers.
AltiGen's systems are designed with an open architecture, built on industry standard Intel™ based servers, SIP™ compliant phones, and Microsoft Windows™ based IP applications. This adherence to widely used standards allows our solutions to both integrate with and leverage a company's existing technology investment. AltiGen's award winning, integrated IP applications suite provides customers with a complete business communications solution. Voicemail, Unified Messaging, Automatic Call Distribution, Call Recording, Call Activity Reporting, and Mobility solutions take advantage of the convergence of voice and data communications to achieve superior business results. We believe this enables our customers to implement communication systems solutions that have an increased return on investment versus past technology investments.
We generated net revenue of $17.4 million with a net loss of $4.7 million during fiscal year 2009. As of September 30, 2009, we had an accumulated deficit of $60.7 million. Net cash used in operating activities was $2.3 million in fiscal year 2009.
We derive our revenue from sales of our VoIP communications systems and call center solutions. Product revenue is comprised of direct sales to end-users and resellers and sales to distributors. Revenue from product sales to end users and resellers are recognized upon shipment. We defer recognition of revenue for sales to distributors until they resell our products to their customers. Upon shipment, we also provide a reserve for the estimated cost that may be incurred for product warranty. Under our distribution contracts, a distributor has the right, in certain circumstances, to return
29
products it determines are overstocked, so long as it provides an offsetting purchase order for products in an amount equal to or greater than the dollar value of the returned products. In addition, we provide distributors protection from subsequent price reductions.
Our cost of revenue consists of component and material costs, direct labor costs, provisions for excess and obsolete inventory, warranty costs and overhead related to the manufacturing of our products. Several factors that have affected and will continue to affect our revenue growth are the state of the economy, the market acceptance of our products, our ability to add new resellers and our ability to design, develop, and release new products. We engage third-party assemblers, which in fiscal year 2009 were All Quality Services in Fremont, California and ISIS Surface Mounting, Inc. in San Jose, California to insert the hardware components into the printed circuit board. We purchase fully-assembled chassis from Advantech Corporation, Internet protocol phones from BCM Communications, Inc., single board computers for our MAX product from AAEON Electronics, Inc. and raw material components from Avnet Electronics. We selected our manufacturing partners with the goals of ensuring a reliable supply of high-quality finished products and lowering per unit product costs as a result of manufacturing economies of scale. We cannot assure you that we will maintain the volumes required to realize these economies of scale or when or if such cost reductions will occur. The failure to obtain such cost reductions could materially adversely affect our gross margins and operating results.
We continue to focus on developing enhancements to our current products to provide greater functionality and increased capabilities, based on our market research, customer feedback and our competitors' product offerings, as well as creating new product offerings to both enhance our position in our target market segment and enter new geographical markets. Additionally, we intend to continue selling our products to small- to medium-sized businesses, enterprise businesses, multisite businesses, corporate and branch offices and call centers. Also, we plan to continue to recruit additional resellers and distributors to focus on selling phone systems to our target customers. We believe that the adoption rate for this Internet telephony is much faster with small- to medium-sized businesses because many of these businesses have not yet made a significant investment for a traditional phone system. Also, we believe that small- to medium-sized businesses are looking for call center-type administration to increase the productivity and efficiency of their contacts with customers.
CRITICAL ACCOUNTING POLICIES
Revenue Recognition. Revenue consists of direct sales to end-users, resellers and distributors. Revenue from sales to end-users and resellers is recognized upon shipment, when risk of loss has passed to the customer, collection of the receivable is reasonably assured, persuasive evidence of an arrangement exists, and the sales price is fixed and determinable. Net revenue consists of product revenue reduced by estimated sales returns and allowances. Sales to distributors are made under terms allowing certain rights of return and protection against subsequent price declines on our products held by the distributors. Upon termination of such distribution agreements, any unsold products may be returned by the distributor for a full refund. These agreements may be canceled without cause for convenience following a specified notice period. As a result of these provisions, we defer recognition of distributor revenue until such distributors resell our products to their customers. The amounts deferred as a result of this policy are reflected as "deferred revenue" in the accompanying consolidated balance sheets. The related cost of revenue is also deferred and reported in the consolidated balance sheets as inventory. We recognize revenue derived from sales to customers in China when the following elements are satisfied: customer takes ownership upon shipment and upon receipt of cash. Our short-term deferred revenue was $2.6 million and $2.5 million as of September 30, 2009 and September 30, 2008, respectively. As of September 30, 2009, our long-term deferred revenue was $154,000 compared to $73,000 as of September 30, 2008. The increase in both short-term and long-term deferred revenue was primarily the result of continued growth of our recurring revenue programs. These plans include both
30
the Software Assurance Program, which provides our customers with new software releases and support for an annual fee, and the Premier Service Plan, which includes software assurance and extended hardware warranty.
Service Support Programs. In September 2007, we introduced our Software Assurance Program which provides our customers with the latest updates, new releases, and technical support for the applications they are licensed to use. In fiscal 2008, we initiated our Premier Service Plan, which includes software assurance and extended hardware warranty. These programs have an annual subscription and can range from one to three years. Sales from our service support programs are recorded as deferred revenue and recognized as revenue over the terms of their subscriptions. As of September 30, 2009, our service support deferred revenue was approximately $2.2 million compared to $1.8 million as of September 30, 2008, an increase of 23% over the same period in the prior year. Our new service plan offering remains a significant growth opportunity as we continue to add new service customers.
Software components are generally not sold separately from our hardware components. Software revenue consists of license revenue that is recognized upon delivery of the application products or features. We provide Software Assurance consisting primarily of the latest software updates, patches, new releases and technical support. In accordance with SOP 97-2, revenue earned on software arrangements involving multiple elements is allocated to each element based upon the relative fair value of the elements. The revenue allocated on this element is recognized with the initial licensing fee on delivery of the software. This Software Assurance revenue is in addition to the initial license fee and is recognized over a period of one to three years. The estimated cost of providing Software Assurance during the arrangement is insignificant and unspecified upgrades and enhancements offered at no cost during Software Assurance arrangements have historically been, and are expected to continue to be, minimal and infrequent. All estimated costs of providing the services, including upgrades and enhancements, are spread over the life of the Software Assurance term.
Cash and Cash Equivalent. We consider all highly liquid investments purchased with an initial maturity of three months or less to be cash equivalents. Cash and cash equivalents are invested in various investment grade institutional money market accounts, U.S. Agency securities and commercial paper. The Company's investment policy requires investments to be rated single-A or better. We also hold a total of $2.4 million in cash in China. A total of $2.2 million of this cash is held in a bank term deposit account.
Short-Term Investments. The Company's policy is to invest in highly-rated securities with strong liquidity and requires investments to be rated single-A or better. Short-term investments are comprised of U.S. Agency securities and commercial paper. Short-term investments are highly liquid financial instruments with original maturities greater than three months but less than one year and are classified as "available-for-sale" investments. We classify our available-for-sale securities as current assets and report them at their fair value. Further, we recognize unrealized gains and losses related to these securities as an increase or reduction in stockholders' equity.
Inventory. Inventory is stated at the lower of cost (first-in, first-out method) or market. Our inventory balance was $1.2 million and $1.5 million as of September 30, 2009 and September 30, 2008, respectively. We perform a detailed review of inventory each fiscal quarter, with consideration given to future customer demand for our products, obsolescence from rapidly changing technology, product development plans, and other factors. If future demand or market conditions for our products are less favorable than those projected by management, or if our estimates prove to be inaccurate due to unforeseen technological changes, we may be required to record additional inventory provision which would negatively affect gross margins in the period when the write-downs were recorded. In prior periods, we had established a reserve to write off excess inventory that management believed would not be sold. For the fiscal year ended September 30, 2009, we disposed of fully-reserved inventory with a
31
carrying value of zero and an original cost at $176,000. The disposal of such inventory had no material impact on our revenue, gross margins and net loss for the twelve months ended September 30, 2009. For the fiscal year ended September 30, 2009, we recognized a provision of $17,000 for excess and obsolete inventories as compared to $12,000 for fiscal year ended September 30, 2008. Inventory allowance was $691,000 and $850,000 as of September 30, 2009 and 2008, respectively.
Warranty Cost. We accrue for warranty costs based on estimated product return rates and the expected material and labor costs to provide warranty services. If actual products return rates, repair cost or replacement costs differ significantly from our estimates, then our gross margin could be adversely affected. The reserve for product warranties was $122,000 and $137,000 as of September 30, 2009 and 2008, respectively.
Share-Based Compensation. The Company has estimated the fair value of stock-based compensation for stock options at the date of the grant using the Black-Scholes option-pricing model. The Black-Scholes option-pricing model incorporates various assumptions including expected volatility, expected life and interest rate. The Company uses historical data to estimate option forfeitures. Expected volatility is based on historical volatility and the risk-free interest rate is based on U.S. Treasury yield in effect at the time of the grant for the expected life of the options. The Company does not anticipate paying any dividends in the foreseeable future and therefore used an expected dividend yield of zero in the option valuation model.
32
Results of Operations
The following table sets forth consolidated statements of operations data for the periods indicated as a percentage of net revenue.
| |
Fiscal Year Ended September 30, |
|||||||||||
|---|---|---|---|---|---|---|---|---|---|---|---|---|
| |
2009 | 2008 | 2007 | |||||||||
Consolidated Statements of Operations Data: |
||||||||||||
Net revenue: |
||||||||||||
Hardware |
86.7 | % | 86.2 | % | 90.7 | % | ||||||
Software |
13.3 | 13.8 | 9.3 | |||||||||
Total net revenue |
100.0 | 100.0 | 100.0 | |||||||||
Cost of revenue: |
||||||||||||
Hardware |
37.9 | 41.4 | 44.7 | |||||||||
Software |
0.1 | 1.2 | 0.7 | |||||||||
Total cost of revenue |
38.0 | 42.6 | 45.4 | |||||||||
Gross profit |
62.0 | 57.4 | 54.6 | |||||||||
Operating expenses: |
||||||||||||
Research and development |
28.3 | 22.3 | 18.9 | |||||||||
Sales and marketing |
40.5 | 40.0 | 29.4 | |||||||||
General and administrative |
21.0 | 17.6 | 14.0 | |||||||||
Total operating expenses |
89.8 | 79.9 | 62.3 | |||||||||
Loss from operations |
(27.8 | ) | (22.5 | ) | (7.7 | ) | ||||||
Equity in net loss of investee |
(0.1 | ) | — | — | ||||||||
Interest and other income, net |
0.7 | 1.7 | 2.6 | |||||||||
Net loss before income taxes |
(27.2 | ) | (20.8 | ) | (5.1 | ) | ||||||
Provision for income taxes |
0.1 | — | (0.1 | ) | ||||||||
Net loss |
(27.1 | )% | (20.8 | )% | (5.2 | )% | ||||||
Fiscal Year Ended September 30, 2009 Compared to Fiscal Year Ended September 30, 2008
Net Revenue
Net sales consist primarily of revenue from direct sales to end-users, resellers and distributors.
We are organized and operate as two operating segments, the Americas and International. The Americas segment is comprised of the United States, Canada, Mexico, Central America and the Caribbean. The International segment is comprised of China, the United Kingdom, Italy and Holland.
The following table sets forth percentages of net revenue by geographic region with respect to such revenue for the periods indicated:
| |
Fiscal Year Ended September 30, |
||||||
|---|---|---|---|---|---|---|---|
| |
2009 | 2008 | |||||
Americas |
86 | % | 87 | % | |||
International |
14 | % | 13 | % | |||
Total |
100 | % | 100 | % | |||
33
Net revenue by customers that individually accounted for more than 10% of our revenue for the twelve months ended September 30, 2009 and 2008, respectively, were as follows:
| |
Fiscal Year Ended September 30, |
||||||
|---|---|---|---|---|---|---|---|
| |
2009 | 2008 | |||||
Synnex |
30 | % | 34 | % | |||
Jenne(1) |
15 | % | 12 | % | |||
Fiserv(2) |
10 | % | — | ||||
Altisys(3) |
— | 12 | % | ||||
Total |
55 | % | 58 | % | |||
- (1)
- In
September 2009, we terminated our distribution agreement with Jenne. We believe the termination of our relationship with Jenne will not have a material
impact on our business because we anticipate that revenue from other distributors will offset a portion of the lost revenue.
- (2)
- In
August 2009, we entered into a reseller agreement with Fiserv Solutions, Inc. Our agreement with Fiserv has an initial term of ten years and will
renew automatically for additional five year terms, provided that each party has the right to terminate the agreement for convenience upon ninety (90) days' written notice prior to the end of
the initial term or any subsequent term of the agreement. We believe this relationship will contribute to revenue growth in fiscal 2010.
- (3)
- During fiscal year 2009, revenue generated from Altisys was less than 10% of our total revenue.
The following table sets forth percentages of net revenue by product type with respect to such revenue for the periods indicated:
| |
Fiscal Year Ended September 30, |
||||||
|---|---|---|---|---|---|---|---|
| |
2009 | 2008 | |||||
Hardware |
71 | % | 86 | % | |||
Software |
13 | % | 14 | % | |||
Service Support Plans(1) |
16 | % | — | ||||
Total |
100 | % | 100 | % | |||
- (1)
- In fiscal year 2008, revenue generated from these service support plans accounted for less than 1% of our total revenue. Our hardware revenue in the consolidated statements of operations includes service support revenue generated primarily from our service support plans starting in September 2007.
Net revenue was $17.4 million in fiscal year 2009 as compared to $18.9 million in fiscal year 2008. Revenue generated in the Americas segment accounted for $15.0 million, or 86% of total net revenue, for fiscal year ended September 30, 2009 as compared to $16.5 million, or 87% of total net revenue, for fiscal year ended September 30, 2008. Revenue generated in the International segment accounted for $2.4 million, or 14% of our total net revenue, as compared to $2.4 million, or 13% of our total net revenue, for fiscal year ending September 30, 2009 and 2008, respectively. In the Americas segment, in fiscal year 2009, we generated $2.8 million in non-system related revenue, which is primarily revenue generated from our service support plans as compared to $1.0 million in fiscal year 2008. The change in
34
net revenue excluding non-system related revenue was a decrease of approximately 23%. This decrease in the Americas segment was primarily the result of changes in unit sales volume of existing products. The number of systems shipped in fiscal year 2009 was approximately 28% lower than the previous year. However, the average revenue per system was higher by approximately 7% because our smaller systems, with lower profit margins, decreased while sales of our larger systems, with higher profit margins, increased. The decrease in net revenue for the Americas is primarily due to reduced incoming orders because of the global economic downturn. Although we intend to focus on increasing international sales, we expect that sales to enterprise customers in the United States will continue to comprise the significant majority of our sales.
Cost of Revenue
Our cost of product revenue consists primarily of component and material costs, direct labor costs, provisions for excess and obsolete inventory, warranty costs and overhead related to the manufacturing of our products. The majority of these costs vary with the unit volumes of product sold.
Cost of revenue decreased to $6.6 million in fiscal year 2009 compared to $8.1 million in fiscal year 2008. This decrease was primarily caused by a shift in our product mix and the impact of lower sales volume over the prior year. Cost of revenue as a percentage of net revenue decreased to 38% for fiscal year ended September 30, 2009 from 43% in fiscal year 2008. This change was primarily attributable to an increase of our non-system related revenue.
Research and Development ("R&D") Expenses
Research and development expenses consist primarily of costs related to personnel and overhead, consultant expenses and other costs associated with design, development, prototyping and testing of our products and enhancements of our converged telephone system software. Research and development expenses increased 17% to $4.9 million in 2009 from $4.2 million in fiscal year 2008. The increase in R&D expense in absolute dollars was driven by an increase in personnel-related expense of approximately $353,000 and an increase of $110,000 in consulting related services. Research and development expenses as a percentage of revenue increased from 22% in fiscal year 2008 to 28% in fiscal year 2009.
We intend to continue to make investments in our research and development and we believe that focused investments in research and development are critical to the future growth and our ability to enhance our competitive position in the marketplace. We believe that our ability to develop and meet enterprise customer requirements is essential to our success. Accordingly, we have assembled a team of engineers with expertise in various fields, including voice and IP communications, unified communications network design, data networking and software engineering. Our principal research and development activities are conducted in San Jose, California and our subsidiary in Shanghai, China. Management continues to focus on cost control until business conditions improve. If business conditions deteriorate or the rate of improvement does not meet our expectations, we may implement additional cost-cutting actions.
Sales and Marketing Expenses
Sales and marketing expenses consist primarily of salaries, commissions and related expenses for personnel engaged in marketing, sales and customer support functions, as well as trade shows, advertising, and promotional expenses. Sales and marketing expenses decreased by approximately $515,000, or 7% from $7.6 million in fiscal year 2008 to $7.0 million in fiscal year 2009. The expense decrease in fiscal 2009, as compared to fiscal 2008 in absolute dollars, was primarily driven by a decrease of approximately $81,000 in partner conference expenses and $394,000 in advertising expenses.
35
Sales and marketing expenses as a percentage of net revenue for both fiscal years 2009 and 2008 were 40%.
We anticipate that sales and marketing expenses will decrease but will remain the largest category of our operating expenses in future periods over the short term. We plan to continue investing in our domestic and international marketing activities to help build brand awareness and create sales leads for our channel partners. Management continues to focus on cost control until business conditions improve. If business conditions deteriorate or the rate of improvement does not meet our expectations, we may implement additional cost-cutting actions.
General and Administrative ("G&A") Expenses
General and administrative expenses consist of salaries and related expenses for executive, finance, human resources and administrative personnel, facilities, allowance for doubtful accounts, legal and other general corporate expenses. General and administrative expenses increased 10% to $3.6 million in 2009 from $3.3 million in 2008. The increase in absolute dollars in general and administrative was primarily attributable to an increase of $353,000 in legal expenses associated with corporate governance matters, such as expenses related to our special meeting of stockholders held on June 18, 2009, the adoption of our 2009 Stock Plan and our 2009 Purchase Plan, and the preferred stock rights agreement filed with the SEC on April 23, 2009. Other factors included an increase of $133,000 in service-related expenses. These increased expenses were partially offset by a decrease of $132,000 in non-cash stock based compensation expenses and a decrease of $47,000 in travel related expenses. General and administrative expenses as a percentage of revenue increased from 18% in fiscal year 2008 to 21% in fiscal year 2009.
Management continues to focus on cost control until business conditions improve. If business conditions deteriorate or the rate of improvement does not meet our expectations, we may implement cost-cutting actions
Equity Investment in Common Stock of Private Company
In July 2004, we purchased common stock of a private Korean telecommunications company for approximately $79,000. As a result of this investment, we acquired approximately 23% of the voting power of the company. This gives us the right to nominate and elect one of the three members of the company's current board of directors. We are accounting for this investment using the equity method and record our minority interest of their results in our results of operations. For the fiscal years ended September 30, 2009 and 2008, product sales revenue from this company was approximately $19,000 and $49,000, respectively. Our accounts receivable from this company increased to $22,000 as of September 30, 2009 from $18,000 as of September 30, 2008. As of September 30, 2009 and 2008, total equity in net losses of Korea investee was approximately $9,000 and $3,000, respectively.
Interest Expense and Other Income, Net
Interest expense primarily consists of interest incurred on our capital lease commitments and other income primarily consists of interest earned on cash, cash equivalents and short-term investments. Net interest and other income decreased to $118,000 in fiscal year 2009 from $310,000 in fiscal year 2008. The decrease in interest and other income, net in fiscal year 2009 as compared to fiscal year 2008 was a combination of lower invested balances, reduced cash balances and reduced rates of interest available for cash and investments in financial assets in fiscal 2009. In the longer term, we may generate less interest income if our total invested balance decreases and these decreases are not offset by rising interest rates or increased cash generated from operations or other sources.
36
Fiscal Year Ended September 30, 2008 Compared to Fiscal Year Ended September 30, 2007
Net Revenue
Net sales consist primarily of revenue from direct sales to end-users, resellers and distributors.
We are organized and operate as two operating segments, the Americas and International. The Americas is comprised of the United States, Canada, Mexico, Central America and the Caribbean. The International segment is comprised of China, the United Kingdom and Norway.
The following table sets forth percentages of net revenue by geographic region with respect to such revenue for the periods indicated (in thousands, except revenue percentages):
| |
Fiscal Year Ended September 30, |
||||||
|---|---|---|---|---|---|---|---|
| |
2008 | 2007 | |||||
Americas |
87 | % | 90 | % | |||
International |
13 | % | 10 | % | |||
Total |
100 | % | 100 | % | |||
Net revenue by customers that individually accounted for more than 10% of our revenue for the twelve months ended September 30, 2008 and 2007, respectively, were as follows:
| |
Fiscal Year Ended September 30, |
||||||
|---|---|---|---|---|---|---|---|
| |
2008 | 2007 | |||||
Altisys |
12 | % | 16 | % | |||
Synnex |
34 | % | 50 | % | |||
Jenne(1) |
12 | % | — | ||||
Graybar(2) |
— | 15 | % | ||||
Total |
58 | % | 81 | % | |||
- (1)
- We
did not generate revenue from Jenne during fiscal year ended 2007.
- (2)
- During fiscal year ended September 30, 2008, revenue generated from Graybar was less than 10% of our total revenue. Additionally, in April 2008, we terminated our distribution agreement with Graybar.
The following table sets forth percentage of net revenue by product type with respect to such revenue for the periods indicated:
| |
Fiscal Year Ended September 30, |
||||||
|---|---|---|---|---|---|---|---|
| |
2008 | 2007 | |||||
Hardware(1) |
86 | % | 91 | % | |||
Software |
14 | % | 9 | % | |||
Total |
100 | % | 100 | % | |||
- (1)
- Our hardware revenue includes service support revenue generated primarily from our service support programs starting in September 2007. During fiscal years 2008 and 2007, revenue generated from these service support programs accounted for less than 10% of our total revenue.
37
Net revenue was $18.9 million in fiscal year 2008 as compared to $17.9 million in fiscal year 2007. Revenue generated in the Americas accounted for $16.5 million, or 87% of total net revenue, for fiscal year ended September 30, 2008 as compared to $16.2 million, or 90% of total net revenue, for fiscal year ended September 30, 2007. Revenue generated in the International segment accounted for $2.4 million, or 13% of our total net revenue, as compared to $1.7, or 10% of our total net revenue, for fiscal year ending September 30, 2008 and 2007, respectively. In the Americas segment, non-system related revenue was $1.0 million in fiscal year 2008 as compared to $117,000 in fiscal year 2007. Non-system related revenue is primarily generated from our service support plans. The change in net revenue excluding non-system related revenue was a decrease of approximately 3%. This decrease in the Americas segment was primarily attributable to a change in our product mix. The number of systems shipped in fiscal year 2008 was approximately 2.5% lower than the previous year and the average revenue per system was lower by approximately 0.8% because our smaller systems decreased approximately 13% while larger systems increased 53%. The increase in net revenue in the International segment was primarily attributable to our efforts to develop and expand our international operations.
Cost of Revenue
Our cost of product revenue consists primarily of component and material costs, direct labor costs, provisions for excess and obsolete inventory, warranty costs and overhead related to the manufacturing of our products. The majority of these costs vary with the unit volumes of product sold. Cost of revenue for fiscal years 2008 and 2007 remained unchanged at $8.1 million. Cost of revenue as a percentage of net revenue decreased to 43% for fiscal year ended September 30, 2008 from 45% in fiscal year 2007. This change was largely due to an increase in our non-system related revenue.
Research and Development ("R&D") Expenses
Research and development expenses consist primarily of costs related to personnel and overhead, consultant expenses and other costs associated with design, development, prototyping and testing of our products and enhancements of our converged telephone system software. Research and development expenses increased 25% to $4.2 million in 2008 from $3.4 million in fiscal year 2007. The increase in R&D expense in absolute dollars was primarily attributable to an increase in personnel-related expense of approximately $609,000, an increase in project related expenses of approximately $111,000 and an increase of $134,000 in consulting related services. The increase in personnel-related expensed was the result of increased headcount of approximately 14%. Research and development expenses as a percentage of revenue increased from 19% in fiscal year 2007 to 22% in fiscal year 2008.
Sales and Marketing Expenses
Sales and marketing expenses consist primarily of salaries, commissions and related expenses for personnel engaged in marketing, sales and customer support functions, as well as trade shows, advertising, and promotional expenses. Sales and marketing expenses increased by approximately $2.3 million, or 43% from $5.3 million in fiscal year 2007 to $7.6 million in fiscal year 2008. The expense increase in fiscal 2008, as compared to fiscal 2007 in absolute dollars, was primarily related to an increase in personnel-related and overhead expenses of approximately $1.1 million due to an increase in headcount of approximately 30%. Other factors included an increase in share-based compensation expense of $73,000, an increase in promotional and lead generation programs of $130,000, an increase of $108,000 in advertising, $163,000 increase in partner conference expenses. Additionally, travel expenses, consulting expenses and sales and marketing expenses in China accounted for $684,000. The expense increase in our China operations was primarily due to our efforts to develop and expand our international operations to help increase international sales. Sales and marketing expenses as a percentage of revenue increased from 29% in fiscal year 2007 to 40% in fiscal year 2008.
38
General and Administrative ("G&A") Expenses
General and administrative expenses consist of salaries and related expenses for executive, finance, human resources and administrative personnel, facilities, allowance for doubtful accounts, legal and other general corporate expenses. General and administrative expenses increased 33% to $3.3 million in 2008 from $2.4 million in 2007. The expense increase in absolute dollars was primarily attributable to an increase in personnel-related expenses of approximately $318,000, $217,000 increase in non-cash stock based compensation expense, as required by SFAS No. 123(R), $141,000 increase in service and bank related expenses and $112,000 increase in general and administrative expenses in China. Approximately $84,000 in service and bank related expenses were attributable to increased bank fees due to an increase in our online sales activities such as the service support plans. The increase in personnel-related and non-cash stock based compensation expense are directly tied to the hiring of our new president and chief operating officer. General and administrative expenses as a percentage of revenue increased from 14% in fiscal year 2007 to 18% in fiscal year 2008.
Equity Investment in Common Stock of Private Company
In July 2004, we purchased common stock of a private Korean telecommunications company for approximately $79,000. As a result of this investment, we acquired approximately 23% of the voting power of the company. This gives us the right to nominate and elect one of the three members of the company's current board of directors. We are accounting for this investment using the equity method. For the fiscal years ended September 30, 2008 and September 30, 2007, product sales revenue from this company was $49,000 and $33,000, respectively. Our accounts receivable from this company was $18,000 as of September 30, 2008 compared to $16,000 as of September 30, 2007. As of September 30, 2008 and 2007, total equity in net losses of Korea investee was approximately $3,000 and $4,000, respectively.
Interest Expense and Other Income, Net
Interest expense primarily consists of interest incurred on our capital lease commitments and other income primarily consists of interest earned on cash, cash equivalents and short-term investments. Net interest and other income decreased to $319,000 in fiscal year 2008 from $461,000 in fiscal year 2007. The change was related to lower interest rates as well as decreased interest income from a reduced cash balance in fiscal year 2008. The reduced cash balance was primarily the result of our stock repurchase activity. The weighted average interest rate earned by us on our cash, cash equivalents and short-term investments decreased to 2.67% in fiscal year 2008 as compared to the 5.36% rate earned in fiscal 2007.
Liquidity and Capital Resources
Since inception, we have financed our operations primarily through the sale of equity securities. As of September 30, 2009 and 2008, we held cash, cash equivalents and short-term investments totaling $7.4 million and $9.8 million, respectively. Total cash, cash equivalents and short-term investments represents approximately 72% and 70% of total current assets for fiscal years 2009 and 2008, respectively.
The following table summarizes our cash and cash equivalents and short-term investments as of September 30:
| |
2009 | 2008 | 2007 | |||||||
|---|---|---|---|---|---|---|---|---|---|---|
| |
(In thousands) |
|||||||||
Cash and cash equivalents |
$ | 7,397 | $ | 9,467 | $ | 6,111 | ||||
Short-term investments |
— | 400 | 3,796 | |||||||
Total cash, cash equivalents and short-term investments |
$ | 7,397 | $ | 9,867 | $ | 9,907 | ||||
39
The following table shows the major components of our consolidated statements of cash flows for the last three fiscal years:
| |
Fiscal Year Ended September 30, |
||||||||||
|---|---|---|---|---|---|---|---|---|---|---|---|
| |
2009 | 2008 | 2007 | ||||||||
| |
(In thousands) |
||||||||||
Cash and equivalents, beginning of period |
$ | 9,467 | $ | 6,111 | $ | 5,053 | |||||
Cash (used in) provided by operating activities |
(2,196 | ) | 77 | (712 | ) | ||||||
Cash (used in) provided by investing activities |
(139 | ) | 3,300 | 931 | |||||||
Cash (used in) provided by financing activities |
103 | (21 | ) | 839 | |||||||
Cash and equivalents, end of period |
$ | 7,397 | $ | 9,467 | $ | 6,111 | |||||
In fiscal year 2009, our net cash used in operating activities was $2.2 million compared to net cash provided by operating activities of $77,000 during the same period in fiscal 2008. This was primarily attributable to our net loss of $4.7 million for fiscal year 2009, a decrease of $878,000 in accounts receivable, a decrease of $328,000 in net inventories, a decrease of $69,000 in accounts payable, an increase of $165,000 in deferred revenue and an increase of $46,000 in other long-term liabilities. The cash impact of the loss for the twelve months ended September 30, 2009 was partially offset by a non-cash expense of $905,000 in stock-based compensation and $250,000 in depreciation and amortization costs. Generally, as sales levels fall, we expect accounts receivable and accounts payable, and to a lesser extent inventories, to decrease. Inventories react more slowly because we outsource much of our production, and reduced demand takes time to be reflected back through our supply chain. Further, there will be routine fluctuations in these accounts from period to period that may be significant in amount.
Net accounts receivable decreased 36% from $2.4 million at September 30, 2008 to $1.5 million at September 30, 2009. Our days sales outstanding (DSO) decreased from 43 days as of September 30, 2008 to 29 days as of September 30, 2009. Net accounts receivable and DSO decrease was primarily due to lower shipments and quicker collections during the fourth quarter of fiscal 2009. As we continue to focus on developing products that allow us to enhance our position in our target market segment and enter new markets, we expect to achieve our goal of revenue growth for fiscal year 2010.
Net inventories decreased 21% from $1.6 million at September 30, 2008 to $1.2 million at September 30, 2009. The decrease in net inventories during the fiscal year ended September 30, 2009 was largely due to a write off of certain obsolete inventories as a result of our concerted effort to reduce inventory levels to a lower level in fiscal year 2009. Our annualized inventory turn rate, which represents the number of times inventory is replenished during the year, increased from 5.3 turns as of September 30, 2008 to 5.5 turns as of September 30, 2009. Inventory management will continue to be an area of focus as we balance the need to maintain strategic inventory levels to help ensure competitive lead times with the risk of inventory obsolescence due to rapidly changing technology and customer requirements.
We ended the fourth quarter of fiscal 2009 with a cash conversion cycle of 55 days, as compared to 77 days for the fourth quarter of fiscal 2008. The cash conversion cycle is the duration between purchase of inventories and services and the collection of the cash from the sale of our products and services and is a metric on which we have focused as we continue to try to efficiently manage our assets. The cash conversion cycle results from the calculation of (a) the days of sales outstanding added to (b) the days of supply in inventories and reduced by (c) the days of payable outstanding. The decrease in our cash conversion cycle was primarily due to quicker collections during the fourth quarter of fiscal 2009.
40
Net cash used in investing activities was $139,000 as compared to net cash provided by investing activities of $3.3 million in fiscal year 2008. This was directly related to proceeds from maturities of short-term investments of approximately $5.8 million and purchases of short-term investments of approximately $5.4 million in fiscal year 2009 as compared to proceeds from maturities of short-term investments of approximately $48.0 million and purchases of short-term investments of approximately $45.0 million during fiscal 2008. The maturities of the Company's short term investments are staggered throughout the year so that cash requirements are met. During fiscal year 2009, the Company spent approximately $328,000 on purchases of property and equipment compared to $182,000 in fiscal year 2008. Additionally, in fiscal 2009 we reserved $200,000 as collateral for an irrevocable and negotiable standby letter of credit (the "Letter of Credit") as security for a facility lease. The $200,000 is recorded as part of the long-term deposit in the accompanying consolidated balance sheet.
Net cash provided by financing activities was approximately $103,000, as compared to net cash used in financing activities of $21,000 during fiscal 2008.This change was primarily attributable to the repurchase of our treasury stock of approximately $19,000 in fiscal 2009 as compared to $367,000 in fiscal 2008. During fiscal 2009, proceeds from issuance of common stock under employee stock plans represented approximately $122,000 as compared to $346,000 in fiscal 2008.
On October 23, 2007, our Board of Directors approved the repurchase of up to $2.0 million of our common stock in the open market through November 12, 2008. On November 11, 2008, our Board of Directors extended the repurchase program by another year to November 14, 2009. Stock repurchases under this program were be made from time to time at our management's discretion through November 14, 2009. When exercising such discretion, management considered a variety of factors such as our stock price, general business and market conditions and other investment opportunities. The repurchases were made in the open market and funded from available working capital. Pursuant to the 2007 authority, we repurchased 231,135 shares during the twelve months ended September 30, 2008 at an aggregate cost of $367,000. Pursuant to the 2008 authority, we repurchased 23,800 shares during the twelve months ended September 30, 2009 at an aggregate cost of $19,000. In April 2009, we suspended further purchases of stock under this program.
We believe our existing balances of cash, cash equivalents and short-term investments, as well as cash expected to be generated from operating activities, will be sufficient to satisfy our working capital needs, capital expenditures and other liquidity requirements associated with our existing operations over the next 12 months.
Our cash needs depend on numerous factors, including market acceptance of and demand for our products, our ability to develop and introduce new products and enhancements to existing products, the prices at which we can sell our products, the resources we devote to developing, marketing, selling and supporting our products, the timing and expense associated with expanding our distribution channels, increases in manufacturing costs and the prices of the components we purchase, as well as other factors. If we are unable to raise additional capital or if sales from our new products or enhancements are lower than expected, we will be required to make additional reductions in operating expenses and capital expenditures to ensure that we will have adequate cash reserves to fund operations.
Additional financing, if required, may not be available on acceptable terms, or at all. We also may require additional capital to acquire or invest in complementary businesses or products or to obtain the right to use complementary technologies. If we cannot raise additional funds in the future if needed, on acceptable terms, we may not be able to further develop or enhance our products, take advantage of opportunities, or respond to competitive pressures or unanticipated requirements, which could seriously harm our business. Even if additional financing is available, we may be required to obtain the consent of our stockholders, which we may or may not be able to obtain. In addition, the issuance of equity or equity-related securities will dilute the ownership interest of our stockholders and the issuance of debt securities could increase the risk or perceived risk of investing in our securities.
41
We did not have any material commitments for capital expenditures as of September 30, 2009. We had total outstanding commitments on noncancelable capital and operating leases of $1.8 million as of September 30, 2009. Lease terms on our existing facility operating leases generally range from three to nine years. We believe that we have sufficient cash reserves to allow us to continue our current operations for more than a year.
Contractual Obligations
The following table depicts our contractual obligations as of September 30, 2009:
| |
Payments Due by Period | |||||||||||||||
|---|---|---|---|---|---|---|---|---|---|---|---|---|---|---|---|---|
Contractual Obligations
|
Total | Payments Due in Less Than 1 Year |
Payments Due in 1 - 3 Years |
Payments Due in 3 - 5 Years |
Payments Due in More Than 5 Years |
|||||||||||
| |
(In thousands) |
|||||||||||||||
Operating leases obligation |
$ | 1,753 | $ | 583 | $ | 922 | $ | 248 | $ | — | ||||||
Capital leases obligation |
33 | 33 | — | — | — | |||||||||||
Total contractual lease obligation |
$ | 1,786 | $ | 616 | $ | 922 | $ | 248 | $ | — | ||||||
Recently Issued Accounting Pronouncements
In October 2008, the Company adopted FASB ASC 820-10, Fair Value Measurements and Disclosures—Overall ("ASC 820-10") with respect to its financial assets and liabilities. In February 2008, the FASB issued updated guidance related to fair value measurements, which is included in the Codification in ASC 820-10-55, Fair Value Measurements and Disclosures—Overall—Implementation Guidance and Illustrations. The updated guidance provided a one year deferral of the effective date of ASC 820-10 for non-financial assets and non-financial liabilities, except those that are recognized or disclosed in the financial statements at fair value at least annually. Therefore, the Company will adopt the provisions of ASC 820-10 for non-financial assets and non-financial liabilities effective October 1, 2009, and such adoption is not expected to have a material impact on the Company's consolidated results of operations, financial condition or liquidity.
In June 2009, the Company adopted FASB ASC 855-10, Subsequent Events—Overall ("ASC 855-10"). ASC 855-10 establishes general standards of accounting for and disclosure of events that occur after the balance sheet date but before financial statements are issued or are available to be issued. It requires the disclosure of the date through which an entity has evaluated subsequent events and the basis for that date—that is, whether that date represents the date the financial statements were issued or were available to be issued. This disclosure should alert all users of financial statements that an entity has not evaluated subsequent events after that date in the set of financial statements being presented. Adoption of ASC 855-10 did not have a material impact on the Company's consolidated results of operations, financial position or liquidity. See the "Subsequent Events" section in Note 1to the consolidated financial statements for the related disclosures.
In June 2009, the Company adopted FASB ASC 825-10-65, Financial Instruments—Overall—Transition and Open Effective Date Information ("ASC 825-10-65"). ASC 825-10-65 amends ASC 825-10 to require disclosures about fair value of financial instruments in interim financial statements as well as in annual financial statements and also amends ASC 270-10, Presentation—Interim Reporting—Overall, to require those disclosures in all interim financial statements. The adoption of ASC 825-10-65 did not have a material impact on the Company's consolidated results of operations, financial position or liquidity.
In June 2009, the FASB issued The FASB Accounting Standards Codification and the Hierarchy of Generally Accepted Accounting Principles (the "Codifications"), a replacement of the existing
42
codification standards. The Codification, which was launched on July 1, 2009, became the single source of authoritative non-governmental U.S. generally accepted accounting principles (GAAP), superseding various existing authoritative accounting pronouncements. The Codification eliminates the existing GAAP hierarchy and establishes one level of authoritative GAAP. All other literature is considered non-authoritative. This Codification is effective for financial statements issued for interim and annual periods ending after September 15, 2009. The Company adopted the Codification in the fourth quarter of 2009. There was no change to the Company's consolidated financial statements due to the implementation of the Codification other than changes in reference to various authoritative accounting pronouncements in its notes to the consolidated financial statements.
In September 2009, FASB issued ASU 2009-13, Revenue Recognition (Topic 605): Multiple-Deliverable Revenue Arrangements. As summarized in ASU 2009-13, ASC Topic 605 has been amended (1) to provide updated guidance on whether multiple deliverables exist, how the deliverables in an arrangement should be separated, and the consideration allocated; (2) to require an entity to allocate revenue in an arrangement using estimated selling prices of deliverables if a vendor does not have vendor-specific objective evidence ("VSOE") or third-party evidence of selling price; and (3) to eliminate the use of the residual method and require an entity to allocate revenue using the relative selling price method. The accounting changes summarized in ASU 2009-14 and ASU 2009-13 are both effective for fiscal years beginning on or after June 15, 2010, with early adoption permitted. Adoption may either be on a prospective basis or by retrospective application. The Company is currently assessing the impact of this guidance to its consolidated financial statements.
In October 2009, FASB issued ASU 2009-14, Software (Topic 985)—Certain Revenue Arrangements That Include Software Elements. This standard changes the accounting model for revenue arrangements that include both tangible products and software elements. Under this guidance, tangible products containing software components and nonsoftware components that function together to deliver the tangible product's essential functionality are excluded from the software revenue guidance in Subtopic 985-605, Software-Revenue Recognition. In addition, hardware components of a tangible product containing software components are always excluded from the software revenue guidance. FASB Accounting Standards Updates 2009-14 is effective prospectively for revenue arrangements entered into or materially modified in fiscal years beginning on or after June 15, 2010. Early adoption is permitted. The Company is currently assessing the impact of this guidance to its consolidated financial statements.
Item 7A. QUANTITATIVE AND QUALITATIVE DISCLOSURES ABOUT MARKET RISK
Market Interest Rate Risk
At September 30, 2009, our investment portfolio consisted primarily of cash and cash equivalents of $7.4 million. These securities are subject to interest rate risk and will decline in value if market interest rates increase. Our interest income and expense is most sensitive to fluctuations in the general level of U.S. interest rates. As such, changes in U.S. interest rates affect the interest earned on our cash, cash equivalents and short-term investments, and the fair value of those investments. Due to the short duration and conservative nature of these instruments, we do not believe that we have a material exposure to interest rate risk. For example, if market interest rates were to increase immediately and uniformly by 10% from levels as of September 30, 2009, the decline in the fair value of the portfolio would not have a material effect on our results of operations over the next fiscal year.
Foreign Currency Exchange Risk
We transact a portion of our business in non-U.S. currencies, primarily the Chinese Yuan (Renminbi). In the short term, we do not foresee foreign exchange currency fluctuations to pose a material market risk to us. In future periods over the long term, we anticipate we will be exposed to fluctuations in foreign currency exchange rates on accounts receivable from sales in these foreign currencies and the net monetary assets and liabilities of the related foreign subsidiary located in Shanghai, China. A hypothetical 10% favorable or unfavorable change in foreign currency exchange rates would not have a material impact on our results of operations.
43
Item 8. FINANCIAL STATEMENTS AND SUPPLEMENTARY DATA
The financial statements required by this item are incorporated by reference from Part IV Item 15(a) 1 and 2 hereof.
- 1.
- INDEX TO CONSOLIDATED FINANCIAL STATEMENTS
The following Consolidated Financial Statements are filed as part of this report:
- 2.
- INDEX TO FINANCIAL STATEMENT SCHEDULE
The following financial statement schedule is submitted herewith:
44
Item 9. CHANGES IN AND DISAGREEMENTS WITH ACCOUNTANTS ON ACCOUNTING AND FINANCIAL DISCLOSURE
None.
Item 9A. CONTROL AND PROCEDURES
Evaluation of Disclosure Controls and Procedures
Based on an evaluation under the supervision and with the participation of our management, our Chief Executive Officer("CEO") and Chief Financial Officer (("CFO") have concluded that our disclosure controls and procedures as defined in Rules 13a-15(e) and 15d-15(e) under the Securities Exchange Act of 1934, as amended ("Exchange Act") were effective as of September 30, 2009 to ensure that information required to be disclosed by us in reports that we file or submit under the Exchange Act is recorded, processed, summarized and reported within the time periods specified in the Securities and Exchange Commission rules and forms and accumulated and communicated to our management, including our CEO and CFO, as appropriate, to allow timely decisions regarding required disclosure.
Because of its inherent limitations, internal control over financial reporting may not prevent or detect misstatements. Also, projections of any evaluation of effectiveness to future periods are subject to the risk that controls may become inadequate because of changes in conditions, or that the degree of compliance with the policies or procedures may deteriorate.
This annual report does not include an attestation report of the Company's registered public accounting firm regarding internal control over financial reporting. Management's report was not subject to attestation by the Company's registered public accounting firm pursuant to temporary rules of the Securities and Exchange Commission that permit the Company to provide only management's report in this annual report.
Changes in Internal Control over Financial Reporting
As required by Rule 13a-15(d) of the Exchange Act, our management, including our Chief Executive Officer and Chief Financial Officer, conducted an evaluation of our "internal control over financial reporting" as defined in Exchange Act Rule 13a-15(f) to determine whether any changes in our internal control over financial reporting occurred during the fourth quarter of fiscal 2009 that materially affected, or are reasonably likely to materially affect, our internal control over financial reporting. Based on that evaluation, there have been no such changes during the fourth quarter of fiscal 2009.
None.
45
Item 10. DIRECTORS, EXECUTIVE OFFICERS AND CORPORATE GOVERNANCE
The information concerning our directors and executive officers required by this Item is incorporated by reference from the information set forth in the sections entitled "Election of Directors", "Code of Business Conduct and Ethics", "Executive Officers", and "Section 16(a) Beneficial Ownership Reporting Compliance" in our Proxy Statement related to the Annual Stockholder Meeting to be held on March 11, 2010, to be filed by the Company with the SEC (the "Proxy Statement").
Item 11. EXECUTIVE COMPENSATION
The information required by this section is incorporated by reference from the information in the section titled "Executive Compensation and Other Matters" in our Proxy Statement for the Annual Stockholder Meeting to be held on March 11, 2010.
Item 12. SECURITY OWNERSHIP OF CERTAIN BENEFICIAL OWNERS AND MANAGEMENT AND RELATED STOCKHOLDER MATTERS
The information required by this section is incorporated by reference from the information in the section titled: "Security Ownership of Certain Beneficial Owners and Management" in our Proxy Statement for the Annual Stockholder Meeting to be held on March 11, 2010.
Equity Compensation Plan Information
The following table summarizes information about our existing equity compensation plans as of September 30, 2009. All outstanding awards relate to our common stock.
Plan category
|
Number of securities to be issued upon exercise of outstanding options, warrants and rights (a) |
Weighted-average exercise price of outstanding options, warrants and rights (b) |
Number of securities remaining available for future issuance under equity compensation plans (excluding securities reflected in column (a))(c) |
|||||||
|---|---|---|---|---|---|---|---|---|---|---|
Equity compensation plans approved by security holders: |
||||||||||
Option plans |
4,362,891 | $ | 0.91 | 2,645,741 | ||||||
Employee stock purchase plan |
— | — | 1,500,000 | |||||||
Equity compensation plans not approved by security holders |
— | — | — | |||||||
Total |
4,362,891 | $ | 0.91 | 4,145,741 | ||||||
Item 13. CERTAIN RELATIONSHIPS AND RELATED TRANSACTIONS, AND DIRECTOR INDEPENDENCE
The information required by this item regarding certain relationships and related transactions is incorporated by reference to the information set forth in the section titled "Certain Relationships and Related Transactions" in our Proxy Statement for the Annual Stockholder Meeting to be held on March 11, 2010.
Item 14. PRINCIPAL ACCOUNTANT FEES AND SERVICES
The information required by this item regarding audit and non-audit fees is incorporated by reference to the information set forth in the section titled "Audit and Non-Audit Fees" in our Proxy Statement for the Annual Stockholder Meeting to be held on March 11, 2010.
46
Item 15. EXHIBITS AND FINANCIAL STATEMENT SCHEDULES
- (a)
- The
following documents are filed as a part of this Annual Report on Form 10-K.
- 1.
- FINANCIAL STATEMENTS
- 2.
- FINANCIAL STATEMENT SCHEDULES
The following financial statement schedule is submitted herewith:
(All other schedules are omitted because they are not applicable or the required information is shown in the Consolidated Financial Statements or notes thereto.)
- 3.
- EXHIBITS
The following exhibits are included in this Annual Report on Form 10-K (numbered in accordance with Item 601 of Regulation S-K):
| Exhibit Number | Description | ||
|---|---|---|---|
| 3.1 | (1) | Amended and Restated Certificate of Incorporation. | |
| 3.2 | (5) | Second Amended and Restated Bylaws. | |
| 3.3 | (10) | Certificate of Designation of Rights, Preferences and Privileges of Series A Participating Preferred Stock of AltiGen Communications, Inc. | |
| 4.1 | (11) | Preferred Stock Rights Agreement, dated as of April 21, 2009, between AltiGen Communications, Inc. and Computershare Trust Company, N.A., including the Certificate of Designation, the form of Rights Certificate and the Summary of Rights attached thereto as Exhibits A, B and C, respectively. | |
| 4.2 | (1) | Specimen common stock certificates. | |
| 4.3 | (1) | Third Amended and Restated Rights Agreement dated May 7, 1999 by and among AltiGen Communications, Inc. and the Investors and Founder named therein. | |
| 10.1 | (1) | Form of Indemnification Agreement. | |
| 10.2 | (1) | 1994 Stock Option Plan, as amended, and form of stock option agreement. | |
| 10.3 | (4) | 1999 Stock Plan, as amended, and form of stock option agreement. | |
| 10.4 | (3) | 1999 Employee Stock Purchase Plan, as amended, and forms of subscription agreement and notice of withdrawal. | |
47
| Exhibit Number | Description | ||
|---|---|---|---|
| 10.5 | Lease agreement: 410 East Plumeria Drive, San Jose, California between FSP Montague Business Center Corp., a Delaware Corporation and AltiGen Communications, Inc., dated April 16, 2009. | ||
| 10.6 | (1) | Employment Agreement by and between the Registrant and Philip McDermott, dated June 8, 1999. | |
| 10.7 | (9) | Amended and Restated Executive Employment Agreement by and between Philip McDermott and the Company, dated March 6, 2009. | |
| 10.8 | (7) | Executive Employment Agreement by and between Jeremiah J. Fleming and the Company, dated December 18, 2007. | |
| 10.9 | (9) | Executive Employment Agreement by and between Gilbert Hu and the Company, dated March 6, 2009. | |
| 10.10 | (2)++ | OEM Agreement between AltiSys Communications and AltiGen Communications, Inc., dated January 18, 1999. | |
| 10.12 | (4)++ | Distribution Agreement between Synnex Information Technologies, Inc. and AltiGen Communications, Inc. dated December 22, 1999. | |
| 10.13 | (8) | Distribution Agreement between Jenne Distributor, Inc., and AltiGen Communications, Inc. dated September 30, 2007. | |
| 10.14 | +++ | Reseller Agreement between Fiserv Solutions, Inc. and AltiGen Communications, Inc. dated August 28, 2009. | |
| 10.15 | (12) | 2009 Equity Incentive Plan and form of stock option agreement thereunder. | |
| 10.16 | (12) | 2009 Employee Stock Purchase Plan. | |
| 21.1 | (1) | Subsidiaries of the Registrant. | |
| 23.1 | Consent of Independent Registered Public Accounting Firm. | ||
| 24.1 | Power of Attorney (included on signature page). | ||
| 31.1 | Certification of Principal Executive Officer, filed herewith. | ||
| 31.2 | Certification of Principal Financial Officer, filed herewith. | ||
| 32.1 | Certification of Chief Executive Officer Pursuant to 18 U.S.C. Section 1350, as Adopted Pursuant to Section 906 of the Sarbanes-Oxley Act of 2002, filed herewith. | ||
| 32.2 | Certification of Chief Financial Officer Pursuant to 18 U.S.C. Section 1350, as Adopted Pursuant to Section 906 of the Sarbanes-Oxley Act of 2002, filed herewith. | ||
| (1) | Incorporated by reference to exhibit filed with the Registrant's Registration Statement on Form S-1 (No. 333-80037) declared effective on October 4, 1999. | |
(2) |
Incorporated by reference to exhibit filed with the Registrant's Quarterly Report on Form 10-Q for the quarter ended December 31, 2001. |
|
(3) |
Incorporated by reference to exhibit filed with the Registrant's Annual Report on Form 10-K for the fiscal year ended September 30, 2002. |
|
(4) |
Incorporated by reference to exhibit filed with the Registrant's Annual Report on Form 10-K for the fiscal year ended September 30, 2003. |
48
| (5) | Incorporated by reference to exhibit filed with the Registrant's Quarterly Report on Form 10-Q for the quarter ended March 31, 2004. | |
(7) |
Incorporated by reference to exhibit filed with the Registrant's Registration Statement on Form 8-K (No. 000-27427). |
|
(8) |
Incorporated by reference to exhibit filed with the Registrant's Annual Report on Form 10-K for the fiscal year ended September 30, 2007 (No. 000-27427). |
|
(9) |
Incorporated by reference to exhibit filed with the Registrant's Registration Statement on Form 8-K on March 10, 2009. |
|
(10) |
Incorporated by reference to exhibit filed with the Registrant's Registration Statement on Form 8-A on April 23, 2009. |
|
(11) |
Incorporated by reference to exhibit filed with the Registrant's Registration Statement on Form 8-K on April 23, 2009. |
|
(12) |
Incorporated by reference to exhibit filed with the Registrant's Registration Statement on Form S-8 on June 29, 2009. |
|
++ |
Confidential treatment was granted for certain portions of this exhibit. |
|
+++ |
Confidential treatment requested for certain portions of this agreement. |
49
REPORT OF INDEPENDENT REGISTERED PUBLIC ACCOUNTING FIRM
To
the Board of Directors and Stockholders of
AltiGen Communications, Inc.
San Jose, CA
We have audited the accompanying consolidated balance sheets of AltiGen Communications, Inc. and subsidiary (the "Company") as of September 30, 2009 and 2008, and the consolidated statements of operations, stockholders' equity, and cash flows for the years ended September 30, 2009, 2008 and 2007. Our audits also included the financial statement schedule for the years ended September 30, 2009 and 2008 listed in the Index at Item 15(a)(2). These financial statements and financial statement schedules are the responsibility of the Company's management. Our responsibility is to express an opinion on the financial statements and financial statement schedules based on our audits.
We conducted our audits in accordance with the standards of the Public Company Accounting Oversight Board (United States). Those standards require that we plan and perform the audit to obtain reasonable assurance about whether the financial statements are free of material misstatement. The Company is not required to have, nor were we engaged to perform, an audit of its internal control over financial reporting. Our audits included consideration of internal control over financial reporting as a basis for designing audit procedures that are appropriate in the circumstances, but not for the purpose of expressing an opinion on the effectiveness of the Company's internal control over financial reporting. Accordingly, we express no such opinion. An audit also includes examining, on a test basis, evidence supporting the amounts and disclosures in the financial statements, assessing the accounting principles used and significant estimates made by management, as well as evaluating the overall financial statement presentation. We believe that our audits provide a reasonable basis for our opinion.
In our opinion, such consolidated financial statements present fairly, in all material respects, the financial position of AltiGen Communications, Inc. and subsidiary as of September 30, 2009 and 2008, and the consolidated results of their operations and their cash flows for the periods ended September 30, 2009, 2008 and 2007, in conformity with accounting principles generally accepted in the United States of America. Also, in our opinion, the financial statement schedule, when considered in relation to the consolidated financial statements taken as a whole, presents fairly in all material respects the information set forth therein.
/s/ MOSS ADAMS LLP
Santa
Clara, California
December 28, 2009
50
ALTIGEN COMMUNICATIONS, INC. AND SUBSIDIARY
CONSOLIDATED BALANCE SHEETS
| |
September 30, | ||||||||||
|---|---|---|---|---|---|---|---|---|---|---|---|
| |
2009 | 2008 | |||||||||
| |
(In thousands, except share and per share amounts) |
||||||||||
ASSETS |
|||||||||||
Current assets: |
|||||||||||
Cash and cash equivalents |
$ | 7,397 | $ | 9,467 | |||||||
Short-term investments |
— | 400 | |||||||||
Accounts receivable, net of allowances of $35 and $19 as of September 30, 2009 and 2008, respectively |
1,545 | 2,423 | |||||||||
Inventories, net |
1,266 | 1,594 | |||||||||
Prepaid expenses and other current assets |
128 | 176 | |||||||||
Total current assets |
10,336 | 14,060 | |||||||||
Property plant and equipment, net |
501 | 423 | |||||||||
Other non-current assets: |
|||||||||||
Long-term investments |
202 | 211 | |||||||||
Long-term deposit |
292 | 82 | |||||||||
Total other non-current assets |
494 | 293 | |||||||||
Total assets |
$ | 11,331 | $ | 14,776 | |||||||
LIABILITIES AND STOCKHOLDERS' EQUITY |
|||||||||||
Current liabilities: |
|||||||||||
Accounts payable |
$ | 1,165 | $ | 1,234 | |||||||
Accrued liabilities: |
|||||||||||
Payroll and related benefits |
672 | 550 | |||||||||
Warranty |
122 | 137 | |||||||||
Marketing |
111 | 136 | |||||||||
Accrued expenses |
215 | 200 | |||||||||
Other accrued liabilities |
484 | 628 | |||||||||
Total accrued liabilities |
1,604 | 1,651 | |||||||||
Deferred revenue, short-term |
2,573 | 2,489 | |||||||||
Total current liabilities |
5,342 | 5,374 | |||||||||
Other long-term liabilities |
232 | 105 | |||||||||
Commitments and contingencies (Note 4) |
|||||||||||
Stockholders' equity: |
|||||||||||
Convertible preferred stock, $0.001 par value; Authorized—5,000,000 shares; Outstanding—none at September 30, 2009 and September 30, 2008 |
— | — | |||||||||
Common stock, $0.001 par value; Authorized—50,000,000 shares; Outstanding—16,188,857 shares and 15,777,303 shares at September 30, 2009 and 2008, respectively |
17 | 17 | |||||||||
Treasury stock at cost—1,318,830 shares and 1,295,030 shares at September 30, 2009 and 2008, respectively |
(1,400 | ) | (1,381 | ) | |||||||
Additional paid-in capital |
67,716 | 66,689 | |||||||||
Accumulated other comprehensive income |
165 | 3 | |||||||||
Accumulated deficit |
(60,741 | ) | (56,031 | ) | |||||||
Total stockholders' equity |
5,757 | 9,297 | |||||||||
Total liabilities and stockholders' equity |
$ | 11,331 | $ | 14,776 | |||||||
See accompanying Notes to Consolidated Financial Statements.
51
ALTIGEN COMMUNICATIONS, INC. AND SUBSIDIARY
CONSOLIDATED STATEMENTS OF OPERATIONS
| |
Fiscal Year Ended September 30, | |||||||||||
|---|---|---|---|---|---|---|---|---|---|---|---|---|
| |
2009 | 2008 | 2007 | |||||||||
| |
(In thousands, except per share amounts) |
|||||||||||
Net revenue: |
||||||||||||
Hardware |
$ | 15,081 | $ | 16,283 | $ | 16,233 | ||||||
Software |
2,304 | 2,614 | 1,655 | |||||||||
Total net revenue |
17,385 | 18,897 | 17,888 | |||||||||
Cost of revenue: |
||||||||||||
Hardware |
6,588 | 7,828 | 7,993 | |||||||||
Software |
16 | 231 | 130 | |||||||||
Total cost of revenue |
6,604 | 8,059 | 8,123 | |||||||||
Gross profit |
10,781 | 10,838 | 9,765 | |||||||||
Operating expenses: |
||||||||||||
Research and development |
4,924 | 4,216 | 3,373 | |||||||||
Sales and marketing |
7,037 | 7,552 | 5,277 | |||||||||
General and administrative |
3,654 | 3,322 | 2,497 | |||||||||
Total operating expenses |
15,615 | 15,090 | 11,147 | |||||||||
Loss from operations |
(4,834 | ) | (4,252 | ) | (1,382 | ) | ||||||
Equity in net income (loss) of investee |
(9 | ) | 5 | (4 | ) | |||||||
Interest and other income, net |
118 | 310 | 461 | |||||||||
Net loss before taxes |
(4,725 | ) | (3,937 | ) | (925 | ) | ||||||
Income taxes |
15 | — | (11 | ) | ||||||||
Net loss |
$ | (4,710 | ) | $ | (3,937 | ) | $ | (936 | ) | |||
Basic and diluted net loss per share |
$ | (0.30 | ) | $ | (0.25 | ) | $ | (0.06 | ) | |||
Weighted average shares used in computing basic and diluted net loss per share |
15,937 | 15,745 | 15,363 | |||||||||
See accompanying Notes to Consolidated Financial Statements.
52
ALTIGEN COMMUNICATIONS, INC. AND SUBSIDIARY
CONSOLIDATED STATEMENTS OF STOCKHOLDERS' EQUITY
| |
Common Stock | |
|
Accumulated Other Comprehensive Loss |
|
|
||||||||||||||||
|---|---|---|---|---|---|---|---|---|---|---|---|---|---|---|---|---|---|---|---|---|---|---|
| |
Treasury Stock |
Additional Paid-in Capital |
Accumulated Deficit |
Total Stockholders' Equity |
||||||||||||||||||
| |
Shares | Amount | ||||||||||||||||||||
| |
(In thousands, except per share data) |
|||||||||||||||||||||
BALANCE, SEPTEMBER 30, 2006 |
15,093,469 | $ | 16 | $ | (1,014 | ) | $ | 63,993 | $ | — | $ | (51,158 | ) | $ | 11,837 | |||||||
Common stock issued under stock plans |
576,188 | — | — | 839 | — | — | 839 | |||||||||||||||
Stock-based compensation |
— | — | — | 602 | — | — | 602 | |||||||||||||||
Net loss |
— | — | — | — | — | (936 | ) | (936 | ) | |||||||||||||
Change in unrealized gain on investments |
— | — | — | — | 3 | — | 3 | |||||||||||||||
Total comprehensive loss |
— | — | — | — | 3 | — | (933 | ) | ||||||||||||||
BALANCE, SEPTEMBER 30, 2007 |
15,669,657 | 16 | (1,014 | ) | 65,434 | 3 | (52,094 | ) | 12,345 | |||||||||||||
Common stock issued under stock plans |
338,781 | 1 | — | 345 | — | — | 346 | |||||||||||||||
Repurchase of treasury stock |
(231,135 | ) | — | (367 | ) | — | — | — | (367 | ) | ||||||||||||
Stock-based compensation |
— | — | — | 910 | — | — | 910 | |||||||||||||||
Net and comprehensive loss |
— | — | — | — | — | (3,937 | ) | (3,937 | ) | |||||||||||||
BALANCE, SEPTEMBER 30, 2008 |
15,777,303 | 17 | (1,381 | ) | 66,689 | 3 | (56,031 | ) | 9,297 | |||||||||||||
Common stock issued under stock plans |
435,354 | — | — | 286 | — | — | 286 | |||||||||||||||
Repurchase of treasury stock |
(23,800 | ) | — | (19 | ) | — | — | — | (19 | ) | ||||||||||||
Stock-based compensation |
— | — | — | 741 | — | — | 741 | |||||||||||||||
Net loss |
— | — | — | — | — | (4,710 | ) | (4,710 | ) | |||||||||||||
Change in unrealized loss on investments |
— | — | — | — | (3 | ) | — | (3 | ) | |||||||||||||
Foreign currency translation |
— | — | — | — | 165 | — | 165 | |||||||||||||||
BALANCE, SEPTEMBER 30, 2009 |
16,188,857 | $ | 17 | $ | (1,400 | ) | $ | 67,716 | $ | 165 | $ | (60,741 | ) | $ | 5,757 | |||||||
See accompanying Notes to Consolidated Financial Statements.
53
ALTIGEN COMMUNICATIONS, INC. AND SUBSIDIARY
CONSOLIDATED STATEMENTS OF CASH FLOWS
| |
Fiscal Year Ended September 30, | ||||||||||||
|---|---|---|---|---|---|---|---|---|---|---|---|---|---|
| |
2009 | 2008 | 2007 | ||||||||||
| |
(In thousands) |
||||||||||||
Cash flows from operating activities: |
|||||||||||||
Net loss |
$ | (4,710 | ) | $ | (3,937 | ) | $ | (936 | ) | ||||
Adjustments to reconcile net loss to net cash (used in) provided by operating activities: |
|||||||||||||
Depreciation and amortization |
250 | 265 | 247 | ||||||||||
Stock-based compensation |
905 | 910 | 602 | ||||||||||
Equity in net income (loss) of investee |
9 | (2 | ) | 4 | |||||||||
Changes in operating assets and liabilities: |
|||||||||||||
Accounts receivable |
878 | 233 | (426 | ) | |||||||||
Inventories, net |
328 | (27 | ) | (185 | ) | ||||||||
Prepaid expenses and other current assets |
48 | 61 | (116 | ) | |||||||||
Accounts payable |
(69 | ) | 413 | (16 | ) | ||||||||
Accrued liabilities |
(46 | ) | 221 | 168 | |||||||||
Deferred revenue, short-term |
165 | 1,924 | 34 | ||||||||||
Other long-term liabilities |
46 | 16 | (88 | ) | |||||||||
Net cash (used in) provided by operating activities |
(2,196 | ) | 77 | (712 | ) | ||||||||
Cash flows from investing activities: |
|||||||||||||
Purchases of short-term investments |
(5,460 | ) | (45,097 | ) | (28,772 | ) | |||||||
Proceeds from sale of short-term investments |
5,860 | 48,493 | 29,848 | ||||||||||
Changes in long-term deposits |
(211 | ) | 86 | (73 | ) | ||||||||
Purchases of property and equipment |
(328 | ) | (182 | ) | (72 | ) | |||||||
Net cash (used in) provided by investing activities |
(139 | ) | 3,300 | 931 | |||||||||
Cash flows from financing activities: |
|||||||||||||
Proceeds from issuances of common stock, net of issuance costs |
122 | 346 | 839 | ||||||||||
Repurchase of treasury stock |
(19 | ) | (367 | ) | — | ||||||||
Net cash (used in) provided by financing activities |
103 | (21 | ) | 839 | |||||||||
Effect of changes in exchange rates on cash and cash equivalents |
162 | — | — | ||||||||||
Net change in cash and cash equivalents during year |
(2,070 | ) | 3,356 | 1,058 | |||||||||
Cash and cash equivalents, beginning of year |
9,467 | 6,111 | 5,053 | ||||||||||
Cash and cash equivalents, end of year |
$ | 7,397 | $ | 9,467 | $ | 6,111 | |||||||
Supplemental disclosure of cash flow information: |
|||||||||||||
Cash paid during the period for income taxes |
$ | — | $ | — | $ | 11 | |||||||
Cash paid during the period for interest |
$ | 5 | $ | 8 | $ | 12 | |||||||
See accompanying Notes to Consolidated Financial Statements.
54
ALTIGEN COMMUNICATIONS, INC. AND SUBSIDIARY
NOTES TO CONSOLIDATED FINANCIAL STATEMENTS
1. ORGANIZATION OF THE COMPANY
We are a leading provider of 100 percent Microsoft-based VoIP business phone systems and Unified Communications solutions. We design, deliver and support VoIP phone systems and call center solutions that combine high reliability with integrated IP communications applications. As one of the first companies to offer VoIP solutions, AltiGen has been deploying systems since 1996. We have more than 10,000 customers worldwide with over 15,000 systems in use. Our telephony solutions are primarily used by small- to medium-sized businesses, companies with multiple locations, corporate branch offices, and call centers.
2. SIGNIFICANT ACCOUNTING POLICIES
Principles of Presentation
Our consolidated financial statements reflect the operations of AltiGen Communications, Inc. and our wholly-owned subsidiary. The subsidiary is located in Shanghai, China and was incorporated in November 1998. As of September 30, 2009, we had approximately $42,000 in long-lived assets located in China. Our hardware tooling used to develop the face plate for our MAX1000 Voice over IP phone system as well as tooling used to develop the IP720, IP710 and IP705 phones are located in Taiwan. All significant intercompany transactions and balances have been eliminated. Our fiscal year end is September 30. Unless otherwise stated, all references to fiscal years 2009, 2008, and 2007 refer to the twelve months ended September 30 of that year.
Use of Estimates in Preparation of Financial Statements
The preparation of the financial statements in conformity with generally accepted accounting principles in the United States requires management to make estimates and assumptions that affect the reported amounts of assets and liabilities and disclosure of contingent assets and liabilities at the date of the financial statements and the reported amounts of revenue and expenses during the reported periods. Key estimates include provisions for excess and obsolete inventories, warranty, doubtful account reserve, valuation on tax assets and long-term investments. Actual results could differ from those estimates.
Subsequent Events
The Company has performed an evaluation of subsequent events through December 28, 2009, the date on which this Annual Report on Form 10-K was filed with the SEC.
Concentration of Risk and Certain Significant Risks and Uncertainties
We purchase substantially all our hardware product components from four suppliers and purchase other manufacturing services from a relatively small number of suppliers. Our purchases are concentrated with these four suppliers and certain key chip components of our products are sole sourced. For fiscal years 2009 and 2008 these four suppliers provided 79% and 87%, respectively, of all raw materials purchased. Loss of one of these suppliers could adversely impact our operations.
We believe that changes in any of the following areas could have a material adverse effect on the Company's future financial position or results of operations:
- •
- availability of necessary components;
55
ALTIGEN COMMUNICATIONS, INC. AND SUBSIDIARY
NOTES TO CONSOLIDATED FINANCIAL STATEMENTS (Continued)
2. SIGNIFICANT ACCOUNTING POLICIES (Continued)
- •
- changes in customer relationships;
- •
- risks associated with having a concentration of a few suppliers; and
- •
- risks associated with changes in domestic and international economic and/or political conditions or regulations.
Financial instruments that potentially subject the Company to significant concentrations of credit risk consist principally of cash, cash equivalents, investments and accounts receivable. The Company invests its cash, cash equivalents and short-term investments in high credit-quality financial institutions. The Company is exposed to credit risk in the event of default by these institutions to the extent of the amount recorded on the consolidated balance sheet. To date, the Company has not experienced losses on these investments.
Cash, Cash Equivalents and Short-Term Investments
The Company's policy is to invest in highly-rated securities with strong liquidity and requires investments to be rated single-A or better. Our investment portfolio consists principally of investment grade institutional money market funds, bank term deposits, U.S. Agency securities, corporate bonds and notes and commercial paper. We consider all highly liquid investments purchased with an initial maturity of three months or less to be cash equivalents. Short-term investments are highly liquid financial instruments with original maturities greater than three months but less than one year and are classified as "available-for-sale" investments. We classify our available-for-sale securities as current assets and report them at their fair value. Further, we recognize unrealized gains and losses related to these securities as an increase or reduction in shareholders' equity. We evaluate our available-for-sale securities for impairment quarterly. During fiscal years 2009, 2008 and 2007, we did not record any impairment on outstanding securities. The Company did not hold any short-term investments at September 30, 2009.
56
ALTIGEN COMMUNICATIONS, INC. AND SUBSIDIARY
NOTES TO CONSOLIDATED FINANCIAL STATEMENTS (Continued)
2. SIGNIFICANT ACCOUNTING POLICIES (Continued)
The following table summarizes the Company's cash and available-for-sale securities by significant investment category as of September 30, 2009 and September 30, 2008 (in thousands):
| |
September 30, 2009 | September 30, 2008 | ||||||||||||||||||||||||||
|---|---|---|---|---|---|---|---|---|---|---|---|---|---|---|---|---|---|---|---|---|---|---|---|---|---|---|---|---|
Security Description
|
Amortized Cost |
Unrealized Gains |
Unrealized Losses |
Estimated Fair Value |
Amortized Cost |
Unrealized Gains |
Unrealized Losses |
Estimated Fair Value |
||||||||||||||||||||
Cash and cash equivalents: |
||||||||||||||||||||||||||||
Cash |
$ | 2,769 | $ | — | $ | — | $ | 2,769 | $ | 3,105 | $ | — | $ | — | $ | 3,105 | ||||||||||||
Cash equivalents |
||||||||||||||||||||||||||||
Money market mutual funds |
4,628 | — | — | 4,628 | 1,018 | — | — | 1,018 | ||||||||||||||||||||
Agency discount note |
— | — | — | — | 5,344 | — | — | 5,344 | ||||||||||||||||||||
Total cash equivalents |
4,628 | — | — | 4,628 | 6,362 | — | — | 6,362 | ||||||||||||||||||||
Total cash and cash equivalents |
7,397 | — | — | 7,397 | 9,467 | — | — | 9,467 | ||||||||||||||||||||
Short-term investments: |
||||||||||||||||||||||||||||
Agency discount notes |
— | — | — | — | 150 | — | — | 150 | ||||||||||||||||||||
Commercial paper |
— | — | — | — | 247 | 3 | — | 250 | ||||||||||||||||||||
Total short-term investments |
— | — | — | — | 397 | 3 | — | 400 | ||||||||||||||||||||
Total cash, cash equivalents and short-term investments |
$ | 7,397 | $ | — | $ | — | $ | 7,397 | $ | 9,864 | $ | 3 | $ | — | $ | 9,867 | ||||||||||||
Realized gains were not significant for both fiscal years 2009 and 2008. The Company reports unrealized gains and losses on its "available-for-sale" securities in other comprehensive income, a component of stockholders' equity.
Inventories
Inventories (which include costs associated with components assembled by third-party assembly manufacturers, as well as internal labor and allocable overhead) are stated at the lower of standard cost (which approximates actual cost on a first-in, first-out basis) or market value. Provisions, when required, are made to reduce excess and obsolete inventories to their estimated net realizable values. We regularly monitor inventory quantities on hand and record a provision for excess and obsolete inventories based primarily on our estimated forecast of product demand and production requirements for the next six months. We record a write-down for product and component inventories that have become obsolete or are in excess of anticipated demand or net realizable value. Raw material inventory is considered obsolete and is fully reserved if it has not moved in 365 days. In fiscal year 2009, we disposed of fully-reserved inventory with a carrying value of zero and an original cost at $176,000. The disposal of such inventory had no material impact on our revenue, gross margins and net loss for the twelve months ended September 30, 2009. For fiscal years 2009 and 2008, we recognized a provision of
57
ALTIGEN COMMUNICATIONS, INC. AND SUBSIDIARY
NOTES TO CONSOLIDATED FINANCIAL STATEMENTS (Continued)
2. SIGNIFICANT ACCOUNTING POLICIES (Continued)
$17,000 and $12,000, respectively, for excess and obsolete inventories. The components of inventories, net of inventory reserves, include (in thousands):
| |
September 30, | ||||||
|---|---|---|---|---|---|---|---|
| |
2009 | 2008 | |||||
Raw materials |
$ | 450 | $ | 479 | |||
Work-in-progress |
29 | 197 | |||||
Finished goods |
787 | 918 | |||||
Total |
$ | 1,266 | $ | 1,594 | |||
Property, Plant and Equipment, Net
Property, plant, and equipment are stated at cost. Cost includes purchase cost, applicable taxes and freight costs. We compute depreciation and amortization using the straight-line method over the estimated useful lives of the assets, which is three years except for tooling and leasehold improvements. Our tooling is depreciated using the greater value between the five year straight-line method or the number of phones shipped in the period. We depreciate leasehold improvements over the shorter of the lease term or the improvement's estimated useful life. Depreciation expense for fiscal years 2009, 2008 and 2007 was approximately $250,000, $265,000 and $247,000, respectively. All repairs and maintenance costs are expensed as incurred.
Property, plant and equipment, net, consist of (in thousands):
| |
September 30, | ||||||
|---|---|---|---|---|---|---|---|
| |
2009 | 2008 | |||||
Machinery and equipment |
$ | 342 | $ | 275 | |||
Furniture and equipment |
1,266 | 1,177 | |||||
Tooling |
675 | 528 | |||||
Computer software |
949 | 948 | |||||
Leasehold improvements |
77 | — | |||||
Construction-in-progress |
31 | 29 | |||||
Total |
3,340 | 2,957 | |||||
Accumulated depreciation and amortization |
(2,839 | ) | (2,534 | ) | |||
Property and equipment, net |
$ | 501 | $ | 423 | |||
Long-Term Investments
As of September 30, 2009, we held an investment of common stock of a private Taiwanese telecommunication company valued at approximately $195,000. This investment is valued using the cost method. Our interest in the company is approximately 2%, which interest does not allow us to exercise significant influence.
In July 2004, we purchased common stock of a private Korean telecommunications company for approximately $79,000. As a result of this investment, we acquired approximately 23% of the voting power of the company. This gives us the right to nominate and elect one of the three members of the
58
ALTIGEN COMMUNICATIONS, INC. AND SUBSIDIARY
NOTES TO CONSOLIDATED FINANCIAL STATEMENTS (Continued)
2. SIGNIFICANT ACCOUNTING POLICIES (Continued)
Company's current board of directors. We are accounting for this investment using the equity method and record our minority interest of their results in our results of operations. As of September 30, 2009 and 2008, our investment in the Korean company had a book value of approximately $7,000 and $16,000, respectively. We recorded $9,000, $3,000 and $4,000 in our proportionate share of the net losses of our investee for the fiscal years 2009, 2008 and 2007, respectively.
We perform periodic reviews of our investments for impairment. Our investments are considered impaired when a review of the issuer's operations and other indicators of impairment indicate that the carrying value of the investment is not likely to be recoverable. Such indicators include, but are not limited to, limited capital resources, limited prospects of receiving additional financing, and limited prospects for liquidity of the related securities. No write-downs were recorded during fiscal years 2009, 2008 or 2007.
Foreign Currency Translation
The functional currency of the Company's foreign subsidiary is the Chinese Yuen (Renminbi). In consolidation, the Company translates the assets and liabilities of its Chinese subsidiary at the exchange rate in effect at the balance sheet date. The Company translates revenue and expense accounts at average exchange rates during the period in which the transaction takes place. The foreign currency translation is included in accumulated other comprehensive income, a component of stockholders' equity.
Software Development Cost
The Company capitalizes eligible computer software development costs upon the establishment of technological feasibility, which it has defined as completion of a working model. The amount of costs eligible for capitalization, after consideration of factors such as realizable value, were not material and, accordingly, all software development costs have been charged to research and development expense in the accompanying consolidated statements of operations.
Revenue Recognition
Revenue consists of direct sales to end-users, resellers and distributors. Revenue from sales to end-users and resellers is recognized upon shipment, when risk of loss has passed to the customer, collection of the receivable is reasonably assured, persuasive evidence of an arrangement exists, and the sales price is fixed and determinable. Net revenue consists of product revenue reduced by estimated sales returns and allowances. Sales to distributors are made under terms allowing certain rights of return and protection against subsequent price declines on the Company's products held by its distributors. Upon termination of such distribution agreements, any unsold products may be returned by the distributor for a full refund. These agreements may be canceled without cause for convenience following a specified notice period. As a result of these provisions, the Company defers recognition of distributor revenue until such distributors resell our products to their customers. The amounts deferred as a result of this policy are reflected as "deferred revenue" in the accompanying consolidated balance sheets. The related cost of revenue is also deferred and reported in the consolidated balance sheets as inventory. We recognize revenue derived from sales to customers in China when the following elements are satisfied: customer takes ownership upon shipment and upon receipt of cash.In September 2007, we introduced our Software Assurance Program which provides our customers with the latest updates, new
59
ALTIGEN COMMUNICATIONS, INC. AND SUBSIDIARY
NOTES TO CONSOLIDATED FINANCIAL STATEMENTS (Continued)
2. SIGNIFICANT ACCOUNTING POLICIES (Continued)
releases, and technical support for the applications they are licensed to use ("Software Assurance"). In fiscal year 2008, we initiated our Premier Service Plan, which includes software assurance and extended hardware warranty. The program is an annual subscription and can range from one to three years. Sales from the software assurance program are recorded as deferred revenue and recognized as revenue over the terms of the subscriptions.
Software components are generally not sold separately from our hardware components. Software revenue consists of license revenue that is recognized upon delivery of the application products or features. We provide software assurance consisting primarily of the latest software updates, patches, new releases and technical support. Revenue earned on software arrangements involving multiple elements is allocated to each element based upon the relative fair value of the elements. The revenue allocated on this element is recognized with the initial licensing fee on delivery of the software. This software assurance revenue is in addition to the initial license fee and is recognized over a period of one to three years. The estimated cost of providing software assurance during the arrangement is insignificant and the upgrades and enhancements offered at no cost during software assurance arrangements have historically been, and are expected to continue to be, minimal and infrequent. All estimated costs of providing the services, including upgrades and enhancements, are spread over the life of the software assurance contract term.
Net revenue by customers that individually accounted for more than 10% of revenue for fiscal years 2009, 2008, and 2007is as follows:
| |
Fiscal Year Ended September 30, |
|||||||||
|---|---|---|---|---|---|---|---|---|---|---|
| |
2009 | 2008 | 2007 | |||||||
Synnex |
30 | % | 34 | % | 50 | % | ||||
Jenne(1) |
15 | % | 12 | % | — | |||||
Fiserv(2) |
10 | % | — | — | ||||||
Altisys(3) |
— | 12 | % | 16 | % | |||||
Graybar(4) |
— | — | 15 | % | ||||||
Total |
55 | % | 58 | % | 81 | % | ||||
- (1)
- We
did not generate revenue from Jenne during fiscal year ended 2007. Additionally, in September 2009, we terminated our distribution agreement with Jenne.
- (2)
- In
August 2009, we entered into a reseller agreement with Fiserv Solutions, Inc. Our agreement with Fiserv has an initial term of ten years and will
renew automatically for additional five year terms, provided that each party has the right to terminate the agreement for convenience upon ninety (90) days' written notice prior to the end of
the initial term or any subsequent term of the agreement.
- (3)
- During
fiscal year 2009, revenue generated from Altisys was less than 10% of our total revenue.
- (4)
- During fiscal year 2008, revenue generated through Graybar was less than 10% of our total revenue. Additionally, in April 2008, we terminated our distribution agreement with Graybar. The termination of our relationship with Graybar did not have a material impact on our business.
60
ALTIGEN COMMUNICATIONS, INC. AND SUBSIDIARY
NOTES TO CONSOLIDATED FINANCIAL STATEMENTS (Continued)
2. SIGNIFICANT ACCOUNTING POLICIES (Continued)
International revenue derived from sales to customers outside of the Americas, primarily in China, United Kingdom, Italy and Holland. Net revenue generated internationally represented approximately 14%, 13% and 10% for fiscal years 2009, 2008 and 2007, respectively.
Segment Reporting
The Company manages its business primarily on a geographic basis. Accordingly, the Company determined its operating segments, which are generally based on the nature and location of its customers, to be the Americas and International. The Company's two geographical segments, all sell the same products to the same types of customers. The Company's reportable operating segments are comprised of the Americas and International operations. The Americas segment includes the United States, Canada, Mexico, Central America and the Caribbean. The International segment is comprised of China, United Kingdom, Italy and Holland.
The following table shows our sales by geographic region as percentage of total sales for the periods indicated:
| |
Fiscal Year Ended September 30, |
|||||||||
|---|---|---|---|---|---|---|---|---|---|---|
| |
2009 | 2008 | 2007 | |||||||
Americas |
86 | % | 87 | % | 90 | % | ||||
International |
14 | % | 13 | % | 10 | % | ||||
Total |
100 | % | 100 | % | 100 | % | ||||
Product Warranty
The Company provides a warranty for hardware products for a period of one year following shipment to end users. We have historically experienced minimal warranty costs. Factors that affect our reserves for warranty liability include the number of installed units, historical experience and management's judgment regarding anticipated rates of warranty claims and cost per claim. We assess the adequacy of our reserves for warranty liability every quarter and make adjustments to those reserves if necessary.
Changes in the Company's warranty liability for the fiscal years ended September 30, 2009 and 2008, respectively, are as follows (in thousands):
| |
September 30, | ||||||
|---|---|---|---|---|---|---|---|
| |
2009 | 2008 | |||||
| |
(In thousands) |
||||||
Accrued warranty, beginning of year |
$ | 137 | $ | 148 | |||
Provision for warranty liability |
111 | 156 | |||||
Warranty cost including labor, components and scrap |
(126 | ) | (167 | ) | |||
Accrued warranty, end of year |
$ | 122 | $ | 137 | |||
61
ALTIGEN COMMUNICATIONS, INC. AND SUBSIDIARY
NOTES TO CONSOLIDATED FINANCIAL STATEMENTS (Continued)
2. SIGNIFICANT ACCOUNTING POLICIES (Continued)
Recently Issued Accounting Pronouncements
In October 2008, the Company adopted FASB ASC 820-10, Fair Value Measurements and Disclosures—Overall ("ASC 820-10") with respect to its financial assets and liabilities. In February 2008, the FASB issued updated guidance related to fair value measurements, which is included in the Codification in ASC 820-10-55, Fair Value Measurements and Disclosures—Overall—Implementation Guidance and Illustrations. The updated guidance provided a one year deferral of the effective date of ASC 820-10 for non-financial assets and non-financial liabilities, except those that are recognized or disclosed in the financial statements at fair value at least annually. Therefore, the Company will adopt the provisions of ASC 820-10 for non-financial assets and non-financial liabilities effective October 1, 2009, and such adoption is not expected to have a material impact on the Company's consolidated financial statements.
In June 2009, the Company adopted FASB ASC 855-10, Subsequent Events—Overall ("ASC 855-10"). ASC 855-10 establishes general standards of accounting for and disclosure of events that occur after the balance sheet date but before financial statements are issued or are available to be issued. It requires the disclosure of the date through which an entity has evaluated subsequent events and the basis for that date—that is, whether that date represents the date the financial statements were issued or were available to be issued. This disclosure should alert all users of financial statements that an entity has not evaluated subsequent events after that date in the set of financial statements being presented. Adoption of ASC 855-10 did not have a material impact on the Company's consolidated results of operations, financial position or liquidity. See the "Subsequent Events" section in Note 1 to the consolidated financial statements for the related disclosures.
In June 2009, the Company adopted FASB ASC 825-10-65, Financial Instruments—Overall—Transition and Open Effective Date Information ("ASC 825-10-65"). ASC 825-10-65 amends ASC 825-10 to require disclosures about fair value of financial instruments in interim financial statements as well as in annual financial statements and also amends ASC 270-10, Presentation—Interim Reporting—Overall, to require those disclosures in all interim financial statements. The adoption of ASC 825-10-65 did not have a material impact on the Company's consolidated financial statements.
In June 2009, the FASB issued The FASB Accounting Standards Codification and the Hierarchy of Generally Accepted Accounting Principles (the "Codifications"), a replacement of the existing codification standards. The Codification, which was launched on July 1, 2009, became the single source of authoritative non-governmental U.S. generally accepted accounting principles (GAAP), superseding various existing authoritative accounting pronouncements. The Codification eliminates the existing GAAP hierarchy and establishes one level of authoritative GAAP. All other literature is considered non-authoritative. This Codification is effective for financial statements issued for interim and annual periods ending after September 15, 2009. The Company adopted the Codification in the fourth quarter of 2009. There was no change to the Company's consolidated financial statements due to the implementation of the Codification other than changes in reference to various authoritative accounting pronouncements in its notes to the consolidated financial statements.
In September 2009, FASB issued ASU 2009-13, Revenue Recognition (Topic 605): Multiple-Deliverable Revenue Arrangements. As summarized in ASU 2009-13, ASC Topic 605 has been amended (1) to provide updated guidance on whether multiple deliverables exist, how the deliverables in an arrangement should be separated, and the consideration allocated; (2) to require an entity to allocate revenue in an arrangement using estimated selling prices of deliverables if a vendor does not have
62
ALTIGEN COMMUNICATIONS, INC. AND SUBSIDIARY
NOTES TO CONSOLIDATED FINANCIAL STATEMENTS (Continued)
2. SIGNIFICANT ACCOUNTING POLICIES (Continued)
vendor-specific objective evidence ("VSOE") or third-party evidence of selling price; and (3) to eliminate the use of the residual method and require an entity to allocate revenue using the relative selling price method. The accounting changes summarized in ASU 2009-14 and ASU 2009-13 are both effective for fiscal years beginning on or after June 15, 2010, with early adoption permitted. Adoption may either be on a prospective basis or by retrospective application. The Company is currently assessing the impact of this guidance to its consolidated financial statements.
In October 2009, FASB issued ASU 2009-14, Software (Topic 985)—Certain Revenue Arrangements That Include Software Elements. This standard changes the accounting model for revenue arrangements that include both tangible products and software elements. Under this guidance, tangible products containing software components and nonsoftware components that function together to deliver the tangible product's essential functionality are excluded from the software revenue guidance in Subtopic 985-605, Software-Revenue Recognition. In addition, hardware components of a tangible product containing software components are always excluded from the software revenue guidance. FASB Accounting Standards Updates 2009-14 is effective prospectively for revenue arrangements entered into or materially modified in fiscal years beginning on or after June 15, 2010. Early adoption is permitted. The Company is currently assessing the impact of this guidance to its consolidated financial statements.
Computation of Basic and Diluted Net Loss Per Share
The Company bases its basic net loss per share upon the weighted average number of common shares outstanding during the period. Basic net loss per common share is computed by dividing the net loss by the weighted-average number of shares of common stock outstanding during the period. Diluted earnings per share reflect the potential dilution that could occur if securities or other contracts to issue common stock were exercised or converted into common stock.
The following table sets forth the computation of basic and diluted net loss per share (in thousands, except net loss per share amounts):
| |
Fiscal Year Ended September 30, | |||||||||
|---|---|---|---|---|---|---|---|---|---|---|
| |
2009 | 2008 | 2007 | |||||||
Net loss |
$ | (4,710 | ) | $ | (3,937 | ) | $ | (936 | ) | |
Weighted average shares outstanding—basic and diluted loss per share |
15,937 | 15,745 | 15,363 | |||||||
Basic and diluted net loss per share |
$ | (0.30 | ) | $ | (0.25 | ) | $ | (0.06 | ) | |
Options to purchase 4.4 million, 4.5 million and 3.7 million shares of common stock were outstanding for the years ended September 30, 2009, 2008 and 2007, respectively, and were excluded from the computation of diluted net earnings per share for these periods because their effect would have been antidilutive.
Comprehensive Income (Loss)
Comprehensive income consists of two components—net income (loss) and other comprehensive income. Other comprehensive income (loss) refers to revenue, expenses, gains, and losses that under U.S. generally accepted accounting principles are recorded as an element of stockholders' equity but are excluded from net income. The Company's other comprehensive income (loss) consists of
63
ALTIGEN COMMUNICATIONS, INC. AND SUBSIDIARY
NOTES TO CONSOLIDATED FINANCIAL STATEMENTS (Continued)
2. SIGNIFICANT ACCOUNTING POLICIES (Continued)
unrealized gains and losses on marketable securities categorized as available-for-sale and foreign exchange gains and losses.
As of September 30, 2009, accumulated other comprehensive income consists of $165,000 of accumulated foreign currency translation gains. The amounts comprising unrealized gains and losses on marketable securities and the related changes as of September 30, 2009 and 2008 and for the fiscal years 2009, 2008 and 2007 were immaterial.
3. STOCKHOLDERS' EQUITY AND STOCK-BASED COMPENSATION
Stock Option Plans
On March 10, 2009, our 1999 Stock Plan and our 1999 Employee Stock Purchase Plan (the "1999 Purchase Plan") expired. These plans will, however, continue to govern the securities previously granted under them. On April 21, 2009, our Board of Directors approved a 2009 Equity Incentive Plan (the "2009 Stock Plan"), which was approved by our stockholders on June 18, 2009. The 2009 Stock Plan replaced all previous stock plans and the shares available for future grants under those prior plans. Under the Plans, the Board of Directors may grant incentive stock options, non-qualified stock options, restricted stock awards, restricted stock units, stock appreciation rights, performance units and performance shares to eligible employees, directors and consultants. In accordance with the 2009 Stock Plan, the exercise price per share for stock options cannot be less than 100% of the fair market value, as determined by the Board of Directors, on the date of grant. Additionally, the exercise price of options granted to a greater than 10% stockholder may not be less than 110% of the fair market value on the date of grant. The value of common stock subject to incentive stock options that become exercisable by any one employee in any calendar year may not exceed $100,000. Options under this Plan will generally expire ten years after the date of grant. Upon approval of the 2009 Stock Plan, 6.5 million shares were reserved for issuance.
As of September 30, 2009, shares of common stock issuable pursuant to outstanding awards granted under the 2009 Stock Plan and our previous stock plans were 4.4 million shares and there were 2.6 million shares reserved for future grants.
64
ALTIGEN COMMUNICATIONS, INC. AND SUBSIDIARY
NOTES TO CONSOLIDATED FINANCIAL STATEMENTS (Continued)
3. STOCKHOLDERS' EQUITY AND STOCK-BASED COMPENSATION (Continued)
The following table summarizes the Company's stock option plans under the Stock Plans as of September 30, 2006 and changes during the three fiscal years ended September 30, 2009:
| |
Options Outstanding |
Weighted Average Exercise Price |
||||||
|---|---|---|---|---|---|---|---|---|
Outstanding at September 30, 2006 |
3,559,170 | $ | 3.76 | |||||
Options granted |
778,000 | $ | 1.76 | |||||
Options exercised |
(481,438 | ) | $ | 1.48 | ||||
Options forfeited or expired |
(154,527 | ) | $ | 4.21 | ||||
Outstanding at September 30, 2007 |
3,701,205 | $ | 3.62 | |||||
Options granted |
1,180,320 | $ | 1.30 | |||||
Options exercised |
(140,950 | ) | $ | 0.86 | ||||
Options forfeited or expired |
(188,753 | ) | $ | 2.70 | ||||
Outstanding at September 30, 2008 |
4,551,822 | $ | 3.14 | |||||
Options granted |
3,196,107 | $ | 0.85 | |||||
Options exercised |
(13,700 | ) | $ | 0.60 | ||||
Options forfeited or expired |
(3,371,338 | ) | $ | 3.87 | ||||
Outstanding at September 30, 2009 |
4,362,891 | $ | 0.91 | |||||
Exercisable at September 30, 2007 |
3,080,129 | $ | 3.91 | |||||
Exercisable at September 30, 2008 |
3,184,036 | $ | 3.91 | |||||
Exercisable at September 30, 2009 |
1,564,566 | $ | 0.97 | |||||
At September 30, 2009, the aggregate intrinsic value of stock options outstanding was $675,000. Total stock options vested and expected to vest at September 30, 2009 were 3.4 million shares with a weighted average exercise price of $0.92, aggregate intrinsic value of $548,000, and a weighted average remaining contractual term of 7.9 years. The total exercisable stock options as of September 30, 2009 were 1.6 million shares with an aggregate intrinsic value of $285,000, weighted average exercise price of $0.97, and a weighted average remaining contractual term of 5.5 years.
The Company has unamortized share-based compensation expense relating to options outstanding of $1.6 million, which will be amortized to expense over a weighted average period of 4 years.
65
ALTIGEN COMMUNICATIONS, INC. AND SUBSIDIARY
NOTES TO CONSOLIDATED FINANCIAL STATEMENTS (Continued)
3. STOCKHOLDERS' EQUITY AND STOCK-BASED COMPENSATION (Continued)
The table below provides the range of exercise prices of stock options outstanding and stock options exercisable at September 30, 2009.
| |
Options Outstanding | Options Exercisable | ||||||||||||||
|---|---|---|---|---|---|---|---|---|---|---|---|---|---|---|---|---|
Range of Exercise Prices
|
Number Outstanding |
Weighted Average Remaining Contractual Term (years) |
Weighted Average Exercise Price |
Number Exercisable |
Weighted Average Exercise Price |
|||||||||||
$0.60 - $0.72 |
448,016 | 4.48 | $ | 0.63 | 343,589 | $ | 0.61 | |||||||||
0.78 - 0.80 |
303,218 | 1.81 | $ | 0.78 | 303,218 | $ | 0.78 | |||||||||
0.86 - 0.86 |
3,066,607 | 9.92 | $ | 0.86 | 515,580 | $ | 0.86 | |||||||||
0.93 - 1.40 |
430,050 | 5.66 | $ | 1.14 | 291,428 | $ | 1.07 | |||||||||
1.56 - 1.56 |
4,000 | 7.31 | $ | 1.56 | 2,667 | $ | 1.56 | |||||||||
1.83 - 1.83 |
20,000 | 6.56 | $ | 1.83 | 17,084 | $ | 1.83 | |||||||||
2.00 - 2.00 |
3,000 | 5.82 | $ | 2.00 | 3,000 | $ | 2.00 | |||||||||
2.43 - 2.43 |
20,000 | 4.82 | $ | 2.43 | 20,000 | $ | 2.43 | |||||||||
2.98 - 2.98 |
40,000 | 5.12 | $ | 2.98 | 40,000 | $ | 2.98 | |||||||||
3.82 - 3.82 |
28,000 | 4.27 | $ | 3.82 | 28,000 | $ | 3.82 | |||||||||
$0.60 - $3.82 |
4,362,891 | 8.25 | $ | 0.91 | 1,564,566 | $ | 0.97 | |||||||||
Employee Stock Purchase Plan
On March 10, 2009, our 1999 Employee Stock Purchase Plan (the "1999 Purchase Plan") expired. On April 21, 2009, our Board of Directors approved a 2009 Employee Stock Purchase Plan (the "2009 Purchase Plan"), which was approved by our stockholders on June 18, 2009. The 2009 Purchase Plan allows eligible employees to purchase shares of Company stock at a discount through payroll deductions. The plan consists of six-month offering periods commencing on June 1st and December 1st, each year. Employees purchase shares in the purchase period at 85% of the market value of the Company's common stock at either the beginning of the offering period or the end of the offering period, whichever price is lower.
Participants under the 2009 Purchase Plan generally may not purchase shares on any exercise date to the extent that, immediately after the grant, the participant would own stock totaling 5% or more of the total combined voting power of all stock of the Company, or greater than $25,000 worth of stock in any calendar year. The maximum number of shares of common stock that any employee may purchase under the Stock Purchase Plan during any offering period is 10,000 shares.
The Company reserved 1.5 million shares of the Company's common stock for future issuance under the 2009 Employee Stock Purchase Plan. From October 1, 2008 until the expiration of the 1999 Purchase Plan on March 10, 2009, 193,411 shares were purchased by and distributed to employees at a price of $0.59 per share. During fiscal year 2009, we did not issue any shares to employees under our 2009 Employee Stock Purchase Plan.
Share-Based Compensation
The Company has estimated the fair value of stock-based compensation for stock options at the date of the grant using the Black-Scholes option-pricing model. The Black-Scholes option-pricing model incorporates various assumptions including expected volatility, expected life and interest rate. The
66
ALTIGEN COMMUNICATIONS, INC. AND SUBSIDIARY
NOTES TO CONSOLIDATED FINANCIAL STATEMENTS (Continued)
3. STOCKHOLDERS' EQUITY AND STOCK-BASED COMPENSATION (Continued)
Company uses historical data to estimate option forfeitures. Expected volatility is based on historical volatility and the risk-free interest rate is based on U.S. Treasury yield in effect at the time of the grant for the expected life of the options. The Company does not anticipate paying any dividends in the foreseeable future and therefore used an expected dividend yield of zero in the option valuation model.
The assumptions used to value option grants for the fiscal years ended September 30, 2009, 2008 and 2007 are as follows:
| |
Employee Stock Option Plans Fiscal Year Ended September 30, |
Employee Stock Purchase Plan Fiscal Year Ended September 30, |
|||||||||||||||||
|---|---|---|---|---|---|---|---|---|---|---|---|---|---|---|---|---|---|---|---|
| |
2009 | 2008 | 2007 | 2009 | 2008 | 2007 | |||||||||||||
Expected life (in years) |
6 | 6 | 6 | 0.5 | 0.5 | 0.5 | |||||||||||||
Risk-free interest rate |
1.6 - 2.4 | % | 2.8 - 3.7 | % | 4.6 - 4.9 | % | 0.21 - 1.2 | % | 1.5 - 4.2 | % | 4.2 - 5.1 | % | |||||||
Volatility |
138% - 141 | % | 87% - 88 | % | 90% - 92 | % | 138% - 140 | % | 87% - 89 | % | 89% - 93 | % | |||||||
Forfeiture rate |
15.99 | % | 10.33 | % | 10.17 | % | — | — | — | ||||||||||
Expected dividend |
0.0 | % | 0.0 | % | 0.0 | % | 0.0 | % | 0.0 | % | 0.0 | % | |||||||
The following table summarizes stock-based compensation expense related to employee and director stock options and employee stock purchases for the years ended September 30, 2009, 2008 and 2007:
| |
Fiscal Year Ended September 30, |
|||||||||
|---|---|---|---|---|---|---|---|---|---|---|
| |
2009 | 2008 | 2007 | |||||||
| |
(In thousands) |
|||||||||
Cost of goods sold |
$ | 15 | $ | 18 | $ | 20 | ||||
Research and development |
246 | 197 | 179 | |||||||
Selling, general and administrative |
644 | 695 | 403 | |||||||
Total |
$ | 905 | $ | 910 | $ | 602 | ||||
Issuance of Common Stock as Bonuses
In July 2009, our Board of Directors approved the issuance of our common stock to employees as bonuses. The stock bonuses would be granted in four quarterly installments based on the evaluation of the Company's overall financial performance for each respective quarter. The stock awards are immediately vested on the date of grant. We recorded stock-based compensation cost for these stock award bonuses based on the closing fair market value of the Company's common stock on the date of grant. During the fiscal year 2009, the Company issued 228,243 shares of common stock to its employees and recorded total expense of $164,335. Additionally, as of September 30, 2009, we recorded total expense of $228,000 for bonus awards earned in the forth quarter of fiscal year 2009. These awards will be issued in the first quarter of fiscal year 2010. During the first quarter of fiscal year 2010, our Board of Directors suspended further issuance of common stock as bonus under this program.
Stock Option Exchange
On September 1, 2009, we completed a stock option exchange program (the "Exchange Offer"). Pursuant to the Exchange Offer, eligible employees tendered, and we accepted for cancellation, eligible
67
ALTIGEN COMMUNICATIONS, INC. AND SUBSIDIARY
NOTES TO CONSOLIDATED FINANCIAL STATEMENTS (Continued)
3. STOCKHOLDERS' EQUITY AND STOCK-BASED COMPENSATION (Continued)
options to purchase 2,927,300 shares of our common stock, representing approximately 95% of the total shares of common stock underlying options eligible for exchange in the Exchange Offer. On September 1, 2009, the Company granted new options to eligible employees to purchase 2,927,300 shares of common stock in exchange for the cancellation of the tendered eligible options. The exercise price per share of the new options granted in the Exchange Offer was $0.86, the closing price of our common stock as reported by the NASDAQ Capital Market on September 1, 2009. Expense related to modification of the stock options was not material for the year ended September 30, 2009.
Under the terms of the Exchange Offer, eligible options were exchanged for new options on a one-for-one basis except for the new options granted to the named executive officers. Named executive officers received two types of new options. The first type of new option, called the Similar Value Option, subject to an exchange ratio intended to result in a new option that has a similar accounting value as the eligible option it replaces. Based on the applicable ratio, each similar value option will cover fewer shares than the eligible option it replaces. Each similar value option will retain the same vesting schedule as the eligible option it replaces, and will remain vested to the extent the eligible option it replaces was vested. Because the named executive officers are receiving a lesser number of similar value options in return for each eligible option, the executive members will receive an additional stock option grant called the Make-Up Option. This make-up option will cover just enough shares so that when combined with the number of shares subject to the similar value option, the executive member will have new options covering the same number of shares as the eligible option they replace. The make-up options will only vest if and when our common stock price closes at or above $2.50 per share during the term of the make-up option (subject to any acceleration provisions contained in any employment agreement or other similar arrangement with the Company or provided for under the terms of the Exchanged Option it replaces).
Pursuant to the accounting standards, we are required to recognize additional compensation expense to the extent the new options have a greater value than the exchanged options they replaced. The fair value of each stock option is estimated on the date of grant using the Black-Scholes option-pricing model for the non-executive options and the similar value options granted to the named executive officers. Make-up options were valued using the Binomial Model. Similar to the Black-Scholes model, the Binomial Model takes into account variables such as volatility, dividend yield rate, and risk free interest rate. In addition, the Binomial Model incorporates actual option-pricing behavior and changes in volatility over the option's contractual term. For options granted under the Exchange Offer, the following assumptions were used:
| |
September 30, 2009 |
|||
|---|---|---|---|---|
Expected life (in years) |
5 | |||
Risk-free interest rate |
2.3 | % | ||
Forfeiture rate |
0 | % | ||
Volatility |
138 | % | ||
Expected dividend |
0.0 | % | ||
Total stock-compensation expense recorded for the make-up options was not material for the year ended September 30, 2009. Total unamortized expense was $373,845, which will be recognized over the remaining service period of 5 years.
68
ALTIGEN COMMUNICATIONS, INC. AND SUBSIDIARY
NOTES TO CONSOLIDATED FINANCIAL STATEMENTS (Continued)
3. STOCKHOLDERS' EQUITY AND STOCK-BASED COMPENSATION (Continued)
Stock Repurchase Plan
On October 23, 2007, our Board of Directors approved the repurchase of up to $2.0 million of our common stock in the open market through November 12, 2008. On November 11, 2008, our Board of Directors extended the repurchase program by another year to November 14, 2009. Stock repurchases under this program were made from time to time at our management's discretion through November 14, 2009. When exercising such discretion, management considered a variety of factors such as our stock price, general business and market conditions and other investment opportunities. The repurchases were made in the open market and funded from available working capital. Pursuant to the 2007 authority, we repurchased 231,135 shares during the twelve months ended September 30, 2008 at an aggregate cost of $367,000. Pursuant to the 2008 authority, we repurchased 23,800 shares during the twelve months ended September 30, 2009 at an aggregate cost of $19,000. In April 2009, we suspended further purchases of stock under this program.
4. COMMITMENTS AND CONTINGENCIES
Commitments
We lease our facilities under various operating lease agreements expiring on various dates through December 2014. Generally, these leases have multiple options to extend for a period of years upon termination of the original lease term. We believe that our facilities are adequate for our present needs in all material respects.
In April 2009, the Company entered into a lease for a new corporate headquarters for a period of five years with one consecutive option to extend for an additional five years. This facility is leased through June 2014 and serves as our headquarters for corporate administration, research and development, manufacturing, and sales and marketing facility in San Jose, California. The terms of the lease include rent escalations and a tenant allowance for certain leasehold improvements. Under the terms of the lease agreement, total rent payment is approximately $1.4 million for a period of five years commencing on June 12, 2009. Additionally, under the terms of the lease agreement, we are eligible to receive up to $100,000 cash incentive as moving allowance. As of September 30, 2009, we recorded $93,000 of this allowance as part of deferred rent liability to be amortized over the term of the lease. The remaining balance of $7,000 was recorded in the first quarter of fiscal year 2010. The Company reserved $200,000 as collateral for an irrevocable and negotiable standby letter of credit (the "Letter of Credit") as security for the facility lease. The $200,000 is restricted by the bank and recorded as part of the long-term deposit in our consolidated balance sheet as of September 30, 2009. Under the terms of the agreement, the Letter of Credit will expire in July 2014.
Rent expense for all operating leases totaled approximately $758,000, $688,000 and $574,000, for fiscal years 2009, 2008 and 2007, respectively. We also lease certain equipment under capital lease arrangements, which are reflected as property and equipment in our balance sheets as of September 30,
69
ALTIGEN COMMUNICATIONS, INC. AND SUBSIDIARY
NOTES TO CONSOLIDATED FINANCIAL STATEMENTS (Continued)
4. COMMITMENTS AND CONTINGENCIES (Continued)
2009 and September 30, 2008. The minimum future lease payments under all non-cancellable capital and operating leases as of September 30, 2009 are shown in the following table (in thousands):
| |
Capital Leases |
Operating Leases |
||||||
|---|---|---|---|---|---|---|---|---|
Fiscal Years Ending September 30, |
||||||||
2010 |
$ | 33 | $ | 583 | ||||
2011 |
— | 302 | ||||||
2012 |
— | 302 | ||||||
2013 |
— | 318 | ||||||
2014 |
— | 248 | ||||||
Total contractual lease obligation |
$ | 33 | $ | 1,753 | ||||
Amount representing interest |
$ | 1 | ||||||
Present value of minimum lease payment |
$ | 32 | ||||||
Contingencies
From time to time, we may become party to litigation and subject to various routine claims and legal proceedings that arise in the ordinary course of our business. In accordance with SFAS No. 5, Accounting Contingencies, we make a provision for liability when it is both probable that the liability has been incurred and the amount of the loss can be reasonably estimated. To date, these actions have not had a material adverse effect on our financial position, result of operations or cash flows. Although the results of litigation and claims cannot be predicted with certainty, we believe that the final outcome of such matters would not have a material adverse effect on our business, financial position, results of operation and cash flows. However, litigation is inherently unpredictable, and depending on the amount and timing, an unfavorable resolution of a matter could materially affect our future results of operations, cash flows or financial position in a particular period.
5. SHAREHOLDER RIGHTS PLAN
The Company has adopted a Shareholder Rights Plan ("the Plan") and declared a dividend distribution of one right for each outstanding share of the Company's common stock. The record date for the distribution was May 7, 2009. The Company designed the plan to protect the long-term value of the Company for its shareholders during any future unsolicited acquisition attempt. The Company did not adopt the Plan in response to any specific attempt to acquire the Company or its shares and the Company is not aware of any current efforts to do so. These rights will become exercisable only upon the occurrence of certain events specified in the plan, including the acquisition of 15% of the Company's outstanding common stock by a person or group. Should a person or group acquire 15% or more of the outstanding common stock or announce an unsolicited tender offer, the consummation of which would result in a person or group acquiring 15% or more of the outstanding common stock, shareholders other than the acquiring person may exercise the rights, unless the Board of Directors has approved the transaction in advance. Each right will initially entitle stockholders to purchase a fractional share of the company's preferred stock for $4.00. However, the rights are not immediately exercisable and will become exercisable only upon the occurrence of certain events. If a person or group acquires, or announces a tender or exchange offer that would result in the acquisition of, fifteen
70
ALTIGEN COMMUNICATIONS, INC. AND SUBSIDIARY
NOTES TO CONSOLIDATED FINANCIAL STATEMENTS (Continued)
5. SHAREHOLDER RIGHTS PLAN (Continued)
percent (15%) or more of our common stock while the stockholder rights plan remains in place, then, unless the rights are redeemed by us for $0.001 per right, the rights will become exercisable by all rights holders, except the acquiring person or group, for shares of AltiGen or shares of the third party acquirer having a value of twice the right's then-current exercise price. The Rights will expire on May 7, 2019.
6. FAIR VALUE MEASUREMENTS
Effective October 1, 2008, we adopted FASB ASC 820, Fair Value Measurements and Disclosures (formerly referenced as SFAS No. 157, Fair Value Measurements) which defines fair value, establishes a framework for measuring fair value under generally accepted accounting principles and enhances disclosures about fair value measurements. The Company did not record an adjustment to retained earnings as a result of the adoption of this accounting standard, and the adoption did not have a material effect on the Company's results of operations. Fair value is defined as the exchange price that would be received for an asset or paid to transfer a liability (an exit price) in the principal or most advantageous market for the asset or liability in an orderly transaction between market participants on the measurement date. Valuation techniques used to measure fair value under this standard must maximize the use of observable inputs and minimize the use of unobservable inputs. The standard describes a fair value hierarchy based on three levels of inputs, of which the first two are considered observable and the last unobservable, that may be used to measure fair value which are the following:
Level 1—Financial instruments for which quoted market prices for identical instruments are available in active markets.
Level 2—Inputs other than Level 1 that are observable, either directly or indirectly, such as quoted prices for similar assets or liabilities; quoted prices in markets that are not active; or other inputs that are observable or can be corroborated by observable market data for substantially the full term of the assets or liabilities.
Level 3—Unobservable inputs that are supported by little or no market activity and that are significant to the fair value of the assets or liabilities.
71
ALTIGEN COMMUNICATIONS, INC. AND SUBSIDIARY
NOTES TO CONSOLIDATED FINANCIAL STATEMENTS (Continued)
6. FAIR VALUE MEASUREMENTS (Continued)
The adoption of this standard with respect to our financial assets and liabilities did not impact our consolidated results of operations and financial condition, but requires additional disclosure for assets and liabilities measured at fair value. In accordance with this standard, the following table represents our fair value hierarchy for our financial assets (cash equivalents and investments) measured at fair value on a recurring basis as of September 30, 2009 and 2008 (in thousands):
| |
Balance at September 30, 2009 |
Quoted Prices in Active Markets for Identical Instruments (Level 1) |
Significant Other Observable Inputs (Level 2) |
||||||||
|---|---|---|---|---|---|---|---|---|---|---|---|
Cash equivalents: |
|||||||||||
Money market mutual funds |
$ | 4,628 | $ | 4,628 | $ | — | |||||
|
4,628 | 4,628 | 4,628 | ||||||||
Short-term investments: |
|||||||||||
Agency discount notes |
— | — | — | ||||||||
Commercial paper |
— | — | — | ||||||||
|
— | — | — | ||||||||
Total assets measured at fair value |
$ | 4,628 | $ | 4,628 | $ | 4,628 | |||||
| |
Balance at September 30, 2008 |
Quoted Prices in Active Markets for Identical Instruments (Level 1) |
Significant Other Observable Inputs (Level 2) |
||||||||
|---|---|---|---|---|---|---|---|---|---|---|---|
Cash equivalents: |
|||||||||||
Money market mutual funds |
$ | 1,018 | $ | 1,108 | $ | — | |||||
Agency discount note |
5,344 | — | 5,344 | ||||||||
|
6,362 | — | 5,344 | ||||||||
Short-term investments: |
|||||||||||
Agency discount notes |
150 | — | 150 | ||||||||
Commercial paper |
247 | — | 247 | ||||||||
|
397 | — | 397 | ||||||||
Total assets measured at fair value |
$ | 6,759 | $ | 1,108 | $ | 5,741 | |||||
7. INCOME TAXES
Worldwide loss from continuing operations before provision for income taxes consists of the following (in thousands):
| |
Years Ended September 30, | |||||||||
|---|---|---|---|---|---|---|---|---|---|---|
| |
2009 | 2008 | 2007 | |||||||
United States |
$ | (4,722 | ) | $ | (3,726 | ) | $ | (731 | ) | |
Foreign |
(3 | ) | (211 | ) | (194 | ) | ||||
Loss from continuing operations |
$ | (4,725 | ) | $ | (3,937 | ) | $ | (925 | ) | |
72
ALTIGEN COMMUNICATIONS, INC. AND SUBSIDIARY
NOTES TO CONSOLIDATED FINANCIAL STATEMENTS (Continued)
7. INCOME TAXES (Continued)
The provision for income taxes consisted of the following and is attributable to federal and state minimum taxes (in thousands):
| |
Years Ended September 30, |
|||||||||
|---|---|---|---|---|---|---|---|---|---|---|
| |
2009 | 2008 | 2007 | |||||||
Federal |
$ | (1 | ) | $ | — | $ | 9 | |||
State |
(14 | ) | — | 2 | ||||||
Foreign |
— | — | — | |||||||
Income tax provision |
$ | (15 | ) | $ | — | $ | 11 | |||
The Company records a tax provision for the anticipated tax consequences of the reported results of operations. In accordance with SFAS No. 109, Accounting for Income Taxes, the provision for income taxes is computed using the asset and liability method, under which deferred tax assets and liabilities are recognized for the expected future tax consequences of temporary differences between the financial reporting and tax bases of assets and liabilities, and for operating losses and tax credit carryforwards. Deferred tax assets and liabilities are measured using the currently enacted tax rates that apply to taxable income in effect for the years in which those tax assets are expected to be realized or settled. The Company records a valuation allowance to reduce deferred tax assets to the amount that is believed more likely than not to be realized. The following is a summary of the significant components of the deferred tax asset (in thousands):
| |
Years Ended September 30, |
||||||
|---|---|---|---|---|---|---|---|
| |
2009 | 2008 | |||||
Net operating loss carryforwards |
$ | 18,696 | $ | 16,668 | |||
Reserve and other cumulative temporary differences |
1,143 | 1,399 | |||||
Research and development credit carryforward |
762 | 698 | |||||
Net capitalized research and development expenses |
68 | 184 | |||||
|
20,669 | 18,949 | |||||
Valuation allowance |
(20,669 | ) | (18,949 | ) | |||
Net deferred tax asset |
$ | — | $ | — | |||
As of September 30, 2009, we had net operating loss carryforwards for federal income tax purposes of approximately $49.4 million that expire at various dates through 2029, and federal research and development tax credits of approximately $678,000 that expire at various dates through 2029. We also had net operating loss carryforwards for state income tax purposes of approximately $26.5 million that expire at various dates through 2029, and state research and development tax credits of approximately $510,000 which do not have an expiration date and may be carried forward indefinitely. As of September 30, 2009, we had net operating loss carryforwards for foreign income tax purposes of approximately $709,000 that expire at various dates through 2014. Utilization of the Company's net operating loss and tax credit carryforwards may be subject to substantial annual limitation due to the ownership change limitations provided by the Internal Revenue Code and similar state provisions. Such an annual limitation could result in the expiration of the net operating loss carryforwards before utilization.
73
ALTIGEN COMMUNICATIONS, INC. AND SUBSIDIARY
NOTES TO CONSOLIDATED FINANCIAL STATEMENTS (Continued)
7. INCOME TAXES (Continued)
The Company's subsidiary in China is entitled to a five-year tax holiday, pursuant to which it is exempted from paying the enterprise income tax for calendar 2009 and calendar 2010. After the two-year exemption period, the Company's subsidiary in China will be entitled to approximately a 50% exemption for calendar years 2010 through 2012.
A valuation allowance has been recorded for the entire deferred tax asset as a result of uncertainties regarding realization of the asset, including limited operating history of the Company, lack of profitability to date and uncertainty over future operating profitability and taxable income. During fiscal year 2009, valuation allowance increased $1.7 million and in fiscal years 2008 and 2007 valuation allowance increased $573,000, and decreased $115,000, respectively. As of September 30, 2009 and 2008 we had no significant deferred tax liabilities.
Reconciliation between the Company's effective tax rate and the U.S. statutory rate is as follows:
| |
Years Ended September 30, | |||||||||
|---|---|---|---|---|---|---|---|---|---|---|
| |
2009 | 2008 | 2007 | |||||||
Tax computed at federal statutory rate |
35.0 | % | 35.0 | % | 35.0 | % | ||||
Change in valuation allowance |
(36.4 | ) | (14.6 | ) | (10.4 | ) | ||||
State taxes |
4.6 | 4.5 | 2.4 | |||||||
Meals & entertainment |
(0.5 | ) | (0.6 | ) | (1.8 | ) | ||||
Unbenefitted foreign loss |
— | (1.9 | ) | (7.3 | ) | |||||
Stock-based compensation |
(5.5 | ) | (6.6 | ) | (18.5 | ) | ||||
FIN 48 liability |
— | (5.9 | ) | |||||||
Other |
2.5 | (9.9 | ) | — | ||||||
Provision for income taxes |
(0.3 | )% | — | (0.6 | )% | |||||
In October 2007, we adopted FASB Interpretation No. 48, "Accounting for Uncertainty in Income Taxes—an Interpretation of Statement of Financial Accounting Standards Statement No. 109" ("FIN 48"). FIN 48 establishes a single model to address accounting for uncertain tax positions. FIN 48 clarifies the accounting for income taxes by prescribing a minimum recognition threshold a tax position is required to meet before being recognized in the financial statements. FIN 48 also provides guidance on derecognition, measurement, classification, interest and penalties, accounting in interim periods, disclosure and transition. We have reviewed our income tax positions and identified approximately $274,000 of total gross unrecognized tax benefits of which none, if recognized, would impact the effective tax rate as the Company has a valuation allowance on its carryforward attributes. The Company does not expect its unrecognized tax benefits to change materially over the next 12 months.
74
ALTIGEN COMMUNICATIONS, INC. AND SUBSIDIARY
NOTES TO CONSOLIDATED FINANCIAL STATEMENTS (Continued)
7. INCOME TAXES (Continued)
A reconciliation of the beginning and ending balances of the total amounts of gross unrecognized tax benefits since adoption of FIN 49 is as follows (in thousands):
| |
Total Gross Unrecognized Tax Benefits |
|||
|---|---|---|---|---|
Balance at October 1, 2008 |
$ | 274 | ||
Additions based on tax positions related to the current year |
— | |||
Additions based on tax positions of prior years |
— | |||
Settlements of tax positions |
— | |||
Balance at September 30, 2009 |
$ | 274 | ||
All of this amount would affect the corporation's tax rate if recognized.
Interest and penalties related to unrecognized tax benefits within the provision for taxes on the consolidated condensed statements of operations did not change as a result of implementing the provisions of FIN 48. Management determined that no accrual for interest and penalties was required as of September 30, 2009.
We file a consolidated U.S. income tax return and tax returns in various state and local jurisdictions, and foreign jurisdictions. In the normal course of business, we are subject to examination by taxing authorities throughout the world, including such jurisdictions as United States and China. With some exceptions, the Company is no longer subject to U.S. federal, state or foreign income tax examinations for fiscal years before 2006. However, to the extent allowed by law, the tax authorities may have the right to examine prior periods where net operating losses or tax credits were generated and carried forward, and make adjustments up to the amount of the net operating loss or credit carryforward amount.
In the ordinary course of the Company's business there are transactions where the ultimate tax determination is uncertain. The Company believes that is has adequately provided for income tax issues not yet resolved with federal, state, local and foreign tax authorities. In the event that actual results differ from these estimates or we adjust these estimates in future periods, an additional charge to expense would result.
8. RELATED PARTY TRANSACTION
The Company holds ownership interests in two privately held companies, which are also the Company's customers.
As of September 30, 2009, we held an investment of common stock of a private Taiwanese telecommunication company valued at approximately $195,000. We are accounting for this investment using the cost method. Our interest in the company is approximately 2%, which interest does not allow us to exercise significant influence. For the fiscal years ended September 30, 2009 and 2008, product sales revenue from this company was approximately $216,000 and $72,000, respectively. Accounts receivable balance from this company was $4,000 and $150,000 as of September 30, 2009 and 2008, respectively.
75
ALTIGEN COMMUNICATIONS, INC. AND SUBSIDIARY
NOTES TO CONSOLIDATED FINANCIAL STATEMENTS (Continued)
8. RELATED PARTY TRANSACTION (Continued)
In July 2004, we purchased common stock of a private Korean telecommunications company for approximately $79,000. As a result of this investment, we acquired approximately 23% of the voting power of the company. This gives us the right to nominate and elect one of the three members of the Company's current board of directors. We are accounting for this investment using the equity method and record our minority interest of their results in our results of operations. For the fiscal years ended September 30, 2009 and September 30, 2008, product sales revenue from this company was approximately $19,000 and $49,000, respectively. Accounts receivable balance from this company was $22,000 and $18,000 as of September 30, 2009 and 2008, respectively.
9. SUBSEQUENT EVENTS
The Company has performed an evaluation of subsequent events through December 28, 2009, the date on which this Annual Report on Form 10-K was filed with the SEC.
10. SELECTED QUARTERLY FINANCIAL DATA (Unaudited)
Following is a summary of our quarterly operating results and share data for the years ended September 30, 2009, 2008 and 2007.
| |
For the Quarter Ended | ||||||||||||
|---|---|---|---|---|---|---|---|---|---|---|---|---|---|
| |
December 31, | March 31, | June 30, | September 30, | |||||||||
| |
(In thousands, except per share data) |
||||||||||||
Consolidated Statements of Operations Data: |
|||||||||||||
Fiscal year ended September 30, 2009: |
|||||||||||||
Net revenue |
$ | 4,860 | $ | 3,577 | $ | 4,082 | $ | 4,866 | |||||
Gross profit |
2,962 | 2,107 | 2,545 | 3,167 | |||||||||
Net loss |
$ | (1,268 | ) | $ | (1,767 | ) | $ | (945 | ) | $ | (730 | ) | |
Basic and diluted net loss per share |
$ | (0.08 | ) | $ | (0.11 | ) | $ | (0.06 | ) | $ | (0.05 | ) | |
Weighted average shares used in computing basic and diluted net loss per share |
15838 | 15,862 | 15,923 | 16,137 | |||||||||
Fiscal year ended September 30, 2008: |
|||||||||||||
Net revenue |
$ | 4,260 | $ | 4,712 | $ | 4,812 | $ | 5,113 | |||||
Gross profit |
2,406 | 2,619 | 2,827 | 2,986 | |||||||||
Net loss |
$ | (971 | ) | $ | (1,127 | ) | $ | (1,029 | ) | $ | (810 | ) | |
Basic and diluted net loss per share |
$ | (0.06 | ) | $ | (0.07 | ) | $ | (0.07 | ) | $ | (0.05 | ) | |
Weighted average shares used in computing basic and diluted net loss per share |
15,728 | 15,708 | 15,697 | 15,777 | |||||||||
Fiscal year ended September 30, 2007: |
|||||||||||||
Net revenue |
$ | 4,372 | $ | 4,145 | $ | 4,181 | $ | 5,190 | |||||
Gross profit |
2,361 | 2,241 | 2,233 | 2,930 | |||||||||
Net loss |
$ | (94 | ) | $ | (172 | ) | $ | (526 | ) | $ | (144 | ) | |
Basic and diluted net loss per share |
$ | (0.01 | ) | $ | (0.01 | ) | $ | (0.03 | ) | $ | (0.01 | ) | |
Weighted average shares used in computing basic and diluted net loss per share |
15,130 | 15,163 | 15,505 | 15,651 | |||||||||
76
ALTIGEN COMMUNICATIONS, INC. AND SUBSIDIARY
SCHEDULE II—VALUATION AND QUALIFYING ACCOUNTS
Classification
|
Balance at Beginning of Fiscal Year |
Charged to Costs and Expenses |
Deductions | Balance at End of Fiscal Year |
|||||||||
|---|---|---|---|---|---|---|---|---|---|---|---|---|---|
| |
(In thousands) |
||||||||||||
Allowance for doubtful accounts: |
|||||||||||||
Fiscal year ending September 30, 2009 |
$ | 19 | $ | 19 | $ | (3 | ) | $ | 35 | ||||
Fiscal year ending September 30, 2008 |
$ | 33 | $ | — | $ | (14 | ) | $ | 19 | ||||
Fiscal year ending September 30, 2007 |
$ | 38 | $ | 15 | $ | (20 | ) | $ | 33 | ||||
Inventory reserve: |
|||||||||||||
Fiscal year ending September 30, 2009 |
$ | 850 | $ | 17 | $ | (176 | ) | $ | 691 | ||||
Fiscal year ending September 30, 2008 |
$ | 2,375 | $ | — | $ | (1,525 | ) | $ | 850 | ||||
Fiscal year ending September 30, 2007 |
$ | 2,279 | $ | 96 | $ | — | $ | 2,375 | |||||
77
Pursuant to the requirements of Section 13 or 15(d) of the Securities Exchange Act of 1934, the registrant has duly caused this report to be signed on its behalf by the undersigned, thereunto duly authorized.
| Date: December 28, 2009 | ALTIGEN COMMUNICATIONS, INC. | |||
By: |
/s/ GILBERT HU Gilbert Hu Chief Executive Officer |
|||
KNOW ALL PERSONS BY THESE PRESENT, that each person whose signature appears below constitutes and appoints Gilbert Hu and Philip M. McDermott, jointly and severally, his attorneys-in-fact, each with the power of substitution, for him in any and all capacities, to sign any amendments to this report on Form 10-K, and to file the same, with exhibits thereto and other documents in connection therewith with the Securities and Exchange Commission, hereby ratifying and confirming all that each of said attorneys-in-fact, or his substitute or substitutes may do or cause to be done by virtue hereof.
Pursuant to the requirements of the Securities Exchange Act of 1934, this report has been signed below by the following persons on behalf of the registrant in the capacities and on the dates indicated.
Signature
|
Title
|
Date
|
||
|---|---|---|---|---|
| /s/ GILBERT HU Gilbert Hu |
Chief Executive Officer (principal executive officer) and Director |
December 28, 2009 | ||
/s/ JEREMIAH J. FLEMING Jeremiah J. Fleming |
President, Chief Operating Officer (principal operating officer) and Director |
December 28, 2009 |
||
/s/ PHILIP M. MCDERMOTT Philip McDermott |
Chief Financial Officer (principal financial and accounting officer) |
December 28, 2009 |
||
/s/ TACHENG CHESTER WANG Tacheng Chester Wang |
Director |
December 28, 2009 |
||
/s/ MIKE MON YEN TSAI Mike Mon Yen Tsai |
Director |
December 28, 2009 |
||
/s/ ALAN HOWE Alan Howe |
Director |
December 28, 2009 |
78
| Exhibit Number | Description | ||
|---|---|---|---|
| 3.1 | (1) | Amended and Restated Certificate of Incorporation. | |
| 3.2 | (5) | Second Amended and Restated Bylaws. | |
| 3.3 | (10) | Certificate of Designation of Rights, Preferences and Privileges of Series A Participating Preferred Stock of AltiGen Communications, Inc. | |
| 4.1 | (11) | Preferred Stock Rights Agreement, dated as of April 21, 2009, between AltiGen Communications, Inc. and Computershare Trust Company, N.A., including the Certificate of Designation, the form of Rights Certificate and the Summary of Rights attached thereto as Exhibits A, B and C, respectively. | |
| 4.2 | (1) | Specimen common stock certificates. | |
| 4.3 | (1) | Third Amended and Restated Rights Agreement dated May 7, 1999 by and among AltiGen Communications, Inc. and the Investors and Founder named therein. | |
| 10.1 | (1) | Form of Indemnification Agreement. | |
| 10.2 | (1) | 1994 Stock Option Plan, as amended, and form of stock option agreement. | |
| 10.3 | (4) | 1999 Stock Plan, as amended, and form of stock option agreement. | |
| 10.4 | (3) | 1999 Employee Stock Purchase Plan, as amended, and forms of subscription agreement and notice of withdrawal. | |
10.5 |
Lease agreement: 410 East Plumeria Drive, San Jose, California between FSP Montague Business Center Corp., a Delaware Corporation and AltiGen Communications, Inc., dated April 16, 2009. |
||
| 10.6 | (1) | Employment Agreement by and between the Registrant and Philip McDermott, dated June 8, 1999. | |
| 10.7 | (9) | Amended and Restated Executive Employment Agreement by and between Philip McDermott and the Company, dated March 6, 2009. | |
| 10.8 | (7) | Executive Employment Agreement by and between Jeremiah J. Fleming and the Company, dated December 18, 2007. | |
| 10.9 | (9) | Executive Employment Agreement by and between Gilbert Hu and the Company, dated March 6, 2009. | |
| 10.10 | (2)++ | OEM Agreement between AltiSys Communications and AltiGen Communications, Inc., dated January 18, 1999. | |
| 10.12 | (4)++ | Distribution Agreement between Synnex Information Technologies, Inc. and AltiGen Communications, Inc. dated December 22, 1999. | |
| 10.13 | (8) | Distribution Agreement between Jenne Distributor, Inc., and AltiGen Communications, Inc. dated September 30, 2007. | |
| 10.14 | +++ | Reseller Agreement between Fiserv Solutions, Inc. and AltiGen Communications, Inc. dated August 28, 2009. | |
| 10.15 | (12) | 2009 Equity Incentive Plan and form of stock option agreement thereunder. | |
| 10.16 | (12) | 2009 Employee Stock Purchase Plan. | |
| 21.1 | (1) | Subsidiaries of the Registrant. | |
| Exhibit Number | Description | ||
|---|---|---|---|
23.1 |
Consent of Independent Registered Public Accounting Firm. |
||
24.1 |
Power of Attorney (included on signature page). |
||
31.1 |
Certification of Principal Executive Officer, filed herewith. |
||
31.2 |
Certification of Principal Financial Officer, filed herewith. |
||
32.1 |
Certification of Chief Executive Officer Pursuant to 18 U.S.C. Section 1350, as Adopted Pursuant to Section 906 of the Sarbanes-Oxley Act of 2002, filed herewith. |
||
32.2 |
Certification of Chief Financial Officer Pursuant to 18 U.S.C. Section 1350, as Adopted Pursuant to Section 906 of the Sarbanes-Oxley Act of 2002, filed herewith. |
||
| (1) | Incorporated by reference to exhibit filed with the Registrant's Registration Statement on Form S-1 (No. 333-80037) declared effective on October 4, 1999. | |
(2) |
Incorporated by reference to exhibit filed with the Registrant's Quarterly Report on Form 10-Q for the quarter ended December 31, 2001. |
|
(3) |
Incorporated by reference to exhibit filed with the Registrant's Annual Report on Form 10-K for the fiscal year ended September 30, 2002. |
|
(4) |
Incorporated by reference to exhibit filed with the Registrant's Annual Report on Form 10-K for the fiscal year ended September 30, 2003. |
|
(5) |
Incorporated by reference to exhibit filed with the Registrant's Quarterly Report on Form 10-Q for the quarter ended March 31, 2004. |
|
(7) |
Incorporated by reference to exhibit filed with the Registrant's Registration Statement on Form 8-K (No. 000-27427). |
|
(8) |
Incorporated by reference to exhibit filed with the Registrant's Annual Report on Form 10-K for the fiscal year ended September 30, 2007 (No. 000-27427). |
|
(9) |
Incorporated by reference to exhibit filed with the Registrant's Registration Statement on Form 8-K on March 10, 2009. |
|
(10) |
Incorporated by reference to exhibit filed with the Registrant's Registration Statement on Form 8-A on April 23, 2009. |
|
(11) |
Incorporated by reference to exhibit filed with the Registrant's Registration Statement on Form 8-K on April 23, 2009. |
|
(12) |
Incorporated by reference to exhibit filed with the Registrant's Registration Statement on Form S-8 on June 29, 2009. |
|
++ |
Confidential treatment was granted for certain portions of this exhibit. |
|
+++ |
Confidential treatment requested for certain portions of this agreement. |