Attached files
| file | filename |
|---|---|
| 8-K - FORM 8-K - NAVISTAR INTERNATIONAL CORP | d8k.htm |
 NYSE: NAV 1 4th Quarter 2009 Earnings Presentation December 22, 2009 Exhibit 99.1 |
 NYSE: NAV 2 2 Safe Harbor Statement Information provided and statements contained in this presentation that are not purely
historical are forward-looking statements within the meaning of
Section 27A of the Securities Act of 1933, as amended, Section 21E of the Securities Exchange Act of 1934, as amended, and the Private Securities Litigation Reform Act of 1995. Such forward-looking statements only speak
as of the date of this presentation and the Company assumes no obligation to
update the information included in this presentation. Such
forward-looking statements include information concerning our possible
or assumed future results of operations, including descriptions of our business strategy. These statements often include words such as “believe,” “expect,” “anticipate,” “intend,” “plan,” “estimate,” or similar expressions. These statements are not guarantees of performance or results and they involve risks, uncertainties, and assumptions. For a further
description of these factors, see Item 1A, Risk Factors, included within our Form 10-K for the year ended
October 31, 2009, which was filed on December 21, 2009. Although we believe that these
forward-looking statements are based on reasonable assumptions, there are many
factors that could affect our actual financial results or results of
operations and could cause actual results to differ materially from those in
the forward-looking statements. All future written and oral forward- looking statements by us or persons acting on our behalf are expressly qualified in
their entirety by the cautionary statements contained or referred to above.
Except for our ongoing obligations to disclose material information as
required by the federal securities laws, we do not have any obligations or
intention to release publicly any revisions to any forward-looking statements to reflect events or circumstances in the future or to reflect the occurrence of
unanticipated events. |
 NYSE: NAV 3 3 Other Cautionary Notes • The financial information herein contains audited and unaudited information and has been prepared by management in good faith and based on data currently available to the company. • Certain Non-GAAP measures are used in this presentation to assist the reader in understanding our core manufacturing business. We believe this information is useful and relevant to assess and measure the performance of our core manufacturing business as it illustrates manufacturing performance without regard to selected historical legacy costs (i.e. pension and other postretirement costs). It also excludes financial services and other expenses that may not be related to the core manufacturing business. Management often uses this information to assess and measure the performance of our operating segments. A reconciliation to the most appropriate GAAP number is included in the appendix of this presentation. |
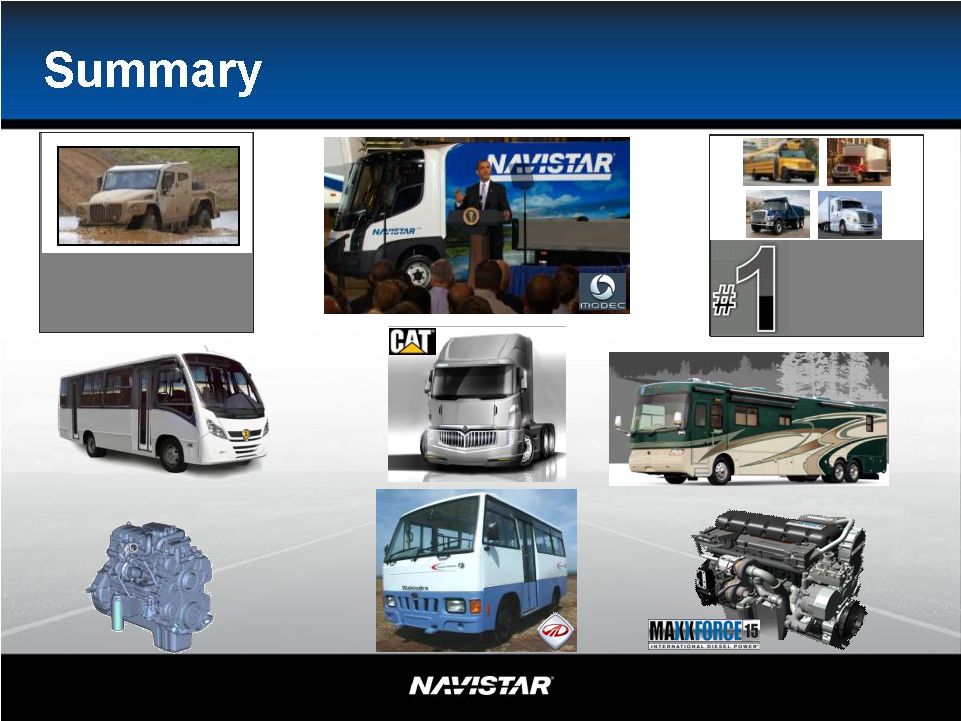
 NYSE: NAV 4 4 Summary • 2009 Q4 and year-end results • Controlling Our Destiny: – Cash, SGA, and Capital structure • January 19 th Investor Day Original 2009 Goal based on 415K unit Original 2009 Goal based on 415K unit industry: industry: $15 $15 Billion Billion in in revenue revenue and and profitable profitable at at all all points points in in the the cycle cycle |
 NYSE: NAV What we said on the 3 rd quarter call for full year 2009 Note: This slide contains non-GAAP information, please see the Reg G in appendix for detailed reconciliation We continue to invest today, to ensure the future 5 9/10/09 2009 Guidance Actual $710 to $735 million $707 million Manufacturing Cash $650 to $750 million $1.1 billion Industry Volume Reduction to 210,000 to 225,000 Industry Volume Reduction to 165,000 to 185,000 Warranty R&D spending Taxes (-) Customer Mix (-), offset by SG&A below Offsetting Actions Lower commodity Costs / cost reductions Blue Diamond JV operational impact Military revenue: $2.7B to $3.0B Market Share Parts profitability SG&A / Below the Line items +, offset by customer mix above EPS Guidance/Actuals* $2.55 to $2.85 $2.86 Settlement and related restructuring $2.40 +/- $2.19 EPS Guidance/Actuals** $4.95 to $5.25 $5.05 Refinancing costs and restructuring actions NA ($0.59) Diluted EPS as reported $4.46 *Excludes settlement, restructuring and refinancing costs **Excludes refinancing costs and restructuring actions Key Challenges Manufacturing Segment Profit* |
 NYSE: NAV 6 Full Year 2009 *Note: This slide contains non-GAAP information, please see the Reg G in appendix for detailed reconciliation |
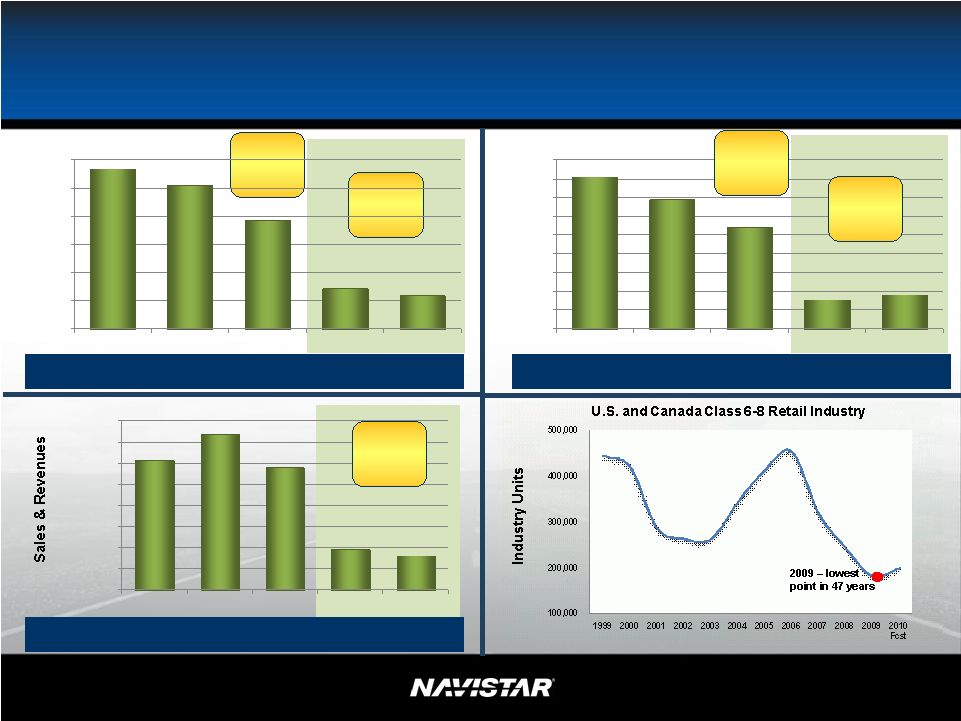 NYSE: NAV 7 404,700 345,500 269,300 77,900 90,900 0 50,000 100,000 150,000 200,000 250,000 300,000 350,000 400,000 450,000 FY 2007 FY 2008 FY 2009 Q408 Q409 2009 Full Year and 4Q Information Consolidated Revenues ($ in millions) Yearly and Quarterly Truck Chargeouts Yearly and Quarterly Engine Shipments Y/Y Shipments decreased ~22% Q/Q Shipments increased ~17% Y/Y Chargeouts decreased ~25% Q/Q Chargeouts decreased ~17% $12,295 $14,724 $11,569 $3,870 $3,285 $0 $2,000 $4,000 $6,000 $8,000 $10,000 $12,000 $14,000 $16,000 FY 2007 FY 2008 FY 2009 Q408 Q409 Q/Q Revenues decreased ~15% 113,600 102,200 76,800 28,700 23,700 0 20,000 40,000 60,000 80,000 100,000 120,000 FY 2007 FY 2008 FY 2009 Q408 Q409 |
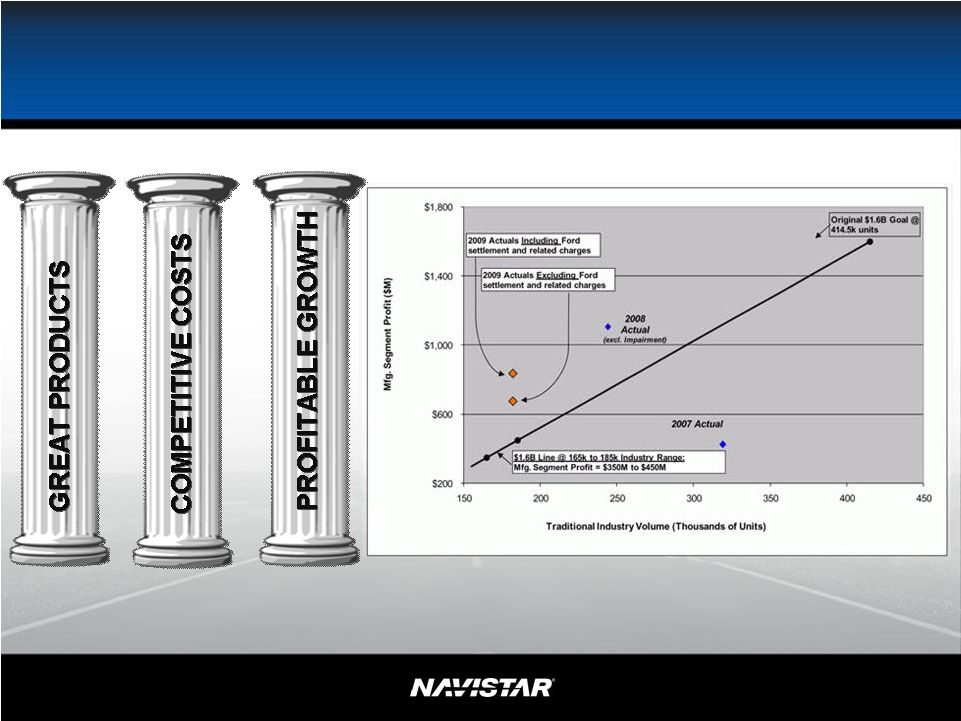
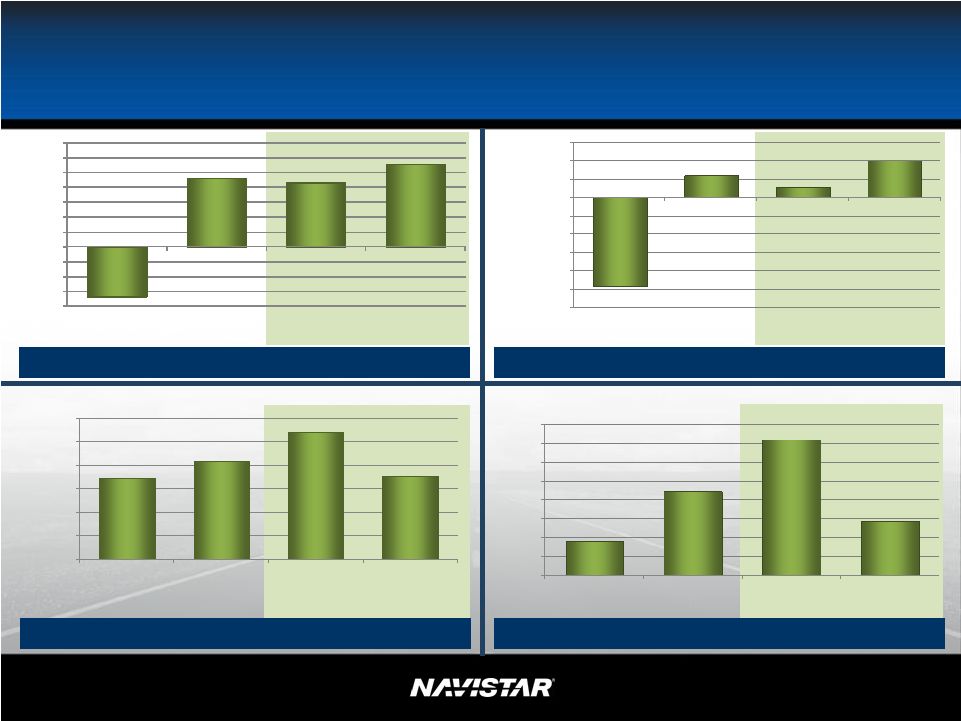 NYSE: NAV 8 8 2009 Full Year and 4Q Information: Profitable at all points in the cycle Note: This slide contains both GAAP and non-GAAP information, please see the Reg G in appendix for detailed reconciliation. Yearly Diluted Earnings (loss) per share Quarterly Manufacturing Segment Profit ($ in millions) Yearly Manufacturing Segment Profit ($ in millions) Quarterly Diluted Earnings (loss) per share $693 $836 $1,088 $707 $0 $200 $400 $600 $800 $1,000 $1,200 FY 2008 With Impacts FY 2009 With Impacts FY 2008 Without Impacts FY 2009 Without Impacts $1.82 $4.46 $7.21 $2.86 $0.00 $1.00 $2.00 $3.00 $4.00 $5.00 $6.00 $7.00 $8.00 FY 2008 With Impacts FY 2009 With Impacts FY 2008 Without FY 2009 Without Impacts Impacts ($4.81) $1.19 $0.56 $1.99 -$6.00 -$5.00 -$4.00 -$3.00 -$2.00 -$1.00 $0.00 $1.00 $2.00 $3.00 4Q08 With Impacts 4Q09 With Impacts 4Q08 Without Impacts 4Q09 Without Impacts ($168) $232 $217 $279 -$200 -$150 -$100 -$50 $0 $50 $100 $150 $200 $250 $300 $350 4Q08 With Impacts 4Q09 With Impacts 4Q08 Without Impacts 4Q09 Without Impacts |
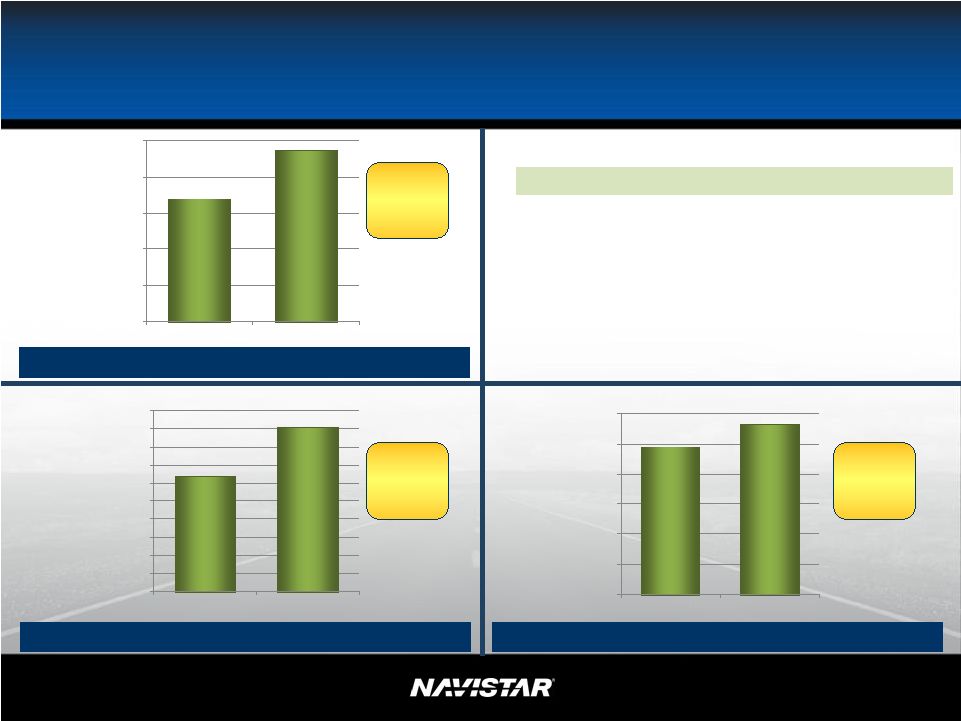 NYSE: NAV 2009 4Q Information • FY2009 EPS by quarter: 1Q - $0.67; 2Q - $0.60; 3Q - $(0.42); 4Q - $1.99 • 4 th quarter is typically our strongest quarter • Operating days - 1 st and 3 rd quarters have fewer operating days (summer and holiday shutdowns) • Cost reductions • Quarter and full-year results because we have been successful in the marketplace 17,000 23,700 0 5,000 10,000 15,000 20,000 25,000 3Q09 4Q09 63,600 90,900 0 10,000 20,000 30,000 40,000 50,000 60,000 70,000 80,000 90,000 100,000 3Q09 4Q09 $491 $565 $0 $100 $200 $300 $400 $500 $600 3Q09 4Q09 Part Revenues ($ in millions) Truck Chargeouts ($ in millions) Engine Shipments ($ in millions) Chargeouts sequentially increased by 39% or 6,700 units Shipments sequentially increased by 43% or 27,300 units Revenues sequentially increased by 15% or $74 million 9 |
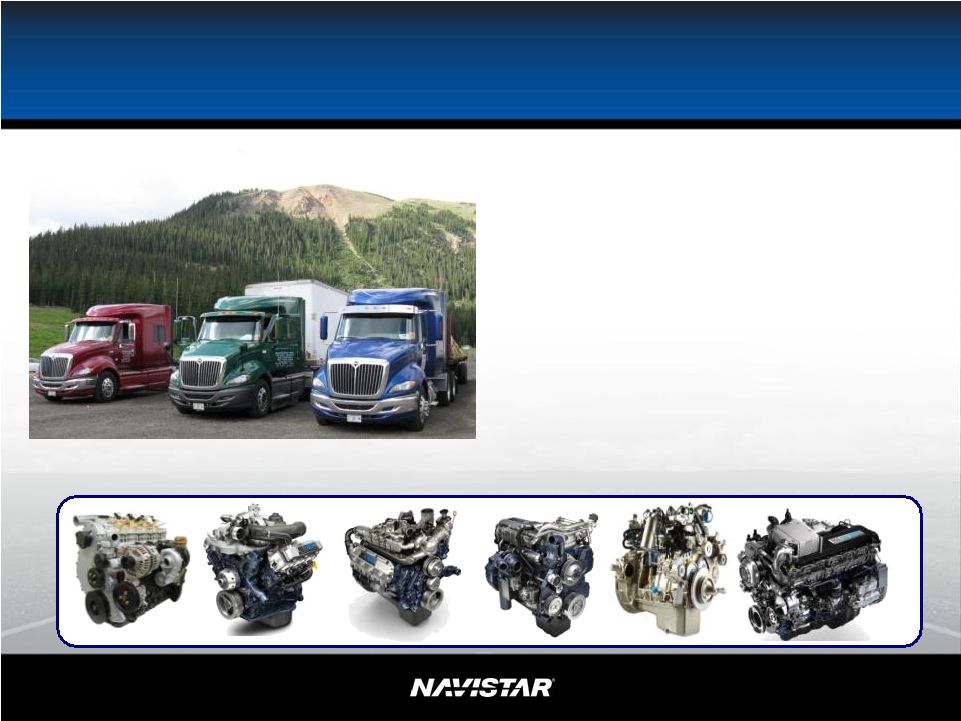
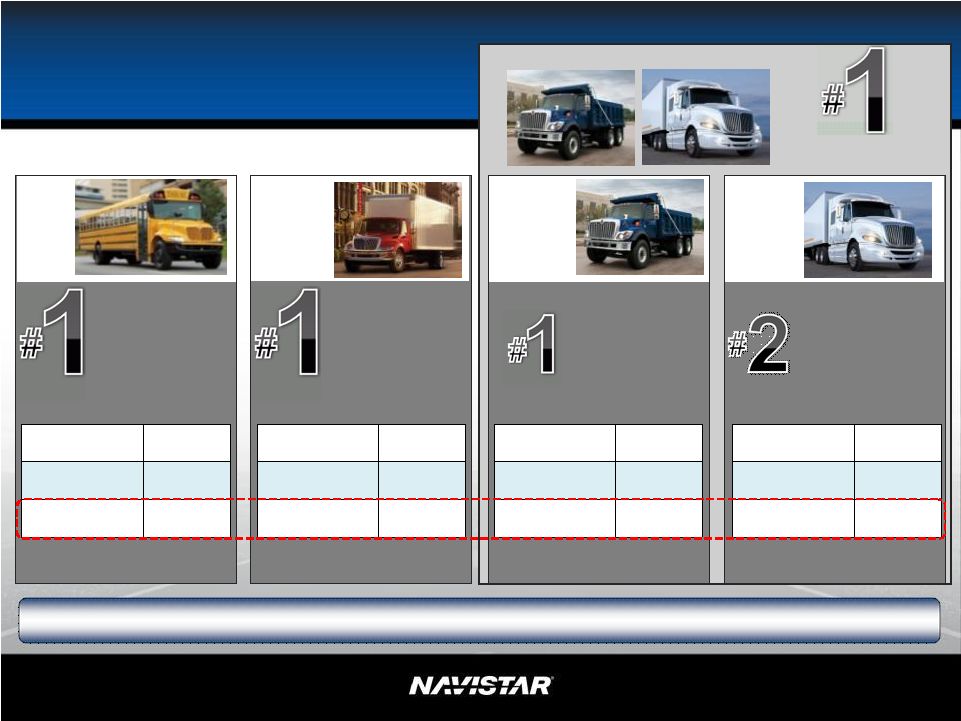 NYSE: NAV 10 10 Medium Truck Great Products – Market Share 66% Market Share 4Q09 39% Market Share 4Q09 33% Market Share 4Q09 Severe Service Truck* Heavy Truck 24% Market Share 4Q09 FY07 60% FY08 55% FY09 61% *Note: Excludes U.S. Military shipments. See market share slide in appendix for shipments with and without
military shipments. School Bus & Combined Class 6-8 Market Share – FY07: 26%; FY08: 29%; FY09: 34% FY07 36% FY08 36% FY09 35% FY07 25% FY08 27% FY09 34% FY07 15% FY08 19% FY09 25% Class 8* 27% Market Share 4Q09 School Bus (U.S. & Canada) Market share based on brand |
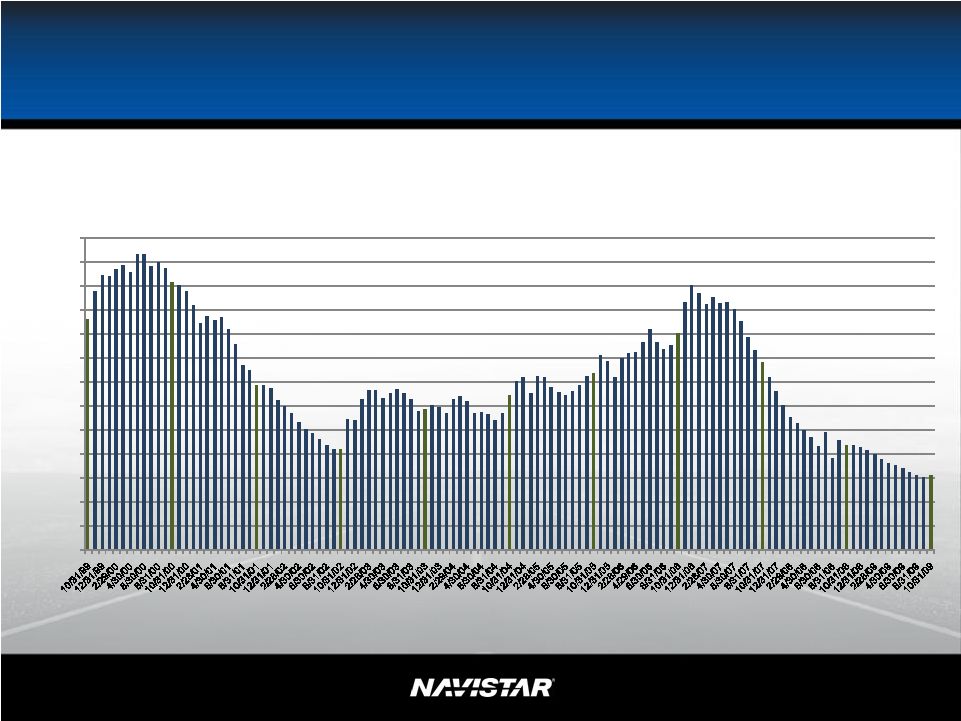 NYSE: NAV 11 11 International Dealer Stock Inventory (Units) * U.S. and Canada Dealer Stock Inventory *Includes U.S. and Canada Class 4-8 and school bus inventory, but does not include
Workhorse Custom Chassis inventory. - 1,000 2,000 3,000 4,000 5,000 6,000 7,000 8,000 9,000 10,000 11,000 12,000 13,000 |
 NYSE: NAV 12 12 Leveraging Our Assets while Controlling Our Destiny • Over last five years we have spent over $2 billion in engineering and product development costs • On average this is $412 million per year • We have continued to invest while others have reduced investment 12 *Exclusive of purchases of equipment leased to others Advanced EGR In-Cylinder NOx Reduction (in millions) $413 $453 $375 $384 $433 $0.00 $100.00 $200.00 $300.00 $400.00 $500.00 FY2005 FY 2006 FY 2007 FY 2008 FY 2009 Good Results While Investing in Future |
 NYSE: NAV 13 13 Investments in 2009 for Future Results • Monaco • TEMs • Modec (Electric) • Global Bus • NC 2 (Cat JV) • Mahindra • 2010 Emissions • MaxxForce 15L ® • Pure Power Technologies 13 Advanced EGR In-Cylinder NOx Reduction Amminex has developed Solid Ammonia Storage and Delivery System |
 NYSE: NAV 14 14 SG&A Objectives for 2009 met • Year-over-year cost reductions – Other SG&A / fixed costs ~$150M – Professional (filing) fees ~ $100M Where are we today? FY2009 FY2008 Change SG&A (excluding items below) $1,088 $1,326 ($238) Professional fees 40 165 (125) Post retirement 216 (54) 270 Total SG&A $1,344 $1,437 ($93) (in millions) |
 NYSE: NAV 15 15 Post Retirement Pension & Health Care • Closed plan to new entrants in 2002 - Majority of new entrants closed in 1996 - Annual service cost is decreasing • 2009 higher cost caused by 2008 market decline - Revised investment strategy/investment advisor - FY2009 return 15.8% for pension plan and 15.6% for OPEB - Expect cost to improve/neutral • Aggressive cost control, without service cuts (health care) - Cost contained Contained |
 NYSE: NAV 16 16 Date Financial Services Actions Completed April $300 million – NFC Retail Securitization August $650 million – NFC Dealer Floor Plan Renewal (capacity dropped to $500M upon completion of November TALF deal) October $100 million – NFC Retail Account Facility Renewal November $350 million – NFC Dealer Floor Plan TALF Deal December $815 million – NFC Revolver/Term Loan Refinancing December $304 million – Private Placement Sale Navistar’s 2009 Refinancing Plan is Complete Date Manufacturing Action Completed October $1.5 billion – NIC Refinancing |
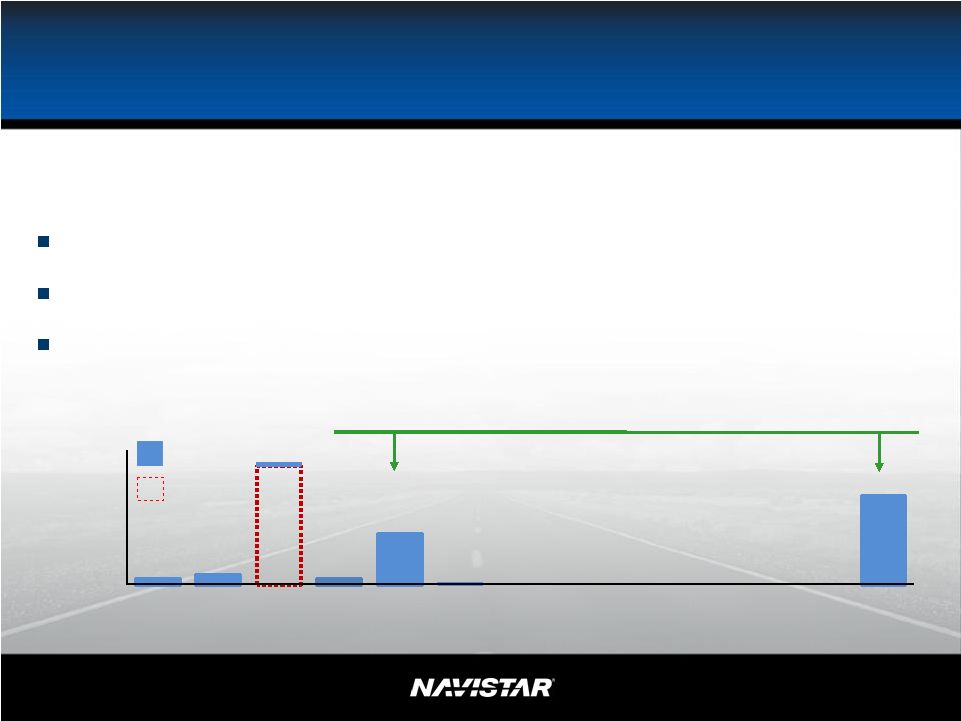 NYSE: NAV 17 17 NIC (Manufacturing) Refinancing Enhanced Balance Sheet Stability The NIC refinancing reduced balance sheet risk and increased financial flexibility Extended maturity profile with staggered maturities and limited/no dilution Increased flexibility and cost effective (6.34% cash APR) Maintained modest leverage levels, set to improve with truck cycle rebound *No economic dilution until average stock price at or above $60.14 * $0 $500 $1,000 $1,500 2010 2011 2012 2013 2014 2015 2016 2017 2018 2019 2020 2021 2022 Reduced refinancing risk by splitting and extending maturities Maturity profile ($ in millions) Source: Company filings Existing debt Refinanced debt $67 $112 $1,330 $570 $72 $24 $1,000 $34 Fiscal Year |
 NYSE: NAV 18 18 Manufacturing Cash Note: This slide contains non-GAAP information, please see the Reg G in appendix for detailed reconciliation. ($ in millions) July 31, 2009 ending cash $751 Cash flow from operations (including working capital) $385 Capital spending/investment (92) Net cash impact - NIC refinancing 126 Other financing cashflow (18) Net change in manufacturing cash $401 October 31, 2009 manufacturing Cash $1,152 Accounting consolidation of Blue Diamond (13) October 31, 2009 ending manufacturing cash $1,139 |
 NYSE: NAV 19 19 Investor & Analyst Day – January 19, 2010 Make Your Reservation Navistar’s Investor & Analyst Day Tuesday, January 19, 2010 Melrose Park Engine Facility Melrose Park, IL 11:30 a.m. – 4 p.m. CST Lunch, Presentation with Q&A Plant Tour, Lab Demos & Product Displays Reservation Required Please contact Suzanne Sorensen at Suzanne.Sorensen@Navistar.com to RSVP
|
 NYSE: NAV 20 20 What to expect on January 19 • Delivering on our Commitments: – 2010 earnings guidance – $2 billion military sustainable • 2010 Priorities: – Postretirement – NFC – Engine • Product and product displays to address the myths vs. realities: – 2010 readiness – 0.5 NOx/0.2 NOx – Myths – Heat/Fuel – Alternative future technologies – Growth Markets Advanced EGR In-Cylinder NOx Reduction |
 NYSE: NAV 21 21 Summary-2010 Emission Strategy Status 2010 emission strategy on/ahead of schedule • All engines will be between 0.4 and 0.5 NOx • Engine durability testing is on track and plan to over-test and stress many parts of
the system • In most cases, vehicles will have equal to or better fuel economy than 2009 vehicles • Base engine will have less heat than 2009 engines • ProStar ® vehicle weight will be reduced by over 700 lbs. • 100 test vehicles in operation today |
 NYSE: NAV 22 22 Current status: • More than 21 months of testing between engine labs and field test units • 100 test vehicles in operation today • Validation testing includes: - High-altitude and high-temperature testing in Nevada and mountainous regions of Colorado - Cold weather testing conducted this past January to March in Minnesota and Colorado - We will continue to validate and make final calibration adjustments this winter in Minnesota, Alaska and Colorado Next steps: • Receive EPA certification prior to 2010 launch • Launch Controlling Our Destiny 2010 Engine Testing - On Track or Ahead of Schedule |
 NYSE: NAV 23 23 Navistar Delivers First 2010 Emissions- Navistar Delivers First 2010 Emissions- Ready School Buses Ready School Buses December 7, 2009 Columbus, Mississippi |
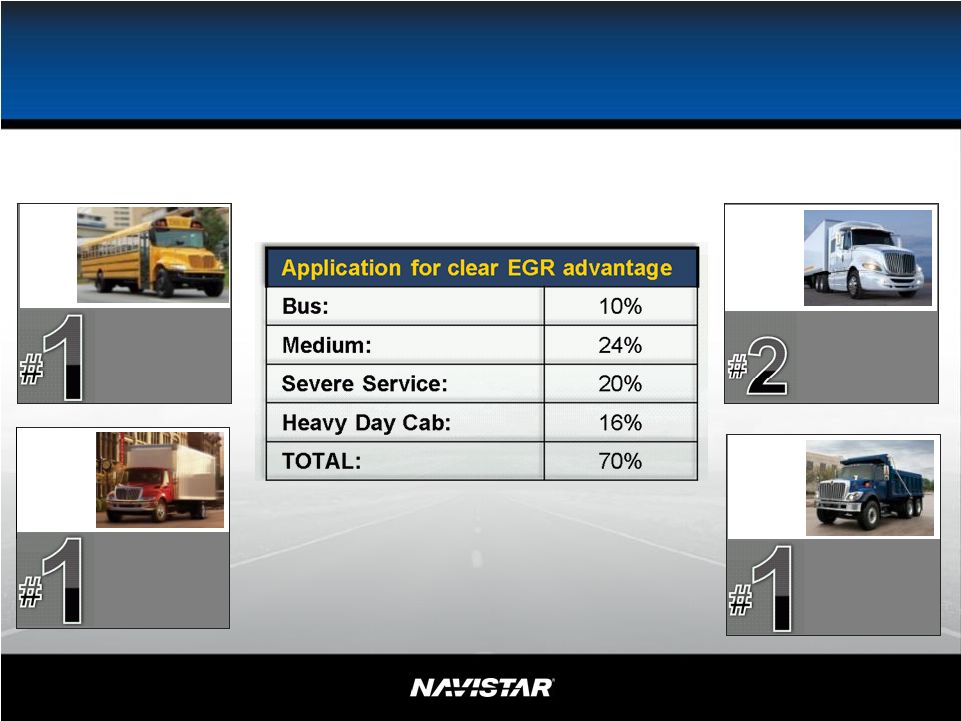 NYSE: NAV 24 24 Advanced EGR Gives Us a Competitive Advantage 61% Market Share FY 2009 School Bus 35% Market Share FY 2009 34% Market Share FY 2009 Severe Service Truck* Heavy Truck 25% Market share FY 2009 Medium Truck 2009 Industry : Heavy Day Cab – 16% Heavy Sleeper – 30% *Note: Excludes U.S. Military deliveries. Market share based on brand |
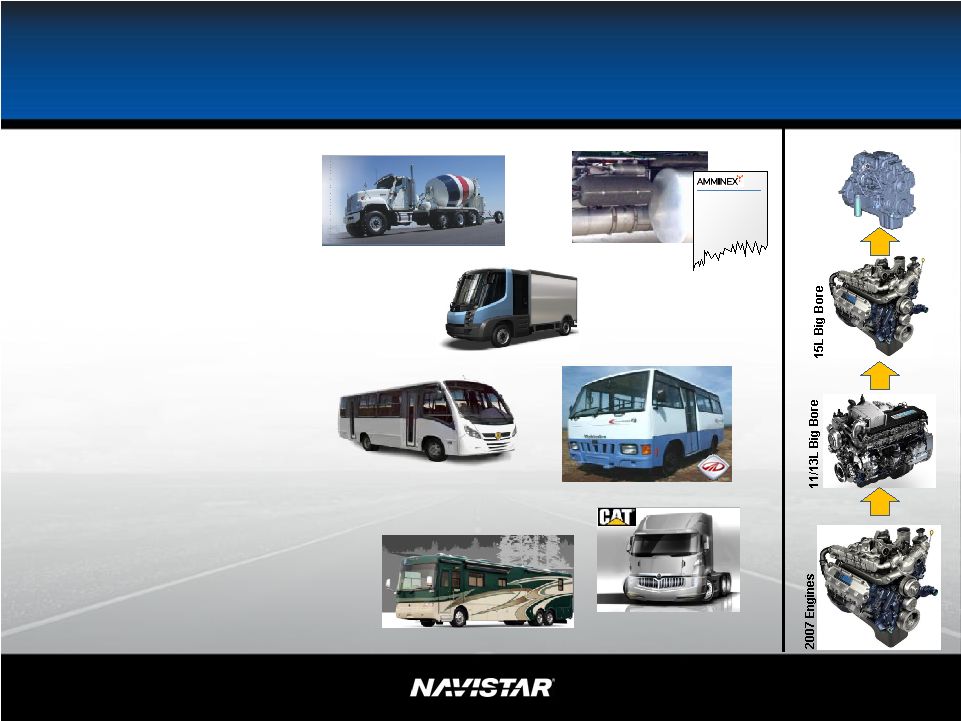
 NYSE: NAV 25 25 MaxxForce ® 15L status and strategy Actions in 2009 for 2010 and Beyond 15 Liter 2010 Emission Strategy Current status: • More than 12 months of testing, which includes high-altitude and high-temperature testing • Provide advance production units to strategic customers • Production in late calendar 2010 Actions and product attributes to ensure success in 2010: • Transition some 15L customers to the MaxxForce ® 11L/13L • Significant engine weight savings • Better manage heat rejection • Product testing on/ahead of schedule Today 2009 Transition 2010 Big Bore 11L-15L 11L/13L 46% 15L 54% <425 hp 12% 425-455 hp 64% 475-550 hp 24% MaxxForce ® 11L/13L 330 hp-475 hp @ 1900 rpm 1250-1700 hp lb.–ft. @ 1000 rpm |
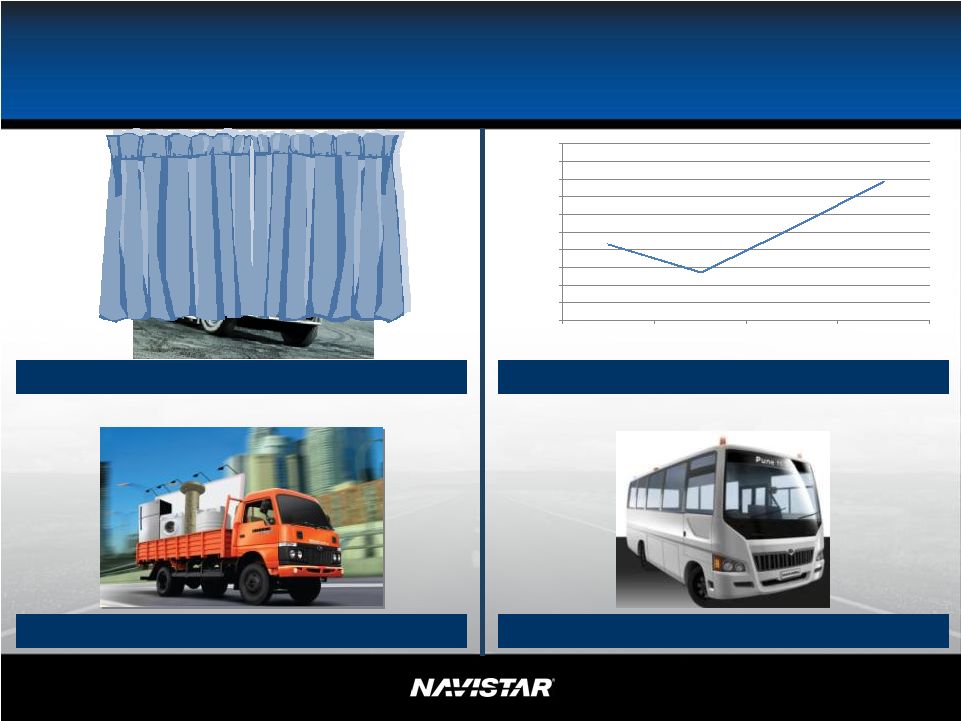 NYSE: NAV 26 Mahindra Navistar Automotives Ltd. Passenger Bus Overall commercial vehicle industry (in units) Note: Mahindra FY – April to March Mahindra/Navistar J.V. is a 51% - 49% joint venture 150,000 170,000 190,000 210,000 230,000 250,000 270,000 290,000 310,000 330,000 350,000 FY 2009 Actual FY 2010 Estimate FY 2011 Estimate FY 2012 Estimate New Heavy Truck Launch – January 2010 Light Truck |
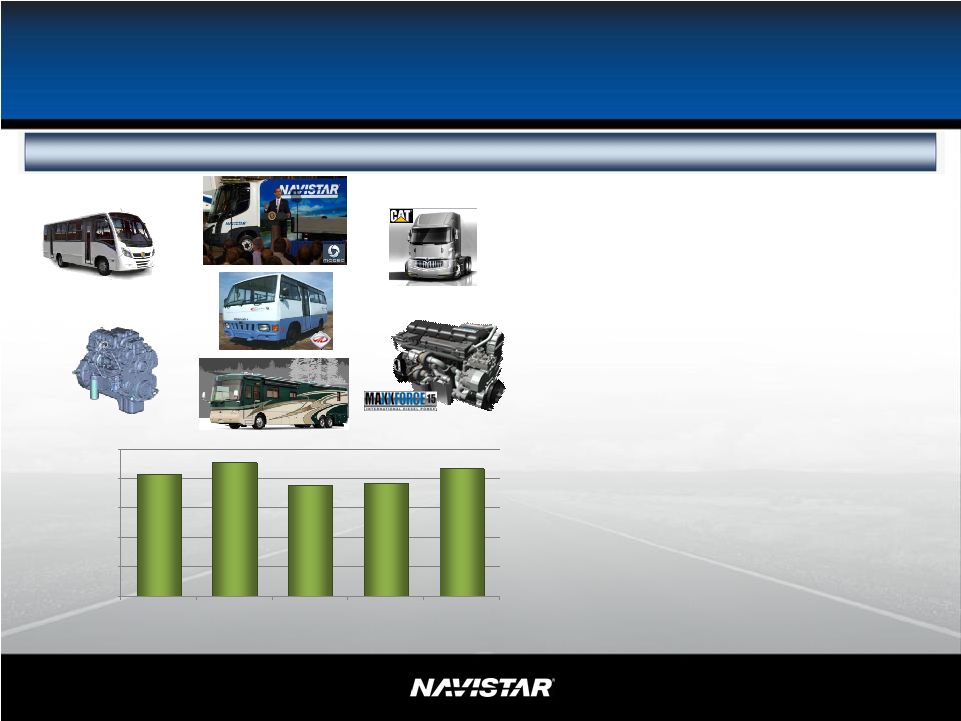
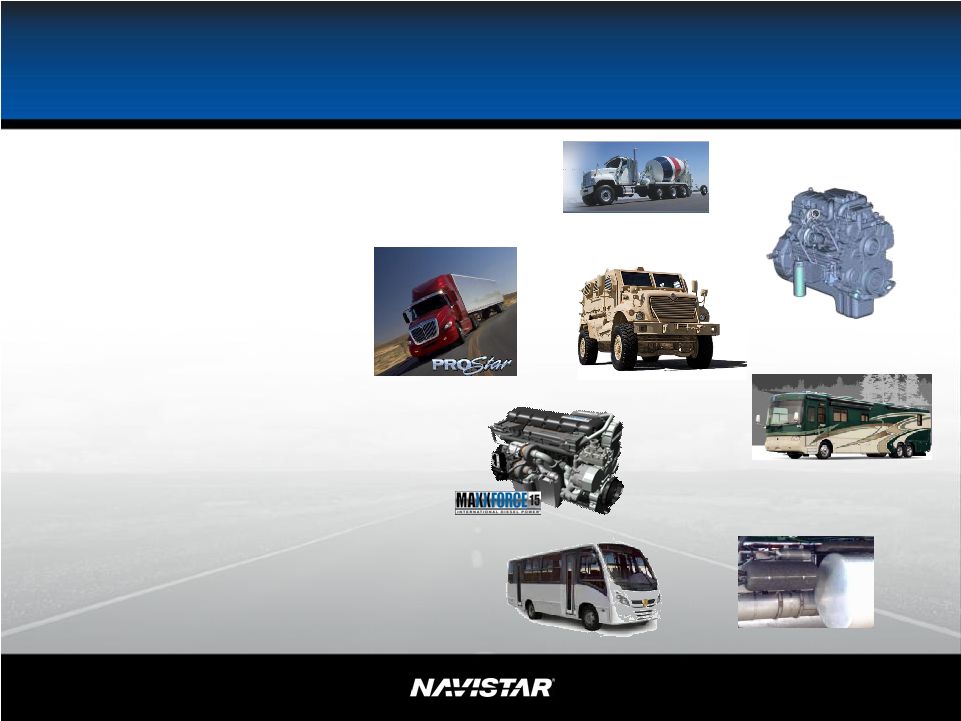
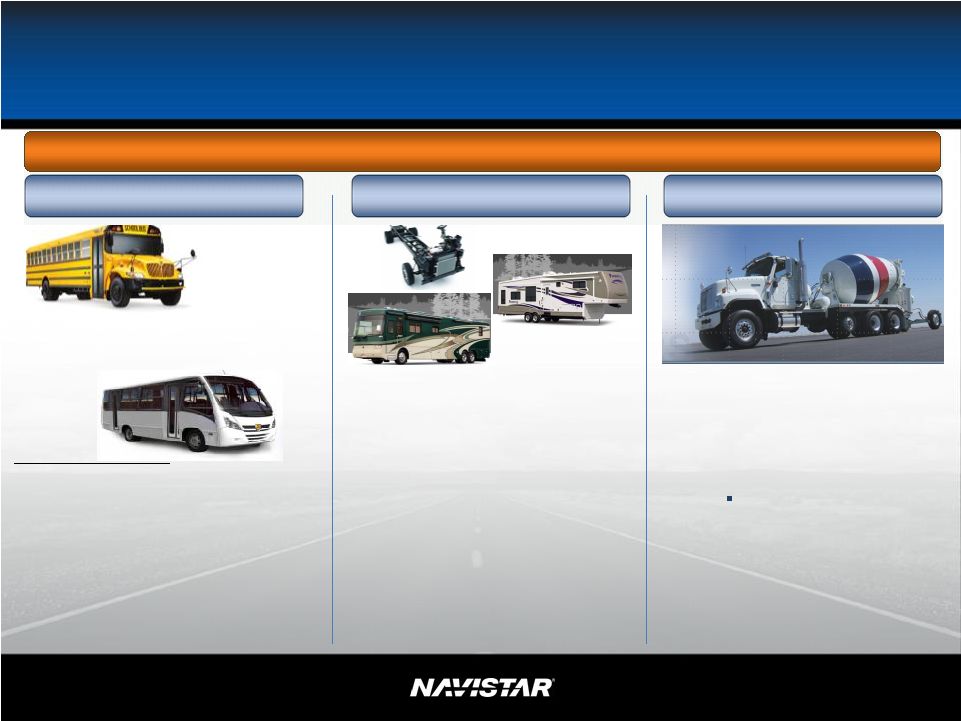 NYSE: NAV 27 TEM/End Customer Strategy • Compete in Class A, Class B, Class C and towables • 2009 Industry market in Class A ~5,900 units • #1 in diesel Class A RV market share • Growth opportunities in: - Towables - Vertical integration of engine - Parts • Largest privately-held mixer manufacturer in North America • Industry market share ~6,000 units • Currently ~10% market share • Opportunities: - EGR engine strategy Domestic growth - Jobs creation - Obama stimulus package • Global growth - NC² • #1 in market share despite industry consolidation • MaxxForce ® EGR engines Rest of World Focus • Capitalize on large market in South America • Emerging market in Mexico driven by government funding - Partnership with Neobus • The launch is currently on plan with ramp- up through early 2010 • Low cost/high quality design capability • Long-term potential for U.S. and Canada NOTE: J.V. pending - MOU with San Marino (Neobus) for integrated commercial bus body J.V. assembly plant in Mexico Bus Bus Continental Mixer Continental Mixer Profitable Growth Profitable Growth Monaco Monaco |
 NYSE: NAV 28 28 Actions in 2010 and Beyond: Caterpillar/Navistar Strategic Alliance/ NC 2 Joint Venture • Strategic alliance to manufacture a heavy-duty Caterpillar vocational truck • Manufactured by Navistar in Garland, TX • Expected mid-2011 Global Commercial Truck Markets Outside of N.A. North America Caterpillar Vocational • 50/50 joint venture for commercial trucks outside of North America formed September 2009 • Leverages the complementary strengths of both companies - CAT – distribution - Navistar – manufacturing and product development • First products available in fiscal Q2 of 2010 |
 NYSE: NAV 29 29 Controlling Our Destiny: Investing in Fuel Systems • Skilled workforce • Engineering staff • Intellectual property Core Competency Fuel Systems Plant R&D Center Physical Assets Control
Cost Control Technology |
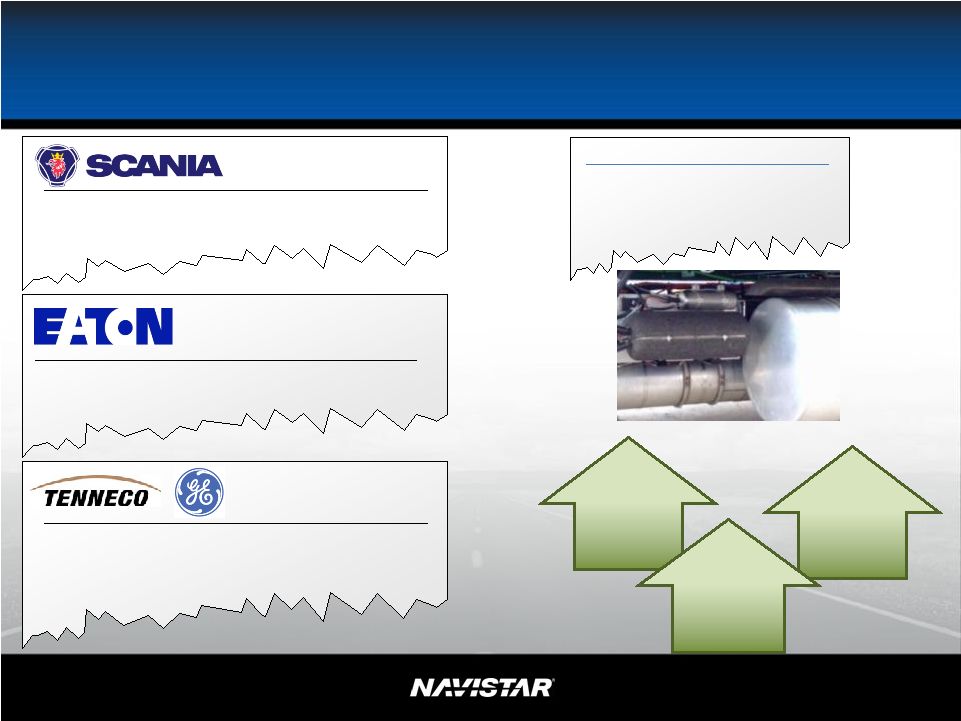 NYSE: NAV 30 Customer Friendly Solutions TENNECO and GE Transportation to Develop Hydrocarbon-SCR Technology for Diesel Emission Aftertreatment 4 February 2009 Eaton Evaluates Unique Emission Control Technology 22 June 2006 17 July 2008 Scania: EGR cost effective and convenient. Just add diesel! Solid NH3 cartridge Advanced EGNR Next generation of EGR Dealer and customer friendly Easy for operators Easy to maintain and understan d |
 NYSE: NAV 31 31 Full Year 2010 Initial Outlook 2010 Initial Outlook Industry volume 175,000 to 215,000 R&D spending flat Interest expense up Military revenue at least $2 billion Loss of Ford engine volume production ceases 12/31/09 Market share maintain to increase 2010 strategy impact up in 2nd half Global growth - Monaco/TEMs starting in 2010 |
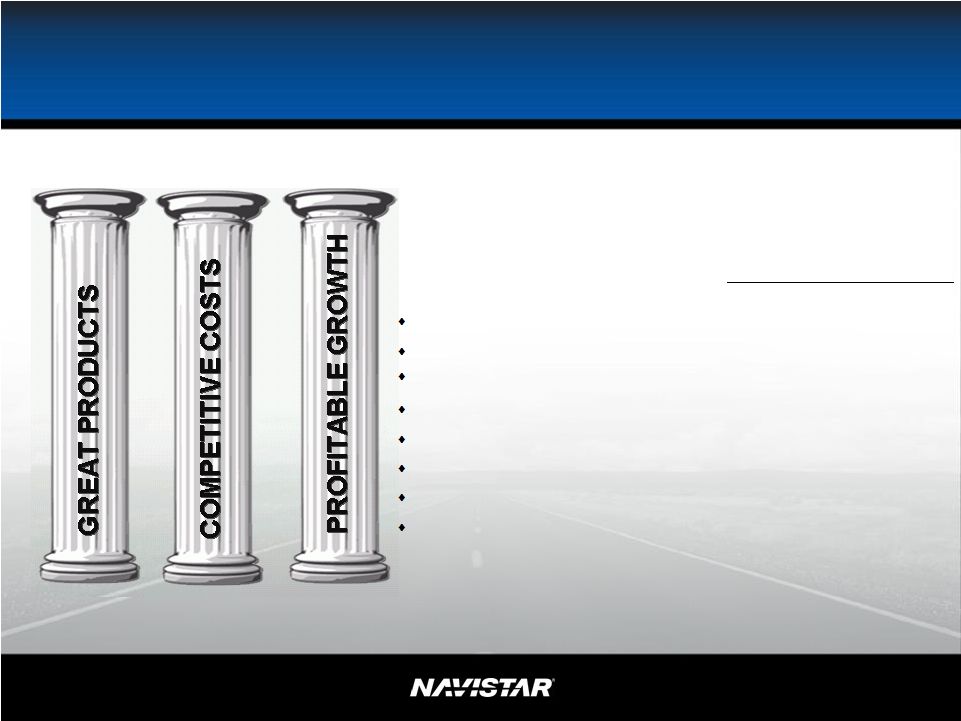
 NYSE: NAV 32 32 Summary Combined 34% Market Share FY 2009 Advanced EGR In-Cylinder NOx Reduction Military sustainable at $2B |
 Appendix NYSE: NAV 33 |
 NYSE: NAV 34 Impact of Ford Settlement on 2009 Business Impact of Settlement • Loss of U.S. automotive customer • Less intensive capital/product requirements • Restructured business • Impact of increased equity stake in BDT & BDP Settlement and Related Restructuring - 2009 PBT Impact (in millions) Q1 Q2 Q3 Q4 Full Year Cash 200 $ 200 $ Warranty 75 75 Restructuring charges (58) 3 - (4) (59) Other related income and (expense) (27) (35) 18 (12) (56) 190 $ (32) $ 18 $ (16) $ 160 $ Actual |
 NYSE: NAV 35 35 Market Share – U.S. & Canada School Bus and Class 6-8 Navistar 1st Q 2nd Q 3rd Q 4th Q Full Year 1st Q 2nd Q 3rd Q 4th Q Full Year 1st Q 2nd Q 3rd Q 4th Q Full Year Bus (School) 60% 60% 59% 59% 60% 57% 57% 48% 58% 55% 56% 60% 61% 66% 61% Medium (Class 6-7) 37% 34% 34% 37% 36% 34% 35% 39% 35% 36% 30% 39% 33% 39% 35% Heavy (LH & RH) 16% 12% 15% 17% 15% 16% 15% 19% 25% 19% 24% 23% 29% 24% 25% Severe Service 24% 28% 26% 32% 27% 35% 36% 34% 41% 37% 45% 49% 41% 47% 45% Combined Class 8 18% 17% 19% 22% 19% 23% 23% 25% 30% 25% 31% 33% 33% 32% 32% Combined Market Share 25% 25% 27% 31% 27% 29% 29% 30% 35% 31% 33% 38% 37% 39% 36% Navistar 1st Q 2nd Q 3rd Q 4th Q Full Year 1st Q 2nd Q 3rd Q 4th Q Full Year 1st Q 2nd Q 3rd Q 4th Q Full Year Bus (School) 60% 60% 59% 59% 60% 57% 57% 48% 58% 55% 56% 60% 61% 66% 61% Medium (Class 6-7) 37% 34% 34% 37% 36% 34% 35% 39% 35% 36% 30% 39% 33% 39% 35% Heavy (LH & RH) 16% 12% 15% 17% 15% 16% 15% 19% 25% 19% 24% 23% 29% 24% 25% Severe Service 23% 26% 24% 28% 25% 28% 26% 26% 29% 27% 32% 36% 33% 33% 34% Combined Class 8 18% 16% 19% 21% 18% 20% 19% 21% 26% 22% 26% 28% 30% 27% 28% Combined Market Share 25% 25% 27% 31% 26% 27% 27% 28% 32% 29% 30% 35% 35% 36% 34% Market Share - U.S. & Canada School Bus and Class 6-8 2007 2008 2007 2008 2009 2009 |
 NYSE: NAV 36 36 Truck Chargeouts Note: Information shown below is based on Navistar’s fiscal year Fiscal Year 2007 1Q07 2Q07 3Q07 4Q07 Full Year 2007 BUS 3,400 4,100 3,200 3,900 14,600 MEDIUM 9,700 6,800 5,600 6,600 28,700 HEAVY 7,000 4,500 2,600 3,300 17,400 SEVERE 3,900 3,300 3,500 3,700 14,400 TOTAL 24,000 18,700 14,900 17,500 75,100 MILITARY (U.S. & Foreign) 600 900 700 1,000 3,200 EXPANSIONARY 9,100 8,700 9,000 8,500 35,300 WORLD WIDE TRUCK 33,700 28,300 24,600 27,000 113,600 Fiscal year 2008 1Q08 2Q08 3Q08 4Q08 Full Year 2008 BUS 3,100 3,300 2,700 4,400 13,500 MEDIUM 3,700 6,300 5,800 4,500 20,300 HEAVY 2,600 3,900 4,500 7,800 18,800 SEVERE 2,400 3,400 3,300 3,700 12,800 TOTAL 11,800 16,900 16,300 20,400 65,400 MILITARY (U.S. & Foreign) 1,600 2,200 2,300 2,600 8,700 EXPANSIONARY 5,900 8,100 8,400 5,700 28,100 WORLD WIDE TRUCK 19,300 27,200 27,000 28,700 102,200 Fiscal year 2009 1Q09 2Q09 3Q09 4Q09 Full Year 2009 BUS 2,700 3,100 3,500 4,500 13,800 MEDIUM 3,200 3,400 2,600 3,800 13,000 HEAVY 6,100 3,200 4,500 5,300 19,100 SEVERE 2,800 2,700 2,800 2,700 11,000 TOTAL 14,800 12,400 13,400 16,300 56,900 MILITARY (U.S. & Foreign) 2,500 2,100 1,200 2,000 7,800 EXPANSIONARY 2,400 1,900 2,400 5,400 12,100 WORLD WIDE TRUCK 19,700 16,400 17,000 23,700 76,800 |
 NYSE: NAV 37 37 World Wide Engine Shipments Navistar 1st Q 2nd Q 3rd Q 4th Q Full Year Ford 60,000 56,200 65,400 53,500 235,100 Other OEM's (All Models) 21,000 26,400 29,100 27,700 104,200 Engine Shipments to Truck Group 23,100 12,100 13,700 16,500 65,400 Total Shipments 104,100 94,700 108,200 97,700 404,700 Navistar 1st Q 2nd Q 3rd Q 4th Q Full Year Ford 47,000 55,300 25,200 24,500 152,000 Other OEM's (All Models) 25,900 31,500 34,100 37,100 128,600 Engine Shipments to Truck Group 12,900 15,700 20,000 16,300 64,900 Total Shipments 85,800 102,500 79,300 77,900 345,500 Navistar 1st Q 2nd Q 3rd Q 4th Q Full Year Ford 14,100 29,000 26,200 44,300 113,600 Other OEM's (All Models) 22,500 22,200 24,600 29,100 98,400 Engine Shipments to Truck Group 14,300 12,700 12,800 17,500 57,300 Total Shipments 50,900 63,900 63,600 90,900 269,300 2008 2007 2009 |
 NYSE: NAV 38 38 Order Receipts – U.S. & Canada Percentage 2009 2008 Change Change 18,300 11,900 6,400 54 15,100 19,400 (4,300) (22) Class 8 heavy trucks 19,900 22,600 (2,700) (12) Class 8 severe service trucks 14,100 23,100 (9,000) (39) 67,400 77,000 (9,600) (12) 34,000 45,700 (11,700) (26) * Includes 3,000 and 9,600 units for the years ended October 31, 2009 and 2008, respectively, related to
U.S. military contracts. Total "Traditional" Markets* Order Receipts: U.S. & Canada (Units) Combined Class 8 (Heavy and Severe Service) "Traditional" Markets School buses Class 6 and 7 medium trucks Year Ended October 31, |
 NYSE: NAV 39 39 Manufacturing Cash Flow ($ in millions) Note: This slide contains non-GAAP information, please see the Reg G in appendix for detailed reconciliation Beginning Mfg. Cash 1 Balance 10/31/2007 10/31/2008 10/31/2009 October 31, 2006 $1,078 October 31, 2007 $716 October 31, 2008 $775 Approximate Cash Flows: From Operations ($231) $404 $514 Dividends from NFC $400 $25 $0 From Investing / (Cap Ex) ($70) ($216) ($282) From Financing / (Debt Paydown) ($480) ($133) $56 Exchange Rate Effect $19 ($21) $9 Blue Diamond Consolidation $0 $0 $80 Ending Mfg. Cash Balance: October 31, 2007 $716 October 31, 2008 $775 October 31, 2009 2 $1,152 1 Cash = Cash and Cash Equivalents 2 Includes Ford's portion of Blue Diamond Cash ($13 million) 1 |
 NYSE: NAV NFC Liquidity Remains Strong • NFC had total available undrawn committed funding of more than $700M at
10/31/2009 - NFC renewed its $650M dealer floor plan financing facility in August, subsequently
reduced to $500M in November with the successful execution of $350M TALF
wholesale funding transaction - NFC refinanced its bank revolver in December • NFC profitability has rebounded in 2009 – Margins improving – Portfolio quality stabilizing for several quarters – Interest rates stabilizing • NFC access to retail securitization markets improved – Over $1.5B in retail notes have been sold and securitized since the subprime issues
began to impact the asset securitization market – Securitization markets show significant improvement due to the support of the U.S.
government’s TALF program – Serviced receivables balances tracking to truck market trough – Truck financing is available for quality credits, especially conquest accounts
Retail Notes Bank Facility • $500 million revolving warehouse (TRIP) – Acquired notes sold into TRIP – TRIP warehouses, then securitizes via bank conduits • TRIP terms – Matures June 2010 On-balance sheet • $815M facility – Initial funding of retail note acquisitions – Also funds dealer/customer open accounts – Matures December 2012 On-balance sheet • Current situation – ~$1,054M funding facility (NFSC) – Available $300M • NFSC terms – Bank conduit portion (VFC) renewed October 2008 – Public portions mature February 2010 and October 2012 Off-balance sheet 40 |
 NYSE: NAV 41 41 Frequently Asked Questions Q1: What should we assume for capital expenditures in 2010? A: For 2010, excluding our NFC and Dealcor acquisition of vehicles for leasing, we expect our capital expenditures to be
below our normal $250 million to $350 million range. We continue to fund our strategic programs. Q2: What is in your Dealcor debt? A: Dealcor debt is comprised of wholesale (floor plan) financing and also retail financing on
lease and rental fleets for company owned dealers. Q3: How many Dealcor dealers did you have as of October 31, 2009? A: Of our 282 primary NAFTA dealers, we have ownership interest in 17 DealCor dealers as of October 31, 2009. Q4: Have you seen any year-over-year steel, precious metals and resin cost increases
in 2009? A: Generally, we have been able to mitigate the effects of steel and other commodity cost
increases from 2007 to 2009 via a combination of design changes, material
substitution, resourcing, global sourcing efforts and pricing performance. In addition, although the terms of supplier contracts and special pricing arrangements
can vary, generally a time lag exists between when our suppliers incur increased costs and when these costs are passed on to us as well as when we might recover them through increased pricing. This time lag can span several quarters
or years, depending on the specific situation. More recent trends indicate
the cost pressures from the majority of our steel and commodity inputs have
not only ceased, but reversed somewhat. However, we have experienced some commodity price increases versus the overall industry decline as our prior actions to avoid the significant price
increases have resulted in temporarily having slightly higher costs than the
industry. The impact of increases related to steel, precious metals, resins and petroleum products totaled approximately $23 million, $97 million and $86 million, for 2009, 2008 and 2007, respectively, as compared to the corresponding prior year.
|
 NYSE: NAV 42 42 Frequently Asked Questions Q5: What do you finance at Navistar Finance Corporation (NFC)? A: NFC is a commercial financing organization that provides wholesale, retail and lease
financing for sales of new and used trucks and buses sold by the company.
NFC also finances the company’s wholesale accounts and selected retail
accounts receivable. Sales of new truck related equipment (including
trailers) of other manufacturers are also financed. Q6: What percentage of truck purchases do you fund? A: We consistently fund about 95% of floor plan inventory for our dealers in the U.S. and
approximately 9% of retail purchases. Q7: When is the next refinancing due at NFC? A: Our TRIP facility, which we use as a warehouse for our retail notes, is due for renewal
in June 2010. Q8: Why did you amend the intercompany agreement? A: We amended the intercompany agreement to allow more flexibility to NFC and Navistar by
allowing NFC to purchase short-term trade receivables that were
previously not included in the agreement or that the TRAC deal did not
permit NFC to purchase. Q9: How do you fund retail notes? A: Retail notes are primarily funded by a bank revolver and a revolving warehouse facility
that we call TRIP, which doesn’t mature until 2010. These notes are ultimately sold to either a conduit facility or into a public securitization. |
 NYSE: NAV 43 43 Frequently Asked Questions Q10: Are there any requirements for NFC leverage? A: NFC is compliant with our revolver leverage covenant of 6 to 1. This ratio calculation
excludes qualified retail and lease securitization debt. Q11: How are your securitization rates determined? A: Portfolio performance, deal structure and market conditions affect pricing, as well as
the type of asset being financed (for example dealer floor plan inventory versus a customer purchase). Q12: What is your funding strategy? A: We use three or four primary funding sources. For longer-term retail truck notes that finance the sale of trucks to end customers, we finance those in the term securitization markets in either
public or private deals. We primarily finance our wholesale portfolio in
traditional private or public securitizations. We also have a combination of
revolving type facilities that often warehouse assets until they can be financed permanently. Q13: How is your NFC portfolio performing? A: The portfolio is performing as we would expect given the industry downturn and
consistent with prior cycles. The provision for credit losses increased from approximately $20 million in FY07 to $32
million in FY08. During FY09, our provision for credit losses dropped to $30 million. Q14: How are your repossessions trending? A: Repossessions were slowing down at the end of FY08, and our rate of repossession has declined throughout FY09. |
 NYSE: NAV 44 44 Frequently Asked Questions Q15: How are your dealers doing? A: We think our dealers, which have always been one of our strengths, are well positioned.
We traditionally have not had any significant dealer losses and expect that
trend to continue in the future. Q16: Are your customer interest rates going to increase? A: Like all lenders, we need to achieve a profitability threshold to ensure our continued
access to capital, and that means pricing our rates in line with the
marketplace. So, yes, as the cost of financing has increased for all companies, we have passed on some of the cost increase to our dealers
and customers. Q17: What kind of rates do you charge your dealers and customers? A: Generally, our rates vary (those with higher credit risk have always had to pay higher
interest rates) and are usually in line with the market. Q18: How do you make your credit decisions? Do you require a certain credit score? A: We factor in a variety of criteria in our credit scoring model such as business model,
company history, down payment, etc. Q19: What is your total amount of capacity at NFC? A: Total availability in our funding facilities is more than $700M as of October 31,
2009. Q20: Are you able to take advantage of any TALF or TARP money? A: Yes, the $350 million transaction we completed in November to support our dealer
inventory financing is eligible for funding under the TALF program.
|
 NYSE: NAV 45 45 Frequently Asked Questions Q21: How does your NFC derivative expense compare to last year? A: Our derivative expense for FY 2009 was $40.6 million, which compares favorably to our
derivative expense of $55.0 million in FY 2008. Q22: How do your repossession percentages compare to the overall size of your portfolios? A: Repossessions as a percent of retail balances were approximately 3.6% for FY09 and 4.5% for FY08. Q23: What is the current JLTV status? A: Navistar and BAE just completed the Critical Design Review (CDR). The CDR was completed
as part of the 27-month JLTV Technology Development (TD) contract
received in October 2008. The CDR marks the completion of the design process
and the start of vehicle integration, assembly, test and checkout
(IAT&C) activities to deliver test vehicles to the government by May 2010. Australia and India have also joined the program and interest has been expressed by Canada, Israel and
Britain. Q24: What changes have occurred in Defense spending due to the increase in troops heading to
Afghanistan? A: According to a Pentagon reprogramming document signed on December 1, the Defense
Department is shifting $2.7 billion from the Mine Resistant Ambush Protected
vehicle fund. Approximately $1.8 billion will go to the MRAP account for
government furnished equipment, engineering change proposals, and initial
logistics support for operating forces in Afghanistan. |
 NYSE: NAV 46 46 Frequently Asked Questions Q25: What is the process now that the Government Accountability Office (GAO) has upheld the
FMTV protests waged by Navistar and BAE? A: The GAO has recommended that the Army re-evaluate Oshkosh under the capability
factor and Navistar under the past performance factor. The Army has 60 days to comply with the GAO’s recommendations. Price and capability are of equal importance in evaluating the FMTV program. Past
performance is the third area for evaluation. Q26: What are the 2010 emissions requirements? A: The rules allow manufacturers to go to 0.5 NOx if they clean up the environment earlier with advanced technology; manufacturers need to be at 0.2 NOx if they choose not to introduce advanced technologies earlier. Q27: How has The American Recovery and Reinvestment Act of 2009 and The Worker, Homeownership, and Business Assistance Act of 2009 affected Navistar? A: Two of the business tax incentives have a direct effect on Navistar: A) The legislation provides for additional depreciation deductions equal to 50% of
the cost of non-real property fixed assets placed in service during
calendar year 2009. B) In lieu of claiming the additional
depreciation deductions described in (A) above, the legislation would allow
Navistar to accelerate the realization of tax credits earned in prior years. Navistar intends to accelerate the realization of tax credits earned in prior
years. The amount expected to be realized is immaterial to the
Company’s financial statements. |
 NYSE: NAV 47 47 Frequently Asked Questions Q28: How will President Obama’s recent tax proposals impact Navistar, if enacted?
A: The President’s proposals will have anti-competitive implications for
multinational companies, such as Navistar. In the near term we would not
anticipate a material adverse impact on our financial statements due to the
fact that we currently have a full valuation allowance against a large portion of our deferred tax assets and are still utilizing U.S. net operating losses.
Over the long term we would anticipate adverse U.S. tax implications for our
international businesses, requiring actions to be taken by Navistar to
address these implications. Certain material proposals impacting multinational corporations include: •Deferral of deductions deemed related to unremitted foreign earnings •Limitations on the use of disregarded entities in foreign jurisdictions •Limitations on foreign tax credits Q29: What makes up our consolidated tax expense? A: Our pre-tax operating profit reflects our worldwide operations, consequently our tax
expense reflects the impact of differing tax positions throughout the world.
In general, we currently have a full valuation allowance against our U.S.
and Canadian operations. Consequently, our tax expense in those jurisdictions is generally limited to current state taxes and alternative minimum
taxes. Our Brazilian and Mexican operations are profitable and as a
result we accrue taxes in those jurisdictions. The confluence
of events causes our overall effective tax rate to be fairly low. |
 NYSE: NAV 48 48 Frequently Asked Questions Q30: Your tax footnote in the 10K discloses gross deferred tax assets of $2.2 billion. How will those assets be used to offset future taxable income? A: The most commonly understood component of deferred tax assets is the value of our net operating losses, which was reported as $268 million as of 10/31/09. We continue to offset
current taxable income by these net operating losses both in the U.S. for
federal and state tax purposes and in Canada and Brazil. In addition,
we have several other major components of deferred taxes which will reduce
taxable income in the future. For example, to date the Company has accrued OPEB, pension and other employee benefit liabilities during prior years. As those payments are
made to employees, the company will realize a deduction against its future
taxable income. Similarly, the Company has accrued significant reserves for warranty and product liability obligations. As
payments are made against those reserves the Company will realize a
deduction against its future taxable income. Q31: How much value of net operating losses remains, and why is there still a valuation allowance against deferred tax assets? A: The Company has approximately $288 million of U.S. federal net operating losses
available to offset future taxable income. Applying a federal tax rate of 35%, these losses have a value of $101 million. In addition the value of our state and foreign NOLs are $82 and $102, respectively, for a total value of $285. (U.S. GAAP rules require an adjustment to these balances for stock option
accounting.) A substantial portion of these NOLs are subject to a valuation allowance. In addition to these deferred tax assets we have other deferred tax assets subject to a valuation allowance of $1,830,
for a total balance of deferred tax assets subject to a valuation
allowance of $2,050. Under U.S. GAAP rules, when the Company is able to
demonstrate sufficient earnings (both historically and in the future) to absorb these future deductions, the Company is able to release these valuation
allowances. |
 NYSE: NAV 49 49 Frequently Asked Questions Q32: What is your expected 2010 pension and OPEB GAAP expense? A: We anticipate 2010 pension and OPEB GAAP expense of $185 million. In 2009, pension
and OPEB GAAP expense was $233 million. Q33: What are your expected 2010 and beyond pension funding requirements? A: Current forecasts indicate that we may need to contribute approximately $153 million in
2010; from 2011 through 2013 the company will be required to contribute at
least $275 million per year to the plans depending on asset performance and
discount rates in the next several years. |
 NYSE: NAV 50 50 SEC Regulation G This presentation is not in accordance with, or an alternative for, U.S. generally accepted accounting principles (GAAP). The non-GAAP financial information presented herein should be considered supplemental to, and not as a substitute for, or superior to, financial measures calculated in accordance with GAAP. However, we believe that non-GAAP reporting, giving effect to the adjustments shown in the reconciliation above, provides meaningful information and therefore we use it to supplement our GAAP reporting by identifying items that may not be related to the core manufacturing business. Management often uses this information to assess and measure the performance of our operating segments. We have chosen to provide this supplemental information to investors, analysts and other interested parties to enable them to perform additional analyses of operating results, to illustrate the results of operations giving effect to the non-GAAP adjustments shown in the
above reconciliations and to provide an additional measure of performance. DEBT YE 2006 YE 2007 YE 2008 YE 2009 (in millions) Manufacturing operations Facilities due 2012 - $ 1,330 $ 1,330 $ - $
8.25% Senior Notes, due 2021, net of unamortized discount of
$37 million at October 31, 2009 - - - 963 3.0% Senior Subordinated Convertibel Notes, due 2014 - - - 570 Debt of majority owned dealership 484 267 157 148 Financing arrangements and capital lease obligations 401 369 306 271 7.5% Senior Notes, due 2011 15 15 15 15 9.95% Senior Notes, due 2011 11 8 6 4 Bridge Loan Facility (Libor + 500) 1,500 - - - 4.75% Subordinated Exchangeable Notes, due 2009 1 1 1 - Other 60 39 19 4 Total manufacturing operations debt 2,472 2,029 1,834 1,975 Financial services operations Asset-backed debt issued by consolidated SPEs, at variable rates, due serially
through 2016 3,104 $ 2,748 $ 2,076 $ 1,227 $ Bank revolvers, at fixed and variable rates, due dates from 2010 through 2015 1,426 1,354 1,370 1,518 Revolving retail warehouse facility, at variable rates, due 2010 500 500 500 500 Commercial Paper, at variable rates, due serially through 2010 28 117 162 52 Borrowing secured by operating and finance leases, at various rate, due serially through
2016 116 133 132 134 Total financial services operations debt 5,174 $ 4,852 $ 4,240 $ 3,431 $ Cash & Cash Equivalents YE 2006 YE 2007 YE 2008 YE 2009 Manufacturing non-GAAP (Unaudited) 1,078 $ 716 $ 775 $ 1,152 $ * Financial Services non-GAAP (Unaudited) 79 61 86 60 Consolidated US GAAP (Audited) 1,157 $ 777 $ 861 $ 1,212 $ Manufacturing Cash & Cash Equivalents non-GAAP (Unaudited) 1,078 $ 716 $ 775 $ 1,152 $ * Manufacturing Marketable Securities non-GAAP (Unaudited) 136 6 2 - Manufacturing Cash, Cash Equivalents & Marketable Securities non-GAAP
(Unaudited) 1,214 $ 722 $ 777 $ 1,152 $ *Includes increase in cash and cash equivalents from consolidating Blue Diamond Truck
and Blue Diamond Parts Audited |
 NYSE: NAV 51 51 SEC Regulation G – Quarterly Comparison 2009 Q4 2008 Q4 Non GAAP Non GAAP As Reported Non GAAP Non GAAP As Reported Without Impacts Impacts With Impacts Without Impacts Impacts With Impacts U.S. and Canada Industry 44,400 63,100 ($billions) Sales and revenues, net 3.3 $ 3.9 $ ($millions) Manufacturing segment profit * (excluding items listed below) 279 $ - $ 279 $ 217 $ - $ 217 $ Ford settlement net of related charges (16) (16) (27) (27) Impairment of property, plant and equipment (31) (31) (358) (358) Manufacturing segment profit 279 (47) 232 217 (385) (168) Below the line items (excluding items listed below) (130) - (130) (137) (137) Write-off of debt issuance cost (11) (11) - Below the line items (130) (11) (141) (137) - (137) Income (loss) excluding income tax 149 (58) 91 80 (385) (305) Income tax benefit (expense) (5) - (5) (39) 1 (38) Net Income (loss) 144 $ (58) $ 86 $ 41 $ (384) $ (343) $ diluted Diluted earnings (loss) per share ($'s) 1.99 $ (0.80) $ 1.19 $ 0.56 $ (5.37) $ (4.81) $ Weighted average shares outstanding: diluted (millions) 72.3 72.3 73.0 71.4 basic * Includes: minority interest in net income of subsidiaries net of tax; extraordinary gain net of
tax 0.57 $ (5.38) $ (4.81) $ 71.4 71.4 This presentation is not in accordance with, or an alternative for, U.S. generally accepted
accounting principles (GAAP). The non-GAAP financial information presented herein should be considered supplemental to, and not as a substitute for, or superior to, financial measures calculated in accordance with GAAP. However,
we believe that non-GAAP reporting, giving effect to the adjustments shown in the reconciliation above, provides meaningful information and therefore we use it to supplement our GAAP reporting by identifying items that
may not be related to the core manufacturing business. Management often uses this information to assess and measure the performance of our operating segments. We have chosen to provide this supplemental information
to investors, analysts and other interested parties to enable them to perform additional analyses of operating results, to illustrate the results of operations giving effect to the non-GAAP adjustments shown in the
above reconciliations and to provide an additional measure of performance. |
 NYSE: NAV 52 52 SEC Regulation G – Fiscal Year Comparison 2009 2008 Non GAAP Non GAAP As Reported Non GAAP Non GAAP As Reported Without Impacts Impacts With Impacts Without Impacts Impacts With Impacts U.S. and Canada Industry 181,800 244,100 ($billions) Sales and revenues, net 11.6 $ 14.7 $ ($millions) Manufacturing segment profit * (excluding items listed below) 707 $ - $ 707 $ 1,088 $ - $ 1,088 $ Ford settlement net of related charges 160 160 (37) (37) Impairment of property, plant and equipment (31) (31) (358) (358) Manufacturing segment profit 707 129 836 1,088 (395) 693 Below the line items (excluding items listed below) (468) (468) (502) (502) Write-off of debt issuance cost (11) (11) - Below the line items (468) (11) (479) (502) - (502) Income (loss) excluding income tax 239 118 357 586 (395) 191 Income tax benefit (expense) (34) (3) (37) (58) 1 (57) Net Income (loss) 205 $ 115 $ 320 $ 528 $ (394) $ 134 $ Diluted earnings (loss) per share ($'s) 2.86 $ 1.60 $ 4.46 $ 7.21 $ (5.39) $ 1.82 $ Weighted average shares outstanding: diluted (millions) 71.8 71.8 73.2 73.2 * Includes: minority interest in net income of subsidiaries net of tax; extraordinary gain net of tax
This presentation is not in accordance with, or an alternative for, U.S. generally accepted
accounting principles (GAAP). The non-GAAP financial information presented herein should be considered supplemental to, and not as a substitute for, or superior to, financial measures calculated in accordance with
GAAP. However, we believe that non-GAAP reporting, giving effect to the adjustments shown in the reconciliation above, provides meaningful information and therefore we use it to supplement our GAAP reporting by identifying
items that may not be related to the core manufacturing business. Management often uses this information to assess and measure the performance of our operating segments. We have chosen to provide this supplemental
information to investors, analysts and other interested parties to enable them to perform additional analyses of operating results, to illustrate the results of operations giving effect to the non-GAAP
adjustments shown in the above reconciliations and to provide an additional measure of performance. |