Attached files
| file | filename |
|---|---|
| 8-K - FORM 8-K - PIPER SANDLER COMPANIES | c55189e8vk.htm |
| EX-2.1 - EX-2.1 - PIPER SANDLER COMPANIES | c55189exv2w1.htm |
| EX-99.1 - EX-99.1 - PIPER SANDLER COMPANIES | c55189exv99w1.htm |
Exhibit
99.2

| PIPER JAFFRAY COMPANIES DECEMBER 21, 2009 |
| 2 CAUTION REGARDING FORWARD-LOOKING STATEMENTS Statements contained in this presentation may contain forward-looking statements. Statements that are not historical or current facts, including statements about beliefs and expectations, are forward- looking statements and are subject to significant risks and uncertainties that are difficult to predict. These forward-looking statements cover, among other things, the future prospects of Piper Jaffray Companies and its asset management business and management's expectations regarding earnings accretion, pre-tax margin, return on equity, the compensation ratio, assets under management, firm capital levels, the scale necessary to support organic growth in asset management, and the extent to which the combination will mitigate volatility in Piper Jaffray's overall business. Forward-looking statements involve inherent risks and uncertainties, and important factors could cause actual results to differ materially from those anticipated, including the following: (1) the transaction announced in this press release may not be completed, or completed within the expected timeframe; (2) financing for the transaction may be obtained on terms that are less favorable that initially anticipated, increasing the cost of the transaction; (3) costs or difficulties relating to the combination of the businesses may be greater than expected and may adversely affect our results of operations and financial condition; (4) the expected benefits of the transaction, including earnings accretion, margin improvement, return on equity improvement, compensation ratio improvement, achieving scale sufficient to support organic growth in asset management, and the mitigation of volatility in Piper Jaffray's overall business, may take longer than anticipated to achieve and may not be achieved in their entirety or at all; (5) revenues from the asset management business may vary based on investment performance and market and economic factors; (6) developments in market and economic conditions have in the past adversely affected, and may in the future adversely affect, the business and profitability of Piper Jaffray; (7) Piper Jaffray may not be able to compete successfully with other companies in the financial services industry; and (8) other factors identified under "Risk Factors" in Part I, Item 1A of our Annual Report on Form 10-K for the year ended December 31, 2008 and "Management's Discussion and Analysis of Financial Condition and Results of Operations" in Part II, Item 7 of our Annual Report on Form 10-K for the year ended December 31, 2008, and updated in our subsequent reports filed with the SEC (available at our Web site at www.piperjaffray.com and at the SEC Web site at www.sec.gov). Forward-looking statements speak only as of the date they are made, and readers are cautioned not to place undue reliance on them. We undertake no obligation to update them in light of new information or future events. |
| 3 TRANSACTION OVERVIEW Chicago-based asset management firm $5.5 billion in AUM mainly in equity strategies $218 million in consideration, payable at closing $178 million in cash and $40 million in restricted stock Expected to close in the first quarter of 2010 Subject to customary regulatory approvals and client consents Piper Jaffray will purchase Advisory Research, Inc. |
| 4 STRATEGIC RATIONALE Diversifies revenues to mitigate volatility in current capital markets-centric business model Builds asset management to sufficient scale and adds talent to support future growth Attractive financial attributes for Piper Jaffray shareholders Complementary to FAMCO In the long term, better positioned to meet client needs with broad product array and deep distribution |
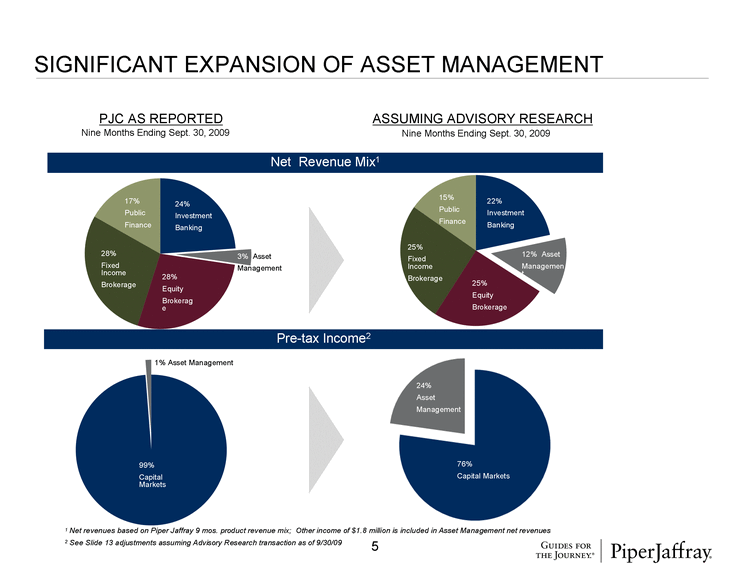
| SIGNIFICANT EXPANSION OF ASSET MANAGEMENT 17% 28% Net Revenue Mix1 Pre-tax Income2 PJC AS REPORTED ASSUMING ADVISORY RESEARCH 24% Investment Banking 17% Public Finance 28% Fixed Income Brokerage 28% Equity Brokerag e 3% Asset Management 15% Public Finance 22% Investment Banking 25% Fixed Income Brokerage 25% Equity Brokerage 12% Asset Managemen t 24% Asset Management 76% Capital Markets 99% Capital Markets Nine Months Ending Sept. 30, 2009 Nine Months Ending Sept. 30, 2009 1% Asset Management 1 Net revenues based on Piper Jaffray 9 mos. product revenue mix; Other income of $1.8 million is included in Asset Management net revenues 2 See Slide 13 adjustments assuming Advisory Research transaction as of 9/30/09 5 |
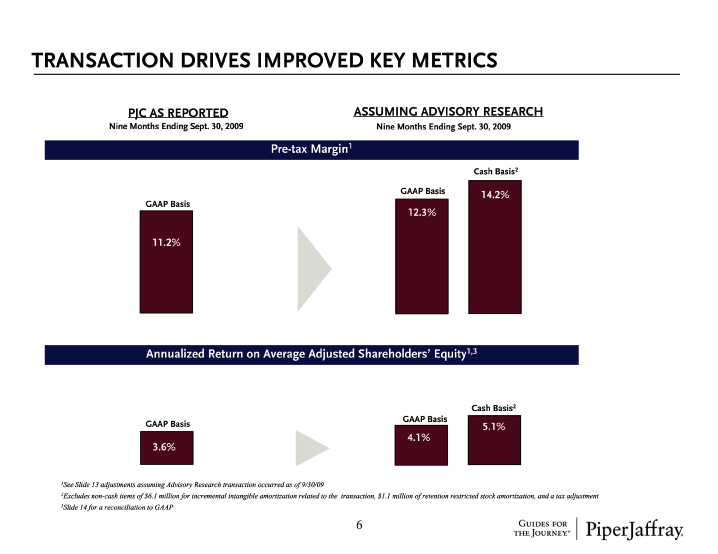
| TRANSACTION DRIVES IMPROVED KEY METRICS 17% 24% 28% PJC AS REPORTED ASSUMING ADVISORY RESEARCH Pre-tax Margin1 Annualized Return on Average Adjusted Shareholders' Equity1,3 17% 24% Nine Months Ending Sept. 30, 2009 Nine Months Ending Sept. 30, 2009 GAAP Basis Cash Basis2 GAAP Basis Cash Basis2 1See Slide 13 adjustments assuming Advisory Research transaction occurred as of 9/30/09 2Excludes non-cash items of $6.1 million for incremental intangible amortization related to the transaction, $1.1 million of retention restricted stock amortization, and a tax adjustment 3Slide 14 for a reconciliation to GAAP GAAP Basis GAAP Basis 5.1% 6 |
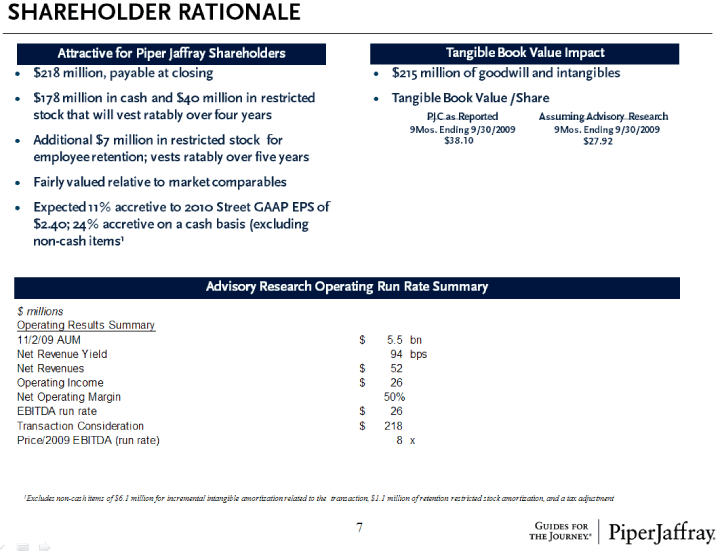
| 7 SHAREHOLDER RATIONALE Advisory Research Operating Run Rate Summary $218 million, payable at closing $178 million in cash and $40 million in restricted stock that will vest ratably over four years Additional $7 million in restricted stock for employee retention; vests ratably over five years Fairly valued relative to market comparables Expected 11% accretive to 2010 Street GAAP EPS of $2.40; 24% accretive on a cash basis (excluding non-cash items1 Attractive for Piper Jaffray Shareholders Tangible Book Value Impact $215 million of goodwill and intangibles Tangible Book Value /Share PJC as Reported Assuming Advisory Research $38.10 $27.92 1Excludes non-cash items of $6.1 million for incremental intangible amortization related to the transaction, $1.1 million of retention restricted stock amortization, and a tax adjustment 9Mos. Ending 9/30/2009 9Mos. Ending 9/30/2009 |
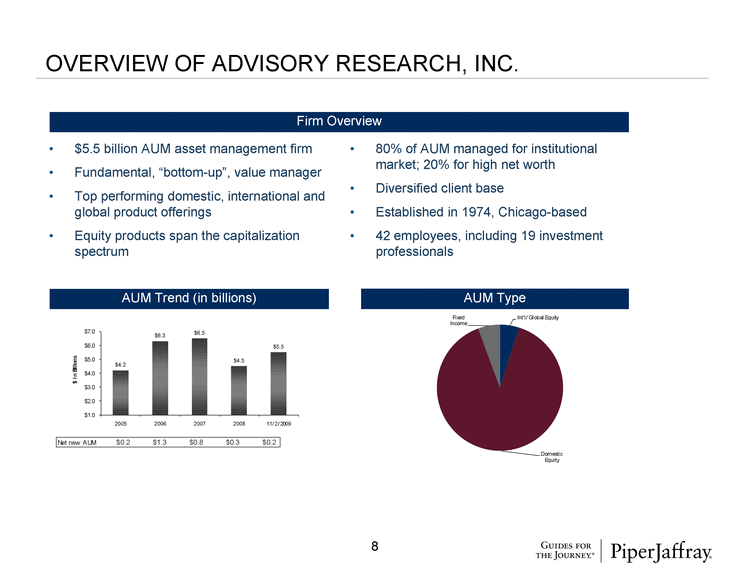
| 8 OVERVIEW OF ADVISORY RESEARCH, INC. $5.5 billion AUM asset management firm Fundamental, "bottom-up", value manager Top performing domestic, international and global product offerings Equity products span the capitalization spectrum AUM Trend (in billions) Firm Overview AUM Type 80% of AUM managed for institutional market; 20% for high net worth Diversified client base Established in 1974, Chicago-based 42 employees, including 19 investment professionals |
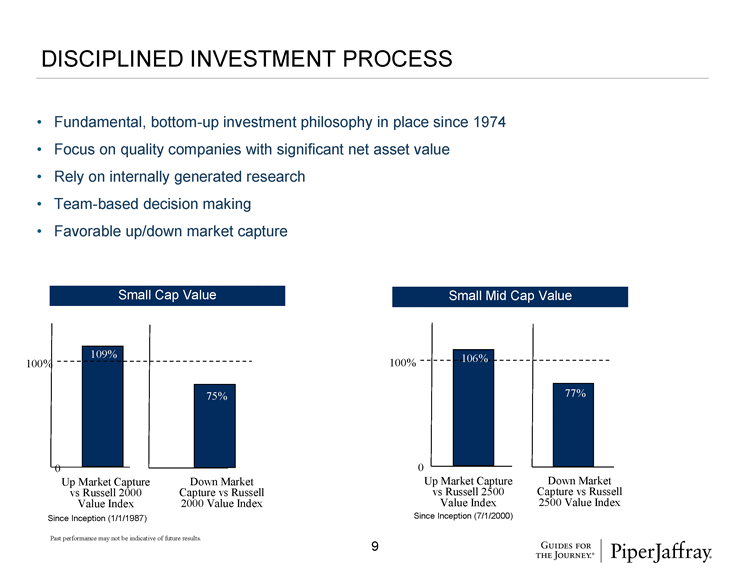
| 9 DISCIPLINED INVESTMENT PROCESS Fundamental, bottom-up investment philosophy in place since 1974 Focus on quality companies with significant net asset value Rely on internally generated research Team-based decision making Favorable up/down market capture Small Cap Value Since Inception (1/1/1987) Small Mid Cap Value 0 100% 106% 77% Up Market Capture vs Russell 2500 Value Index Down Market Capture vs Russell 2500 Value Index Since Inception (7/1/2000) 100% 109% 75% 0 Up Market Capture vs Russell 2000 Value Index Down Market Capture vs Russell 2000 Value Index Past performance may not be indicative of future results. |
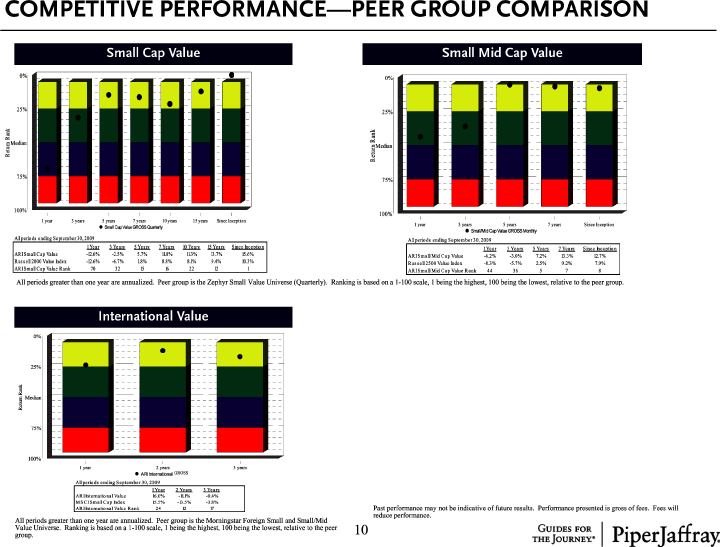
| 10 COMPETITIVE PERFORMANCE-PEER GROUP COMPARISON Small Cap Value Small Mid Cap Value International Value All periods greater than one year are annualized. Peer group is the Zephyr Small Value Universe (Quarterly). Ranking is based on a 1-100 scale, 1 being the highest, 100 being the lowest, relative to the peer group. All periods greater than one year are annualized. Peer group is the Morningstar Foreign Small and Small/Mid Value Universe. Ranking is based on a 1-100 scale, 1 being the highest, 100 being the lowest, relative to the peer group. Past performance may not be indicative of future results. Performance presented is gross of fees. Fees will reduce performance. GROSS |
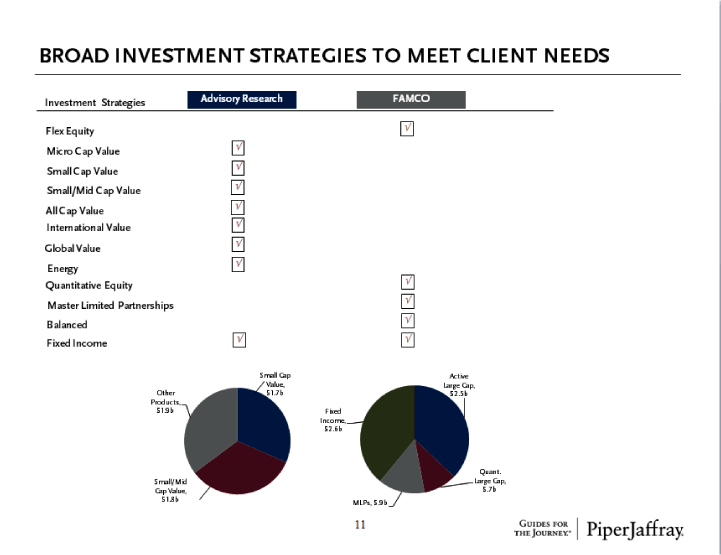
| 11 BROAD INVESTMENT STRATEGIES TO MEET CLIENT NEEDS Advisory Research FAMCO Investment Strategies Micro Cap Value Small Cap Value Small/Mid Cap Value International Value Master Limited Partnerships Balanced Flex Equity ^ ^ ^ ^ ^ ^ ^ ^ ^ ^ Fixed Income ^ All Cap Value Global Value Energy ^ Quantitative Equity ^ |
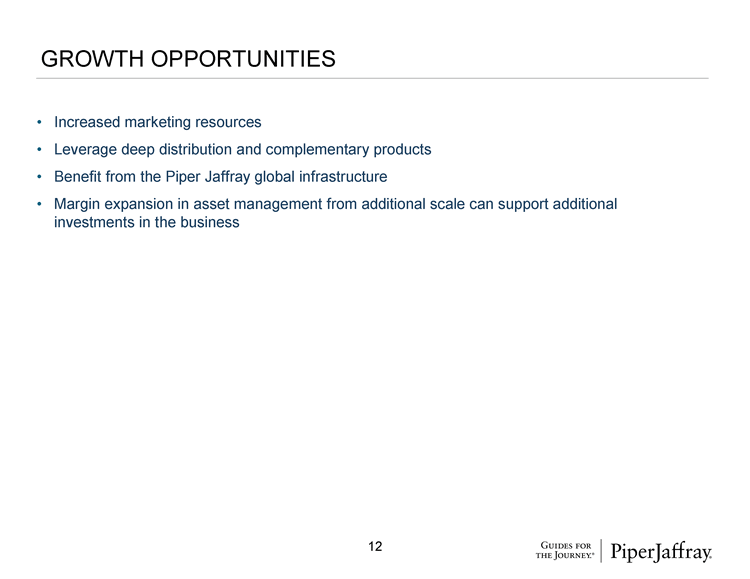
| GROWTH OPPORTUNITIES 12 Increased marketing resources Leverage deep distribution and complementary products Benefit from the Piper Jaffray global infrastructure Margin expansion in asset management from additional scale can support additional investments in the business |
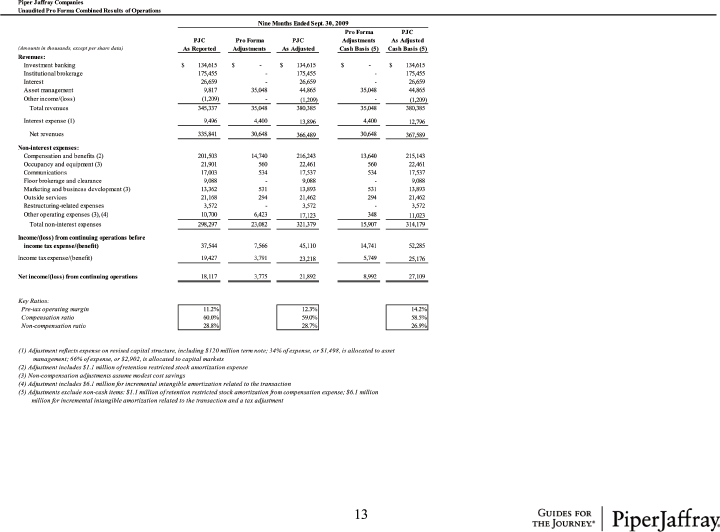
| Piper Jaffray Companies Unaudited Pro Forma Combined Results of Operations Pro Forma PJC PJC Pro Forma PJC Adjustments As Adjusted (Amounts in thousands, except per share data) As Reported Adjustments As Adjusted Cash Basis (5) Cash Basis (5) Revenues: Investment banking 134,615 $ — $134,615 $ — $134,615 $ Institutional brokerage 175,455 — 175,455 — 175,455 Interest 26,659 — 26,659 — 26,659 Nine Months Ended Sept. 30, 2009 Asset management 9,817 35,048 44,865 35,048 44,865 Other income/(loss) (1,209) — (1,209) — (1,209) Total revenues 345,337 35,048 380,385 35,048 380,385 Interest expense (1) 9,496 4,400 13,896 4,400 12,796 Net revenues 335,841 30,648 366,489 30,648 367,589 Non-interest expenses: Compensation and benefits (2) 201,503 14,740 216,243 13,640 215,143 O d i t (3) 21 901 560 22 461 560 22 461 Occupancy and equipment 21,901 22,461 22,461 Communications 17,003 534 17,537 534 17,537 Floor brokerage and clearance 9,088 — 9,088 — 9,088 Marketing and business development (3) 13,362 531 13,893 531 13,893 Outside services 21,168 294 21,462 294 21,462 Restructuring-related expenses 3,572 — 3,572 — 3,572 Other operating expenses (3), (4) 10,700 6,423 17,123 348 11,023 Total non-interest expenses 298,297 23,082 321,379 15,907 314,179 Income/(loss) from continuing operations before ( ) g p income tax expense/(benefit) 37,544 7,566 45,110 14,741 52,285 Income tax expense/(benefit) 19,427 3,791 23,218 5,749 25,176 Net income/(loss) from continuing operations 18,117 3,775 21,892 8,992 27,109 Key Ratios: Pre-tax operating margin 11.2% 12.3% 14.2% Compensation ratio 60 0% 59 0% 58 5% 60.0% 59.0% 58.5% Non-compensation ratio 28.8% 28.7% 26.9% (1) Adjustment reflects expense on revised capital structure, including $120 million term note; 34% of expense, or $1,498, is allocated to asset management; 66% of expense, or $2,902, is allocated to capital markets (2) Adjustment includes $1.1 million of retention restricted stock amortization expense (3) Non-compensation adjustments assume modest cost savings (4) Adjustment includes $6.1 million for incremental intangible amortization related to the transaction ( 5) Adjustments exclude non-cash items: 1.1 million of retention restricted stock amortization from compensation expense; $6.1 million ) j $ f f p p ;$ million for incremental intangible amortization related to the transaction and a tax adjustment 13 |
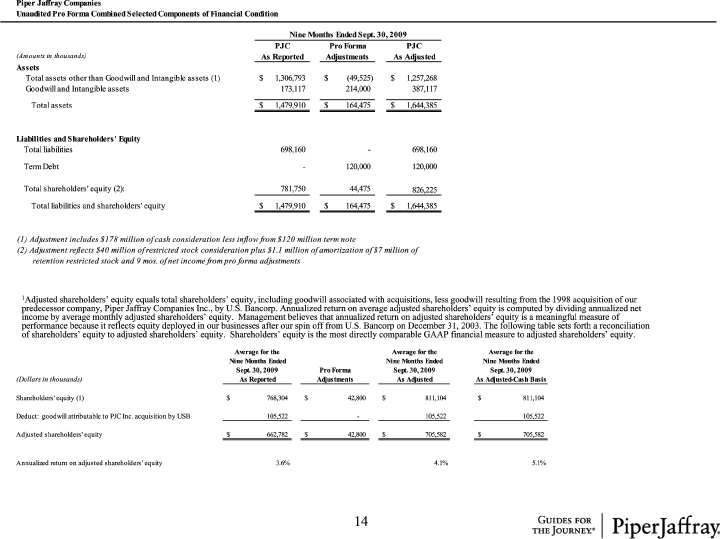
| Piper Jaffray Companies UnauditedPro Forma CombinedSelectedComponents Unaudited Pro Combined Selected Components of Financial Condition PJC Pro Forma PJC (Amounts in thousands) As Reported Adjustments As Adjusted Assets Total assets other than Goodwill and Intangible assets (1) 1,306,793 $ (49,525) $1,257,268 $ Goodwill and Intangible assets 173,117 214,000 387,117 Nine Months Ended Sept. 30, 2009 g Total assets 1,479,910 $164,475 $1,644,385 $ Liabilities and Shareholders’ Equity Total liabilities 698,160 — 698,160 Term Debt — 120,000 120,000 , , Total shareholders’ equity (2): 781,750 44,475 826,225 Total liabilities and shareholders’ equity 1,479,910 $164,475 $1,644,385 $ (1) Adjustment includes $178 million of cash consideration less inflow from $120 million term note (Ad fl $40 ll f d k d l $1 1 ll f f $7 ll f 1Adjusted shareholders’ equity equals total shareholders’ equity, including goodwill associated with acquisitions, less goodwill resulting from the 1998 acquisition of our predecessor company, Piper Jaffray Companies Inc., by U.S. Bancorp. Annualized return on average adjusted shareholders' equity is computed by dividing annualized net income by average monthly adjusted shareholders' equity. Management believes that annualized return on adjusted shareholders' equity is a meaningful measure of performance because it reflects equity deployed in our businesses after our spin off from U.S. Bancorp on December 31, 2003. The following table sets forth a reconciliation of shareholders' equity to adjusted shareholders' equity. Shareholders' equity is the most directly comparable GAAP financial measure to adjusted shareholders' equity. 2) Adjustment reflects million of restricted stock consideration plus 1.1 million of amortization of million of retention restricted stock and 9 mos. of net income from pro forma adjustments performance because it reflects equity deployed in our businesses after our spin off from U.S. Bancorp on December 31, 2003. The following table sets forth a reconciliation of shareholders’ equity to adjusted shareholders’ equity. Shareholders’ equity is the most directly comparable GAAP financial measure to adjusted shareholders’ equity. Average for the Average for the Average for the Nine Months Ended Nine Months Ended Nine Months Ended Sept. 30, 2009 Pro Forma Sept. 30, 2009 Sept. 30, 2009 (Dollars in thousands) As Reported Adjustments As Adjusted As Adjusted-Cash Basis Shareholders’ equity (1) 768,304 $42,800 $811,104 $811,104 $ q y( ) Deduct: goodwill attributable to PJC Inc. acquisition by USB 105,522 — 105,522 105,522 Adjusted shareholders’ equity 662,782 $42,800 $705,582 $705,582 $ Annualized return on adjusted shareholders’ equity 3.6% 4.1% 5.1% 14 |
