Attached files
Table of Contents
UNITED STATES
SECURITIES AND EXCHANGE COMMISSION
Washington, D.C. 20549
FORM 10-K/A
Amendment No. 2
| x | ANNUAL REPORT PURSUANT TO SECTION 13 OR 15(d) OF THE SECURITIES EXCHANGE ACT OF 1934 |
| For the fiscal year ended December 31, 2008 |
or
| ¨ | TRANSITION REPORT PURSUANT TO SECTION 13 OR 15(d) OF THE SECURITIES EXCHANGE ACT OF 1934 |
| For the transition period from to |
Commission file number 1-13270
FLOTEK INDUSTRIES, INC.
(Exact name of registrant as specified in its charter)
| Delaware | 90-0023731 | |
| (State or other jurisdiction of incorporation or organization) |
(I.R.S. Employer Identification No.) | |
| 2930 W. Sam Houston Parkway N. #300 | 77043 | |
| (Address of principal executive offices) | (Zip Code) | |
Registrant’s telephone number, including area code (713) 849-9911
Securities registered pursuant to Section 12(b) of the Act:
| Title of each class | Name of each exchange of which registered | |
| Common Stock, $0.0001 par value | New York Stock Exchange, Inc. | |
| 5.25% Convertible Senior Notes | New York Stock Exchange, Inc. | |
| Due 2028 and guarantees | ||
Indicate by check mark if the registrant is a well-known seasoned issuer, as defined in Rule 405 of the Securities Act. Yes ¨ No x
Indicate by check mark if the registrant is not required to file reports pursuant to Section 13 or Section 15(d) of the Act. Yes ¨ No x
Indicate by check mark whether the registrant (1) has filed all reports required to be filed by Section 13 or 15(d) of the Securities Exchange Act of 1934 during the preceding 12 months (or for such shorter period that the registrant was required to file such reports), and (2) has been subject to such filing requirements for the past 90 days. Yes x No ¨
Indicate by check mark whether the registrant has submitted electronically and posted on its corporate Web site, if any, every Interactive Data File required to be submitted and posted pursuant to Rule 405 of Regulation S-T (§232.405 of this chapter) during the preceding 12 months (or for such shorter period that the registrant was required to submit and post such files). Yes ¨ No ¨
Indicate by check mark if disclosure of delinquent filers pursuant to Item 405 of Regulation S-K (§229.405 of this chapter) is not contained herein, and will not be contained, to the best of the registrant’s knowledge, in definitive proxy or information statements incorporated by reference in Part III of this Form 10-K or any amendment to this Form 10-K. ¨
Indicate by check mark whether the registrant is a large accelerated filer, an accelerated filer, a non-accelerated filer, or a smaller reporting company. See the definitions of “large accelerated filer,” “accelerated filer” and “smaller reporting company” in Rule 12b-2 of the Exchange Act. (Check one):
Large accelerated filer ¨ Accelerated filer x
Non-accelerated filer ¨ (Do not check if a smaller reporting company) Smaller reporting company ¨
Indicate by check mark whether the registrant is a shell company (as defined in Rule 12b-2 of the Exchange Act). Yes ¨ No x
The aggregate market value of voting stock held by non-affiliates of the registrant as of June 30, 2008 (based on the closing market price on the Composite Tape on June 30, 2008) was approximately $377,900,000 (determined by subtracting the number of shares held by affiliates of Flotek Industries, Inc. on that date from the total number of shares outstanding on that date). At February 11, 2009, there were 23,179,894 outstanding shares of Flotek Industries, Inc. Common Stock, $0.0001 par value.
DOCUMENTS INCORPORATED BY REFERENCE
Portions of the Registrant’s Proxy Statement for its 2009 annual meeting of shareholders have been incorporated by reference into Part III of this Form 10-K.
Table of Contents
EXPLANATORY NOTE
Flotek Industries, Inc. filed an Annual Report on Form 10-K with the Securities and Exchange Commission (the “SEC”) on March 16, 2009 for the fiscal year ended December 31, 2008 (the “Original Filing”) and an amendment to its Original Filing on November 23, 2009 (the “Form 10-K/A”). This Amendment No. 2 amends the Original Filing and the Form 10-K/A, and is being filed to reflect changes made in response to comments received by us from the staff of the SEC (the “Staff”) in connection with the Staff’s review of our Original Filing and Form 10-K/A.
The only changes to our Original Filing are in Item 6 “Selected Financial Data,” Item 7 “Management’s Discussion and Analysis of Financial Condition and Results of Operations,” Item 8 “Financial Statements and Supplementary Data,” Item 9A “Controls and Procedures” and Item 15 “Exhibits and Financial Statement Schedules.”
In Items 6, 7 and 8, we have provided the updated financial information contained in our Current Report on Form 8-K filed on August 26, 2009. This financial information was updated to reflect certain required accounting adjustments.
In Item 9A we have revised our disclosure to more clearly present the conclusions of our principal executive, principal financial and principal accounting officers regarding the effectiveness of our disclosure controls and procedures as of December 31, 2008, based on their evaluation of those controls and procedures.
In Item 15 we have included dates on the Section 906 certifications, as such dates were inadvertently omitted in the Original Filing, and updated our list of exhibits. Pursuant to the rules of the SEC, currently dated certifications from our principal executive and principal financial officer, as required by Sections 302 and 906 of the Sarbanes-Oxley Act of 2002, are filed or furnished herewith, as applicable.
The remainder of the Original Filing is unchanged and is reproduced in this Amendment No. 2. This Amendment No. 2 speaks as of the filing date of the Original Filing and does not reflect events occurring after the filing date of the Original Filing, or modify or update the disclosures therein in any way other than as required to reflect the amendments described above.
Table of Contents
i
Table of Contents
FORWARD-LOOKING STATEMENTS
We have included or incorporated by reference in this Annual Report on Form 10-K, and from time to time our management may make statements that may constitute “forward-looking statements” within the meaning of the safe harbor provisions of the Private Securities Litigation Reform Act of 1995. Forward-looking statements are not historical facts but instead represent only our current belief regarding future events, many of which, by their nature, are inherently uncertain and outside our control. The forward-looking statements contained in this Annual Report are based on information as of the date of this Annual Report. Many of these forward looking statements relate to future industry trends, actions, future performance or results of current and anticipated initiatives and the outcome of contingencies and other uncertainties that may have a significant impact on our business, future operating results and liquidity. We try, whenever possible, to identify these statements by using words such as “anticipate,” “believe,” “should,” “estimate,” “expect,” “plan,” “project” and similar expressions. We caution you that these statements are only predictions and are not guarantees of future performance. These forward-looking statements and our actual results, developments and business are subject to certain risks and uncertainties that could cause actual results and events to differ materially from those anticipated by these statements. By identifying these statements for you in this manner, we are alerting you to the possibility that our actual results may differ, possibly materially, from the anticipated results indicated in these forward-looking statements. Important factors that could cause actual results to differ from those in the forward-looking statements include, among others, those discussed under “Risk Factors” in Part I, Item 1A and “Management’s Discussion and Analysis of Financial Condition and Results of Operations” in Part II, Item 7 and elsewhere in this Annual Report on Form 10-K.
ii
Table of Contents
| Item 1. | Business. |
General
Flotek Industries, Inc. is a diversified global supplier of drilling and production related products and services to the oil and gas industry. In 2008, we sold $226.1 million of products and services to customers through our three business segments: Chemicals and Logistics, Drilling Products and Artificial Lift. Our core focus is oilfield specialty chemicals and logistics, downhole drilling tools and downhole production tools. Flotek offers its products primarily through its sales organizations, as well as through independent distributors and agents. Flotek was founded in 1985 and is headquartered in Houston, Texas. On December 27, 2007, our common stock began trading on the New York Stock Exchange (“NYSE”) under the stock ticker symbol “FTK”. Prior to this date and since July 27, 2005, our common stock was traded on the American Stock Exchange (“AMEX”) under the stock ticker symbol “FTK”. Prior to this date, our common stock was traded on the OTC Bulletin Board under the stock ticker symbol “FLTK” or “FLTK.OB”. Our website is located at http://www.flotekind.com. We make available free of charge on or through our internet website our Annual Reports on Form 10-K, quarterly reports on Form 10-Q, current reports on Form 8-K, and amendments to those reports filed or furnished pursuant to Section 13(a) or 15(d) of the Exchange Act as soon as reasonably practicable after electronically filing such material with, or furnishing it to, the Securities and Exchange Commission (“SEC”). Information contained in our website or links contained on our website are not part of this filing. As used herein, “Flotek,” “Company,” “we,” “our” and “us” may refer to Flotek Industries, Inc. and/or its subsidiaries. The use of these terms is not intended to connote any particular corporate status or relationships. Additional information regarding our business segments is presented below and in Management’s Discussion and Analysis of Financial Condition and Results of Operations in Item 7 (“MD&A”) and in Note 17 of the Notes to our Consolidated Financial Statements in Item 8 (“Note 17”). We sold approximately $208 million, $150 million and $94 million of products and services in the United States for the years ended December 31, 2008, 2007 and 2006, respectively. The remainder of our sales are generated internationally in approximately 20 countries and accounted for approximately 8%, 5% and 7% of our consolidated revenues for each of the last three years, respectively. No single country outside of the United States accounted for more than 10% of our total revenues in any of the past three years.
Historical Developments
Flotek was originally incorporated under the laws of the Province of British Columbia on May 17, 1985. On October 23, 2001, we approved a change in our corporate domicile to the state of Delaware and a reverse stock split of 120 to 1. On October 31, 2001, we completed a reverse merger with CESI Chemical, Inc. (“CESI”). Since that date, we have grown through a series of acquisitions.
Description of Operations
Our business is organized into three strategic business units or segments: Chemicals and Logistics, Drilling Products and Artificial Lift. Each segment is managed independently, offers various products and services and requires different technology and marketing strategies. All three segments market products domestically and internationally.
Chemicals and Logistics
The chemical business offers a full spectrum of oil gas field specialty chemicals used for drilling, cementing, stimulation, and production designed to maximize recovery from both new and mature fields. Our specialty chemicals, with enhanced performance characteristics are manufactured to withstand a wide range of downhole pressures, temperatures and other well-specific conditions, are key to the success of this business segment. We operate two laboratories, a technical services laboratory and a research and development laboratory, which focus
1
Table of Contents
on design, development and testing of new chemical formulations and enhancement of existing products, often in cooperation with our customers.
Our logistics business designs, project manages and operates automated bulk material handling and loading facilities for oilfield service companies. These bulk facilities handle oilfield products, including sand and other materials for well-fracturing operations, dry cement and additives for oil and gas well cementing, and supplies and materials used in oilfield operations, which we blend to customer specification.
During the periods covered by this report, we consummated the following transactions related to this business segment and have included it in the results of this segment from the date of acquisition:
| • | acquired Sooner Energy Services, Inc. (“Sooner”) which develops, produces and distributes specialty chemical products and services for drilling and production of natural gas, on August 31, 2007. |
Annual revenues for this segment totaled approximately $109 million, $86 million and $51 million in 2008, 2007 and 2006, respectively. Our proprietary biodegradable “green” chemicals sales amounted to $77 million, $56 million and $26 million for the years ended December 31, 2008, 2007 and 2006, respectively. These sales increased 37% in 2008 from the 2007 period and 115% in 2007 from the 2006 period.
Drilling Products
We are a leading provider of downhole drilling tools used in the oilfield, mining, water-well and industrial drilling sectors. We manufacture, sell, rent and inspect specialized equipment for use in drilling, completion, production and workover activities. Through internal growth and acquisitions, we have increased the size and breadth of our rental tool inventory and geographic scope of operations so that we now conduct tool rental operations throughout the United States and in select international markets. Our rental tools include stabilizers, drill collars, reamers, wipers, jars, shock subs, wireless survey, measurement while drilling (“MWD”) tools and mud-motors, while equipment sold includes centralizers and drill bits. We focus our product marketing efforts primarily in the Gulf of Mexico, Mid-Continent and Rocky Mountain regions of the United States, with international sales currently conducted through third party agents and employees.
During the periods covered by this report, we consummated the following transactions related to this business segment and have included them in the results of this segment from their respective dates of acquisition:
| • | acquired the assets of Can-Ok Oil Field Services, Inc. and Stabilizer Technology, Inc. (collectively “Can-Ok”), a downhole oilfield tool company located in Chickasha, Oklahoma on January 2, 2006, |
| • | acquired the assets of Triumph Drilling Tools (“Triumph”), a downhole tool company with rental, inspection and manufacturing operations throughout the Gulf Coast and Mid-Continent regions, on January 4, 2007, |
| • | acquired a 50% partnership interest in CAVO Drilling Motors Ltd Co. (“CAVO”) on January 31, 2007, a downhole mud-motor company with domestic rental and international sales operations and acquired the remaining 50% partnership interest in CAVO on November 15, 2007, and |
| • | acquired the assets of Teledrift Inc. (“Teledrift”), which designs and manufactures wireless survey and MWD tools, on February 14, 2008. |
Annual revenues for this segment totaled approximately $98 million, $57 million and $37 million in 2008, 2007 and 2006, respectively.
In 2008, we introduced the Teleshot, an all electronic wire-line drift indicator, that is capable of taking multiple surveys per run and incorporates the ability to download quickly the information. We provide the Teleshot to our
2
Table of Contents
customers through direct sales or on a rental basis. The TelePulse fully steerable MWD system, featuring proprietary state-of-the-art surface software, is expected to be completed with all field-testing and released for production in the second half of 2009. The Telepulse will offer a positive pulse system with a gamma sensor module that will allow directional drilling companies to maintain integrity of their technical requirements. Additionally, we intend to combine our rental efforts with the CAVO downhole motor in order to provide us with an opportunity to increase our presence in the offshore market both domestically and internationally.
Artificial Lift
We provide pumping system components, including electric submersible pumps, or ESPs, gas separators, production valves and services. Our products address the needs of coal bed methane and traditional oil and gas production to efficiently move gas, oil and other fluids from the producing horizon to the surface. Several of our artificial lift products employ unique technologies to improve well performance. Our patented Petrovalve product optimizes pumping efficiency in horizontal completions, heavy oil and wells with high gas to liquids ratios. This unique valve can be placed horizontally, results in increased flow per stroke, and eliminates gas locking by replacing the traditional ball and seat valve that requires more maintenance. Furthermore, our patented gas separation technology is particularly applicable for coal bed methane production as it efficiently separates gas and water downhole, ensuring solution gas is not lost in water production. Because gas is separated downhole, it reduces the environmental impact of escaped gas at the surface. The majority of our products for Artificial Lift are manufactured in China, assembled domestically and distributed globally.
During the periods covered by this report, we consummated the following transactions related to this business segment and have included them in the results of this segment from their respective dates of acquisition:
| • | acquired the tangible assets and licensed the rights to exercise the exclusive worldwide rights to a patented gas separator used in coal bed methane production in the Powder River Basin from Total Well Solutions, LLC. (“TWS”) on April 3, 2006 and |
| • | acquired the assets of LifTech, LLC (“LifTech”) which markets and services electric submersible pumps and downhole gas/water separators primarily to coal bed methane gas producers in the Powder River Basin on June 6, 2006. |
Annual revenues for this segment totaled approximately $18 million, $15 million and $13 million in 2008, 2007 and 2006, respectively.
Seasonality
On an overall basis, our operations are not generally affected by seasonality. Certain working capital components may build and recede during the year reflecting established selling cycles and business cycles can impact our operations and financial position when compared to other periods, but we do not consider our operations to be highly-seasonal. Additionally, weather and natural phenomena can temporarily affect the performance of our services. Examples of how such phenomena can impact our business include:
| • | the severity and duration of the winter in North America can have a significant impact on gas storage levels and drilling activity for natural gas; |
| • | the timing and duration of the spring thaw in Canada directly affects activity levels due to road restrictions; |
| • | hurricanes can disrupt coastal and offshore operations. |
In addition, historically due to higher spending near the end of the year by our customers, the results of operations of the Chemical and Logistics segment are generally stronger in the fourth quarter of the year than at
3
Table of Contents
the beginning of the year. Also, historically the results of operations of our Artificial Lift segment are generally weaker in the second quarter due to restrictions on drilling on federal lands because of the breeding season of certain bird species.
Product Demand and Marketing
The demand for our products and services is generally correlated to the level of oil and gas drilling activity, work-over activity and gas production levels, both in the United States and internationally. We market our products primarily through direct sales to our customers through sales employees with the assistance of operations and Company management. We have established customer relationships which provide for repeat sales in all of our segments. The majority of our marketing is currently conducted within the United States. Internationally, we operate primarily through agents in Canada, Mexico, Central and South America, the Middle East, Asia and Russia.
Customers
The customers for our products and services include major integrated oil and natural gas companies, independent oil and natural gas companies, pressure pumping service companies and state-owned national oil companies. One of our customers accounted for 12% of our consolidated revenues for each of the years ended December 31, 2008 and 2007. No single customer accounted for more than 10% of our consolidated revenues in the year ended December 31, 2006. Our top five customers accounted for 34% of our consolidated revenues for each of the years ended December 31, 2008 and 2007 and 30% of consolidated revenue for the year ended December 31, 2006.
The majority of the sales to our top five customers were in the Chemicals and Logistics segment and collectively accounted for approximately 63%, 52% and 47% of revenue for this segment for the years ended December 31, 2008, 2007 and 2006, respectively. Our top three customers accounted for 25%, 15% and 12% of the segment’s revenue for the year ended December 31, 2008, respectively. In 2007, these companies accounted for 21%, 14% and 10% of segment revenue, respectively, while in fiscal 2006 these companies accounted for 11%, 15% and 14% of segment revenue, respectively.
Two of our top customers also make purchases for another one of our top customers as part of their normal business operations. We cannot quantify the magnitude of purchases made by one of our customers on behalf of another entity. While these three customers are not under common control nor are they affiliates of each other or Flotek, combined they accounted for 40%, 38% and 28% of segment revenue for the years ended December 31, 2008, 2007 and 2006 respectively. A loss of this combined customer group would negatively impact the Company’s operating results.
One customer, accounted for 56%, 53% and 43% of the Artificial Lift segment revenue for the years ended December 31, 2008, 2007 and 2006, respectively.
None of these customers were a related party or affiliate of Flotek during any of the years ended December 31, 2008, 2007 or 2006.
Research and Development
We are engaged in research and development activities directed primarily toward the improvement of existing products and services, the design of specialized products to meet customer needs and the development of new products, processes and services. We incurred $1.9 million, $0.8 million and $0.7 million in research and development expenses for the years ended December 31, 2008, 2007 and 2006, respectively. In 2008, our research and development spending was approximately 1% of consolidated revenues. It is our intention to maintain Flotek’s future research and development investment at approximately 1% of consolidated revenues.
4
Table of Contents
Backlog
Due to the nature of our business and contracts with our customers, we do not experience any significant amount of backlog orders.
Intellectual Property
We have followed a policy of seeking patent protection both within and outside the United States for products and methods that appear to have commercial significance and qualify for patent protection. The decision to seek patent protection depends on whether such protection can be obtained on a cost-effective basis and is likely to be effective in protecting our commercial interests. We believe our patents and trademarks, together with our trade secrets and proprietary design, manufacturing and operational expertise, are reasonably adequate to protect our intellectual property and provide for the continued operation of our business. We maintain patents on our production valve design, casing centralizer design, and trade secrets and pending patents on certain specialty chemicals.
Competition
Our ability to compete in the oilfield services market is dependent on our ability to differentiate our products and services, provide superior quality and service, and maintain a competitive cost structure. Activity levels in our three segments are driven primarily by current and expected commodity prices, drilling rig count, oil and gas production levels, and customer capital spending allocated for drilling and production. The regions in which we operate are highly competitive. The competitive environment has intensified as recent mergers among oil and gas companies have reduced the number of available customers. Additionally, the recent downturn in the economy and commodity prices have caused the market for our services and that of our competitors, which may vary significantly by geographical region, to contract. Many other oil and gas service companies are larger than we are and have greater resources than we have. These competitors may be better able to withstand industry downturns, compete on the basis of price and acquire new equipment and technologies, all of which could affect our revenue and profitability. These competitors compete with us both for customers and for acquisitions of other businesses. This competition may cause our business to suffer. We believe that competition for contracts and margins will continue to be intense in the foreseeable future.
Raw Materials
The Company believes that materials and components used in its servicing and manufacturing operations and purchased for sales are generally available on the open market and from multiple sources, although collection and transportation of these raw materials to the Company’s facilities can be adversely affected by extreme weather conditions. However, certain raw materials used by the Chemical and Logistics segment in the manufacture of our proprietary, ‘green’ chemical sales are available from limited sources and disruptions to our suppliers could materially impact our sales. The prices paid by the Company for its raw materials may be affected by, among other things, energy, steel and other commodity prices; tariffs and duties on imported materials; foreign currency exchange rates; the general business cycle and global demand. The Company experienced greater difficulty in securing the necessary supplies of certain chemicals in 2008 than it experienced during the preceding several years. During 2008, the prices of many raw materials rose considerably above our forecast, but we began to see prices decline towards the end of 2008. Higher prices and lower availability of chemicals, steel and other raw materials the Company uses in its business may adversely impact future period sales and margins. The Drilling Products and Artificial Lift segments purchase their principal raw material and steel on the open market. Except for a few chemical additives, the raw materials are available in most cases from several suppliers at market prices. Where we can, we use multiple suppliers, both domestically and internationally, for our key raw materials purchases.
5
Table of Contents
We also maintain a three to six month supply of key mud-motor inventory parts that are primarily sourced from China as well as an equivalent amount of stock of parts within our Artificial Lift segment. This inventory stock position approximates the lead time required to secure these parts in order to avoid disruption of service to our customers.
Government Regulations
We are subject to federal, state and local environmental and occupational safety and health laws and regulations in the United States and other countries in which we do business. We are subject to numerous environmental, legal, and regulatory requirements related to our operations worldwide. We strive to comply fully with these requirements and are not aware of any material instances of noncompliance. In the United States, these laws and regulations include, among others:
| • | the Comprehensive Environmental Response, Compensation and Liability Act; |
| • | the Resource Conservation and Recovery Act; |
| • | the Clean Air Act; |
| • | the Federal Water Pollution Control Act; and |
| • | the Toxic Substances Control Act. |
In addition to the federal laws and regulations, states and other countries where we do business may have numerous environmental, legal, and regulatory requirements by which we must abide. We evaluate and address the environmental impact of our operations by assessing and remediating contaminated properties in order to avoid future liabilities and comply with environmental, legal, and regulatory requirements. Many of the products within our Chemicals and Logistics segment are considered hazardous or flammable. If a leak or spill occurs in connection with our operations, we could incur material costs, net of insurance, to remediate any resulting contamination. On occasion, we are involved in specific environmental litigation and claims, including the remediation of properties we own or have operated, as well as efforts to meet or correct compliance-related matters. We do not expect costs related to these remediation requirements to have a material adverse effect on our consolidated financial position or our results of operations.
Employees
As of January 30, 2009, we had approximately 500 employees worldwide, with approximately 15 employed as part-time workers. None of our employees are covered by collective bargaining agreements and our labor relations are generally good. In certain international locations, changes in staffing or work arrangements may need approval of local works councils or other bodies.
Available Information
We maintain a web site at www.flotekind.com. We make available, free of charge, on the “Investor Relations” section of our web site, our annual reports on Form 10-K, quarterly reports on Form 10-Q, current reports on Form 8-K and amendments to those reports filed or furnished pursuant to Section 13(a) or 15(d) of the Exchange Act, as soon as reasonably practicable after we electronically file or furnish such materials to the SEC. Additionally, our corporate governance materials, including governance guidelines; the charters of the Audit, Compensation, and Governance and Nominating Committees; and the code of conduct may also be found under the “Investor Relations” section of our web site at www.flotekind.com. A copy of the foregoing corporate governance materials is available upon written request.
You may read and copy any materials we file with the SEC at the SEC’s Public Reference Room at 100 F Street NE, Washington, DC 20549. You may obtain information regarding the Public Reference Room by calling the
6
Table of Contents
SEC at 1-800-SEC-0330. In addition, the SEC maintains an internet website at www.sec.gov that contains reports and other information regarding registrants that file electronically with the SEC, including us.
We submitted our 2008 annual Section 12(a) CEO certification with the New York Stock Exchange (“NYSE”) on March 16, 2009. The certification was not qualified in any respect. Additionally, we filed with this Form 10-K the CEO and CFO certifications required under Sections 302 and 906 of the Sarbanes-Oxley Act of 2002.
Information with respect to our executive officers and directors is incorporated herein by reference to information included in the Proxy Statement for our 2008 Annual Meeting of Shareholders.
7
Table of Contents
| Item 1A. | Risk Factors. |
This document, our other filings with the SEC, and other materials released to the public contain “forward-looking statements,” as defined in the Private Securities Litigation Reform Act of 1995. These forward-looking statements may discuss our prospects, expected revenue, expenses and profits, strategies for our operations and other subjects, including conditions in the oilfield service and oil and natural gas industries and in the United States and international economy in general.
Our forward-looking statements are based on assumptions that we believe to be reasonable but that may not prove to be accurate. All of our forward-looking information is, therefore, subject to risks and uncertainties that could cause actual results to differ materially from the results expected. Although it is not possible to identify all factors, these risks and uncertainties include the risk factors discussed below.
Risks Related to Our Business
Demand for the majority of our services is substantially dependent on the levels of expenditures by the oil and gas industry. Current global economic conditions have resulted in a significant decline and volatility in oil and gas prices. If current global economic conditions and the availability of credit worsen or continue for an extended period, this could reduce our customers’ levels of expenditures and have a significant adverse effect on our revenue, margins and overall operating results.
The current global credit and economic environment has reduced worldwide demand for energy and resulted in significantly lower crude oil and natural gas prices. A substantial or extended decline in oil and natural gas prices can reduce our customers’ activities and their spending on our services and products. Demand for the majority of our services substantially depends on the level of expenditures by the oil and gas industry for the exploration, development and production of crude oil and natural gas reserves. These expenditures are sensitive to oil and natural gas prices and generally dependent on the industry’s view of future oil and gas prices. As the worldwide deterioration in the financial and credit markets has deepened in recent months, demand for oil and gas has reduced dramatically and oil and gas prices have fallen sharply, causing some of our customers to start to reduce or delay their oil and gas exploration and production spending. This has started to reduce the demand for our services and has begun to exert downward pressure on the prices that we charge. If economic conditions continue to deteriorate or do not improve, it could result in further reductions of exploration and production expenditures by our customers, causing further declines in the demand for our services and products. This could result in a significant adverse effect on our operating results. Furthermore, it is difficult to predict how long the economic downturn will continue, to what extent it will worsen, and to what extent this will continue to affect us.
The reduction in cash flows being experienced by our customers resulting from declines in commodity prices, together with the reduced availability of credit and increased costs of borrowing due to the tightening of the credit markets, could have significant adverse effects on the financial condition of some of our customers. This could result in project modifications, delays or cancellations, general business disruptions, and delay in, or nonpayment of, amounts that are owed to us, which could have a significant adverse effect on our results of operations and cash flows. Additionally, our suppliers could be negatively impacted by current global economic conditions. If certain of our suppliers were to experience significant cash flow issues or become insolvent as a result of such conditions, it could result in a reduction or interruption in supplies or a significant increase in the price of supplies, and adversely impact our results of operations and cash flows.
The prices for oil and natural gas are subject to a variety of additional factors, including:
| • | demand for energy, which is affected by worldwide population growth, economic development and general economic and business conditions; |
8
Table of Contents
| • | the ability of the Organization of Petroleum Exporting Countries (“OPEC”) to set and maintain production levels for oil; |
| • | oil and gas production by non-OPEC countries; |
| • | availability and quantity of natural gas storage; |
| • | LNG import volume and pricing; |
| • | pipeline capacity to key markets; |
| • | political and economic uncertainty and socio-political unrest; |
| • | the level of worldwide oil exploration and production activity; |
| • | the cost of exploring for, producing and delivering oil and gas; |
| • | technological advances affecting energy consumption; and |
| • | weather conditions. |
Our business depends primarily on domestic spending by the oil and gas industry, and this spending and our business may be adversely affected by industry conditions or by new or increased government regulations that are beyond our control.
We depend primarily on our customers’ willingness to make operating and capital expenditures to explore for, develop and produce oil and gas in the United States. Customers’ expectations for lower market prices for oil and gas may curtail spending thereby reducing demand for our products and services. Industry conditions in the United States are influenced by numerous factors over which we have no control, such as the supply of and demand for oil and gas, domestic and international economic conditions, political instability in oil and gas producing countries and merger and divestiture activity among oil and gas producers. The volatility of the oil and gas industry and the consequent effect on exploration and production activity could adversely affect the level of drilling and production activity by some of our customers. One indication of drilling and production activity and spending is rig count, which the company monitors to gauge market conditions. This reduction in exploration may cause a decline in the demand for, or adversely affect the price of, our products and services. Reduced discovery rates of new oil and gas reserves in our market areas could also have a negative long-term impact on our business, even in an environment of stronger oil and gas prices, to the extent existing production is not replaced or the number of drilling and producing wells declines because of substantial depletion of existing domestic reserves or the availability of cheaper reserves outside the United States. In addition, domestic demand for oil and gas may be uniquely affected by public attitudes regarding drilling in environmentally sensitive areas, vehicle emissions and other environmental standards, alternative fuels, taxation of oil and gas and “excess profits” of oil and gas companies, and the potential changes in governmental regulation and policy that may result from such public attitudes.
We may not be able to generate sufficient cash flows, to meet our debt service obligations or other liquidity needs, and we may not be able to successfully negotiate waivers or a new credit agreement to cure any covenant violations under our current credit agreements.
Due to an extensive capital expenditure program in 2006, we exceeded the indebtedness covenant, fixed charge coverage ratio and capital expenditures limit set forth in our senior credit facility. In 2006, we obtained waivers of those covenants from our principal lender. In February 2008, we amended the terms of our senior credit facility to permit us to issue up to $150 million in convertible senior notes and incur additional capital expenditures. The amended facility includes new financial covenants requiring us to maintain a minimum net worth and not to exceed a maximum senior leverage ratio. These amendments also increased the interest rates under the facility, increased our quarterly principal payments pursuant to our term loan and will require us to
9
Table of Contents
make mandatory prepayments of our term loan facility in specified circumstances, including if the appraised value of our fixed assets falls below specified levels.
The Company evaluated its goodwill and other intangibles assets in the fourth quarter of 2008, and recorded an impairment of $67.7 million. As a result, we did not meet the Minimum Net Worth covenant contained within our credit agreement as of December 31, 2008. On February 25, 2009, we entered into a First Amendment and Temporary Waiver Agreement (the "Amendment") with our lenders, which amended the terms of our credit agreement dated as of March 31, 2008 (the "New Credit Agreement"). The Amendment, among other things, increased the interest rate margins applicable to advances under the New Credit Agreement, decreased the aggregate revolving commitment under the New Credit Agreement to $15.0 million, and provides a temporary waiver of any breach by Flotek of the Minimum Net Worth covenant in the New Credit Agreement through the earlier of May 15, 2009 or the occurrence of certain other specified events. The Amendment also permits the Company to exchange shares of its common stock for up to $40.0 million of our Convertible Senior Notes.
Our financial projections for 2009 indicated that we could potentially be in non-compliance with the Leverage Ratio, Minimum Net Worth and Fixed Charge Coverage Ratio Covenants contained within our New Credit Agreement during 2009. Due to all of these factors, we negotiated a Second Amendment, dated March 13, 2009 (the “Second Amendment”) to our New Credit Agreement with our lenders. The Second Amendment changes the manner in which our borrowing base is computed increases our interest rate and fees associated with borrowings under the New Credit Agreement, limits our permitted maximum capital expenditures to $8.0 million and $11.0 million for 2009 and 2010, respectively and established new covenants related to the Minimum Net Worth, Leverage and Fixed Charge Coverage Ratios.
Our ability to generate sufficient cash flows from operations to make scheduled payments or mandatory prepayments on our current debt obligations and other future debt obligations we may incur will depend on our future financial performance, which may be affected by a range of economic, competitive, regulatory and industry factors, many of which are beyond our control. In addition, we may be required under generally accepted accounting principles to record further impairment charges in the future relating to the carrying value of our goodwill and intangible assets. If as a result of our financial performance or future impairment charges we exceed the amended maximum leverage ratio, fail to meet the required amended minimum net worth, exceed the amended maximum senior leverage ratio or are unable to generate sufficient cash flows or otherwise obtain the funds required to make principal and interest payments on our indebtedness, we may have to seek waivers of these covenants from our lenders or undertake alternative financing plans, such as refinancing or restructuring our debt, selling assets, reducing or delaying capital expenditures or seeking to raise additional capital through the issuance of debt securities or other securities. We cannot assure you that we will be able to obtain any required waivers from our lenders or that we will be able to accomplish any necessary refinancing, sale of assets or issuance of securities on terms that are acceptable. Our inability to obtain any required waivers, to generate sufficient cash flows to satisfy such obligations, or to refinance our obligations on commercially reasonable terms, would have an adverse effect on our business, financial condition and results of operations.
The tightening of the credit markets or a downgrade in our credit ratings could increase our borrowing costs and make it more difficult for us to access funds, to refinance our existing indebtedness, to enter into agreements for new indebtedness or to obtain funding through the issuance of securities. If such conditions were to persist, we would seek alternative sources of liquidity but may not be able to meet our obligations as they become due.
Our principal source of liquidity, other than cash flows from operations, is the revolving line of credit under our amended senior credit facility. The borrowing base under our revolving line of credit is based on our accounts receivable and inventory. If our revenues and inventory decrease as a result of the current economic environment or otherwise, our borrowing capacity under our revolving line of credit could decrease, and such decreases could require us to repay excess borrowings under the revolving line. Any such decreases could also outpace any offsetting reductions in our working capital requirements, which could lead to reduced liquidity. While we believe that our cash flows from operations and amounts available under our new revolving line of credit are
10
Table of Contents
sufficient to meet our obligations in the near term, our needs for cash may exceed the levels generated from operations and available to us under our revolving line of credit due to factors which are beyond our control.
Our New Credit Agreement, as amended by the Second Amendment also contains representations, warranties, fees, affirmative and negative covenants, and default provisions. A breach of any of these covenants could result in a default under our credit agreement. Upon the occurrence of an event of default under our credit agreement, the lenders could elect to declare all amounts outstanding to be immediately due and payable and terminate all commitments to extend further credit. If the lenders accelerate the repayment of borrowings, we may not have sufficient assets to repay our revolving credit agreement and our other indebtedness. Also, should there be an event of default, or need to obtain waivers following an event of default, we may be subject to higher borrowing costs and/or more restrictive covenants in future periods. Acceleration of any obligation under any of our material debt instruments will permit the holders of our other material debt to accelerate their obligations. See “Liquidity and Capital Resources” included in “Management’s Discussion and Analysis of Financial Condition and Results of Operations” in Part II, Item 7.
Our senior credit facility contains certain covenants that could limit our flexibility and prevent us from taking certain actions, which could adversely affect our ability to execute our business strategy.
Our senior credit facility, as amended includes a number of significant restrictive covenants. These covenants could adversely affect us by limiting our ability to plan for or react to market conditions, meet our capital needs and execute our business strategy. The senior credit facility contains covenants that, among other things, limit our ability, without the consent of the lender, to:
| • | incur certain types and amounts of additional debt; |
| • | consolidate, merge or sell our assets or materially change the nature of our business; |
| • | pay dividends on capital stock and make restricted payments; |
| • | make voluntary prepayments, or materially amend the terms, of subordinated debt; |
| • | enter into certain types of transactions with affiliates; |
| • | make certain investments; |
| • | level of capital expenditures; |
| • | make certain capital expenditures; and |
| • | incur certain liens. |
These covenants may restrict our operating and financial flexibility and limit our ability to respond to changes in our business or competitive activities. Our senior credit facility also requires us to maintain certain financial ratios and satisfy certain financial conditions, several of which may require us to reduce our debt or take some other action in order to comply with the covenants. If we fail to comply with these covenants, we could be in default. In the event of a default, our lender or the holders of our Convertible Senior Notes could elect to declare all the amounts borrowed and due to them, together with accrued and unpaid interest, to be due and payable. In addition, the lender could elect to terminate its commitment to us, and we or one or more of our subsidiaries could be forced into liquidation or bankruptcy. Any of the foregoing consequences could restrict our ability to execute our business strategy.
Our future success and profitability may be adversely affected if we or our suppliers fail to develop and introduce new and innovative products and services that appeal to our customers.
The oil and gas drilling industry is characterized by continual technological developments that have resulted in, and likely will continue to result in, substantial improvements in the scope and quality of oilfield chemicals,
11
Table of Contents
drilling and artificial lift products and services and product function and performance. As a result, our future success depends, in part, upon our and our suppliers’ continued ability to develop and introduce new and innovative products and services beyond our micro-emulsion surfactant line to address the increasingly sophisticated needs of our customers and anticipate and respond to technological and industry advances in the oil and gas drilling industry in a timely manner. If we or our suppliers fail to successfully develop and introduce new and innovative products and services that appeal to our customers, or if new market entrants or our competitors offer such products and services, our revenue and profitability may suffer.
We intend to pursue strategic acquisitions, which could have an adverse impact on our business.
Our business strategy includes growing our business through strategic acquisitions of complementary businesses as our capital structure permits. Acquisitions that we have made or that we may make in the future may entail a number of risks that could adversely affect our business and results of operations. The process of negotiating potential acquisitions or integrating newly acquired businesses into our business could divert our management’s attention from other business concerns and could be expensive and time consuming. Acquisitions could expose our business to unforeseen liabilities or risks associated with entering new markets or businesses. Consequently, we might not be successful in integrating our acquisitions into our existing operations, which may result in unforeseen operational difficulties or diminished financial performance or require a disproportionate amount of our management’s attention and resources. Even if we are successful in integrating our acquisitions into our existing operations, we may not derive the benefits, such as operational or administrative synergies, that we expect from such acquisitions, which may result in the commitment of capital resources without the anticipated returns on such capital. In addition, we may not be able to continue to identify attractive acquisition opportunities or successfully acquire identified targets. Competition for acquisition opportunities may escalate, increasing our cost of making further acquisitions or causing us to refrain from making additional acquisitions. We also must meet certain financial covenants in order to borrow money under our senior credit facility, as amended, to fund future acquisitions and to borrow for other purposes which, if not met, could prevent us from making future acquisitions. Recent changes in accounting literature that govern how companies account for acquisitions may make new acquisitions more costly and/or have an immediate adverse impact on our profitability, potentially resulting in our consummating few acquisitions.
If we do not manage the potential difficulties associated with expansion successfully, our operating results could be adversely affected.
We have grown over the last several years through internal growth and strategic acquisitions of other businesses and assets. We believe our future success depends in part on our ability to manage the growth we have experienced. The following factors could present difficulties to our business going forward:
| • | lack of sufficient experienced management personnel; |
| • | increased administrative burdens; |
| • | customer retention; |
| • | technology obsolescence and |
| • | increased infrastructure, technological, communication and logistical problems common to large, expansive operations. |
If we do not manage these potential difficulties successfully, our operating results could be adversely affected. In addition, we may have difficulties managing the increased costs associated with our growth, which could adversely affect our operating margins.
Our ability to grow and compete in the future will be adversely affected if adequate capital is not available.
The ability of our business to grow and compete depends on the availability of adequate capital, which in turn depends in large part on our cash flow from operations and the availability of equity and debt financing. We
12
Table of Contents
cannot assure you that our cash flow from operations will be sufficient or that we will be able to obtain equity or debt financing on acceptable terms or at all to implement our growth strategy. For example, our senior credit facility, as amended, restricts our ability to incur additional indebtedness and requires us to meet certain financial covenants in order to borrow money, including borrowings to fund future acquisitions, a key component of our growth strategy. As a result, we cannot assure you that adequate capital will be available to finance our current growth plans, take advantage of business opportunities or respond to competitive pressures, any of which could harm our business.
Our current insurance policies may not be adequate to protect our business from all potential risks.
Our operations are subject to hazards inherent in the oil and gas industry, such as, but not limited to, accidents, blowouts, explosions, fires, severe weather, oil and chemical spills and other hazards. These conditions can cause personal injury or loss of life, damage to property, equipment and the environment, and suspension of oil and gas operations of our customers. Litigation arising from a catastrophic occurrence at a location where our equipment, products or services are being used may result in our being named as a defendant in lawsuits asserting large claims. We maintain insurance coverage that we believe to be customary in the industry against these hazards. However, we do not have insurance against all foreseeable risks, either because insurance is not available or because of the high premium costs. In addition, we may not be able to maintain adequate insurance in the future at rates we consider reasonable. As a result, losses and liabilities arising from uninsured or underinsured events could have a material adverse effect on our business, financial condition and results of operations.
We are subject to complex foreign, federal, state and local environmental, health and safety laws and regulations, which expose us to costs and liabilities that could have a material adverse effect on our business, financial condition and results of operations.
Our operations are subject to foreign, federal, state and local laws and regulations relating to, among other things, the protection of natural resources and the environment, health and safety, waste management and transportation of waste and other materials. Our operations, including our Chemicals and Logistics segment, which involves chemical manufacturing, packaging, handling and delivery operations, pose risks of environmental liability that could result in fines and penalties, expenditures for remediation, and liability for property damage and personal injuries. In order to conduct our operations in compliance with these laws and regulations, we must obtain and maintain permits, approvals and certificates from various foreign, federal, state and local governmental authorities. Sanctions for noncompliance with such laws and regulations may include assessment of administrative, civil and criminal penalties, revocation of permits and issuance of corrective action orders. We may incur substantial costs in order to maintain compliance with these existing laws and regulations. Laws protecting the environment generally have become more stringent over time and are expected to continue to do so, which could lead to material increases in costs for future environmental compliance and remediation. In addition, our costs of compliance may increase if existing laws and regulations are amended or reinterpreted. Such amendments or reinterpretations of existing laws or regulations or the adoption of new laws or regulations could curtail exploratory or developmental drilling for and production of oil and gas which, in turn, could limit demand for our products and services. Some environmental laws and regulations may also impose joint and strict liability, which means that in some situations we could be exposed to liability as a result of our conduct that was lawful at the time it occurred or conduct of, or conditions caused by, prior operators or other third parties. Clean-up costs and other damages arising as a result of such laws and regulations could be substantial and have a material adverse effect on our financial condition and results of operations.
If we are unable to adequately protect our intellectual property rights or are found to infringe intellectual property rights of others our business is likely to be adversely affected.
We rely on a combination of patents, trademarks, non-disclosure agreements and other security measures to establish and protect our intellectual property rights. Although we believe that those measures are reasonably adequate to protect our intellectual property and provide for the continued operation of our business, there can be
13
Table of Contents
no assurance that the measures we have taken or may take in the future will prevent misappropriation of our proprietary information or provide us with a competitive advantage, or that others will not independently develop similar products or services, design around our proprietary or patented technology or duplicate our products or services. Moreover, there can be no assurance that these protections will be available in all cases or will be adequate to prevent our competitors from copying, reverse engineering or otherwise obtaining and using our technology, proprietary rights or products. We have not sought foreign protection corresponding to all of our US intellectual property rights. Consequently, we may not be able to enforce all of our intellectual property rights outside of the United States. Furthermore, the laws of certain countries in which our products are manufactured or marketed may not protect our proprietary rights to the same extent as the laws of the United States. Third parties may seek to challenge, invalidate or circumvent our patents, trademarks, copyrights and trade secrets. In each case, our ability to compete could be significantly impaired.
In addition, some of our products are not protected by issued patents. The issuance of a patent does not guarantee that it is valid or enforceable, so even if we obtain patents, they may not be valid or enforceable against third parties. The issuance of a patent does not guarantee that we have the right to practice the patented invention. Third parties may have blocking patents that could be used to prevent us from marketing our own patented product and practicing our own patented technology.
We have from time to time received, and may in the future receive, communications alleging possible infringement of patents and other intellectual property rights of others. Furthermore, we have in the past, and may in the future, become involved in costly litigation or proceedings brought against us regarding patents or other intellectual property rights. If any such claims are asserted against us, we may seek to obtain a license under the third party’s intellectual property rights. We cannot assure you that we will be able to obtain all of the necessary licenses on satisfactory terms, if at all. In the event that we cannot obtain a license, these parties may file lawsuits against us seeking damages (potentially including treble damages) or an injunction against the sale of our products that incorporate allegedly infringed intellectual property or against the operation of our business as presently conducted, which could result in our having to stop the sale of some of our products, increase the costs of selling some of our products, or cause damage to our reputation. The award of damages, including material royalty payments, or the entry of an injunction against the manufacture and sale of some or all of our products, could have a material adverse effect on our results of operations and ability to compete.
We and our customers are subject to risks associated with doing business outside of the United States which may expose us to political risk, foreign exchange risk and other uncertainties.
During the years ended December 31, 2008, 2007 and 2006, approximately 8%, 5% and 7%, respectively, of our consolidated revenues were derived from the sale of products for use outside of the United States. Accordingly, we and our customers are subject to certain risks inherent in doing business outside of the United States, including:
| • | governmental instability, |
| • | war and other international conflicts, |
| • | civil and labor disturbances, |
| • | requirements of local ownership, |
| • | partial or total expropriation or nationalization, |
| • | currency devaluation, and |
| • | foreign exchange control and foreign laws and policies, each of which may limit the movement of assets or funds or result in the deprivation of contract rights or the taking of property without fair compensation. |
14
Table of Contents
Collections and recovery of rental tools from international customers and agents may also prove more difficult due to the uncertainties of foreign law and judicial procedure. We may therefore experience significant difficulty resulting from the political or judicial climate in countries in which we operate or in which our products are used.
Our international operations must also comply with the Foreign Corrupt Practices Act and other applicable United States laws, and we could be liable under these laws for actions taken by our employees or agents. In addition, from time to time, the United States has passed laws and imposed regulations prohibiting or restricting trade with certain nations, and the United States government could change these laws or enact new laws that could restrict or prohibit us from doing business in certain foreign countries.
Although most of our international revenue is derived from transactions denominated in United States dollars, we have conducted and likely will continue to conduct some business in currencies other than the United States dollar. We currently do not hedge against foreign currency fluctuations. Accordingly, our profitability could be affected by fluctuations in foreign exchange rates. We have no assurance that future laws and regulations will not materially adversely affect our international business.
The loss of certain key customers could have a material adverse effect on our results of operation and could result in a decline in our revenue.
We are dependent on a few major customers. Five customers accounted for approximately 34%, 34% and 30% of our consolidated revenue for the years ended December 31, 2008, 2007 and 2006, respectively. Two of these customers accounted for approximately 18%, 18% and 13% of our consolidated revenue and 37%, 32% and 26% of our Chemicals and Logistics segment revenue for the years ended December 31, 2008, 2007 and 2006, respectively. Our customer relationships are typically governed by purchase orders or other short-term contracts rather than long-term contracts. The loss of one or more of our key customers could have a material adverse effect on our results of operations and could result in a decline in our revenue.
The loss of certain key suppliers, our inability to secure raw materials on a timely basis, or our inability to pass commodity price increases on to our customers could have a material adverse effect on our ability to service our customer’s needs and could result in a loss of customers.
The Company believes that materials and components used in its servicing and manufacturing operations and purchased for sales are generally available on the open market and from multiple sources. Collection and transportation of these raw materials to the Company’s facilities can be adversely affected by extreme weather conditions. However, certain raw materials used by the Chemical and Logistics segment in the manufacture of our proprietary, ‘green’ chemical sales are available from limited sources and disruptions to our suppliers could materially impact our sales. The prices paid by the Company for its raw materials may be affected by, among other things, energy, steel and other commodity prices; tariffs and duties on imported materials; foreign currency exchange rates; the general business cycle and global demand. The Company experienced greater difficulty in securing the necessary supplies of certain chemicals in 2008 than it had experienced during the preceding several years due to the production capacity of our suppliers and weather related events. These specific events had minimal impact on prices of these supplies but did result in longer lead times. During 2008, the prices of many raw materials rose considerably, though towards the end of 2008, we began to see prices decline. Higher prices and lower availability of chemicals, steel and other raw material the Company uses in its business may adversely impact future periods. The Drilling Products and Artificial Lift segments purchase their principal raw material and steel on the open market and where we can, we use multiple suppliers, both domestically and internationally, for our key raw materials purchases.
We also keep in our inventory a three to six month supply of key mud-motor inventory parts that we source from China. This inventory stock position approximates the lead time required to secure these parts in order to avoid disruption of service to our customers. Our inability to secure these key components in a timely manner at reasonable prices could adversely affect our ability to service our customers. We source the vast majority of our
15
Table of Contents
motor parts from a single supplier. As part of our business plan we are diligently working to develop relationships with backup parts suppliers. If we are unsuccessful in developing these relationships, we may be exposed to disruption of key supplies that could result in a loss of revenues or key customers. Additionally, if our customers were to seek or develop alternative approaches, which may vary significantly by geographical region, to the products or services we offer, we could suffer a decline in our revenue and loss of key customers.
We currently do not hedge our commodity prices. We may not be able to pass along price increases to our customers, which could result in a decline in revenues or operating profit.
Our inability to develop new products or differentiate our products could have a material adverse effect on our ability to service our customer’s needs and could result in a loss of customers.
Our ability to compete in the oilfield services market is dependent on our ability to differentiate our products and services, provide superior quality and service, and maintain a competitive cost structure. Activity levels in our three segments are driven primarily by current and expected commodity prices, drilling rig count, oil and gas production levels, and customer capital spending allocated for drilling and production. The regions in which we operate are highly competitive. The competitive environment has intensified as recent mergers among oil and gas companies have reduced the number of available customers. Additionally, the recent downturn in the economy has resulted in the market for our services and that of our competitors to contract. Many other oil and gas service companies are larger than we are and have greater resources than we have. These competitors are better able to withstand industry downturns, compete on the basis of price and acquire new equipment and technologies, all of which could affect our revenue and profitability. These competitors compete with us both for customers and for acquisitions of other businesses. This competition may result in pressure on our operating profit. We believe that competition for contracts will continue to be intense in the foreseeable future.
If we lose the services of key members of our management, we may not be able to manage our operations and implement our growth strategy effectively.
We depend on the continued service of our Chairman and Chief Executive Officer, our Chief Operating Officer, and our Chief Financial Officer, who possess significant expertise and knowledge of our business and industry. We do not have an employment agreement with any of these executives, nor do we carry key man life insurance on any of them. Any loss or interruption of the services of these or other key members of our management could significantly reduce our ability to manage our operations effectively and implement our growth strategy, and we cannot assure you that we would be able to find appropriate replacements for key positions should the need arise.
Failure to maintain effective disclosure controls and procedures and internal controls over financial reporting could have an adverse effect on our operations and the trading price of our common stock.
Effective internal controls are necessary for us to provide reliable financial reports, effectively prevent fraud and operate successfully as a public company. If we cannot provide reliable financial reports or prevent fraud, our reputation and operating results could be harmed. Our 2006 annual report disclosed two material weaknesses in our internal controls over financial reporting as of December 31, 2006, related to inadequate staffing within our accounting department and inadequate monitoring controls. As a result of these material weaknesses, we recorded adjustments to the 2006 financial statements that affected several financial statement line items. During 2007 we implemented changes to our internal controls over financial reporting to address the identified material weaknesses and improve the operating effectiveness of internal controls over financial reporting in accordance with Section 404 of the Sarbanes-Oxley Act of 2002. However, those changes may not be successful, and we may be unable to maintain adequate controls over our financial processes and reporting in the future, including compliance with the obligations under Section 404 of the Sarbanes-Oxley Act of 2002.
If we are unable to maintain effective internal controls over financial reporting we may not be able to provide reliable financial reports or prevent fraud, which, in turn could harm our operating results or cause us to fail to
16
Table of Contents
meet our reporting obligations. Ineffective internal controls could also cause investors to lose confidence in our reported financial information, which could have a negative effect on the trading price of our common stock, limit our ability to access the capital markets in the future and require us to incur additional costs to improve our internal control systems and procedures.
In March of 2008, we did not file our Annual Report on Form 10-K in a timely manner. We filed a request (Form 12b-25) for an extension of time to file this report and subsequently filed our Form 10-K within the extension period for the 2007 year. A failure to file our reports timely with the SEC will result in our inability to file registration statements using any registration form other than Form S-1, which is more time consuming and costly to prepare, for a period of time. This limitation if realized may hamper our ability to raise capital in the financial markets. Additionally, the late filing of reports with the SEC would result in a technical default of our various debt obligations.
Risks Related to Our Industry
Possible Extended Worldwide Recession and Effect on Exploration and Production Activity.
The recent worldwide financial and credit crisis has reduced the availability of liquidity and credit to fund the continuation and expansion of industrial business operations worldwide. The shortage of liquidity and credit combined with recent substantial losses in worldwide equity markets could lead to an extended worldwide economic recession. A slowdown in economic activity caused by a recession would likely reduce worldwide demand for energy and result in lower oil and natural gas prices. Forecasted crude oil prices for 2009 have dropped substantially in the last month. For example, crude oil prices declined from record levels in mid-2008 of approximately $145 per barrel to approximately $35 per barrel in early 2009 and natural gas prices have declined significantly since mid-2008 to early 2009. Demand for our services and products depends on oil and natural gas industry activity and expenditure levels that are directly affected by trends in oil and natural gas prices. Demand for our services and products is particularly sensitive to the level of exploration, development, and production activity of, and the corresponding capital spending by, oil and natural gas companies, including national oil companies. One indication of drilling and production activity and spending is rig count, which the company monitors to gauge market conditions. Any prolonged reduction in oil and natural gas prices or drop in rig count will depress the immediate levels of exploration, development, and production activity. Perceptions of longer-term lower oil and natural gas prices by oil and gas companies can similarly reduce or defer major expenditures given the long-term nature of many large-scale development projects. Lower levels of activity result in a corresponding decline in the demand for our oil and natural gas well services and products, which could have a material adverse effect on our revenue and profitability.
Risks related to Global Credit Crisis.
Recent events in the global credit markets have significantly impacted the availability of credit and financing costs for many of our customers. Many of our customers finance their drilling and production programs through third-party lenders. The reduced availability and increased costs of borrowing could cause our customers to reduce their spending on drilling programs, thereby reducing demand and potentially resulting in lower prices for our products and services. Also, the current credit and economic environment could significantly impact the financial condition of some customers over a period of time, leading to business disruptions and restricting their ability to pay us for services performed, which could negatively impact our results of operations and cash flows. In addition, an increasing number of financial institutions and insurance companies have reported significant deterioration in their financial condition. Our forward-looking statements assume that our lenders, insurers and other financial institutions will be able to fulfill their obligations under our various credit agreements, insurance policies and contracts. If any of our significant financial institutions were unable to perform under such agreements, and if we were unable to find suitable replacements at a reasonable cost, our results of operations, liquidity and cash flows could be adversely impacted.
17
Table of Contents
Volatility or decline in oil and natural gas prices may result in reduced demand for our products and services which may adversely affect our business, financial condition and results of operations.
The markets for oil and natural gas have historically been extremely volatile. We anticipate that these markets will continue to be volatile in the future. Such volatility in oil and gas prices, or the perception by our customers of unpredictability in oil and natural gas prices, adversely affects the spending patterns in our industry. The demand for our products and services is, in large part, driven by current and anticipated oil and gas prices and the related general levels of production spending and drilling activity. In particular, volatility or a decline in oil and gas prices may cause a decline in exploration and drilling activities. This, in turn, could result in lower demand for our products and services and may cause lower prices for our products and services. As a result, volatility or a prolonged decline in oil or natural gas prices may adversely affect our business, financial condition and results of operations.
Competition from new and existing competitors within our industry could have an adverse effect on our results of operations.
The oil and gas industry is highly competitive and fragmented. Our principal competitors include numerous small companies capable of competing effectively in our markets on a local basis as well as a number of large companies that possess substantially greater financial and other resources than we do. Our larger competitors may be able to devote greater resources to developing, promoting and selling their products and services. We may also face increased competition due to the entry of new competitors including current suppliers that decide to sell their products and services directly to our customers. As a result of this competition, we may experience lower sales or greater operating costs, which may have an adverse effect on our margins and results of operations.
Our industry has experienced a high rate of employee turnover. Any difficulty we experience attracting or retaining personnel or agents could adversely affect our business.
We operate in an industry that has historically been highly competitive for securing qualified personnel with the required technical skills and experience. Our services require skilled personnel who can perform physically demanding work. Due to industry volatility and the demanding nature of the work, workers may choose to pursue employment in fields that offer a more desirable work environment at wages that are competitive with ours. As a result, we may not be able to find enough labor to meet our needs, which could limit our growth. In addition, the cost of attracting and retaining qualified personnel has increased over the past several years due to competition, and we expect it will continue to increase in the future. In order to attract and retain qualified personnel we may be required to offer increased wages and benefits. If we are not able to increase the prices of our products and services to compensate for increases in compensation, or if we are unable to attract and retain qualified personnel, our operating results could be adversely affected.
Severe weather could have a material adverse impact on our business.
Our business could be materially and adversely affected by severe weather. Hurricanes, tropical storms, blizzards and cold weather and other weather hazards may cause the curtailment of services, damages to our equipment and facilities, interruptions in the transportation of our products and materials in accordance with contract schedules and loss of productivity. If our customers are unable to operate or are required to reduce their operations due to severe weather, and as a result curtail the purchases of our products and services, our business could be materially adversely affected.
A terrorist attack or armed conflict could harm our business.
Terrorist activities, anti-terrorist efforts and other armed conflict involving the United States may adversely affect the United States and global economies and could prevent us from meeting our financial and other
18
Table of Contents
obligations. We may experience loss of business, delays or defaults in payments from payers, or disruptions of fuel supplies and markets if pipelines, production facilities, processing plants and refineries are direct targets or indirect casualties of an act of terror or war. In addition, such activities could reduce the overall demand for oil and natural gas which, in turn, could reduce the demand for our products and services. We have implemented certain security measures in response to the threat of terrorist activities. Terrorist activities and the threat of potential terrorist activities and any resulting economic downturn could adversely affect our results of operations, impair our ability to raise capital or otherwise adversely impact our ability to execute our business strategy.
Risks Related to Our Common Stock
The market price of our common stock has been and may continue to be volatile.
The market price of our common stock has historically been subject to significant fluctuations. The following factors, among others, could cause the price of our common stock in the public market to fluctuate significantly:
| • | variations in our quarterly results of operations; |
| • | changes in market valuations of companies in our industry; |
| • | fluctuation in stock market prices and volume; |
| • | fluctuation in oil and natural gas prices; |
| • | issuance of common stock or other securities in the future; |
| • | the addition or departure of key personnel; and |
| • | announcements by us or our competitors of new business, acquisitions or joint ventures. |
The stock market has experienced extreme price and volume fluctuations in recent years that have significantly affected the prices of the common stock of many companies, including companies in our industry. The changes can occur without regard to specific operating performance. The price of our common stock could continue to fluctuate based upon factors that have little to do with our Company, and these fluctuations could materially reduce our stock price. Class action lawsuits have frequently been brought against companies following periods of volatility in the market price of their common stock. If we become involved in this type of litigation it could be expensive and divert management’s attention and Company resources, which could have a material adverse effect on our business, financial condition and results of operations.
An active market for our common stock may not continue to exist or may not continue to exist at current trading levels.
Trading volume for our common stock has historically been low when compared to companies with large market capitalizations. We cannot assure you that an active trading market for our common stock will develop or be sustained. Sales of significant amounts of shares of our common stock in the public market could lower the market price of our stock.
If we do not meet the New York Stock exchange continued listing requirements, our common stock may be delisted, which could have an adverse impact on the liquidity and market price of our common stock.
Our common stock is currently listed on the New York Stock Exchange (“NYSE”). If we do not meet the NYSE continued listing requirements, which require, among other things, a minimum average closing price for our common stock of $1.00 over 30 consecutive trading days, the NYSE may take action to delist our common stock. During the fourth quarter of 2008, the price of our common stock closed as low as $1.88 and as of March 6, 2009, the closing price of our common stock was $1.28. A delisting of our common stock could negatively impact us by: (i) reducing the liquidity and market price of our common stock; (ii) reducing the number of
19
Table of Contents
investors willing to hold or acquire our common stock, which could negatively impact our ability to raise equity financing and (iii) decreasing the amount of news and analyst coverage for us.
We have no plans to pay dividends on our common stock, and, therefore, investors will have to look to stock appreciation for return on their investments.
We do not anticipate paying any cash dividends on our common stock in the foreseeable future. We currently intend to retain all future earnings to fund the development and growth of our business. Any payment of future dividends will be at the discretion of our board of directors and will depend on, among other things, our earnings, financial condition, capital requirements, level of indebtedness, statutory and contractual restrictions applying to the payment of dividends and other considerations that the board of directors deems relevant. Certain covenants of our senior credit facility, as amended restrict the payment of dividends without the prior written consent of the lender. Investors must rely on sales of their common stock after price appreciation, which may never occur, in order to realize a return on their investment.
Certain anti-takeover provisions of our charter documents and under Delaware law could discourage or prevent others from acquiring our company, which may adversely affect the market price of our common stock.
Our certificate of incorporation and bylaws contain provisions that:
| • | permit us to issue, without stockholder approval, up to 100,000 shares of preferred stock, in one or more series and, with respect to each series, to fix the designation, powers, preferences and rights of the shares of the series; |
| • | prohibit stockholders from calling special meetings; |
| • | limit the ability of shareholders to act by written consent; |
| • | prohibit cumulative voting; and |
| • | require advance notice for stockholder proposals and nominations for election to the board of directors to be acted upon at meetings of stockholders. |
In addition, Section 203 of the Delaware General Corporation Law limits business combinations with owners of more than 15% of our stock that have not been approved by the board of directors. These provisions and other similar provisions make it more difficult for a third party to acquire us without negotiation. Our board of directors could choose not to negotiate with an acquirer that it did not feel was in our strategic interest. If the acquirer were discouraged from offering to acquire us or prevented from successfully completing a hostile acquisition by the anti-takeover measures, you could lose the opportunity to sell your shares at a favorable price.
Future issuance of additional shares of our common stock could cause dilution of ownership interests and adversely affect our stock price.
The Company may in the future issue its previously authorized and unissued securities, resulting in the dilution of the ownership interests of its current stockholders. We are currently authorized to issue 40,000,000 shares of common stock, of which 23,174,286 were issued and 22,782,091 were outstanding as of December 31, 2008 and 857,251 were subject to future issuance through the exercise of options previously granted under our equity compensation plans. The potential issuance of such additional shares of common stock, whether directly or pursuant to any conversion right of our convertible senior notes or other convertible securities we may issue in the future, may create downward pressure on the trading price of our common stock. We may also issue additional shares of our common stock or other securities that are convertible into or exercisable for common stock for raising capital or other business purposes. Future sales of substantial amounts of common stock, or the perception that sales could occur, could have a material adverse effect on the price of our common stock.
20
Table of Contents
We may issue shares of preferred stock or debt securities with greater rights than our common stock.
Subject to the rules of the New York Stock Exchange, our certificate of incorporation authorizes our board of directors to issue one or more series of preferred stock and set the terms of the preferred stock without seeking any further approval from holders of our common stock. Currently, there are 100,000 preferred shares authorized but none issued. Any preferred stock that is issued may rank senior to our common stock in terms of dividends, priority and liquidation premiums and may have greater voting rights than holders of our common stock. Holders of our convertible senior notes will be preferred in right of payment to the holders of our preferred and common stock.
Disclaimer of Obligation to Update
Except as required by applicable law or regulation, we assume no obligation (and specifically disclaim any such obligation) to update these Risk Factors or any other forward-looking statements contained in this Annual Report to reflect actual results, changes in assumptions or other factors affecting such forward-looking statements.
| Item 1B. | Unresolved Staff Comments. |
The Company has no unresolved staff comments as of the date of this report.
21
Table of Contents
| Item 2. | Properties. |
As of February 11, 2009, we operated 41 manufacturing and warehouse facilities in 8 U.S. states. We own 15 of these facilities with the remainder being leased with initial lease terms that expire at various years through 2032. In addition our corporate office is a leased facility located in Houston, Texas. The following table sets forth the locations of these facilities:
| Segment |
Owned/Leased |
Location | ||||
| Chemicals and Logistics |
Owned Owned Owned |
Norman, Oklahoma Marlow, Oklahoma Raceland, Louisiana | ||||
| Owned Owned Leased Leased Leased Leased |
Carthage, Texas Wheeler, Texas Raceland, Louisiana Pocola, Oklahoma Wilburton, Oklahoma The Woodlands, Texas | |||||
| Drilling Products |
Owned Owned Owned Owned Owned Owned |
Lafayette, Louisiana Chickasha, Oklahoma Oklahoma City, Oklahoma Houston, Texas Mason, Texas Midland, Texas | ||||
| Owned | Robstown, Texas | |||||
| Owned | Vernal, Utah | |||||
| Owned | Evanston, Wyoming | |||||
| Leased Leased Leased Leased Leased Leased Leased Leased Leased |
Denver, Colorado Grand Junction, Colorado Bossier City, Louisiana Lafayette, Louisiana (2 locations) Shreveport, Louisiana Farmington, New Mexico Tioga, North Dakota Oklahoma City, Oklahoma Grand Prairie, Texas | |||||
| Leased Leased Leased Leased Leased Leased |
Houston, Texas Corpus Christi, Texas Odessa, Texas Midland, Texas (3 locations) Granbury, Texas Casper, Wyoming | |||||
| Artificial Lift |
Owned | Gillette, Wyoming | ||||
| Leased | Sheridan, Wyoming | |||||
| Leased Leased Leased |
Houston, Texas Denver, Colorado Farmington, New Mexico | |||||
| General Corporate |
Leased | Houston, Texas | ||||
We consider our facilities to be in good condition and suitable for the conduct of our business.
22
Table of Contents
| Item 3. | Legal Proceedings. |
We are involved, on occasion, in routine litigation incidental to our business.
| Item 4. | Submission of Matters to a Vote of Security Holders. |
No matters were submitted to a vote of security holders during our fourth quarter of 2008.
23
Table of Contents
| Item 5. | Market for Registrant’s Common Equity, Related Stockholder Matters and Issuer Purchases of Equity Securities. |
Our common stock is listed on the New York Stock Exchange (“NYSE”) under the symbol “FTK.” As of the close of business on February 11, 2009, there were 23,179,894 common shares outstanding that were held by approximately 10,000 holders of record of our common stock. The last reported sale price of the common stock on the NYSE on March 6, 2009 was $1.28.
As of December 27, 2007, our common stock began trading on the NYSE under the stock ticker symbol “FTK”. Prior to this date, our common stock was traded on the AMEX under the ticker symbol “FTK”. The following table sets forth, on a per share basis for the periods indicated, our high and low closing sales prices of our common stock, reported by the NYSE and the AMEX. These prices do not include retail mark-ups, markdowns or commissions.
On July 11, 2007, the Company affected a two-for-one stock split in the form of a 100% stock dividend to the stockholders of record on July 3, 2007. All share and per share information has been retroactively adjusted to reflect the stock split.
| Fiscal 2008 |
High | Low | ||||
| 4th Quarter |
$ | 10.68 | $ | 1.88 | ||
| 3rd Quarter |
$ | 20.95 | $ | 10.36 | ||
| 2nd Quarter |
$ | 22.82 | $ | 15.30 | ||
| 1st Quarter |
$ | 36.07 | $ | 14.52 | ||
| Fiscal 2007 |
High | Low | ||||
| 4th Quarter |
$ | 53.49 | $ | 31.75 | ||
| 3rd Quarter |
$ | 46.25 | $ | 28.50 | ||
| 2nd Quarter |
$ | 29.98 | $ | 13.95 | ||
| 1st Quarter |
$ | 14.98 | $ | 11.48 | ||
We have never declared or paid cash dividends on our common stock. While we regularly assess our dividend policy, we have no current plans to declare a dividend and we intend to continue to use our earnings and other cash in the maintenance and expansion of our business. In addition, our senior credit facility, as amended, contains provisions that limit our ability to pay cash dividends on our common stock.
24
Table of Contents
Stock Performance Graph
The performance graph below illustrates a five year comparison of cumulative total returns based on an initial investment of $100 in Flotek common stock, as compared with the Russell 2000 Index and the Philadelphia Oil Services Index for the period 2005 through 2008.
This performance chart assumes $100 invested on December 31, 2005 in Flotek common stock, in the Russell 2000 Index and in the Philadelphia Oil Service Index and that all dividends were reinvested.
COMPARISON OF 5 YEAR CUMULATIVE TOTAL RETURN
Among Flotek Industries, Inc. The Russell 2000 Index
And The Philadelphia Oil Services Index
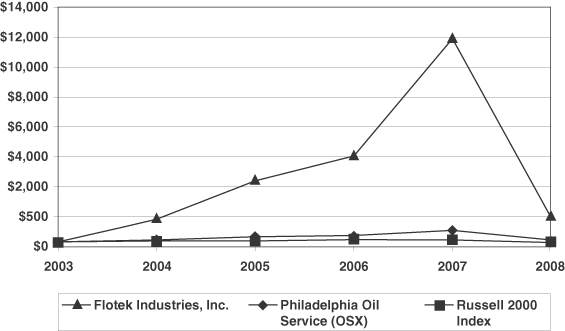
The foregoing graph shall not be deemed to be filed as part of this Form 10-K and does not constitute soliciting material and should not be deemed filed or incorporated by reference into any other filing of the Company under the Securities Act of 1933, as amended, or the Securities Exchange Act of 1934, as amended, except to the extent the Company specifically incorporates the graph by reference.
25
Table of Contents
Securities Authorized for Issuance Under Equity Compensation Plans
The following table summarizes information regarding our equity securities that are authorized for issuance under individual stock option compensation agreements:
Equity Compensation Agreement Information
| Plan category |
Number of securities to be issued upon exercise of outstanding options, warrants and rights |
Weighted-average exercise price of outstanding options, warrants and rights |
Number of securities remaining available for future issuance under equity compensation plans (excluding securities reflected in the first column | ||||
| Equity compensation plans approved by security holders |
857,251 | $ | 9.57 | 2,304,558 | |||
26
Table of Contents
| Item 6. | Selected Financial Data. |
The following table sets forth certain selected historical financial data and should be read in conjunction with “Management’s Discussion and Analysis of Financial Condition and Results of Operations” and the Consolidated Financial Statements and Notes thereto which are included elsewhere herein. The selected operating and financial position data as of and for each of the five-years ended December 31, 2008 have been derived from our audited consolidated financial statements, some of which appear elsewhere in this Annual Report on Form 10-K. As discussed in Item 7, “Management’s Discussion and Analysis of Financial Condition and Results of Operations,” during the past five years, we have effected a number of business combinations and other transactions that materially affect the comparability of the information set forth below. Additionally, on July 11, 2007, the Company effected a two-for-one stock split in the form of a 100% stock dividend to the stockholders of record on July 3, 2007. All share and per share information has been retroactively adjusted to reflect the stock split.
| As of and For the Years Ended December 31, | ||||||||||||||||
| 2008 (2)(3) | 2007 (2) | 2006 (2) | 2005 (2) | 2004 (2) | ||||||||||||
| (in thousands, except per share data) | ||||||||||||||||
| Operating Data |
||||||||||||||||
| Revenue |
$ | 226,063 | $ | 158,008 | $ | 100,642 | $ | 52,869 | $ | 21,881 | ||||||
| Income (Loss) from operations (1) |
$ | (30,751 | ) | $ | 29,686 | $ | 18,853 | $ | 10,114 | $ | 3,012 | |||||
| Net income (loss) (1) |
$ | (34,161 | ) | $ | 16,727 | $ | 11,350 | $ | 7,720 | $ | 2,154 | |||||
| Earnings (Loss) per share – Basic (1) |
$ | (1.78 | ) | $ | 0.91 | $ | 0.66 | $ | 0.53 | $ | 0.16 | |||||
| Earnings (Loss) per share – Diluted (1) |
$ | (1.78 | ) | $ | 0.88 | $ | 0.61 | $ | 0.47 | $ | 0.15 | |||||
| Financial Position Data |
||||||||||||||||
| Total assets |
$ | 234,575 | $ | 160,793 | $ | 82,890 | $ | 52,158 | $ | 15,957 | ||||||
| Long-term debt, less current portion |
$ | 120,281 | $ | 52,377 | $ | 8,185 | $ | 7,277 | $ | 5,272 | ||||||
| Stockholders’ equity |
$ | 65,721 | $ | 77,461 | $ | 53,509 | $ | 35,205 | $ | 4,823 | ||||||
| Cash dividends declared per share |
$ | — | $ | — | $ | — | $ | — | $ | — | ||||||
| 1 | Our results for 2008 include an impairment charge for goodwill and other intangible assets of $67.7 million. See Management’s Discussion and Analysis of Financial Condition and Results of Operations for additional information. |
| 2 | Amounts have been retrospectively revised as a result of the adoption, effective January 1, 2009, of FASB Staff Position No. EITF 03-6-1, Determining Whether Instruments Granted in Share-Based Payment Transactions Are Participating Securities (“FSP EITF 03-6-1”). |
| 3 | Amounts have been retrospectively revised as a result of the adoption, effective January 1, 2009, of FSP Accounting Principles Board (APB) 14-1, Accounting for Convertible Debt Instruments That May Be Settled in Cash upon Conversion (Including Partial Cash Settlement) (“FSP 14-1”). The Company elected to apply the provisions of FSP 14-1 to its 5.25% Senior Convertible Notes issued in 2008 as these Notes were outstanding during the year ended December 31, 2008, as reflected in the accompanying consolidated financial statements. |
The table above reflects the results of the following acquisitions of companies or their assets from their respective dates of acquisitions in the following years:
2005 –
Phoenix E&P Technology, LLC, Spidle Sales and Services, Inc., Harmon’s Machine Works, Inc. and Precision-LOR, Ltd.;
2006 –
Can-Ok-Field Services, Inc., Total Well Solutions and LLC. Liftech, LLC;
27
Table of Contents
2007 –
Triumph Drilling Tools, CAVO Drilling Motors Ltd Co., Sooner Energy, Inc. and,
2008 –
Teledrift Inc.
| Item 7. | Management’s Discussion and Analysis of Financial Condition and Results of Operations. |
The following discussion and analysis should be read in conjunction with our consolidated financial statements included elsewhere in this Annual Report on Form 10-K. The following information contains forward-looking statements, which are subject to risks and uncertainties. Should one or more of these risks or uncertainties materialize, our actual results may differ from those expressed or implied by the forward-looking statements. See “Forward-Looking Statements” at the beginning of this Annual Report on Form 10-K.
FASB Staff Position No. EITF 03-6-1, Determining Whether Instruments Granted in Share-Based Payment Transactions Are Participating Securities (“FSP EITF 03-6-1”) was adopted by the Company, effective January 1, 2009. This new standard requires the retrospective revision of prior period financial statements related to the accounting for unvested share-based payment awards within the scope of FSP EITF 03-6-1. As described in more detail under “Recent Pronouncements” below, retrospective revisions to the amounts originally reflected in the Company’s Annual Report on Form 10-K for the year ended December 31, 2008, filed with the U.S. Securities and Exchange Commission on March 16, 2009, have been included in this Management’s Discussion and Analysis of Financial Condition and Results of Operations of Flotek Industries, Inc., as well as the accompanying Consolidated Financial Statements of Flotek Industries, Inc., in accordance with the provisions of FSP EITF 03-6-1. The effect of this EITF on the financial statements is immaterial.
FASB Staff Position APB 14-1, Accounting for Convertible Debt Instruments That May Be Settled in Cash Upon Conversion (including Partial Cash Settlement) (FSP 14-1) was adopted by the Company, effective January 1, 2009. This new standard requires the retrospective revision of prior period financial statements related to the accounting for convertible debt instruments within the scope of FSP 14-1. As described in more detail under “Recent Pronouncements” below, retrospective revisions to the amounts originally reflected in the Company’s Annual Report on Form 10-K for the year ended December 31, 2008, filed with the U.S. Securities and Exchange Commission on March 16, 2009, have been included in this Management’s Discussion and Analysis of Financial Condition and Results of Operations of Flotek Industries, Inc., as well as the accompanying Consolidated Financial Statements of Flotek Industries, Inc., in accordance with the provisions of FSP 14-1.
No other changes from the amounts or disclosures originally reflected in the Company’s Annual Report on Form 10-K for the year ended December 31, 2008, other than those necessitated by the retrospective revision provisions of FSP EITF 03-6-1 and FSP 14-1, have been included below or in the accompanying Consolidated Financial Statements of Flotek Industries, Inc.
Basis of Presentation
Certain reclassifications have been made to prior periods to conform to the current period presentation. During the fourth quarter of 2008, we discovered that depreciation and amortization expense that was directly related to the production of our revenue was recorded as an operating expense and not as a component of cost of revenue. Over the past three years as we have acquired companies in our Drilling Products segment, depreciation directly associated with the production of revenue has grown. We have determined that the portion of this expense that relates directly to the production of related revenue should more appropriately be reflected in cost of revenue. We have evaluated the reclassification in accordance with the guidance provided in SAB No. 99, “Materiality,” and
28
Table of Contents
have determined that the reclassification is not material to any period. A correction of the reclassification described above has no effect on any single line item contained within or on the Company’s Consolidated Balance Sheet, Consolidated Statement of Stockholders’ Equity or Consolidated Statement of Cash Flows for the 2006, 2007 and 2008 annual or interim periods. The reclassification is between Cost of revenue and Operating expense, a correction of this reclassification would not have an overall effect on Flotek’s Statement of Income and Comprehensive Income, Net income, Earnings per share (“EPS”) (Basic or Diluted), Income from operations, Income before taxes or Provision for income taxes for the same periods. We have concluded that the reclassification would not have a material impact on Depreciation and amortization and Cost of revenues or gross margin on both a consolidated and segment basis, based upon our assessment.
If depreciation expense had been presented correctly consolidated gross margin would have been reduced by $4.3 million and $1.8 million for the years ended December 31, 2007 and 2006, respectively. Depreciation expense directly attributable to the generation of revenue was $7.3 million for the year ended December 31, 2008. Correspondingly, Operating expenses would have been decreased by the same amounts in each of the periods, resulting in no change to Operating income, Net income or Earnings per share as reported. This reclassification had the largest impact on the Drilling Products segment, reducing that segment’s gross margin and decreasing its Operating expenses by $3.7 million and $1.5 million for the years ended December 31, 2007 and 2006, respectively, resulting in no change to reported segment Income from operations. All future reports including those issued at interim periods, will present depreciation directly associated with the production of revenue as a component of gross margin, including adjustments to quarterly data presented herein.
Executive Summary
We are a global technology-driven growth company serving the oil, gas, and mining industries by providing oilfield products, services and equipment. We were incorporated in 1985, currently trade on the NYSE and our headquarters are located in Houston, Texas. We operate in select domestic and international markets including the Gulf Coast, the Southwest and the Rocky Mountains, Northeastern and Mid-Continental United States, Canada, Mexico, Central America, South America, Europe, Africa and Asia. We market our products domestically and internationally in over 20 countries. The customers for our products and services include the major integrated oil and natural gas companies, independent oil and natural gas companies, pressure pumping service companies and state-owned national oil companies. Our ability to compete in the oilfield services market is dependent on our ability to differentiate our products and services, provide superior quality and service, and maintain a competitive cost structure. Activity levels are driven primarily by current and expected commodity prices, drilling rig count, oil and gas production levels, and customer capital spending allocated for drilling and production.
Our business is comprised of three reportable segments: Chemicals and Logistics, Drilling Products and Artificial Lift. We focus on serving the drilling-related needs of oil and gas companies primarily through our Chemicals and Logistics and our Drilling Products segments, and the production-related needs of oil and gas companies through our Artificial Lift and Chemicals and Logistics segments. We believe that our product offerings and geographical presence throughout these three business segments provides us with diverse sources of cash flow. Each segment has its own technical expertise and a common commitment to provide its customers with competitively priced quality equipment and services.
| • | The Chemicals and Logistics segment develops, manufactures and markets specialty chemicals used in oil and gas well cementing, stimulation, acidizing, drilling and production treatment. Additionally, the segment provides well cementing, bulk blending and transload services and transload facility management services. |
| • | The Drilling Products segment rents, inspects, manufactures and markets downhole drilling equipment for the energy, mining, water well and industrial drilling sectors. |
29
Table of Contents
| • | The Artificial Lift segment manufactures and markets artificial lift equipment which includes the Petrovalve line of rod pump components, electric submersible pumps, gas separators, valves and services to support coal bed methane production. |
Over the past three years, we have grown both organically and through strategic acquisitions and other investments of complementary or competing businesses in an effort to expand our product offering and geographic presence in key markets. We continue to seek accretive acquisition or merger candidates in our core businesses to either decrease costs of providing products or add new products and customer base to diversify our market. We strive to mitigate cyclical risk in the oilfield service sector by balancing our operations between onshore versus offshore; drilling versus production; rental tools versus service; domestic versus international; and natural gas versus crude oil.
The acquisitions we completed in 2008, 2007 and 2006 included:
| • | Teledrift, Inc. (“Teledrift”), which designs and manufactures wireless survey and measurement while drilling, or MWD, tools, in February 2008; |
| • | Sooner Energy Services, Inc. (“Sooner”), which develops, produces and distributes specialty chemical products and services for drilling and production of natural gas in August 2007; |
| • | A 50% partnership interest in CAVO Drilling Motors, Ltd, Co., (“CAVO”), which specializes in the rental, service and sale of high performance mud motors in January 2007 and the remaining 50% partnership interest in November 2007; |
| • | Triumph Drilling Tools, Inc. (“Triumph”), a drilling tool sales and rental provider in Texas, New Mexico, Louisiana, Oklahoma and Arkansas, in January 2007; |
| • | The tangible assets and licensed rights to exercise the exclusive worldwide rights to a patented gas separator used in coal bed methane production in April 2006; |
| • | The assets of LifTech, LLC. (“LifTech”), which markets and services electric submersible pumps and downhole gas/water separators primarily to coal bed methane gas producers in June 2006; and |
| • | The assets of Can-Ok Oil Field Services, Inc. and Stabilizer Technology, Inc. (collectively “Can-Ok”) a downhole oilfield tool company in January 2006. |
As 2008 progressed, early optimism of continuing growth in oil and natural gas exploration and production activity was dampened by growing evidence of weakening economic conditions that began to significantly weigh upon the energy markets in early October. While such weakening did not prevent oil prices from ramping up steeply in July, the velocity of the subsequent reversal to under $40-per-barrel by the end of the year was supported by economic reports and forecasts that confirmed the majority of the OECD (Organization for Economic Co-operation and Development) countries to be in recession by the end of the third quarter. Consequently, global oil demand forecasts for 2008 dropped from quarter to quarter and it became apparent that moderating oil demand growth in the non-OECD economies would no longer be sufficient to offset a continuing three-year demand decline within the OECD countries. In the fourth quarter OPEC elected to cut production. However, the time taken for these cuts to be felt in the market, and for the resultant increased spare capacity to be reabsorbed by future growth, was large enough for E&P customers to cut investment. This translated to lower demand and weaker prices for oilfield services in an increasing number of areas late in the fourth quarter.
The natural gas markets presented a similar picture. While activity was initially maintained in the first part of the year, the developing recession in the latter part of 2008 led to lower industrial demand in the developed economies although commercial and residential demand was maintained. In North America, supply increased in 2008 largely as a result of industry deployment of advanced drilling, production and completion technologies leading to higher gas production and consequently greater storage levels in spite of lower Canadian imports and decreased LNG (Liquified Natural Gas) supplies. Consequently, more LNG became available for other
30
Table of Contents
international importers and, as a result, the majority of the developed economies are well supplied for their needs. Within the United States, the world’s largest natural gas market, this translated to reduced gas exploration and production investment with lower demand for oilfield services and consequent pressure on service pricing in a number of areas by the fourth quarter as the market price of natural gas fell. In international markets however, increasing demand for natural gas in the developing economies led to sustained drilling activity with drilling rigs previously deployed on oil exploration and development moving to natural gas activity in some regions.
Evidence of a softening in the oil, gas, and mining industry spending began to impact our results in November, 2008 particularly in our chemical sales to pumping companies. Late in the fourth quarter of 2008 we began to take actions to scale our business to cope with these factors by implementing various cost containment methods designed to reduce our fixed costs such as implementing an employee cap and reducing travel levels. Early in 2009, we took actions to size the workforce, in certain divisions, to our expected near-term work load resulting in headcount reductions, including contract employees and full and part time employees. Also in early 2009, we began implementing a plan to consolidate various facilities to better leverage our fixed cost structure. In conjunction with the current market downturn, we anticipate inventory levels will significantly decrease and we will work to take advantage of declining raw material prices to meet our customers demand for competitive pricing. A summary of factors important to understanding our results for 2008 is provided below and further discussed in the narrative that follows this overview:
| • | Total Company Net (loss) was ($34.2) million and Diluted (loss) per share of ($1.78) in 2008 compared to Net income of $16.7 million and Diluted earnings per share of $0.88 in 2007. We recorded a non-cash charge of $67.7 million in the fourth quarter of 2008 related to impairment of goodwill and other intangible assets consisting of patents and customer lists (the “Impairment”). Excluding the effect of the Impairment, Adjusted net income for the full year 2008 would have been $14.2 million and Adjusted diluted earnings per share of $0.74 per share, compared to Net income of $16.7 million and Earnings per share of $0.88 in 2007. |
| • | Diluted earnings (loss) per share for 2008, 2007 and 2006 were ($1.78), $0.88 and $0.61, respectively. Excluding the effect of the Impairment, Adjusted diluted earnings per share were $0.74, $0.88 and $0.61 for 2008, 2007 and 2006, respectively. |
| • | Total Company revenue increased to $226 million in 2008, up 43% compared to 2007 due to increased demand in all of our segments and the acquisition of Teledrift. Revenues in the Chemicals and Logistics segment increased 27% due to increased demand for our proprietary specialty chemicals, Drilling Products revenues increased 73% mainly due to the addition of the Teledrift MWD suite of products, and Artificial Lift revenues increased 24%. The revenue associated with Teledrift is included in the Drilling Products segment from its date of acquisition in February 2008. |
| • | Total Company gross margin as a percentage of revenue for 2008 remained flat with 2007 primarily due to the impact of higher margins from Teledrift offsetting margin deteriorations in the Chemical & Logistics segment and the rest of Drilling Products as we were unable to pass on all of the increased raw material costs to our customers during the year. |
| • | The Impairment reflected in our financial statements caused us to be in non-compliance with the Minimum Net Worth covenant contained within our credit agreement (the “New Credit Agreement”) as of December 31, 2008. Additionally, our forecasts indicated that we might violate the Leverage Ratio and the Fixed Charge Coverage Ratio in the New Credit Agreement in the next twelve months. Accordingly, on March 13, 2009, we entered into a Second Amendment to our New Credit Agreement dated March 13, 2009 (the “Second Amendment”) with our lenders that we believe will provide us with adequate liquidity to meet our needs in the foreseeable future and allow us to meet our amended covenants. |
| • | Total Company Income (Loss) from operations as a percentage of sales decreased to (13.6%) in 2008 from 18.8% in 2007. This decrease is due to the Impairment, increased administrative costs and depreciation and amortization costs associated with acquisitions. |
31
Table of Contents
These results are partially offset by a rapid reversal that occurred late in the year in response to the worsening economic climate in the United States and around the world.
The sharp drop in oil and gas prices in the latter part of 2008 has resulted in lower activity, higher inventories, and the belief that demand will erode further in 2009 as a result of a worldwide economic slowdown, and has led to rapid and substantial reductions in exploration and production expenditure. At current prices most of the new categories of hydrocarbon resources such as heavy oil, tar sands, coal-to-liquids, or gas-to-liquids are not economic to develop. In addition, margins will remain under pressure as customers seek lower prices for oilfield services and we, in turn seek price reductions from our suppliers.
Our Drilling Products segment is tied closely to rig count and any significant reductions in rig count will have an adverse effect on our business. Despite these pressures we expect to maintain our market share through service quality and product innovation and competitive bundling of product offerings.
Non-Cash Impairment
As a result of our annual review of goodwill and other intangible assets, we recorded non-cash charges of $61.5 million to impair goodwill and $6.2 million related primarily to the impairment of customer lists and patents. We test goodwill for impairment on an annual basis at a reporting unit level in the fourth quarter of every year. Impairment is a condition that exists when the carrying amount of goodwill exceeds its implied fair value. Testing of goodwill requires the use of a two step impairment test that identifies potential goodwill impairment and measures the amount of an impairment loss to be recognized (if any). We began our process of testing goodwill by assessing our reporting segments and units. A reporting unit is an operating segment or one level below an operating segment (referred to as a component). A component of an operating segment is a reporting unit if the component constitutes a business for which discrete financial information is available and segment management regularly reviews the operating results of that component. However, two or more components of an operating segment should be aggregated and deemed a single reporting unit if the components have similar economic characteristics. An operating segment shall be deemed to be a reporting unit if all of its components are similar, if none of its components is a reporting unit, or if it comprises only a single component. Based on our analysis, we determined that we have four reporting units: Chemicals and Logistics, Other Drilling Products, Teledrift (which is included in our Drilling Products segment) and Artificial Lift.
The first step of the goodwill impairment test compares the fair value of a reporting unit with its carrying amount, including goodwill. If the fair value of a reporting unit exceeds its carrying amount, goodwill of the reporting unit is considered not impaired, thus the second step of the impairment test is unnecessary. If the carrying amount of a reporting unit exceeds its fair value, the second step of the test shall be performed to measure the amount of impairment loss, if any. Based upon our assessment, we determined that a potential impairment existed for goodwill recorded in the Other Drilling Products, Teledrift and Artificial Lift reporting units.
The second step of the goodwill impairment test, which is used to measure the amount of impairment loss compares the implied fair value of a reporting unit’s goodwill with the carrying amount of that goodwill. The implied fair value of goodwill is determined in a manner similar to determining the amount of goodwill recognized in a business combination. Accordingly, we assigned the fair value of a reporting unit to all of the assets and liabilities of that unit (including any unrecognized intangible assets) as if the reporting unit had been acquired in a business combination. The excess of the fair value of a reporting unit over the amounts assigned to its assets and liabilities is the implied fair value of goodwill. We performed that assignment process only for purposes of testing goodwill for impairment and did not write up or write down a recognized asset or liability, nor did we recognize a previously unrecognized intangible asset as a result of this allocation process. We determined that the carrying amount of reporting unit goodwill exceeded the implied fair value of that goodwill for each of the three reporting units mentioned above and recognized an impairment loss equal to that excess.
32
Table of Contents
The fair value of a reporting unit refers to the price that would be received to sell the unit as a whole in an orderly transaction between market participants at the measurement date. Quoted market prices in active markets are the best evidence of fair value and shall be used as the basis for the measurement, if available. If quoted market prices are not available, fair value of a reporting unit may be estimated using a valuation technique based on multiples of earnings or revenue or a similar performance measure if that technique is consistent with the objective of measuring fair value. We choose to determine the value of our reporting units using the income approach due to a lack of current market transactions that could provide perspective to our analysis as a result of an inactive transaction market and our diverse peer group. Use of this income approach is dependent on forecasts and determination of a weighted average cost of capital. We calculated the weighted average cost of capital for each reporting unit considering various unit specific factors such as risk, size and borrowing costs in relation to our peer group.
Factors that effected these calculations include broad economic drivers that were impacted beginning late in the fourth quarter of 2008. We adjusted our activities in the later stages of 2008 in an effort to address the impact these factors were having on our customers and lessen the adverse impact on our forecasted results. Given the general economic climate, we assessed our 2008 full year forecast compared to the base year used in our prior year goodwill test and looked to other indicators of then-current market participant information. Early in the fourth quarter of 2008, our stock price began to decline.
The changes in business conditions since that time are considered significant. Initial decisions from our fourth quarter business review included the closing of certain operating locations and the curtailing of capital expenditures throughout the Company. These changes, combined with the extreme volatility and related deepening economic crisis experienced during the fourth quarter, lower-than-expected full year 2008 operating results, continued recessionary projections for 2009, lower rig count projection, and significant uncertainty about when the global economy will recover, have contributed to reduced projected cash flows and higher risk-adjusted discount rates used in our current analysis compared to those used in our goodwill test for 2007. Our projections include anticipated benefits from a re-leveraging of sales when conditions improved. We anticipate a continued challenging environment for 2009 followed by some recovery beginning in 2010.
Accordingly, we recorded a goodwill impairment charge of $61.5 million, relating to the following reporting units: Artificial Lift, $5.9 million, Other Drilling Products, $43.0 million and Teledrift, $12.6 million. Included in these impairment charges is goodwill resulting from 2005 and later acquisitions. All of these acquired entities were integrated into their respective reporting units and their cash flows were aggregated with all other cash flows of the respective reporting unit in the determination of estimated fair value.
An impairment loss shall be recognized only if the carrying amount of a long-lived asset is not recoverable and exceeds its fair value. The carrying amount of a long-lived asset is not recoverable if it exceeds the sum of the undiscounted cash flows expected to result from the use and eventual disposition of the asset. That assessment shall be based on the carrying amount of the asset at the date it is tested for recoverability. A long-lived asset shall be tested for recoverability whenever events or changes in circumstances indicate that its carrying amount may not be recoverable. Due to the significantly changing business conditions late in the fourth quarter of 2008, we determined a test our long-lived assets for potential impairment was appropriate.
We grouped our long lived assets with other assets and liabilities at the lowest level for which identifiable cash flows are largely independent and identifiable. Estimates of future cash flows used to test the recoverability of our long-lived asset included only the future cash flows that are directly associated with and that are expected to arise as a direct result of the use and eventual disposition of the asset. We considered various factors in making these estimates including whether other assets of the group would have been acquired by the entity without the asset, the level of investment that would be required to replace the asset, and the remaining useful life of the asset relative to other assets of the group.
33
Table of Contents
Based on this analysis we recorded an impairment loss related to our other intangible assets that totaled approximately $6.2 million and primarily relates to customer lists and patents which were part of business acquisitions in 2006 and 2007.
Results of Operations:
| For the Years Ended December 31, | ||||||||||||
| 2008 | 2007 | 2006 | ||||||||||
| (in thousands) | ||||||||||||
| Revenue |
$ | 226,063 | $ | 158,008 | $ | 100,642 | ||||||
| Cost of revenue 1 |
135,307 | 94,561 | 61,249 | |||||||||
| Impairment of Goodwill and Other intangible assets |
67,695 | — | — | |||||||||
| Selling, general and administrative costs |
46,311 | 30,639 | 18,919 | |||||||||
| Depreciation and amortization |
5,570 | 2,273 | 965 | |||||||||
| Research and development costs |
1,931 | 849 | 656 | |||||||||
| Total operating expenses |
121,507 | 33,761 | 20,540 | |||||||||
| Income (Loss) from operations |
(30,751 | ) | 29,686 | 18,853 | ||||||||
| Income (Loss) from operations % |
-13.6 | % | 18.8 | % | 18.7 | % | ||||||
| Other income (expense): |
||||||||||||
| Interest expense (3) |
(13,813 | ) | (3,501 | ) | (1,005 | ) | ||||||
| Other, net |
(96 | ) | 956 | 85 | ||||||||
| Total other income (expense) |
(13,909 | ) | (2,545 | ) | (920 | ) | ||||||
| Income (Loss) before income taxes |
(44,660 | ) | 27,141 | 17,933 | ||||||||
| Income tax benefit (provision) (3) |
10,499 | (10,414 | ) | (6,583 | ) | |||||||
| Net income (loss) |
$ | (34,161 | ) | $ | 16,727 | $ | 11,350 | |||||
| Basic Earnings Per Share (4) |
$ | (1.78 | ) | $ | 0.91 | $ | 0.66 | |||||
| Diluted Earnings per Share (4) |
$ | (1.78 | ) | $ | 0.88 | $ | 0.61 | |||||
| 1 | Includes Depreciation directly related to production of Revenue of $7,274, $4,264 and $1,785 for the years ended December 31, 2008, 2007 and 2006, respectively. |
| Non-GAAP Reconciliation: |
||||||||||||
| Income (Loss) from operations |
$ | (30,751 | ) | $ | 29,686 | $ | 18,853 | |||||
| Impairment of Goodwill and Other Intangible assets |
67,695 | — | — | |||||||||
| Adjusted income from operations |
36,944 | 29,686 | 18,853 | |||||||||
| Adjusted income from operations % |
16.3 | % | 18.8 | % | 18.7 | % | ||||||
| Total other income (expense) (3) |
(13,909 | ) | (2,545 | ) | (920 | ) | ||||||
| Income tax benefit (provision) (2)(3) |
(8,817 | ) | (10,414 | ) | (6,583 | ) | ||||||
| Adjusted net income (loss) |
$ | 14,218 | $ | 16,727 | $ | 11,350 | ||||||
| Adjusted Basic Earnings Per Share (4) |
$ | 0.74 | $ | 0.91 | $ | 0.66 | ||||||
| Adjusted Diluted Earnings Per Share (4) |
$ | 0.74 | $ | 0.88 | $ | 0.61 | ||||||
| 2 | Excludes the tax benefit of $19.3 million related to the Impairment. |
34
Table of Contents
| 3 | Amounts have been retrospectively revised as a result of the adoption, effective January 1, 2009, of FSP 14-1, Accounting for Convertible Debt Instruments That May Be Settled in Cash Upon Conversion (including Partial Cash Settlement). |
| 4 | Amounts have been retrospectively revised as a result of the adoption, effective January 1, 2009, of FASB Staff Position EITF 03-6-1, Determining Whether Instruments Granted in Share-Based Payment Transactions Are Participating Securities. |
| Segment Income (Loss) from operations: |
||||||||||||
| Chemicals and Logistics |
$ | 37,433 | $ | 32,389 | $ | 16,845 | ||||||
| Drilling Products |
(43,840 | ) | 5,632 | 6,325 | ||||||||
| Artificial Lift |
(6,709 | ) | 1,381 | 1,514 | ||||||||
| Unallocated Corporate |
(17,635 | ) | (9,716 | ) | (5,831 | ) | ||||||
| Income (Loss) from operations |
$ | (30,751 | ) | $ | 29,686 | $ | 18,853 | |||||
Results for 2008 compared to 2007—Consolidated
Revenue for the year ended December 31, 2008 was $226.1 million, an increase of 43.1%, compared to $158.0 million for the same period in 2007. Revenue increased in all three of our segments as we experienced organic growth greater than 20% when compared to the previous year with the remainder of the growth coming from our acquisition of Teledrift. The organic revenue growth is primarily a result of an increase in overall sales volume, particularly of our proprietary specialty chemicals, tool rentals, service inspections and expansion of our mud motor fleet. Sales of our biodegradable “green” chemicals grew 37.2%, to $77.4 million for the year ended December 31, 2008.
Gross margin for the year ended December 31, 2008 was $90.8 million, an increase of 43.0%, compared to $63.4 million for the same period in 2007. Gross margin as a percentage of revenue remained flat between both periods at approximately, 40.2% of revenues. We actively managed our gross margin through targeted price increases and cost containment measures to offset increasing raw material prices throughout the year. We continued to experience greater volumes within our higher margin Chemicals and Logistics segment and volumes related to the Teledrift acquisition. Sales of our proprietary environmentally benign ‘green’ chemicals which sell at higher margins made up 34.2% of consolidated revenues for the year ended December 31, 2008, compared to 35.7% for the year ended December 31, 2007. Taking into account current market conditions, we anticipate that we will continue to experience downward pressure on our margins throughout 2009. We intend to mitigate the effect of this pressure through management of our raw materials and other direct product costs. Gross margin is calculated as Revenue less the corresponding Cost of revenue, which includes depreciation expense directly associated with the generation of revenue.
We impaired the carrying value of goodwill and other intangible assets based on management’s evaluation of the Company’s sustained low stock price and reduced market capitalization, macroeconomic factors impacting industry conditions, actual recent results and forecasted operating performance, as well as other factors. We normally assess the carrying value of acquired goodwill and other assets for impairment in the fourth quarter of every year. The Company determined that the carrying value of goodwill and other intangible assets exceeded the estimated fair value of the various reporting units and, as a result, recorded an impairment of $67.7 million at December 31, 2008. (Loss) from operations was ($30.8) million for the year in 2008 compared to Income from operations of $29.7 million for the year in 2007. Excluding the effect of the Impairment, Adjusted income from operations was $36.9 million for the year in 2008 compared to Income from operations of $29.7 million for 2007.
Selling, general and administrative costs are not directly attributable to products sold or services rendered. Selling, general and administrative costs were $46.3 million for the year ended December 31, 2008, an increase of 51.2%, compared to $30.6 million during 2007. The increase was primarily due to the acquisition of Teledrift and increased indirect personnel costs in all divisions as we shifted into the more people-intensive rental and
35
Table of Contents
service business, expanded geographically and expanded our sales and corporate support staff. Professional fees increased due to higher administration and management costs, which were incurred to strengthen back office functions and internal controls.
Depreciation and amortization costs were $5.6 million for the year ended December 31, 2008, an increase of approximately 145%, compared to $2.3 million during the same period in 2007. The increase is due to higher depreciation associated with acquired assets and expanded capital expenditures.
Research and development (“R&D”) costs were $1.9 million for the year ended December 31, 2008, an increase of 127.4%, compared to $0.8 million during the same period in 2007. In 2008 we expanded our R&D investments in the Chemicals and Logistics segment by approximately 125%. Due to current market conditions we anticipate 2009 R&D spending levels to remain consistent with current year levels at approximately 1% of revenues. R&D expenditures are charged to expense as incurred.
Interest expense was $13.8 million for the year ended December 31, 2008 versus $3.5 million in 2007. The increase was a result of the increase in our overall debt level associated with the issuance of the Convertible Senior Notes in the amount of $115 million used to finance the Teledrift acquisition, non-cash interest expense related to the application of FSP 14-1 and pay down amounts previously outstanding under our Senior Credit Facility. Additionally, we amortized debt fees related to our financing agreements throughout 2008 that amounted to approximately $1.0 million. Further discussion related to these credit facilities can be found in the “Capital Resources and Liquidity discussion included in “Management’s Discussion and Analysis of Financial Condition and Results of Operations” in Part II, Item 7 of our Annual Report on Form 10-K.
An income tax benefit of $10.5 million was recorded for the year ended December 31, 2008. The effective tax rate for 2008 was 23.5% for the year ended December 31, 2008 versus 38.4% for 2007. The decrease in our effective tax rate is primarily due to the Impairment and a shift in income by jurisdiction. The Impairment had a $19.3 million impact on our tax provision.
Results for 2007 compared to 2006—Consolidated
Revenue for the year ended December 31, 2007 was $158.0 million, an increase of 57.0%, compared to $100.6 million for the same period in 2006. Revenue increased in all of our segments principally due to increased demand for our proprietary specialty chemicals, the completion of three acquisitions in 2007, and the expansion of our rental tool fleet. Approximately 60% of the revenue growth in 2007 over 2006 related to organic growth of our existing businesses.
Gross margin for the year ended December 31, 2007 was $63.4 million, an increase of 61.1%, compared to $39.4 million for the same period in 2006. Gross profit as a percentage of revenue for the year ended December 31, 2007 was 40.2%, compared to 39.1% for the same period in 2006. The increase in gross profit is due to an increase in specialty chemical sales as a percentage of total sales overall. Chemicals and Logistics made up approximately 54.6% of total consolidated revenues for the year ended December 31, 2007 versus 50.2% for the same period in 2006. In addition, sales of our proprietary environmentally benign ‘green’ chemicals which sell at higher margins made up 65.4% of the total Chemicals and Logistics revenues for the year ended December 31, 2007, versus 51.5% for the same period in 2006.
Selling, general and administrative costs are not directly attributable to products sold or services rendered. Selling, general and administrative costs were $30.6 million for the year ended December 31, 2007, an increase of 61.9%, compared to $18.9 million during the same period in 2006. The increase in selling expenses was primarily due to increased indirect personnel costs in all divisions as we shifted into the more people intensive rental and service business, expanded geographically and expanded our sales and corporate support staff. General and administrative expenses were higher due to increased costs associated with Sarbanes-Oxley initiatives, computing systems upgrades/conversions, and implementation of the RTMS (rental tool management system).
36
Table of Contents
All of these administrative upgrades are expected to result in enhanced control and efficiency during 2008. In addition, $1.7 million of equity compensation expense associated with restricted stock and option grants made to employees, directors, and officers, was incurred in 2007 which was not incurred in 2006.
Depreciation and amortization costs were $2.3 million for the year ended December 31, 2007, an increase of approximately 135% compared to $1.0 million during the same period in 2006. The increase is due to higher depreciation associated with acquired assets and increased capital expenditures. In addition, amortization expense increased due to the recognition of intangible assets from acquisitions completed in 2006 and 2007.
Research and development (“R&D”) costs were $0.8 million for the year ended December 31, 2007, an increase of 29.4% compared to $0.7 million during the same period in 2006. The increase in R&D related to the establishment of our specialty chemical research facility that opened in 2007. R&D expenditures are charged to expense as incurred.
Interest expense was $3.5 million for the year ended December 31, 2007 versus $1.0 million in 2006. The increase was a result of the increase in our overall debt level associated with the Triumph, CAVO and Sooner acquisitions. We amended our credit facility in January 2007 in conjunction with the Triumph acquisition and again in August 2007 for the acquisition of Sooner. Our borrowing capacity on the line of credit and equipment term loan was increased to partially fund these acquisitions.
A provision for income taxes of $10.4 million was recorded for the year ended December 31, 2007. An effective tax rate of 38.4% was applied for the year ended December 31, 2007 versus 36.7% for the same period in 2006. The increase in our effective tax rate is primarily due to an increase in the percentage of earnings in state jurisdictions with higher state income tax rates, and increased state income tax expense resulting from the enactment of the new Texas Margin Tax in 2007. Partially offsetting these factors is the increased tax benefit associated with U.S. manufacturing operations under the American Jobs Creation Act of 2004.
Results by Segment
| Chemicals and Logistics |
||||||||||||
| For the Years Ended December 31, | ||||||||||||
| 2008 | 2007 | 2006 | ||||||||||
| (in thousands) | ||||||||||||
| Revenue |
$ | 109,356 | $ | 86,271 | $ | 50,545 | ||||||
| Income from operations |
$ | 37,433 | $ | 32,389 | $ | 16,845 | ||||||
| Income from operations % |
34.2 | % | 37.5 | % | 33.3 | % | ||||||
Results for 2008 compared to 2007—Chemicals and Logistics
Chemicals and Logistics revenue for the year ended December 31, 2008 was $109.4 million, an increase of 26.8%, compared to $86.3 million for the year ended December 31, 2007. The increase in revenue is primarily a result of an increase in sales of our proprietary specialty chemicals and the Sooner Energy Services, Inc. acquisition. This increase was partially offset by a decrease in sales of the remainder of our chemical business as those products became commoditized due to increased competition. We also instituted a price increase in the first quarter of 2008 that we maintained for most of the year. However, in the second half of the year our margins declined as a result of rising raw material costs. Sales of our micro-emulsion chemicals grew 37.2%, to $77.4 million for the year ended December 31, 2008 from $56.4 million for 2007 as a result of increased fracturing activities and wider acceptance of our micro-emulsion products by independent pressure pumping companies as well as the majors.
37
Table of Contents
Income from operations was $37.4 million for the year ended December 31, 2008, approximately 16% higher than the same period in 2007. Income from operations as a percentage of revenue decreased to 34.2% for the year ended December 31, 2008. The rising cost of raw materials (petroleum-based feedstock) reduced our operating profit. We partially offset this cost increase through targeted price increases for certain products. We also made investments related to a new research and development facility and for our international initiative.
As a result of the declining market conditions experienced in the fourth quarter of 2008, we began to institute measures to size the organization to the current marketplace. We relocated one production chemical manufacturing facility. As a technology driven company, we remained active in our research and development efforts by maintaining these costs at current levels as a percentage of revenues. We anticipate increased price pressures from our customers within the marketplace and will therefore focus our attention on margin protection through management of both raw materials and fixed costs, in addition to technology innovations.
Results for 2007 compared to 2006—Chemicals and Logistics
Chemical and Logistics revenue for the year ended December 31, 2007 was $86.3 million, an increase of 70.7%, compared to $50.5 million for the year ended December 31, 2006. The increase in revenue is primarily a result of an increase in overall sales volume, particularly of our proprietary specialty chemicals. The most significant revenue growth occurred in the Mid-Continent, Permian Basin, Rocky Mountain and South Texas regions. Sales of our biodegradable, environmentally benign ‘green’ chemicals grew 117%, to $56.4 million for the year ended December 31, 2007 from $26.0 million for the same period in 2006.
On August 31, 2007, the Company acquired Sooner Energy Services to establish a platform for expansion into production chemicals. Sooner develops, produces and distributes specialty chemical products and services for the drilling and production of natural gas. The Sooner acquisition contributed approximately $2 million in revenue in 2007.
The Company signed a five year agreement to build and operate a liquid chemical distribution facility for a major service company. Construction of our liquids chemical facility was completed during the fourth quarter of 2007 and is expected to double our throughput service revenue in 2008. The new liquid chemical distribution facility and our existing cement handling and blending facility will provide a broad range of blending and logistics services to our customer for cementing and stimulation products used offshore in the Gulf of Mexico.
Income from operations increased $15.5 million, or 92.2%, for the year ended December 31, 2007 compared to the same period in 2006. Income from operations as a percentage of revenue increased to 37.5% for the year ended December 31, 2007 compared to 33.3% for the year ended December 31, 2006. The increase in operating profit is driven by an increase in overall sales activity coupled with a continued shift in sales mix to higher margin patented and proprietary products. Early in 2007, construction of a 30,000 square foot expansion to our production facilities was completed. This facility tripled production capabilities and allows the division to manage larger volumes of inputs to take further advantage of volume pricing discounts.
38
Table of Contents
| Drilling Products |
||||||||||||
| For the Years Ended December 31, | ||||||||||||
| 2008 | 2007 | 2006 | ||||||||||
| (in thousands) | ||||||||||||
| Revenue |
$ | 98,262 | $ | 56,836 | $ | 36,753 | ||||||
| Income (Loss) from operations |
$ | (43,840 | ) | $ | 5,632 | $ | 6,325 | |||||
| Income (Loss) from operations % |
(44.6 | )% | 9.9 | % | 17.2 | % | ||||||
| Non–GAAP reconciliation: |
||||||||||||
| Income (Loss) from operations |
$ | (43,840 | ) | $ | 5,632 | $ | 6,325 | |||||
| Impairment of Goodwill and Other intangible assets |
59,143 | — | — | |||||||||
| Adjusted income from operations |
$ | 15,303 | $ | 5,632 | $ | 6,325 | ||||||
| Adjusted income from operations % |
15.6 | % | 9.9 | % | 17.2 | % | ||||||
Results for 2008 compared to 2007—Drilling Products
Drilling Products revenue for the year ended December 31, 2008 was $98.3 million, an increase of 72.9%, compared to $56.8 million for the year ended December 31, 2007. The acquisition of Teledrift, Inc. contributed more than 50% of the growth in Drilling Products revenues in 2008. Organic growth related to tool rentals, services and inspection and the expansion of our mud motor fleet contributed the balance of the segments revenue increase. While our initiative to develop Flotek shock subs and drilling jars replacing sub-rentals had a minimal positive impact on 2008, we anticipate the benefits of these initiatives to be realized in the first half of 2009. Our operational integration efforts related to Teledrift, have provided the domestic and international oil and gas industry with inexpensive, measurement while drilling (MWD) tools designed and optimized for vertical and horizontal well drilling, increasing Teledrift’s post acquisition contribution to revenues beyond our initial estimates.
(Loss) from operations was ($43.8) million in 2008. Adjusting for the effect of the Impairment of $59.1 million relating to goodwill ($55.6) million and other intangible assets ($3.5) million related to this segment, Adjusted income from operations was $15.3 million for the year ended December 31, 2008, approximately 170% higher than in 2007. Adjusted income from operations as a percentage of revenues increased to 15.6% for the year ended December 31, 2008. The increase in Adjusted income from operations was primarily driven by the acquisition of Teledrift and our expansion into higher margin tools, motors and services. We made strategic investments in new North American sales facilities and opened two new repair facilities.
The Drilling Products segment requires higher levels of capital expenditures than our other segments. Capital expenditures in the current year were approximately $19.8 million for the drilling segment compared to $8.5 million in 2007. Due to current market conditions that began to develop late in the year and limitations on capital expenditures included in our Senior Credit Facility, as amended, we plan to reduce capital spending in this segment by more than 50% in 2009 from 2008 levels. Our plan is designed to meet our maintenance capital requirements and provide opportunity to grow our business in the area of higher margin drilling jars and seal-bearing motors as part of our strategic drilling products suite.
We anticipate rig count to continue to fall in 2009 continuing the trend we saw develop late in 2008. We are taking action to size the Drilling Products segment to the current marketplace through strategic actions that are focused on personnel and our fixed cost. Our actions are expected to provide us with the greatest flexibility to capitalize on the anticipated return to more normal market conditions in the near future. Pricing remains very
39
Table of Contents
competitive and we will aggressively defend our market share with competitive pricing and margin protection through technology bundling with commodities. We intend to continue the initiative of replacing sub-rented drilling jars and shock subs with higher margin proprietary tools. Additionally, we intend to continue to grow our presence in the international market through CAVO mud motors and the Teledrift line of MWD products including the TelePulse MWD for horizontal drilling that is scheduled for introduction in 2009.
Results for 2007 compared to 2006—Drilling Products
Drilling Products revenue for the year ended December 31, 2007 were $56.8 million, an increase of 54.6%, compared to $36.8 million for the year ended December 31, 2006. Growth in rentals and services associated with the acquisitions and the expansion of our mud motor fleet contributed significantly to the increase. In January 2007 we acquired the assets of Triumph Drilling Tools, a drilling tool sales and rental provider in Texas, New Mexico, Louisiana, Oklahoma and Arkansas. Additionally, in January 2007 we acquired a 50% interest and subsequently acquired the remaining 50% interest in November 2007 in CAVO Drilling Motors, which specializes in the rental, service and sale of high performance mud motors. These acquisitions expanded machining, repair, tool rental and inspection service capability within our drilling products group. These acquisitions contributed approximately $18.5 million in revenue during 2007.
Income from operations decreased $0.7 million, or 11.0% for the year ended December 31, 2007 compared to the same period in 2006. Income from operations as a percentage of revenue decreased to 9.9% for the year ended December 31, 2007 compared to 17.2% for the same period in 2006. The decrease in operating profit as a percentage of revenue is due to increased indirect personnel and travel costs, and an incremental $2.9 million of depreciation and amortization associated with acquired assets.
| Artificial Lift |
||||||||||||
| For the Years Ended December 31, | ||||||||||||
| 2008 | 2007 | 2006 | ||||||||||
| (in thousands) | ||||||||||||
| Revenue |
$ | 18,445 | $ | 14,901 | $ | 13,344 | ||||||
| Income (Loss) from operations |
$ | (6,709 | ) | $ | 1,381 | $ | 1,514 | |||||
| Income (Loss) from operations % |
(36.4 | )% | 9.3 | % | 11.3 | % | ||||||
| Non–GAAP reconciliation: |
||||||||||||
| Income (Loss) from operations |
$ | (6,709 | ) | $ | 1,381 | $ | 1,514 | |||||
| Impairment of Goodwill and Other intangible assets |
8,552 | — | — | |||||||||
| Adjusted income from operations |
$ | 1,843 | $ | 1,381 | $ | 1,514 | ||||||
| Adjusted income from operations % |
10.0 | % | 9.3 | % | 11.3 | % | ||||||
Results for 2008 compared to 2007—Artificial Lift
Artificial Lift revenues for the year ended December 31, 2008 were $18.4 million, an increase of 23.8%, compared to $14.9 million for the year ended December 31, 2007. The increase in revenue is primarily a result of very active coal bed methane drilling in Wyoming, an increase in rod pump sales and a price increase implemented in August in response to an increase in our raw material costs. We opened two new repair facilities in North America to take advantage of market opportunities. We designed these facilities to be scalable to local market conditions.
(Loss) from operations was ($6.7) million for the year ended December 31, 2008, primarily as a result of the previously discussed Impairment charge. An impairment of $8.6 million relating to goodwill ($5.9) million and
40
Table of Contents
other intangible assets ($2.7) million was recorded related to this segment. Excluding the effect of the Impairment, Adjusted income from operations was $1.8 million or approximately 33.5% higher than Income from operations of $1.4 million in 2007. Adjusted income from operations as a percentage of revenue increased slightly to 10.0% for the year ended December 31, 2008. We made strategic investments in this segment by adding two new pump repair facilities and increased our field sales presence.
Consistent with our strategy within our other two segments, we plan to reduce our operating cost structure to align with the current market conditions while maintaining flexibility that should allow us to capitalize on a return to a more normalized market. In the first quarter of 2009, we are closing one of our facilities in response to the dramatic decrease in our customers drilling activity in coal bed methane and related pricing pressures. Our strategy is to focus on competitive pricing and exceptional service by offering our proprietary downhole gas separator technology and Petrovalve rod pump systems, especially in the international market.
Results for 2007 compared to 2006—Artificial Lift
Artificial Lift revenue was $14.9 million for the year ended December 31, 2007, an 11.7% increase compared to $13.3 million for the same period in 2006. The increase in overall sales is due to the acquisition of two coal bed methane service companies in the second quarter of 2006 offset by an overall decline in coal bed methane activity in the Powder River Basin during 2007 as a result of lower wellhead gas prices in the Rocky Mountains, pipeline capacity constraints and a reduction in sales to a significant customer.
Income from operations as a percentage of revenue decreased to 9.3% for the year ended December 31, 2007 compared to 11.3% for the same period in 2006. The decrease in operating profit as a percentage of revenue is due to increased indirect personnel and travel costs, and an incremental $0.4 million of depreciation and amortization associated with acquired assets.
Capital Resources and Liquidity
Our on-going capital requirements arise primarily from our need to service our debt, to acquire and maintain equipment, to fund our working capital requirements and to complete acquisitions. We have funded our capital requirements with operating cash flows, debt borrowings, and by issuing shares of common stock. We had cash and cash equivalents of approximately $0.2 million at December 31, 2008 compared to $1.3 million at December 31, 2007. We had availability under the revolving line of credit as of December 31, 2008 of approximately $1.0 million compared to approximately $9.3 million as of December 31, 2007.
Operating Activities
In the year ended December 31, 2008, we generated $24.9 million in cash from operating activities compared to $22.6 million in 2007. Net (Loss) for the year ended December 31, 2008 was ($34.1) million. Non-cash additions to net income in 2008 consisted of $13.8 million of depreciation and amortization, $3.6 million accretion of debt discount, a gain of $2.9 million on the sale of assets and $2.5 million related to the expensing of stock options as required under SFAS No. 123R. Depreciation and amortization increased from the prior year by approximately $7.3 million mainly as a result of the Teledrift and CAVO acquisitions and the expanded rental tool fleet.
During the year ended December 31, 2008, changes in working capital used approximately $3.4 million in cash, principally due to an increase of $14.5 million in inventory, an increase of $8.5 million in accounts receivable partially offset by an increase of $12.4 million in accounts payable and an increase of $7.5 million in accrued liabilities, including interest.
Investing Activities
During the year ended December 31, 2008, we used $117.2 million in investing activities consisting of the acquisition of Teledrift, Inc, for $98.0 million, less cash acquired and capital expenditures of $23.7 million partially offset by proceeds from the sale of assets of $4.6 million.
41
Table of Contents
Capital expenditures for 2008 were made to expand our rental tool fleet (primarily mud motors, MWD tools, shock subs and drilling jars), construct a new, larger Teledrift facility (which we occupied in February 2009) and purchase additional plant and machinery, primarily machines to repair motors and new research and development equipment.
Financing Activities
During the year ended December 31, 2008, net financing activities provided cash of $91.2 million. Our net repayments under our revolving line of credit totaled $27.6 million. We received proceeds net of debt issue costs from the issuance of convertible debt of approximately $110 million.
On February 4, 2008, the Company entered into a Second Amendment (the “Amendment”) to the Amended and Restated Credit Agreement, dated as of August 31, 2007, (the “Senior Credit Facility”), between the Company and Wells Fargo Bank, National Association. The Senior Credit Facility consisted of a revolving line of credit, an equipment term loan and two real estate term loans. The Amendment permitted the Company to consummate the acquisition of Teledrift, to issue up to $150.0 million in convertible senior notes due 2028 to fund the purchase price of Teledrift and to incur additional capital expenditures, and included new financial covenants and other amendments as described below.
The Amendment added various senior leverage ratio requirements and a Minimum Net Worth (as defined in the Senior Credit Facility) covenant to prohibit the Company’s Net Worth as of the end of each fiscal quarter, commencing with the quarter ending June 30, 2008, to be less than a calculated amount. “Net Worth” means the Company’s consolidated shareholder’s equity determined in accordance with GAAP. In addition, the Amendment increased interest rates under the Senior Credit Facility by adjusting the margin applicable to base rate advances and Eurodollar advances.
The Amendment provided that the Company not exceed the Leverage Ratio (as defined in the Senior Credit Facility) as of each fiscal quarter end. The Amendment increased the quarterly principal payment required to be made by the Company from $0.5 million to $2.0 million. We have made the required quarterly principal payments under this agreement through December 31, 2008.
On February 11, 2008, the Company entered into an underwriting agreement (the “Notes Underwriting Agreement”) with the subsidiary guarantors named therein (the “Guarantors”) and Bear, Stearns & Co. Inc. (the “Underwriter”). The Notes Underwriting Agreement related to the issuance and sale (the “Notes Offering”) of $100.0 million aggregate principal amount of the Company’s 5.25% Convertible Senior Notes due 2028 (the “Notes”). The Notes are guaranteed on a senior, unsecured basis by the Guarantors. Pursuant to the Notes Underwriting Agreement, the Company granted the Underwriter a 13-day over-allotment option to purchase up to an additional $15.0 million aggregate principal amount of Notes, which was exercised in full on February 12, 2008. The net proceeds received from the issuance of the Notes was approximately $111.8 million. We have made the required quarterly principal payments under this agreement including the amount payable on February 13, 2009.
The Company used the net proceeds from the Notes Offering to finance the acquisition of Teledrift and for general corporate purposes.
On March 31, 2008, the Company entered into a new credit agreement with Wells Fargo Bank, National Association (the “New Credit Agreement”). The New Credit Agreement provides for a revolving credit facility of a maximum of $25.0 million (the “New Revolving Credit Facility”) and a term loan facility of $40.0 million (the “New Term Loan Facility”) (collectively, the “New Senior Credit Facility”). The Company refinanced all but approximately $0.8 million of the outstanding indebtedness under its Senior Credit Facility with borrowings under the New Senior Credit Facility. The amount under the Senior Credit Facility that was not refinanced relates to certain existing real estate loans.
42
Table of Contents
The New Credit Agreement includes various covenants including a Minimum Net Worth covenant, Leverage Ratio, Fixed Charge Coverage Ratio, Senior Leverage Ratio and places limitations on capital expenditures, new indebtedness and acquisitions and certain other affirmative and negative covenants. Affirmative covenants include compliance with laws, various reporting requirements, visitation rights, maintenance of insurance, maintenance of properties, keeping of records and books of account, preservation of existence of assets, notification of adverse events, ERISA compliance, joint agreement with new subsidiaries, borrowing base audits and use of treasury management services. Negative covenants include limitations associated with liens, indebtedness, change in nature of business, transactions with affiliates, investments, distributions, subordinate debt, leverage ratio, fixed charge coverage ratio, consolidated net income, prohibition of fundamental changes, asset sales and capital expenditures.
The obligations of the Company under the New Credit Agreement are guaranteed by the Company’s subsidiaries and are secured by all present and future assets of the Company and its subsidiaries.
The New Revolving Credit Facility will mature and be payable in full on March 31, 2011. The maximum amount of credit available under the Revolving Credit Facility is equal to the lesser of $25 million or the sum of: (i) 85% of the Company’s eligible accounts receivable, plus (ii) 50% of the Company’s eligible inventory. The Company is required to repay the aggregate outstanding principal amount of the New Term Loan Facility in quarterly installments of $2.0 million each, commencing with the quarter ending June 30, 2008. All remaining amounts owed pursuant to the New Term Loan Facility mature and will be payable in full on March 31, 2011.
The New Credit Agreement requires that on April 15 of each year commencing with April 15, 2009, the Company must make a mandatory prepayment of principal on the New Term Loan Facility, equal to 50% of the Company’s excess cash flow for the previous calendar year. The Company is further required to make certain mandatory prepayments of the New Term Loan Facility upon the receipt of proceeds from any debt or equity issuances and also upon certain assets sales. In addition, if the outstanding balance under the New Term Loan Facility exceeds 75% of the appraised orderly liquidation value of the Company’s fixed assets at any time, the Company must reduce the New Term Loan Facility by such excess amount.
The Company may elect to treat an advance under the New Credit Agreement as either a “Base Rate Advance” or a “Eurodollar Advance.” For both Base Rate Advances and Eurodollar Advances, interest accrues based on a specified index rate, plus an “Applicable Margin,” which will vary from quarter to quarter. The index rate for the Base Rate Advances is the Adjusted Base Rate, which is defined as the greater of the bank’s prime rate of interest or a rate computed as described in the New Credit Agreement based on the interest applicable to certain federal securities, plus 0.5%. The rate of interest related to borrowings outstanding under the New Credit Agreement at December 31, 2008 was 5.14%.
The Company evaluated its goodwill and other intangible assets in the fourth quarter of 2008, and recorded an impairment of $67.7 million. As a result, we did not meet the Minimum Net Worth covenant contained within our credit agreement as of December 31, 2008. On February 25, 2009, we entered into a First Amendment and Temporary Waiver Agreement (the “Amendment”) with our lenders, which amended the terms of our New Credit Agreement dated as of March 31, 2008. The Amendment, among other things, increased the interest rate margins applicable to advances under the New Credit Agreement, decreased the aggregate revolving commitment under the New Credit Agreement to $15.0 million, and provides a temporary waiver of any breach by Flotek of the Minimum Net Worth covenant in the New Credit Agreement through the earlier of May 15, 2009 or the occurrence of certain other specified events. The Amendment also permits the Company to exchange shares of its common stock for up to $40.0 million of our Convertible Senior Notes.
Our financial projections for 2009 indicated that we could potentially be in non-compliance with the Leverage Ratio, Minimum Net Worth and Fixed Charge Coverage Ratio Covenants contained within our New Credit Agreement during 2009. Due to all of these factors, we negotiated a Second Amendment (the “Second Amendment”) to our New Credit Agreement with our lenders. The Second Amendment changes the manner in which our borrowing base is computed increases our interest rate and fees associated with borrowings under the
43
Table of Contents
New Credit Agreement, limits our permitted maximum capital expenditures to $8.0 million and $11.0 million for 2009 and 2010, respectively and established new covenants related to the Minimum Net Worth, Leverage and Fixed Charge Coverage Ratios.
The Second Amendment reduces the maximum amount of credit available under the Revolving Credit Facility by changing the manner in which our borrowing base is determined. The changes in our maximum available credit under this amended facility are described in the table below:
| Equal to the lesser of: |
New Credit Agreement | New Credit Agreement, As Amended | ||
| $25 million or |
$15 million or | |||
| 85% of the Company’s eligible accounts receivable, plus | 80% of the Company’s eligible accounts receivable, plus | |||
| 50% of the Company’s eligible inventory | 50% of the Company’s eligible inventory is limited to eligible inventory, limited to the lesser of $5.0 million or 50% of the Company’s borrowing base, as defined | |||
A summary of the changes to the Minimum Net Worth covenant, Leverage Ratio and Fixed Charge Coverage Ratio are as follows:
Minimum Net Worth:
| Criteria |
New Credit Agreement | New Credit Agreement, As Amended |
| ||||||
| Company’s net worth, plus |
As of the fiscal quarter ending December 31, 2007 | 80% | As of the fiscal quarter ending December 31, 2008 | 90 | % | ||||
| An amount equal to, plus |
Borrowers consolidated Net Income for each fiscal quarter ending after December 31, 2007 in which such consolidated Net Income is greater than $0 | 75% | Borrowers consolidated Net Income for each fiscal quarter ending after December 31, 2008 in which such consolidated Net Income is greater than $0 | 75 | % | ||||
| An amount equal to |
Equity issuance proceeds received by Borrower or any Subsidiary after December 31, 2007 | 100% | Equity issuance proceeds received by Borrower or any Subsidiary after December 31, 2008 | 100 | % | ||||
44
Table of Contents
Leverage Ratio:
| Criteria |
New Credit Agreement | New Credit Agreement, As Amended | ||||||
| Period | Covenant | Period | Covenant | |||||
| Borrower shall not permit the Leverage Ratio as of the end of the period to be more than: | For each fiscal quarter ending prior to September 30, 2008 | 3.50 to 1.00 |
||||||
| For each fiscal quarter ending on or after September 30, 2008 but prior to March 31, 2009 | 3.00 to 1.00 |
|||||||
| For each fiscal quarter ending prior to March 31, 2009 | 3.00 to 1.00 | |||||||
| For each fiscal quarter ending on or after March 31, 2009 but prior to September 30, 2009 | 2.75 to 1.00 |
For fiscal quarter ending on March 31, 2009 | 3.35 to 1.00 | |||||
| For fiscal quarter ending on June 30, 2009 | 3.95 to 1.00 | |||||||
| For each fiscal quarter ending on or after September 30, 2009 | 2.50 to 1.00 |
For fiscal quarter ending on September 30, 2009 | 4.80 to 1.00 | |||||
| For fiscal quarter ending on December 31, 2009 | 5.30 to 1.00 | |||||||
| For fiscal quarter ending on March 31, 2010 | 4.60 to 1.00 | |||||||
| For fiscal quarter ending on June 30, 2010 | 3.90 to 1.00 | |||||||
| For fiscal quarter ending on September 30, 2010 | 3.40 to 1.00 | |||||||
| For each fiscal quarter ending on or after December 30, 2010 | 3.10 to 1.00 | |||||||
45
Table of Contents
Fixed Charge Coverage Ratio
| Criteria |
New Credit Agreement | New Credit Agreement, As Amended | ||||||
| Period | Covenant | Period | Covenant | |||||
| Borrower shall not permit the Fixed Charge Coverage Ratio for the period described to be less than: | For each fiscal quarter | 1.25 to 1.00 |
For each fiscal quarter ending prior to March 31, 2009 | 1.25 to 1.00 | ||||
| For fiscal quarter ending on December 31, 2009 | 1.10 to 1.00 | |||||||
| For each fiscal quarter ending after December 31, 2009 | 1.25 to 1.00 | |||||||
Interest accrues on amounts under the New Credit Facility at variable rates based on, at the Company’s election, the prime rate or LIBOR, plus an applicable margin specified in the New Credit Agreement as amended by the Second Amendment. A minimum of 50% of Advances as defined in the New Credit Agreement must be swapped from a floating to a fixed interest rate. At December 31, 2008, $23 million of the debt was swapped to a 3.32% fixed rate.
As of December 31, 2008, we had $2.3 million outstanding under the revolving line of credit of the New Senior Credit Facility. Availability under the revolving line of credit as of December 31, 2008 was approximately $1.0 million As of December 31, 2008 the Company had approximately $0.8 million in vehicle loans and capitalized vehicle leases. As of December 31, 2008 we were in compliance with all covenants with the exception of the Minimum Net Worth covenant as described above. The New Credit Agreement provides that the indebtedness subject to the New Credit Agreement may be accelerated and be declared immediately due and payable upon the occurrence of events of default specified in the New Credit Agreement, subject in certain cases to a requirement that the Company be afforded notice and a right to cure such default, as specified in the New Credit Agreement. The amounts due under the Notes may also be accelerated if we fail to pay principal or interest timely, or amounts due under the New Credit Agreement are accelerated, or for other reasons as defined in our agreement with the holders of the Notes. Management believes that the Company has adequate resources through a combination of cash flows and available credit to meet its current obligations and debt repayment requirements.
Contractual Obligations
| Payments Due by Period | |||||||||||||||
| Total | Less than 1 year |
1-3 years | 4-5 years | More than 5 years | |||||||||||
| (in thousands) | |||||||||||||||
| Long-term debt obligations |
$ | 152,613 | $ | 8,585 | $ | 29,028 | $ | — | $ | 115,000 | |||||
| Interest Obligations on Long-term debt |
120,000 | 6,000 | 12,000 | 12,000 | 90,000 | ||||||||||
| Capital lease obligations |
882 | 432 | 311 | 139 | — | ||||||||||
| Interest on Capital lease obligations |
107 | 53 | 48 | 6 | — | ||||||||||
| Operating lease obligations |
7,813 | 1,898 | 2,843 | 1,569 | 1,503 | ||||||||||
| Total |
$ | 281,415 | $ | 16,968 | $ | 44,230 | $ | 13,714 | $ | 206,503 | |||||
46
Table of Contents
Critical Accounting Policies and Estimates
Our consolidated financial statements have been prepared in accordance with accounting principles generally accepted in the United States of America. Preparation of these statements requires management to make judgments and estimates. Some accounting policies have a significant impact on amounts reported in these financial statements. A summary of significant accounting policies can be found in Note 1 in the Notes to Consolidated Financial Statements. We have also identified certain accounting policies that we consider critical to understanding our business and our results of operations and we have provided below additional information on those policies.
Consolidation Policy
The accompanying consolidated financial statements include the accounts of the Company and its wholly-owned subsidiary corporations, after elimination of all material intercompany accounts, transactions, and profits. The Company does not have any investment in unconsolidated subsidiaries or non-marketable investments.
Acquisitions
Acquisitions have been accounted for using the purchase method of accounting under SFAS No. 141 “Accounting for Business Combinations”. The acquired companies’ results have been included in the accompanying financial statements from their respective dates of acquisition. Allocation of the purchase price for acquisitions was based on the estimates of fair value of the net assets acquired and is subject to adjustment upon finalization of the purchase price allocation within the one year anniversary of the acquisition. We have not made any acquisitions under SFAS 141R, “Business Combinations” as of December 31, 2008.
Inventories
Inventories consist of raw materials, finished goods and work-in-process. Finished goods inventories include raw materials, direct labor and production overhead. Inventories are carried at the lower of cost or market using the weighted average cost method. The Company maintains a reserve for slow-moving and obsolete inventories, which is reviewed for adequacy on a periodic basis.
Revenue Recognition
Revenue for product sales is recognized when all of the following criteria have been met: (i) evidence of an agreement exists, (ii) products are shipped or services rendered to the customer and all significant risks and rewards of ownership have passed to the customer, (iii) the price to the customer is fixed and determinable and (iv) the collectibility is reasonably assured. Accounts receivable are recorded at that time net of any discounts. Earnings are charged with a provision for doubtful accounts based on a current review of collectibility of the accounts receivable. Accounts receivable deemed ultimately uncollectible are applied against the allowance for doubtful accounts. Deposits and other funds received in advance of delivery are deferred until the transfer of ownership is complete. Our logistics division recognizes revenue of its design and construction oversight contracts under the percentage-of-completion method of accounting, measured by the percentage of costs incurred to date to the total estimated costs of completion. This percentage is applied to the total estimated revenue at completion to calculate revenue earned to date. Contract costs include all direct labor and material costs and those indirect costs related to manufacturing and construction operations. General and administrative costs are charged to expense as incurred. Changes in job performance and estimated profitability, including those arising from contract bonus or penalty provisions and final contract settlements, may result in revisions to costs and income and are recognized in the period in which such revisions appear probable. All known or anticipated losses on contracts are recognized in full when such amounts become apparent.
47
Table of Contents
Within the Drilling Products segment payments from customers for the cost of oilfield rental equipment that is damaged or lost-in-hole are reflected as revenue with the carrying value of the related equipment charged to cost of sales. This amount totaled $4.4, $2.1 and $0.4 million for the years ended December 31, 2008, 2007 and 2006, respectively.
Property, Plant and Equipment
Property, plant and equipment are stated at cost. The cost of ordinary maintenance and repairs is charged to operations, while replacements and major improvements are capitalized. Depreciation or amortization is provided at rates considered sufficient to amortize the cost of the assets, net of estimated salvage value, using the straight-line method over the following estimated useful lives:
| Buildings and leasehold improvements |
3-39 years | |
| Machinery, equipment and rental tools |
3-7 years | |
| Furniture and fixtures |
3-7 years | |
| Transportation equipment |
3-5 years | |
| Computer equipment |
3-5 years |
We review long-lived assets for impairment whenever events or changes in circumstances indicate that the carrying amount of an asset may not be recoverable. Recoverability of assets to be held and used is measured by a comparison of the carrying amount of an asset to future net cash flows expected to be generated by the asset. If such assets are considered to be impaired, the impairment recognized is measured by the amount by which the carrying amount of the assets exceeds either the fair value or the estimated discounted cash flows of the assets, whichever is more readily measurable. Assets to be disposed of are reported at the lower of the carrying amount or fair value less costs to sell.
Research and Development Costs
Expenditures for research activities relating to product development and improvement are charged to expense as incurred.
Goodwill
Goodwill represents the excess of the aggregate price paid by us in acquisitions over the fair market value of the tangible and identifiable intangible net assets acquired.
Intangible and Other Assets
Separable intangible and other assets that are not deemed to have indefinite lives are amortized on a straight-line over their useful lives which range from 2 to 15 years
Impairment Valuation
We test goodwill for impairment on an annual basis at a reporting unit level in the fourth quarter of every year. Impairment is a condition that exists when the carrying amount of goodwill exceeds its implied fair value. Testing of goodwill requires the use of a two step impairment test that identifies potential goodwill impairment and measures the amount of an impairment loss to be recognized (if any). We began our process of testing goodwill by assessing our reporting segments and units. A reporting unit is an operating segment or one level below an operating segment (referred to as a component). A component of an operating segment is a reporting unit if the component constitutes a business for which discrete financial information is available and segment management regularly reviews the operating results of that component. However, two or more components of an operating segment should be aggregated and deemed a single reporting unit if the components have similar economic characteristics. An operating segment shall be deemed to be a reporting unit if all of its components are similar, if none of its components is a reporting unit, or if it comprises only a single component.
48
Table of Contents
The first step of the goodwill impairment test compares the fair value of a reporting unit with its carrying amount, including goodwill. If the fair value of a reporting unit exceeds its carrying amount, goodwill of the reporting unit is considered not impaired, thus the second step of the impairment test is unnecessary. If the carrying amount of a reporting unit exceeds its fair value, the second step of the test shall be performed to measure the amount of impairment loss, if any.
The second step of the goodwill impairment test, is used to measure the amount of impairment loss, compares the implied fair value of a reporting unit’s goodwill with the carrying amount of that goodwill. The implied fair value of goodwill is determined in a manner similar to determining the amount of goodwill recognized in a business combination. Accordingly, we assigned the fair value of a reporting unit to all of the assets and liabilities of that unit (including any unrecognized intangible assets) as if the reporting unit had been acquired in a business combination. The excess of the fair value of a reporting unit over the amounts assigned to its assets and liabilities is the implied fair value of goodwill. We performed that assignment process only for purposes of testing goodwill for impairment and did not write up or write down a recognized asset or liability, nor did we recognize a previously unrecognized intangible asset as a result of this allocation process. We determined that the carrying amount of reporting unit goodwill exceeded the implied fair value of that goodwill for each of the three reporting units mentioned above and recognized an impairment loss equal to that excess.
An impairment loss shall be recognized only if the carrying amount of a long-lived asset is not recoverable and exceeds its fair value. The carrying amount of a long-lived asset is not recoverable if it exceeds the sum of the undiscounted cash flows expected to result from the use and eventual disposition of the asset. That assessment shall be based on the carrying amount of the asset at the date it is tested for recoverability. A long-lived asset shall be tested for recoverability whenever events or changes in circumstances indicate that its carrying amount may not be recoverable. Due to the significantly changing business conditions late in the fourth quarter of 2008, we determined a test our long-lived assets for potential impairment was appropriate.
Based on our testing process, we recognized $61.5 million of goodwill impairment charges and an additional charge of $6.2 million related to the impairment of other intangible assets, primarily, customer lists and patents in 2008. While the value of goodwill and other intangible assets are substantially reduced, should future results or economic events cause a change in our projected cash flows, or should our operating plans or business model change, future determinations of fair value may not support the carrying amount of these assets.
Income Taxes
Our income tax expense is based on our income, statutory tax rates and tax planning opportunities available to us in the various jurisdictions in which we operate. We provide for income taxes based on the tax laws and rates in effect in the countries in which operations are conducted and income is earned. Our income tax expense is expected to fluctuate from year to year as our operations are conducted in different taxing jurisdictions and the amount of pre-tax income fluctuates.
The determination and evaluation of our annual income tax provision involves the interpretation of tax laws in various jurisdictions in which we operate and requires significant judgment and the use of estimates and assumptions regarding significant future events such as the amount, timing and character of income, deductions and tax credits. Changes in tax laws, regulations and our level of operations or profitability in each jurisdiction may impact our tax liability in any given year. While our annual tax provision is based on the information available to us at the time, a number of years may elapse before the ultimate tax liabilities in certain tax jurisdictions are determined.
Current income tax benefit reflects an estimate of our income tax liability for the current year, withholding taxes, changes in tax rates and changes in prior year tax estimates as returns are filed. Deferred tax assets and liabilities are recognized for the anticipated future tax effects of temporary differences between the financial statement basis and the tax basis of our assets and liabilities using the enacted tax rates in effect at year end. A valuation
allowance for deferred tax assets is recorded when it is more-likely-than-not that the benefit from the deferred tax
49
Table of Contents
asset will not be realized. We provide for uncertain tax positions pursuant to FASB Interpretation No. 48, “Accounting for Uncertainty in Income Taxes—an Interpretation of FASB Statement No. 109” (“FIN 48”). Our policy is that we recognize interest and penalties accrued on any unrecognized tax benefits as a component of income tax expense. In 2008 the Company closed the 2005 and 2006 Internal Revenue Service audits with no material impact to the Company. The Company and its subsidiaries’ state income tax returns are open to audit under the statute of limitations for the years ending December 31, 2005 through 2007.
It is our intention to permanently reinvest all of the undistributed earnings of our non-U.S. subsidiaries in such subsidiaries. Accordingly, we have not provided for U.S. deferred taxes on the undistributed earnings of our non-U.S. subsidiaries. If a distribution is made to us from the undistributed earnings of these subsidiaries, we could be required to record additional taxes. Because we cannot predict when, if at all, we will make a distribution of these undistributed earnings, we are unable to make a determination of the amount of unrecognized deferred tax liability.
Fair Value and Financial Instruments
The Company adopted FAS 157 as of January 1, 2008, except as it applies to those nonfinancial assets and nonfinancial liabilities addressed in FASB Staff Position FAS 157-2 (“FSP FAS 157-2”), which defines fair value, establishes a frame work for measuring fair value and establishes a valuation hierarchy for disclosure of the inputs to the valuation used to measure fair value. The implementation of FAS 157 did not cause a change in the method of calculating fair value of assets and liabilities. The primary impact from the adoption was additional disclosures. FSP FAS 157-2 delayed the effective date of FAS No. 157 to fiscal years beginning after November 15, 2008 for all nonfinancial assets and nonfinancial liabilities, except those that are recognized or disclosed at fair value in the financial statements on a recurring basis (at least annually).
The valuation hierarchy categorizes assets and liabilities measured at fair value into one of three different levels depending on the observability of the inputs employed in the measurement. A financial asset or liability’s classification within the hierarchy is determined based on the lowest level input that is significant to the fair value measurement. The Company’s assessment of the significance of a particular input to the fair value measurement in its entirety requires judgment and considers factors specific to the asset or liability. The Company measures its Convertible Senior Notes at fair value by utilizing quoted prices for similar liabilities in active markets or inputs that are observable for the liability, either directly or indirectly through market corroboration, for substantially the full term of the financial instrument, market information and commonly accepted valuation methodologies. The use of different assumptions and/or estimation methodologies may have a material effect on the estimated fair value.
We adopted Statement of Financial Accounting Standards No. 159, “The Fair Value Option for Financial Assets and Financial Liabilities” (“FAS 159”) on January 1, 2008. FAS 159, provides an option to report selected financial assets and liabilities at fair value and establishes presentation and disclosure requirements. As we did not elect to measure existing assets and liabilities at fair value, the adoption did not have an effect on our financial statements.
We have no off-balance sheet debt or other off-balance sheet financing arrangements. We have entered into an interest rate swap agreement on 50% of the New Term Loan Facility to partially reduce our exposure to interest rate risk as required by the Senior Credit Agreement.
Use of Estimates
The preparation of financial statements in conformity with accounting principles generally accepted in the United States of America requires management to make estimates and certain assumptions that affect the reported amounts of assets and liabilities and disclosure of contingent liabilities at the date of the financial statements and the reported amounts of revenue and expenses during the reporting period. While management believes current estimates are reasonable and appropriate, actual results could differ from these estimates.
50
Table of Contents
Significant Trends, Developments and Uncertainties
As 2008 progressed, early optimism of continuing growth in oil and natural gas exploration and production activity was dampened by growing evidence of weakening economic conditions that began to significantly impact the energy markets in early October. While such weakening did not prevent oil prices from ramping up steeply to highs of approximately $150-per-barrel in July, the velocity of the subsequent reversal to under $40-per-barrel by the end of the year was supported by economic reports and forecasts that confirmed the majority of the OECD (Organization for Economic Co-operation and Development) countries to be in recession by the end of the third quarter. Consequently, global oil demand forecasts for 2008 dropped from quarter to quarter and it became apparent that moderating oil demand growth in the non-OECD economies would no longer be sufficient to offset a continuing three-year demand decline within the OECD countries. As a result, 2008 saw the first global oil demand decrease in 25 years. In the fourth quarter OPEC elected to cut production by a total of 3.7 million barrels per day to remove supply and support prices. However, the time taken for these cuts to be felt in the market, and for the resultant increased spare capacity to be reabsorbed by future growth, was large enough for E&P customers to cut investment. This translated to lower demand and weaker prices for oilfield services in an increasing number of areas late in the fourth quarter.
The natural gas markets presented a similar picture. While activity was initially maintained in the first part of the year, the developing recession in the latter part of 2008 led to lower industrial demand in the developed economies although commercial and residential demand was maintained. In North America, supply increased in 2008 largely as a result of industry deployment of advanced drilling, production and completion technologies leading to higher gas production and consequently greater storage levels in spite of lower Canadian imports and decreased LNG (Liquified Natural Gas) supplies. Consequently, more LNG became available for other international importers and, as a result, the majority of the developed economies are well supplied for their needs. Within the United States, the world’s largest natural gas market, this translated to reduced gas exploration and production investment with lower demand for oilfield services and consequent pressure on service pricing in a number of areas by the fourth quarter as the market price of natural gas fell. In international markets however, increasing demand for natural gas in the developing economies led to sustained drilling activity with drilling rigs previously deployed on oil exploration and development moving to natural gas activity in some regions.
The recent worldwide financial and credit crisis has reduced the availability of liquidity and credit to fund the continuation and expansion of industrial business operations worldwide. The shortage of liquidity and credit combined with recent substantial losses in worldwide equity markets could lead to an extended worldwide economic recession. A slowdown in economic activity caused by a recession would likely reduce worldwide demand for energy and result in lower oil and natural gas prices. Forecasted crude oil prices for 2009 have dropped substantially from the end of 2008. Demand for our services and products depends on oil and natural gas industry activity and expenditure levels that are directly affected by trends in oil and natural gas prices. Demand for our services and products is particularly sensitive to the level of exploration, development, and production activity of, and the corresponding capital spending by, oil and natural gas companies, including national oil companies. Any prolonged reduction in oil and natural gas prices will depress the immediate levels of exploration, development, and production activity.
We therefore expect 2009 activity to weaken across the board, with the most significant declines occurring in North American gas drilling, Russian oil production enhancement, and in mature offshore basins. Exploration offshore will also be somewhat curtailed but commitments already planned are likely to be honored. Furthermore, pricing erosion will compound these effects on revenue. In this market we are taking the necessary actions early in 2009 to adjust our operating cost base while preserving our long-term commitments to technology development, key skill sets and service and product quality.
The most important indicator of a future recovery in oilfield services activity will be a stabilization and recovery in the demand for oil. The recent years of increased exploration and production spending, however, have not been sufficient to substantially improve the supply situation. The age of the production base, accelerating decline
51
Table of Contents
rates and the smaller size of recently developed fields should mean that any prolonged reduction in investment will lead to a strong rebound in activity in the future.
Inflation and Seasonality
Although we cannot determine the precise effects of inflation on our business, we do not believe inflation has had a material impact on our sales or the results of our operations. However, certain raw materials used by the Chemical and Logistics segment in the manufacture of our proprietary, ‘green’ chemical sales are available from limited sources and disruptions to our suppliers could materially impact our sales. The prices paid by the Company for its raw materials may be affected by, among other things, energy, steel and other commodity prices; tariffs and duties on imported materials; foreign currency exchange rates; the general business cycle and global demand. The Company experienced greater difficulty in securing the necessary supplies of certain chemicals in 2008 than it experienced during the preceding several years. During 2008, the prices of many raw materials rose considerably, though towards the end of 2008, we began to see prices decline. We have not always been successful in passing on higher raw material costs to our customers and accordingly any significant changes in the prices of these raw materials may have a negative impact on our margins and income from operations.
Certain working capital components may build and recede during the year reflecting established selling cycles, but we do not consider our operations to be highly-seasonal. Additionally, business cycles can impact our operations and financial position when compared to other periods. On an overall basis, our operations are not generally affected by seasonality. Weather and natural phenomena can temporarily affect the performance of our services. Examples of how such phenomena can impact our business include:
| • | the severity and duration of the winter in North America can have a significant impact on gas storage levels and drilling activity for natural gas; |
| • | the timing and duration of the spring thaw in Canada directly affects activity levels due to road restrictions; |
| • | hurricanes can disrupt coastal and offshore operations; |
In addition, due to higher spending near the end of the year by customers the results of operations of the Chemical and Logistics segment are generally stronger in the fourth quarter of the year than at the beginning of the year. The results of operations of our Artificial Lift segment are generally weaker in the second quarter due to restrictions on drilling on federal lands due to the breeding season of certain bird species.
Recent Accounting Pronouncements
Effective January 1, 2009, the Company adopted FASB Staff Position No. EITF 03-6-1, Determining Whether Instruments Granted in Share-Based Payment Transactions Are Participating Securities (“FSP EITF 03-6-1”). This Staff Position states that unvested share-based payment awards that contain non-forfeitable rights to dividends or dividend equivalents (whether paid or unpaid) are participating securities and shall be included in the computation of earnings per share pursuant to the two-class method. FSP EITF 03-6-1 is effective for financial statements issued for fiscal years beginning after December 15, 2008, and interim periods within those years. However, once adopted, FSP EITF 03-6-1 requires retrospective application within its scope as they existed for all periods presented.
Additionally, effective January 1, 2009, the Company adopted FASB Staff Position APB 14-1, Accounting for Convertible Debt Instruments That May Be Settled in Cash Upon Conversion (including Partial Cash Settlement) (FSP 14-1), which clarifies the accounting for convertible debt instruments that may be settled in cash (including partial cash settlement) upon conversion. FSP 14-1 requires issuers of convertible debt instruments within its scope to separately account for the liability and equity components of the instruments in a manner that reflects the issuer’s nonconvertible debt borrowing rate when interest cost is recognized. FSP 14-1 requires bifurcation of
52
Table of Contents
a component of the debt, classification of that component in equity and the accretion of the resulting discount on the debt to be recognized as part of interest expense in the issuer’s consolidated results of operations. FSP 14-1 is effective for the Company as of January 1, 2009 and early adoption was not permitted. However, once adopted, FSP 14-1 requires retrospective application to the terms of instruments within its scope as they existed for all periods presented. In applying FSP 14-1, $27.8 million of the carrying value of our Convertible Notes was reclassified to equity as of the February 2008 issuance date and offset by a related deferred tax liability of $10.6 million, assuming the effective tax rate at inception of the Convertible Notes was 38%. This discount represents the equity component of the proceeds from the Convertible Notes, calculated assuming an 11.5% non-convertible borrowing rate. The discount will be accreted to interest expense over the expected term of five years, which is based on the call/put option on the debt at February 2013. Accordingly, $3.6 million of additional non-cash interest expense was recorded in the Consolidated Statement of Income (Loss) and Comprehensive Income (Loss) for the year ended December 31, 2008.
The Company has determined the effect of the adoption of FSP EITF 03-6-1 for fiscal year 2007 to be immaterial and there is no effect on fiscal year 2006 as the Company had no participating securities. Accordingly, as a result of the adoption of FSP EITF 03-6-1 and FSP 14-1, the Company has retrospectively revised certain amounts included in these financial statements as of December 31, 2008 as follows:
| December 31, 2008 | ||||||||
| As reported |
As adjusted |
|||||||
| (in thousands) | ||||||||
| Deferred tax assets, less current portion |
$ | 15,835 | $ | 6,640 | ||||
| TOTAL ASSETS |
243,770 | 234,575 | ||||||
| Convertible senior notes, net of discount |
115,000 | 90,803 | ||||||
| Additional paid-in capital |
59,566 | 76,788 | ||||||
| Retained earnings (deficit) |
(8,477 | ) | (10,697 | ) | ||||
| Total stockholders’ equity |
50,719 | 65,721 | ||||||
| TOTAL LIABILITIES AND STOCKHOLDERS’ EQUITY |
243,770 | 234,575 | ||||||
| Year Ended December 31, 2008 |
||||||||
| As reported |
As adjusted |
|||||||
| (in thousands, except per share data) |
||||||||
| Interest expense |
$ | (10,233 | ) | $ | (13,813 | ) | ||
| Total other income (expense) |
(10,329 | ) | (13,909 | ) | ||||
| Loss before taxes |
(41,080 | ) | (44,660 | ) | ||||
| Benefit for income taxes |
9,139 | 10,499 | ||||||
| Net loss |
(31,941 | ) | (34,161 | ) | ||||
| Basic earnings (loss) per common share |
(1.69 | ) | (1.78 | ) | ||||
| Diluted earnings (loss) per common share |
(1.69 | ) | (1.78 | ) | ||||
| Weighted average common shares used in computing basic earnings (loss) per common share |
18,867 | 19,157 | ||||||
| Weighted average common shares used in computing diluted earnings (loss) per common share |
18,867 | 19,157 | ||||||
Various supporting amounts included in the Statements of Consolidated Cash Flows and these Notes to Consolidated Financial Statements have also been retrospectively revised in connection with the changes noted above. No other changes from the amounts or disclosures originally reflected in the Company’s Annual Report
53
Table of Contents
on Form 10-K for the year ended December 31, 2008, filed with the U.S. Securities and Exchange Commission on March 16, 2009, have been included in these consolidated financial statements
In May 2008, the Financial Accounting Standards Board (the “FASB”) issued FAS No. 162, “The Hierarchy of Generally Accepted Accounting Principles” (“FAS 162”). This statement identifies the sources of accounting principles and the framework for selecting the principles used in the preparation of financial statements of nongovernmental entities that are presented in accordance with GAAP. With the issuance of this statement, the FASB concluded that the GAAP hierarchy should be directed toward the entity and not its auditor, and reside in the accounting literature established by the FASB as opposed to the American Institute of Certified Public Accountants (AICPA) Statement on Auditing Standards No. 69, “The Meaning of Present Fairly in Conformity With Generally Accepted Accounting Principles.” This statement is effective 60 days following the SEC’s approval of the Public Company Accounting Oversight Board amendments to AU Section 411, “The Meaning of Present Fairly in Conformity With Generally Accepted Accounting Principles.” The adoption of FAS 162 is not expected to have a material impact on the Company’s results from operations or financial position.
In April 2008, the FASB issued FSP 142-3, “Determination of the Useful Life of Intangible Assets”, (FSP 142-3). FSP 142-3 amends the factors that should be considered in developing renewal or extension assumptions used to determine the useful life of a recognized intangible asset under SFAS No. 142, “Goodwill and Other Intangible Assets”. FSP 142-3 is effective for fiscal years beginning after December 15, 2008. The implementation of this standard will not have a material impact on our consolidated financial position and results of operations.
In March 2008, the FASB issued FAS No. 161, “Disclosures about Derivative Instruments and Hedging Activities-an amendment of FASB Statement No. 133” (“FAS No. 161”). This statement requires enhanced disclosures about our derivative and hedging activities. This statement is effective for financial statements issued for fiscal years and interim periods beginning after November 15, 2008. We will adopt FAS No. 161 beginning January 1, 2009. We are currently evaluating the impact, if any, that the standard will have on our consolidated financial statements.
In December 2007, the FASB issued FAS No. 160, “Non-controlling Interests in Consolidated Financial Statements—an amendment of ARB No. 51”, (“FAS No. 160”). FAS No. 160 requires (i) that non-controlling (minority) interests be reported as a component of shareholders’ equity, (ii) that net income attributable to the parent and to the non-controlling interest be separately identified in the consolidated statement of operations, (iii) that changes in a parent’s ownership interest while the parent retains its controlling interest be accounted for as equity transactions, (iv) that any retained non-controlling equity investment upon the deconsolidation of a subsidiary be initially measured at fair value, and (v) that sufficient disclosures are provided that clearly identify and distinguish between the interests of the parent and the interests of the non-controlling owners. FAS No. 160 is effective for annual periods beginning after December 15, 2008 and should be applied prospectively. The presentation and disclosure requirements of the statement shall be applied retrospectively for all periods presented. We adopted FAS No. 160 on January 1, 2009 and there was no impact on our financial statements. Retroactive application of FAS 160 will have an effect on the presentation of our financial statements related to December 31, 2007.
In December 2007, the FASB issued Statement of Financial Accounting Standards No. 141R, Business Combinations (“FAS 141R”), to replace Statement of Financial Accounting Standards No. 141, Business Combinations (“FAS 141”). FAS 141R requires use of the acquisition method of accounting, defines the acquirer, establishes the acquisition date and broadens the scope to all transactions and other events in which one entity obtains control over one or more other businesses. This statement is effective for financial statements issued for fiscal years beginning on or after December 15, 2008 with earlier adoption prohibited. While the Company does not expect the adoption of FAS 141R to have a material impact on its consolidated financial statements for transactions completed prior to December 31, 2008, the impact of the accounting change could be material for business combinations which may be consummated subsequent thereto.
54
Table of Contents
In February 2007, the FASB issued Statement of Financial Accounting Standards No. 159, “The Fair Value Option for Financial Assets and Financial Liabilities” (“FAS 159”). FAS 159, provides an option to report selected financial assets and liabilities at fair value and establishes presentation and disclosure requirements. The fair value option established by FAS 159 permits the Company to elect to measure eligible items at fair value on an instrument-by-instrument basis and then report unrealized gains and losses for those items in the Company’s earnings. FAS 159 is effective for fiscal years beginning after November 15, 2007. We adopted FAS 159 on January 1, 2008. As we did not elect to measure existing assets and liabilities at fair value, the adoption did not have an effect on our financial statements.
Forward-Looking Statements
The Private Securities Litigation Reform Act of 1995 (the “Act”) provides protection from liability in private lawsuits for “forward-looking” statements made by public companies under certain circumstances, provided that the public company discloses with specificity the risk factors that may impact its future results. We want to take advantage of the “safe harbor” provisions of the Act. This Annual Report contains both historical information and other information that you can use to infer future performance. Examples of historical information include our annual financial statements and the commentary on past performance contained in our MD&A. While we have specifically identified certain information as being forward-looking in the context of its presentation, we caution you that, with the exception of information that is historical, all the information contained in this Annual Report should be considered to be “forward-looking statements” as referred to in the Act. Without limiting the generality of the preceding sentence, any time we use the words “estimate,” “project,” “intend,” “expect,” “believe,” “anticipate,” “continue” and similar expressions, we intend to clearly express that the information deals with possible future events and is forward-looking in nature. Certain information in our MD&A is clearly forward-looking in nature, and without limiting the generality of the preceding cautionary statements, we specifically advise you to consider all of our MD&A in the light of the cautionary statements set forth herein.
Forward-looking information involves future risks and uncertainties. Much of the information in this report that looks towards future performance of our company is based on various factors and important assumptions about future events that may or may not actually come true. As a result, our operations and financial results in the future could differ materially and substantially from those we have discussed in the forward-looking statements in this Report. Significant factors that could impact our future results are provided in Item 1A. Risk Factors included in our 2008 Annual Report on Form 10-K. Other risk factors are incorporated into the text of our MD&A, which should itself be considered a statement of future risks and uncertainties, as well as management’s view of our businesses.
| Item 7A. | Quantitative and Qualitative Disclosures About Market Risk |
We are exposed to financial instrument market risk from changes in interest rates, and, to a limited extent, commodity prices and foreign currency exchange rates. Market risk is measured as the potential negative impact on earnings, cash flows or fair values resulting from a hypothetical change in interest rates or foreign currency exchange rates over the next year. We manage the exposure to market risks at the corporate level. The portfolio of interest-sensitive assets and liabilities is monitored and adjusted to provide liquidity necessary to satisfy anticipated short-term needs. Our risk management policies allow the use of specified financial instruments for hedging purposes only; speculation on interest rates or foreign currency rates is not permitted. We do not consider any of these risk management activities to be material. Our Senior Credit Facility has variable-rates. As required by the Senior Credit Facility, the Company has entered into an interest rate swap agreement on 50% of the New Term Loan Facility to partially reduce our exposure to interest rate risk.
The information that follows provides information about our market sensitive financial instruments and constitutes a “forward-looking statement.”
55
Table of Contents
Interest Rate Risk:
We are exposed to the impact of interest rate changes on our variable rate indebtedness within our credit facility. The impact on the average outstanding balance of our variable rate indebtedness during 2008 from a hypothetical 10% increase in interest rates would be an increase in interest expense of approximately $2.5 million.
56
Table of Contents
| Item 8. | Financial Statements and Supplementary Data. |
MANAGEMENT’S REPORT ON INTERNAL CONTROL OVER FINANCIAL REPORTING
We are responsible for establishing and maintaining adequate internal control over financial reporting as such term is defined by the Securities and Exchange Act of 1934 Rule 13a-15(f). Our internal controls are designed to provide reasonable assurance as to the reliability of our financial statements for external purposes in accordance with accounting principles generally accepted in the United States of America.
Internal control over financial reporting has inherent limitations and may not prevent or detect misstatements. Therefore, even those systems determined to be effective can provide only reasonable, not absolute, assurance with respect to the financial statement preparation and presentation. Further, because of changes in conditions, the effectiveness of internal control over financial reporting may vary over time.
Under the supervision and with the participation of our Chief Executive Officer and Chief Financial Officer, we have evaluated the effectiveness of our internal control over financial reporting as of December 31, 2008 as required by the Securities and Exchange Act of 1934 Rule 13a-15(c). In making its assessment, we have utilized the criteria set forth by the Committee of Sponsoring Organizations of the Treadway Commission in Internal Control—Integrated Framework. We concluded that based on our evaluation, our internal control over financial reporting was effective as of December 31, 2008.
Our assessment of the effectiveness of our internal control over financial reporting as of December 31, 2008 has been audited by UHY LLP, an independent registered public accounting firm, as stated in their report which is included herein.
| /s/ JERRY D. DUMAS SR. | /s/ JESSE E. NEYMAN | |
| Jerry D. Dumas Sr. Chief Executive Officer |
Jesse E. Neyman Chief Financial Officer |
57
Table of Contents
REPORT OF INDEPENDENT REGISTERED PUBLIC ACCOUNTING FIRM
The Board of Directors and Stockholders of
Flotek Industries, Inc. and Subsidiaries:
We have audited Flotek Industries, Inc. and Subsidiaries’ (the “Company”) internal control over financial reporting as of December 31, 2008, based on criteria established in Internal Control-Integrated Framework issued by the Committee of Sponsoring Organizations of the Treadway Commission (the “COSO criteria”). The Company’s management is responsible for maintaining effective internal control over financial reporting, and for its assessment of the effectiveness of internal control over financial reporting included in the accompanying Management’s Report on Internal Control Over Financial Reporting. Our responsibility is to express an opinion on the Company’s internal control over financial reporting based on our audit.
We conducted our audit in accordance with the standards of the Public Company Accounting of Oversight Board (United States). Those standards require that we plan and perform the audit to obtain reasonable assurance about whether effective internal control over financial reporting was maintained in all material respects. Our audit included obtaining an understanding of internal control over financial reporting, assessing the risk that a material weakness exists, testing and evaluating the design and operating effectiveness of internal control based on the assessed risk, and performing such other procedures as we considered necessary in the circumstances. We believe that our audit provides a reasonable basis for our opinion.
A company’s internal control over financial reporting is a process designed by, or under the supervision of, the company’s principal executive and financial officers, or persons performing similar functions, and effected by the company’s board of directors, management, and other personnel to provide reasonable assurance regarding the reliability of financial reporting and the preparation of financial statements for external purposes in accordance with generally accepted accounting principles. A company’s internal control over financial reporting includes those policies and procedures that (1) pertain to the maintenance of records that, in reasonable detail, accurately and fairly reflect the transactions and dispositions of the assets of the company; (2) provide reasonable assurance that transactions are recorded as necessary to permit preparation of financial statements in accordance with generally accepted accounting principles and that receipts and expenditures of the company are being made only in accordance with authorizations of management and directors of the company; and (3) provide reasonable assurance regarding prevention or timely detection of unauthorized acquisition, use, or disposition of the company’s assets that could have a material effect on the financial statements.
Because of its inherent limitations, internal control over financial reporting may not prevent or detect misstatements. Also, projections of any evaluation of effectiveness of the internal control over financial reporting to future periods are subject to the risk that the controls may become inadequate because of changes in conditions, or that the degree of compliance with the policies or procedures may deteriorate.
In our opinion, Flotek Industries, Inc. and Subsidiaries maintained, in all material respects, effective internal control over financial reporting as of December 31, 2008, based on the COSO criteria.
In conducting the Company’s evaluation of effectiveness of the Company’s internal controls over financial reporting as of December 31, 2008, the Company has excluded the acquisition of Teledrift, Inc. as permitted by the guidance issued by the Office of the Chief Accounting of the Securities and Exchange Commission. The acquisition of Teledrift, Inc. was completed on February 14, 2008. This acquisition constituted 40% of total assets as of December 31, 2008, and 12% of total revenues for the year then ended.
We have also audited, in accordance with the standards of the Public Company Accounting Oversight Board (United States), the Consolidated Balance Sheets of Flotek Industries, Inc. and Subsidiaries as of December 31, 2008 and 2007, and the related Consolidated Statements of Income and Comprehensive Income, Stockholders’ Equity, and Cash Flows for each of the years in the three-year period ended December 31, 2008, and our report dated March 16, 2009 expressed an unqualified opinion thereon.
/s/ UHY LLP
Houston, Texas
March 16, 2009
58
Table of Contents
REPORT OF INDEPENDENT REGISTERED PUBLIC ACCOUNTING FIRM
To the Board of Directors and Stockholders of
Flotek Industries, Inc. and Subsidiaries:
We have audited the accompanying Consolidated Balance Sheets of Flotek Industries, Inc. and Subsidiaries (the “Company”) as of December 31, 2008 and 2007, and the related Consolidated Statements of Income and Comprehensive Income, Stockholders’ Equity and Cash Flows for each of the years in the three year period ended December 31, 2008. These consolidated financial statements are the responsibility of the Company’s management. Our responsibility is to express an opinion on these consolidated financial statements based on our audits.
We conducted our audits in accordance with the standards of the Public Company Accounting Oversight Board (United States). Those standards require that we plan and perform the audits to obtain reasonable assurance about whether the consolidated financial statements are free of material misstatement. An audit includes examining, on a test basis, evidence supporting the amounts and disclosures in the financial statements. An audit also includes assessing the accounting principles used and significant estimates made by management, as well as evaluating the overall financial statement presentation. We believe that our audits provide a reasonable basis for our opinion.
In our opinion, the financial statements referred to above present fairly, in all material respects, the consolidated financial position of Flotek Industries, Inc. and Subsidiaries as of December 31, 2008 and 2007, and the consolidated results of their operations and their cash flows for each of the years in the three-year period ended December 31, 2008, in conformity with accounting principles generally accepted in the United States of America.
As discussed in Note 2 of the Consolidated Financial Statements, the consolidated financial statements have been revised for the retrospective application of Financial Accounting Standards Board (“FASB”) Staff Position No. APB 14-1, “Accounting for Convertible Debt Instruments That May Be Settled in Cash upon Conversion (Including Partial Cash Settlement)”, and FASB Staff Position EITF 03-6-1, “Determining Whether Instruments Granted in Share-Based Payment Transactions Are Participating Securities”, which became effective January 1, 2009.
We also have audited, in accordance with the standards of the Public Company Accounting Oversight Board (United States), the effectiveness of Flotek Industries, Inc. and Subsidiaries’ internal control over financial reporting as of December 31, 2008, based on criteria established in Internal Control-Integrated Framework issued by the Committee of Sponsoring Organizations of the Treadway Commission, and our report dated March 16, 2009 expressed an unqualified opinion thereon.
/s/ UHY
Houston, Texas
March 16, 2009, except for changes as described in Note 2 and Note 19,
as to which the date is August 26, 2009
59
Table of Contents
FLOTEK INDUSTRIES, INC.
CONSOLIDATED BALANCE SHEETS
| December 31, | ||||||||
| 2008 (1) | 2007 | |||||||
| (in thousands, except share data) | ||||||||
| ASSETS |
||||||||
| Current assets: |
||||||||
| Cash and cash equivalents |
$ | 193 | $ | 1,282 | ||||
| Restricted cash |
9 | 9 | ||||||
| Accounts receivable, net of allowance for doubtful accounts of $ 1,465 and $1,354, respectively |
37,205 | 24,919 | ||||||
| Inventories, net |
38,027 | 21,017 | ||||||
| Deferred tax assets, current |
917 | 329 | ||||||
| Other current assets |
1,287 | 1,043 | ||||||
| Total current assets |
77,638 | 48,599 | ||||||
| Property, plant and equipment, net |
66,835 | 39,824 | ||||||
| Goodwill |
45,443 | 60,480 | ||||||
| Intangible assets, net |
38,015 | 11,485 | ||||||
| Other assets, net |
4 | 405 | ||||||
| Deferred tax assets, less current portion |
6,640 | — | ||||||
| TOTAL ASSETS |
$ | 234,575 | $ | 160,793 | ||||
| LIABILITIES AND STOCKHOLDERS’ EQUITY |
||||||||
| Current liabilities: |
||||||||
| Accounts payable |
$ | 22,666 | $ | 9,424 | ||||
| Accrued liabilities |
13,509 | 10,207 | ||||||
| Accrued interest payable |
2,402 | 7 | ||||||
| Income taxes payable |
979 | 1,352 | ||||||
| Current portion of long-term debt and capital leases |
9,017 | 7,034 | ||||||
| Total current liabilities |
48,573 | 28,024 | ||||||
| Long-term debt and capital leases, less current portion |
29,478 | 52,377 | ||||||
| Convertible senior notes |
90,803 | — | ||||||
| Deferred tax liabilities, less current portion |
— | 2,931 | ||||||
| Total liabilities |
168,854 | 83,332 | ||||||
| Commitments and contingencies (See Note 16) |
||||||||
| Stockholders’ equity: |
||||||||
| Preferred stock, 100,000 shares authorized, none issued |
— | — | ||||||
| Common stock, $.0001 par value; 40,000,000 shares authorized; December 31, 2008 shares issued: 23,174,286; outstanding: 22,782,091; December 31, 2007 shares issued 18,802,921; outstanding: 18,394,730 |
2 | 1 | ||||||
| Additional paid-in capital |
76,788 | 54,141 | ||||||
| Accumulated other comprehensive income |
125 | 45 | ||||||
| Retained earnings (deficit) |
(10,697 | ) | 23,464 | |||||
| Treasury stock: 158,697 shares and 71,430 shares, respectively |
(497 | ) | (190 | ) | ||||
| Total stockholders’ equity |
65,721 | 77,461 | ||||||
| TOTAL LIABILITIES AND STOCKHOLDERS’ EQUITY |
$ | 234,575 | $ | 160,793 | ||||
| (1) | Amounts have been retrospectively revised as a result of the adoption, effective January 1, 2009, of FASB Staff Position APB 14-1, Accounting for Convertible Debt Instruments That May Be Settled in Cash Upon Conversion (including Partial Cash Settlement). |
See notes to the consolidated financial statements.
60
Table of Contents
FLOTEK INDUSTRIES, INC.
CONSOLIDATED STATEMENTS OF INCOME AND COMPREHENSIVE INCOME
| For the Year Ended December 31, | ||||||||||||
| 2008 (1) | 2007 | 2006 | ||||||||||
| (in thousands, except per share data) | ||||||||||||
| Revenue |
$ | 226,063 | $ | 158,008 | $ | 100,642 | ||||||
| Cost of revenue |
135,307 | 94,561 | 61,249 | |||||||||
| Expenses: |
||||||||||||
| Impairment of Goodwill and Intangible assets |
67,695 | — | — | |||||||||
| Selling, general and administrative |
46,311 | 30,639 | 18,919 | |||||||||
| Depreciation and amortization |
5,570 | 2,273 | 965 | |||||||||
| Research and development |
1,931 | 849 | 656 | |||||||||
| Total expenses |
121,507 | 33,761 | 20,540 | |||||||||
| Income (loss) from operations |
(30,751 | ) | 29,686 | 18,853 | ||||||||
| Other income (expense): |
||||||||||||
| Interest expense |
(13,813 | ) | (3,501 | ) | (1,005 | ) | ||||||
| Investment income and other |
(96 | ) | 956 | 85 | ||||||||
| Total other income (expense) |
(13,909 | ) | (2,545 | ) | (920 | ) | ||||||
| Income (loss) before income taxes |
(44,660 | ) | 27,141 | 17,933 | ||||||||
| Benefit (Provision) for income taxes |
10,499 | (10,414 | ) | (6,583 | ) | |||||||
| Net income (loss) |
$ | (34,161 | ) | $ | 16,727 | $ | 11,350 | |||||
| Other comprehensive income (loss): |
||||||||||||
| Foreign currency translation adjustment |
80 | 8 | 37 | |||||||||
| Comprehensive income (loss) |
$ | (34,081 | ) | $ | 16,735 | $ | 11,387 | |||||
| Basic and diluted earnings (loss) per common share:(2) |
||||||||||||
| Basic earnings (loss) per common share |
$ | (1.78 | ) | $ | 0.91 | $ | 0.66 | |||||
| Diluted earnings (loss) per common share |
$ | (1.78 | ) | $ | 0.88 | $ | 0.61 | |||||
| Weighted average common shares used in computing basic earnings (loss) per common share |
19,157 | 18,338 | 17,289 | |||||||||
| Incremental common shares from stock options and warrants |
— | 620 | 1,299 | |||||||||
| Weighted average common shares used in computing diluted earnings (loss) per common share |
19,157 | 18,958 | 18,588 | |||||||||
| 1 | Amounts have been retrospectively revised as a result of the adoption, effective January 1, 2009, of FASB Staff Position APB 14-1, Accounting for Convertible Debt Instruments That May Be Settled in Cash Upon Conversion (including Partial Cash Settlement). |
| 2 | Amounts have been retrospectively revised as a result of the adoption, effective January 1, 2009, of FASB Staff Position EITF 03-6-1, Determining Whether Instruments Granted in Share-Based Payment Transactions Are Participating Securities. |
See notes to the consolidated financial statements.
61
Table of Contents
FLOTEK INDUSTRIES, INC.
CONSOLIDATED STATEMENTS OF STOCKHOLDERS’ EQUITY
(in thousands)
|
Common Stock |
Treasury Stock |
Additional Paid-in Capital |
Accumulated Other Comprehensive Income |
Retained Earnings (Deficit) |
Total | |||||||||||||||||||||
| Shares Issued |
Par Value |
Shares | Cost | |||||||||||||||||||||||
| Balance January 1, 2006 |
16,634 | $ | 1 | — | $ | — | $ | 39,744 | $ | — | $ | (4,540 | ) | $ | 35,205 | |||||||||||
| Common stock issued, net of offering costs |
406 | — | — | — | 4,383 | — | — | 4,383 | ||||||||||||||||||
| Stock options and warrants exercised |
654 | — | — | — | 916 | — | — | 916 | ||||||||||||||||||
| Tax benefit of share based awards |
— | — | — | — | 1,618 | — | — | 1,618 | ||||||||||||||||||
| Foreign currency translation adjustment |
— | — | — | — | — | 37 | — | 37 | ||||||||||||||||||
| Net income |
— | — | — | — | — | — | 11,350 | 11,350 | ||||||||||||||||||
| Balance December 31, 2006 |
17,694 | 1 | — | — | 46,661 | 37 | 6,810 | 53,509 | ||||||||||||||||||
| Common stock issued for acquisition |
143 | — | — | — | 1,855 | — | — | 1,855 | ||||||||||||||||||
| Treasury stock purchased |
— | — | (70 | ) | (190 | ) | — | — | — | (190 | ) | |||||||||||||||
| Restricted stock forfeited |
— | — | (2 | ) | — | — | — | — | — | |||||||||||||||||
| Stock options and warrants exercised |
628 | — | — | — | 1,502 | — | — | 1,502 | ||||||||||||||||||
| Restricted stock granted |
338 | — | — | — | — | — | — | — | ||||||||||||||||||
| Tax benefit of share based awards |
— | — | — | — | 2,473 | — | — | 2,473 | ||||||||||||||||||
| Stock compensation expense |
— | — | — | — | 1,650 | — | — | 1,650 | ||||||||||||||||||
| Adoption of FIN 48 |
— | — | — | — | — | — | (73 | ) | (73 | ) | ||||||||||||||||
| Foreign currency translation adjustment |
— | — | — | — | — | 8 | — | 8 | ||||||||||||||||||
| Net income |
— | — | — | — | — | — | 16,727 | 16,727 | ||||||||||||||||||
| Balance December 31, 2007 |
18,803 | 1 | (72 | ) | (190 | ) | 54,141 | 45 | 23,464 | 77,461 | ||||||||||||||||
| Common stock issued under share lending agreement |
3,800 | 1 | — | — | — | — | — | 1 | ||||||||||||||||||
| Treasury stock purchased |
— | — | (17 | ) | (307 | ) | — | — | — | (307 | ) | |||||||||||||||
| Restricted stock forfeited |
— | — | (70 | ) | — | — | — | — | — | |||||||||||||||||
| Stock options exercised |
519 | — | — | — | 905 | — | — | 905 | ||||||||||||||||||
| Restricted stock granted |
52 | — | — | — | — | — | — | — | ||||||||||||||||||
| Tax benefit of share based awards |
— | — | — | — | 2,020 | — | — | 2,020 | ||||||||||||||||||
| Stock compensation expense |
— | — | — | — | 2,500 | — | — | 2,500 | ||||||||||||||||||
| Debt discount, net of tax as a result of adoption of FSP 14-1 |
— | — | — | — | 17,222 | — | — | 17,222 | ||||||||||||||||||
| Foreign currency translation adjustment |
— | — | — | — | — | 80 | — | 80 | ||||||||||||||||||
| Net loss |
— | — | — | — | — | — | (34,161 | ) | (34,161 | ) | ||||||||||||||||
| Balance December 31, 2008 (1) |
23,174 | $ | 2 | (159 | ) | $ | (497 | ) | $ | 76,788 | $ | 125 | $ | (10,697 | ) | $ | 65,721 | |||||||||
| (1) | Amounts have been retrospectively revised as a result of the adoption, effective January 1, 2009, of FASB Staff Position APB 14-1, Accounting for Convertible Debt Instruments That May Be Settled in Cash Upon Conversion (including Partial Cash Settlement). |
See notes to the consolidated financial statements.
62
Table of Contents
FLOTEK INDUSTRIES, INC.
CONSOLIDATED STATEMENTS OF CASH FLOWS
| For the Year Ended December 31, | ||||||||||||
| 2008 (1) | 2007 | 2006 | ||||||||||
| (in thousands) | ||||||||||||
| Cash flows from operating activities: |
||||||||||||
| Net income (loss) |
$ | (34,161 | ) | $ | 16,727 | $ | 11,350 | |||||
| Adjustments to reconcile net income (loss) to net cash provided by operating activities: |
||||||||||||
| Depreciation and amortization |
12,844 | 6,537 | 2,750 | |||||||||
| Amortization of deferred financing costs |
1,030 | — | — | |||||||||
| Accretion of debt discount |
3,580 | — | — | |||||||||
| Equity income from affiliate |
— | (509 | ) | — | ||||||||
| (Gain) loss on sale of assets |
(2,881 | ) | (204 | ) | (68 | ) | ||||||
| Impairment of Goodwill and Intangible assets |
67,695 | — | — | |||||||||
| Stock compensation expense |
2,500 | 1,650 | — | |||||||||
| Excess tax benefit of share based awards |
(2,020 | ) | (2,473 | ) | — | |||||||
| Deferred income taxes |
(20,881 | ) | (1,101 | ) | 542 | |||||||
| Unrealized loss on interest rate swap |
533 | — | — | |||||||||
| Change in current assets and liabilities: |
||||||||||||
| Restricted cash |
(1 | ) | (9 | ) | — | |||||||
| Accounts receivable |
(8,543 | ) | (44 | ) | (7,427 | ) | ||||||
| Inventories |
(14,522 | ) | 671 | (4,913 | ) | |||||||
| Other current assets |
(233 | ) | (49 | ) | (331 | ) | ||||||
| Accounts payable |
12,415 | (2,378 | ) | 4,774 | ||||||||
| Accrued liabilities |
5,124 | 3,834 | 5,787 | |||||||||
| Accrued interest payable |
2,395 | (39 | ) | (28 | ) | |||||||
| Net cash provided by operating activities |
24,874 | 22,613 | 12,436 | |||||||||
| Cash flows from investing activities: |
||||||||||||
| Proceeds from sale of assets |
4,554 | 1,274 | 309 | |||||||||
| Acquisitions, net of cash acquired |
(97,973 | ) | (53,028 | ) | (12,763 | ) | ||||||
| Purchase of patents |
(48 | ) | (2,521 | ) | — | |||||||
| Other assets |
— | (585 | ) | (45 | ) | |||||||
| Capital expenditures |
(23,711 | ) | (15,672 | ) | (9,201 | ) | ||||||
| Net cash used in investing activities |
(117,178 | ) | (70,532 | ) | (21,700 | ) | ||||||
| Cash flows from financing activities: |
||||||||||||
| Proceeds from exercise of stock options |
905 | 1,502 | 915 | |||||||||
| Net borrowings (repayments) under revolving line of credit |
(27,647 | ) | 12,537 | 2,912 | ||||||||
| Purchase of treasury stock |
(307 | ) | (190 | ) | — | |||||||
| Proceeds from borrowings |
6,729 | 44,460 | 647 | |||||||||
| Proceeds from convertible debt offering |
115,000 | — | — | |||||||||
| Debt issuance costs |
(5,485 | ) | — | — | ||||||||
| Excess tax benefit of share based awards |
2,020 | 2,473 | — | |||||||||
| Repayments of indebtedness |
— | (12,097 | ) | (2,077 | ) | |||||||
| Net cash provided by financing activities |
91,215 | 48,685 | 2,397 | |||||||||
| Effect of exchange rate changes on cash and cash equivalents |
— | 6 | — | |||||||||
| Net increase (decrease) in cash and cash equivalents |
(1,089 | ) | 772 | (6,867 | ) | |||||||
| Cash and cash equivalents at the beginning of year |
1,282 | 510 | 7,377 | |||||||||
| Cash and cash equivalents at the end of year |
$ | 193 | $ | 1,282 | $ | 510 | ||||||
| (1) | Amounts have been retrospectively revised as a result of the adoption, effective January 1, 2009, of FASB Staff Position APB 14-1, Accounting for Convertible Debt Instruments That May Be Settled in Cash Upon Conversion (including Partial Cash Settlement). |
See notes to the consolidated financial statements.
63
Table of Contents
FLOTEK INDUSTRIES, INC.
NOTES TO CONSOLIDATED FINANCIAL STATEMENTS
Note 1—Business and Basis of Presentation
Flotek Industries, Inc. and subsidiaries was incorporated under the laws of the Province of British Columbia on May 17, 1985. On October 23, 2001, we changed our corporate domicile to the state of Delaware. We are engaged in the manufacturing and marketing of innovative specialty chemicals and downhole drilling and production equipment, and in the management of automated bulk material handling, loading and blending facilities. Flotek serves major and independent companies in the domestic and international oilfield service and mining industries. The Company’s headquarters are located in Houston, Texas, and it has operations in Texas, Oklahoma, Colorado, New Mexico, Louisiana, Utah, Wyoming and The Netherlands. We market our products domestically and internationally in over 20 countries.
The consolidated financial statements consist of Flotek Industries, Inc. and its wholly-owned subsidiaries, collectively referred to herein as the “Company” or “Flotek”. All significant intercompany transactions and balances have been eliminated in consolidation.
On July 11, 2007, the Company effected a two-for-one stock split in the form of a 100% stock dividend to stockholders of record as of July 3, 2007. All share and per share information has been retroactively adjusted to reflect the stock split.
Note 2—Summary of Significant Accounting Policies
Retrospective revision of consolidated financial statements: Effective January 1, 2009, the Company adopted FASB Staff Position No. EITF 03-6-1, Determining Whether Instruments Granted in Share-Based Payment Transactions Are Participating Securities (“FSP EITF 03-6-1”). This Staff Position states that unvested share-based payment awards that contain non-forfeitable rights to dividends or dividend equivalents (whether paid or unpaid) are participating securities and shall be included in the computation of earnings per share pursuant to the two-class method. FSP EITF 03-6-1 is effective for financial statements issued for fiscal years beginning after December 15, 2008, and interim periods within those years. However, once adopted, FSP EITF 03-6-1 requires retrospective application within its scope as they existed for all periods presented.
Additionally, effective January 1, 2009, the Company adopted FASB Staff Position APB 14-1, Accounting for Convertible Debt Instruments That May Be Settled in Cash Upon Conversion (including Partial Cash Settlement) (“FSP 14-1”), which clarifies the accounting for convertible debt instruments that may be settled in cash (including partial cash settlement) upon conversion. FSP 14-1 requires issuers of convertible debt instruments within its scope to separately account for the liability and equity components of the instruments in a manner that reflects the issuer’s nonconvertible debt borrowing rate when interest cost is recognized. FSP 14-1 requires bifurcation of a component of the debt, classification of that component in equity and the accretion of the resulting discount on the debt to be recognized as part of interest expense in the issuer’s consolidated results of operations. FSP 14-1 is effective for the Company as of January 1, 2009 and early adoption was not permitted. However, once adopted, FSP 14-1 requires retrospective application to the terms of instruments within its scope as they existed for all periods presented. In applying FSP 14-1, $27.8 million of the carrying value of our Convertible Notes was reclassified to equity as of the February 2008 issuance date and offset by a related deferred tax liability of $10.6 million, assuming the effective tax rate at inception of the Convertible Notes was 38%. This discount represents the equity component of the proceeds from the Convertible Notes, calculated assuming an 11.5% non-convertible borrowing rate. The discount will be accreted to interest expense over the expected term of five years, which is based on the call/put option on the debt at February 2013. Accordingly, $3.6 million of additional non-cash interest expense was recorded in the Consolidated Statement of Income (Loss) and Comprehensive Income (Loss) for the year ended December 31, 2008.
64
Table of Contents
FLOTEK INDUSTRIES, INC.
NOTES TO CONSOLIDATED FINANCIAL STATEMENTS
The Company has determined the effect of the adoption of FSP EITF 03-6-1 for fiscal year 2007 to be immaterial and there is no effect on fiscal year 2006 as the Company had no participating securities. Accordingly, as a result of the adoption of FSP EITF 03-6-1 and FSP 14-1, the Company has retrospectively revised certain amounts included in these financial statements as of December 31, 2008, as follows:
| December 31, 2008 | ||||||||
| As reported | As adjusted | |||||||
| (in thousands) | ||||||||
| Deferred tax assets, less current portion |
$ | 15,835 | $ | 6,640 | ||||
| TOTAL ASSETS |
243,770 | 234,575 | ||||||
| Convertible senior notes, net of discount |
115,000 | 90,803 | ||||||
| Additional paid-in capital |
59,566 | 76,788 | ||||||
| Retained earnings (deficit) |
(8,477 | ) | (10,697 | ) | ||||
| Total stockholders’ equity |
50,719 | 65,721 | ||||||
| TOTAL LIABILITIES AND STOCKHOLDERS’ EQUITY |
243,770 | 234,575 | ||||||
| Year Ended December 31, 2008 | ||||||||
| As reported | As adjusted | |||||||
| (in thousands, except per share data) | ||||||||
| Interest expense |
$ | (10,233 | ) | $ | (13,813 | ) | ||
| Total other income (expense) |
(10,329 | ) | (13,909 | ) | ||||
| Loss before taxes |
(41,080 | ) | (44,660 | ) | ||||
| Benefit for income taxes |
9,139 | 10,499 | ||||||
| Net loss |
(31,941 | ) | (34,161 | ) | ||||
| Basic earnings (loss) per common share |
(1.69 | ) | (1.78 | ) | ||||
| Diluted earnings (loss) per common share |
(1.69 | ) | (1.78 | ) | ||||
| Weighted average common shares used in computing basic earnings (loss) per common share |
18,867 | 19,157 | ||||||
| Weighted average common shares used in computing diluted earnings (loss) per common share |
18,867 | 19,157 | ||||||
Various supporting amounts included in the Statements of Consolidated Cash Flows and these Notes to Consolidated Financial Statements have also been retrospectively revised in connection with the changes noted above. No other changes from the amounts or disclosures originally reflected in the Company’s Annual Report on Form 10-K for the year ended December 31, 2008, filed with the U.S. Securities and Exchange Commission on March 16, 2009, have been included in these consolidated financial statements.
Consolidation Policy: The accompanying consolidated financial statements include the accounts of the Company and its wholly-owned subsidiary corporations, after elimination of all material intercompany accounts, transactions, and profits. The Company does not have any investment in unconsolidated subsidiaries or non-marketable investments.
Acquisitions: Acquisitions have been accounted for using the purchase method of accounting under SFAS No. 141 “Accounting for Business Combinations”. The acquired companies’ results have been included in the accompanying financial statements from their respective dates of acquisition. Allocation of the purchase price for acquisitions was based on the estimates of fair value of the net assets acquired and is subject to adjustment upon finalization of the purchase price allocation within the one year anniversary of the acquisition. We have not made any acquisitions under SFAS 141R, “Business Combinations” as of December 31, 2008.
65
Table of Contents
FLOTEK INDUSTRIES, INC.
NOTES TO CONSOLIDATED FINANCIAL STATEMENTS
Cash and Cash Equivalents: Cash equivalents consist of highly liquid investments with an original maturity of three months or less.
Allowance for Doubtful Accounts: The Company performs credit evaluations of the Company customers’ current credit worthiness, as determined by our review of their available credit information. While such credit losses have historically been within our expectations and the provisions established, we cannot give any assurances that we will continue to experience the same credit loss rates that we have in the past. The cyclical nature of our industry may affect our customers’ operating performance and cash flows, which could impact our ability to collect on these obligations. Additionally, some of our customers are located in certain international areas that are inherently subject to risks of economic, political and civil instabilities, which may impact our ability to collect these receivables.
The following summarizes the changes in allowance for doubtful accounts for the years ended December 31, 2008, 2007 and 2006:
| Beginning Balance |
Additions | Write-offs | Ending Balance | |||||||||||||
| Charged to Costs and Expense |
Charged to other accounts (a) |
|||||||||||||||
| (In thousands) | ||||||||||||||||
| For the Years Ended December 31, |
||||||||||||||||
| 2006 |
$ | 67 | $ | 458 | $ | 82 | $ | (45 | ) | $ | 562 | |||||
| 2007 |
562 | 460 | 478 | (146 | ) | 1,354 | ||||||||||
| 2008 |
1,354 | 195 | 20 | (104 | ) | 1,465 | ||||||||||
| (a) | Amounts represent amounts obtained from acquisitions. |
Inventories: Inventories consist of raw materials, work-in-process and finished goods. Finished goods inventories include raw materials, direct labor and production overhead. The Company determines the value of acquired work-in-process inventories by estimating the selling prices of finished goods or replacement cost less the sum of (a) cost to complete, (b) costs of disposal, and (c) a reasonable profit allowance for the completing and selling effort of the Company based on profit for similar finished goods. Inventories are carried at the lower of cost or market using the weighted average cost method. The Company maintains a reserve for slow-moving and obsolete inventories, which is reviewed for adequacy on a periodic basis.
The following summarizes the changes in inventory reserve for the years ended December 31, 2008, 2007 and 2006:
| Beginning Balance |
Additions | Deductions | Ending Balance | |||||||||||||
| Charged to Costs and Expense |
Charged to other accounts (a) |
|||||||||||||||
| (In thousands) | ||||||||||||||||
| For the Years Ended December 31, |
||||||||||||||||
| 2006 |
$ | 405 | $ | 828 | $ | — | $ | (371 | ) | $ | 862 | |||||
| 2007 |
862 | 1,261 | 553 | (282 | ) | 2,394 | ||||||||||
| 2008 |
2,394 | 3,567 | — | (3,554 | ) | 2,407 | ||||||||||
| (a) | Amounts represent amounts obtained from acquisitions. |
Property, Plant and Equipment: Property, plant and equipment are stated at cost. The Company determines the value of acquired property, plant and equipment at the lower of (a) replacement cost or (b) appraised value. The
66
Table of Contents
FLOTEK INDUSTRIES, INC.
NOTES TO CONSOLIDATED FINANCIAL STATEMENTS
cost of ordinary maintenance and repairs is charged to operations, while replacements and major improvements are capitalized. Depreciation or amortization is provided at rates considered sufficient to amortize the cost of the assets, net of estimated salvage value, using the straight-line method over the following estimated useful lives:
| Buildings and leasehold improvements |
3-39 years | |
| Machinery, equipment and rental tools |
3-7 years | |
| Furniture and fixtures |
3-7 years | |
| Transportation equipment |
3-5 years | |
| Computer equipment |
3-5 years |
The Company reviews long-lived assets for impairment whenever events or changes in circumstances indicate that the carrying amount of an asset may not be recoverable. Recoverability of assets to be held and used is measured by a comparison of the carrying amount of an asset to future net cash flows expected to be generated by the asset. If such assets are considered to be impaired, the impairment recognized is measured by the amount by which the carrying amount of the assets exceeds either the fair value or the estimated discounted cash flows of the assets, whichever is more readily measurable. Assets to be disposed of are reported at the lower of the carrying amount or fair value less costs to sell.
Goodwill and Intangible Assets: Goodwill represents the excess of the purchase price and related costs over the value assigned to net tangible and identifiable intangible assets of businesses acquired and accounted for under the purchase method. We test goodwill for impairment on an annual basis at a reporting unit level in the fourth quarter of every year. Impairment is a condition that exists when the carrying amount of goodwill exceeds its implied fair value. Unless conditions warrant earlier action, intangible assets with indefinite lives are tested annually for impairment during the fourth quarter and written down to fair value as required. Testing of goodwill requires the use of a two step impairment test that identifies potential goodwill impairment and measures the amount of an impairment loss to be recognized (if any). We began our process of testing goodwill by assessing our reporting segments and units. A reporting unit is an operating segment or one level below an operating segment (referred to as a component). A component of an operating segment is a reporting unit if the component constitutes a business for which discrete financial information is available and segment management regularly reviews the operating results of that component. However, two or more components of an operating segment should be aggregated and deemed a single reporting unit if the components have similar economic characteristics. An operating segment shall be deemed to be a reporting unit if all of its components are similar, if none of its components is a reporting unit, or if it comprises only a single component.
The first step of the goodwill impairment test compares the fair value of a reporting unit with its carrying amount, including goodwill. If the fair value of a reporting unit exceeds its carrying amount, goodwill of the reporting unit is considered not impaired, thus the second step of the impairment test is unnecessary. If the carrying amount of a reporting unit exceeds its fair value, the second step of the test shall be performed to measure the amount of impairment loss, if any.
The second step of the goodwill impairment test, is used to measure the amount of impairment loss, compares the implied fair value of a reporting unit’s goodwill with the carrying amount of that goodwill. The implied fair value of goodwill is determined in a manner similar to determining the amount of goodwill recognized in a business combination. Accordingly, we assigned the fair value of a reporting unit to all of the assets and liabilities of that unit (including any unrecognized intangible assets) as if the reporting unit had been acquired in a business combination. The excess of the fair value of a reporting unit over the amounts assigned to its assets and liabilities is the implied fair value of goodwill. We performed that assignment process only for purposes of testing goodwill for impairment and did not write up or write down a recognized asset or liability, nor did we recognize a previously unrecognized intangible asset as a result of this allocation process. We determined that the
67
Table of Contents
FLOTEK INDUSTRIES, INC.
NOTES TO CONSOLIDATED FINANCIAL STATEMENTS
carrying amount of reporting unit goodwill exceeded the implied fair value of that goodwill for each of the three reporting units mentioned above and recognized an impairment loss equal to that excess.
An impairment loss shall be recognized only if the carrying amount of a long-lived asset is not recoverable and exceeds its fair value. The carrying amount of a long-lived asset is not recoverable if it exceeds the sum of the undiscounted cash flows expected to result from the use and eventual disposition of the asset. That assessment shall be based on the carrying amount of the asset at the date it is tested for recoverability. A long-lived asset shall be tested for recoverability whenever events or changes in circumstances indicate that its carrying amount may not be recoverable. Due to the significantly changing business conditions late in the fourth quarter of 2008, we determined a test our long-lived assets for potential impairment was appropriate.
Based on our testing process, we recognized $61.5 million of goodwill impairment charges and an additional charge of $6.2 million related to the impairment of other intangible assets, primarily, customer lists and patents in 2008. While the value of goodwill and other intangible assets are substantially reduced, should future results or economic events cause a change in our projected cash flows, or should our operating plans or business model change, future determinations of fair value may not support the carrying amount of these assets.
We amortize the cost of other intangible assets over their estimated useful lives. Amortizable intangible assets are reviewed at least annually to determine whether events and circumstances warrant a revision to the remaining period of amortization.
Fair Value and Financial Instruments: The Company adopted FAS 157 as of January 1, 2008, except as it applies to those nonfinancial assets and nonfinancial liabilities addressed in FASB Staff Position FAS 157-2 (“FSP FAS 157-2”), which defines fair value, establishes a framework for measuring fair value and establishes a valuation hierarchy for disclosure of the inputs to the valuation used to measure fair value. The implementation of FAS 157 did not cause a change in the method of calculating fair value of assets and liabilities. The primary impact from the adoption was additional disclosures. FSP FAS 157-2 delayed the effective date of FAS No. 157 to fiscal years beginning after November 15, 2008 for all nonfinancial assets and nonfinancial liabilities, except those that are recognized or disclosed at fair value in the financial statements on a recurring basis (at least annually).
The valuation hierarchy categorizes assets and liabilities measured at fair value into one of three different levels depending on the observability of the inputs employed in the measurement. A financial asset or liability’s classification within the hierarchy is determined based on the lowest level input that is significant to the fair value measurement. The Company’s assessment of the significance of a particular input to the fair value measurement in its entirety requires judgment and considers factors specific to the asset or liability. The Company measures it’s Convertible Senior Notes at fair value by utilizing quoted prices for similar liabilities in active markets or inputs that are observable for the liability, either directly or indirectly through market corroboration, for substantially the full term of the financial instrument. The use of different assumptions and/or estimation methodologies may have a material effect on the estimated fair value.
We adopted Statement of Financial Accounting Standards No. 159, “The Fair Value Option for Financial Assets and Financial Liabilities” (“FAS 159”) on January 1, 2008. FAS 159, provides an option to report selected financial assets and liabilities at fair value and establishes presentation and disclosure requirements. As we did not elect to measure existing assets and liabilities at fair value, the adoption did not have an effect on our financial statements.
The Company considers the fair value of all financial instruments (primarily accounts receivable and long-term debt) not to be materially different from their carrying values at the end of each fiscal year based on
68
Table of Contents
FLOTEK INDUSTRIES, INC.
NOTES TO CONSOLIDATED FINANCIAL STATEMENTS
management’s estimate of the collectibility of net accounts receivable and due to our ability to borrow funds under terms and conditions similar to those of our existing debt the majority of which carries a floating rate.
We have no off-balance sheet debt or other off-balance sheet financing arrangements. We have entered into an interest rate swap agreement on 50% of the New Term Loan Facility to partially reduce our exposure to interest rate risk as required by the Senior Credit Agreement.
Revenue Recognition: Revenue for product sales is recognized when all of the following criteria have been met: (i) evidence of an agreement exists, (ii) products are shipped or services rendered to the customer and all significant risks and rewards of ownership have passed to the customer, (iii) the price to the customer is fixed and determinable and (iv) collectibility is reasonably assured. Accounts receivable are recorded at that time, net of any discounts. Earnings are charged with a provision for doubtful accounts based on a current review of collectibility of the accounts receivable. Accounts receivable deemed ultimately uncollectible are applied against the allowance for doubtful accounts. Deposits and other funds received in advance of delivery are deferred until the transfer of ownership is complete.
The Logistics group recognizes revenue from its design and construction oversight contracts under the percentage-of-completion method of accounting, measured by the percentage of costs incurred to date to the total estimated costs of completion. This percentage is applied to the total estimated revenue at completion to calculate revenue earned to date. Contract costs include all direct labor and material costs and those indirect costs related to manufacturing and construction operations. General and administrative costs are charged to expense as incurred. Changes in job performance and estimated profitability, including those arising from contract bonus or penalty provisions and final contract settlements, may result in revisions to costs and income and are recognized in the period in which such revisions appear probable. All known or anticipated losses on contracts are recognized in full when such amounts become apparent. Bulk material transload revenue is recognized as services are performed for the customer.
Within the Drilling Products segment amounts billed to customers for the cost of oilfield rental equipment that is damaged or lost-in-hole are reflected as revenue with the carrying value of the related equipment charged to cost of sales. This amount totaled $4.4 million, $2.1 million and $0.4 million for the years ended December 31, 2008, 2007 and 2006, respectively.
The Company is generally not contractually obligated to accept returns, except for defective products. If a product is determined to be defective, the Company will replace the product or issue a credit memo. Based on historical return rates, no provision is made for returns at the time of sale. All costs associated with product returns are expensed as incurred.
Foreign Currency: The functional currency of foreign subsidiaries is the local currency. All assets and liabilities of foreign subsidiaries are translated into U.S. dollars at exchange rates in effect as of the end of the reporting period. Revenue and expense items are translated at the average exchange rate for the reporting period. The resulting translation adjustment is included in shareholders’ equity as a component of accumulated other comprehensive income.
Research and Development Costs: Expenditures for research activities relating to product development and improvement are charged to expense as incurred.
Income Taxes: Our income tax expense is based on our income, statutory tax rates and tax planning opportunities available to us in the various jurisdictions in which we operate. We provide for income taxes based on the tax laws and rates in effect in the countries in which operations are conducted and income is earned. Our income tax
69
Table of Contents
FLOTEK INDUSTRIES, INC.
NOTES TO CONSOLIDATED FINANCIAL STATEMENTS
expense is expected to fluctuate from year to year as our operations are conducted in different taxing jurisdictions and the amount of pre-tax income fluctuates.
The determination and evaluation of our annual income tax provision involves the interpretation of tax laws in various jurisdictions in which we operate and requires significant judgment and the use of estimates and assumptions regarding significant future events such as the amount, timing and character of income, deductions and tax credits. Changes in tax laws, regulations and our level of operations or profitability in each jurisdiction may impact our tax liability in any given year. While our annual tax provision is based on the information available to us at the time, a number of years may elapse before the ultimate tax liabilities in certain tax jurisdictions are determined.
Current income tax expense reflects an estimate of our income tax liability for the current year, withholding taxes, changes in tax rates and changes in prior year tax estimates as returns are filed. Deferred tax assets and liabilities are recognized for the anticipated future tax effects of temporary differences between the financial statement basis and the tax basis of our assets and liabilities using the enacted tax rates in effect at year end. A valuation allowance for deferred tax assets is recorded when it is more-likely-than-not that the benefit from the deferred tax asset will not be realized. We provide for uncertain tax positions pursuant to FASB Interpretation No. 48, “Accounting for Uncertainty in Income Taxes—an Interpretation of FASB Statement No. 109” (“FIN 48”). Our policy is that we recognize interest and penalties accrued on any unrecognized tax benefits as a component of income tax expense. In 2008 the Company closed the 2005 and 2006 Internal Revenue Service audits with no material impact to the Company. The Company and its subsidiaries’ state income tax returns are open to audit under the statute of limitations for the years ending December 31, 2005 through 2007.
It is our intention to permanently reinvest all of the undistributed earnings of our non-U.S. subsidiaries in such subsidiaries. Accordingly, we have not provided for U.S. deferred taxes on the undistributed earnings of our non-U.S. subsidiaries. If a distribution is made to us from the undistributed earnings of these subsidiaries, we could be required to record additional taxes. Because we cannot predict when, if at all, we will make a distribution of these undistributed earnings, we are unable to make a determination of the amount of unrecognized deferred tax liability.
Earnings Per Share: Basic earnings per common share is calculated by dividing net income attributable to common stockholders by the weighted average number of common shares outstanding. Dilutive earnings per share is calculated by dividing net income attributable to common stockholders by the weighted average number of common shares outstanding and dilutive effect of stock options and warrants. Due to the Net (loss) in 2008 170,446 shares of dilutive instruments have been excluded from the calculation of Diluted earnings per share due to their anti-dilutive effect.
Debt Issuance Costs: The costs related to the issuance of debt are capitalized and amortized to interest expense using the straight-line method, which approximates the interest method, over the maturity periods of the related debt.
Stock-Based Compensation: We adopted SFAS No. 123R, Share-Based Payment (“SFAS No. 123R”), effective January 1, 2006. This statement requires all share-based payments to employees, including grants of employee stock options and restricted stock awards, to be recognized in the financial statements based on their grant-date fair values. We did not have any unvested stock options outstanding as of January 1, 2006.
Use of Estimates: The preparation of financial statements in conformity with accounting principles generally accepted in the United States of America requires management to make estimates and certain assumptions that affect the reported amounts of assets and liabilities and disclosure of contingent liabilities at the date of the
70
Table of Contents
FLOTEK INDUSTRIES, INC.
NOTES TO CONSOLIDATED FINANCIAL STATEMENTS
financial statements and the reported amounts of revenue and expenses during the reporting period. While management believes current estimates are reasonable and appropriate, actual results could differ from these estimates.
Reclassifications: Certain amounts for fiscal 2007 and 2006 have been reclassified in the accompanying consolidated condensed financial statements to conform to the current year presentation. In prior years we presented depreciation that related directly to the production of revenue as a component of Depreciation and amortization within our Statement of Income and Comprehensive Income rather than including the portion as a component of Cost of sales. During 2007 and 2006 the amount of depreciation related to the production of revenue which we have reclassified to cost of sales was $4.3 million and $1.8 million.
Supplemental Cash Flow Information:
| For the Year Ended December 31, | |||||||||||
| 2008 | 2007 | 2006 | |||||||||
| (in thousands) | |||||||||||
| Supplemental non-cash investing activities: |
|||||||||||
| Acquisitions, net of cash acquired: |
|||||||||||
| Fair value of net assets acquired |
$ | 97,973 | $ | 58,233 | $ | 17,354 | |||||
| Less cash acquired |
— | (605 | ) | (208 | ) | ||||||
| Less debt issued |
— | (1,544 | ) | — | |||||||
| Less equity issued |
— | (1,855 | ) | (4,383 | ) | ||||||
| Less equity in earnings prior to acquisition and other |
— | (1,201 | ) | — | |||||||
| Acquisitions, net of cash acquired |
$ | 97,973 | $ | 53,028 | $ | 12,763 | |||||
| Capital leases |
$ | 599 | $ | 206 | $ | 647 | |||||
| Supplemental cash flow information: |
|||||||||||
| Interest paid |
$ | 6,434 | $ | 2,852 | $ | 864 | |||||
| Income taxes paid |
$ | 8,244 | $ | 8,061 | $ | 5,380 | |||||
Recent Accounting Pronouncements
In May 2008, the Financial Accounting Standards Board (the “FASB”) issued FAS No. 162, “The Hierarchy of Generally Accepted Accounting Principles” (“FAS 162”). This statement identifies the sources of accounting principles and the framework for selecting the principles used in the preparation of financial statements of nongovernmental entities that are presented in accordance with GAAP. With the issuance of this statement, the FASB concluded that the GAAP hierarchy should be directed toward the entity and not its auditor, and reside in the accounting literature established by the FASB as opposed to the American Institute of Certified Public Accountants (AICPA) Statement on Auditing Standards No. 69, “The Meaning of Present Fairly in Conformity With Generally Accepted Accounting Principles.” This statement is effective 60 days following the SEC’s approval of the Public Company Accounting Oversight Board amendments to AU Section 411, “The Meaning of Present Fairly in Conformity With Generally Accepted Accounting Principles.” The adoption of FAS 162 is not expected to have a material impact on the Company’s results from operations or financial position.
In April 2008, the FASB issued FSP 142-3, “Determination of the Useful Life of Intangible Assets”, (FSP 142-3). FSP 142-3 amends the factors that should be considered in developing renewal or extension assumptions used to determine the useful life of a recognized intangible asset under SFAS No. 142, “Goodwill
71
Table of Contents
FLOTEK INDUSTRIES, INC.
NOTES TO CONSOLIDATED FINANCIAL STATEMENTS
and Other Intangible Assets”. FSP 142-3 is effective for fiscal years beginning after December 15, 2008. The implementation of this standard will not have a material impact on our consolidated financial position and results of operations.
In March 2008, the FASB issued FAS No. 161, “Disclosures about Derivative Instruments and Hedging Activities-an amendment of FASB Statement No. 133” (“FAS No. 161”). This statement requires enhanced disclosures about our derivative and hedging activities. This statement is effective for financial statements issued for fiscal years and interim periods beginning after November 15, 2008. We will adopt FAS No. 161 beginning January 1, 2009. We are currently evaluating the impact, if any, that the standard will have on our consolidated financial statements.
In December 2007, the FASB issued FAS No. 160, “Non-controlling Interests in Consolidated Financial Statements — an amendment of ARB No. 51”, (“FAS No. 160”). FAS No. 160 requires (i) that non-controlling (minority) interests be reported as a component of shareholders’ equity, (ii) that net income attributable to the parent and to the non-controlling interest be separately identified in the consolidated statement of operations, (iii) that changes in a parent’s ownership interest while the parent retains its controlling interest be accounted for as equity transactions, (iv) that any retained non-controlling equity investment upon the deconsolidation of a subsidiary be initially measured at fair value, and (v) that sufficient disclosures are provided that clearly identify and distinguish between the interests of the parent and the interests of the non-controlling owners. FAS No. 160 is effective for annual periods beginning after December 15, 2008 and should be applied prospectively. The presentation and disclosure requirements of the statement shall be applied retrospectively for all periods presented. We adopted FAS No. 160 on January 1, 2009 and there was no impact on our financial statements. Retroactive application of FAS 160 will have an effect on the presentation of our financial statements related to December 31, 2007.
In December 2007, the FASB issued Statement of Financial Accounting Standards No. 141R, Business Combinations (“FAS 141R”), to replace Statement of Financial Accounting Standards No. 141, Business Combinations (“FAS 141”). FAS 141R requires use of the acquisition method of accounting, defines the acquirer, establishes the acquisition date and broadens the scope to all transactions and other events in which one entity obtains control over one or more other businesses. This statement is effective for financial statements issued for fiscal years beginning on or after December 15, 2008 with earlier adoption prohibited. While the Company does not expect the adoption of FAS 141R to have a material impact on its consolidated financial statements for transactions completed prior to December 31, 2008, the impact of the accounting change could be material for business combinations which may be consummated subsequent thereto.
In February 2007, the FASB issued Statement of Financial Accounting Standards No. 159, “The Fair Value Option for Financial Assets and Financial Liabilities” (“FAS 159”). FAS 159, provides an option to report selected financial assets and liabilities at fair value and establishes presentation and disclosure requirements. The fair value option established by FAS 159 permits the Company to elect to measure eligible items at fair value on an instrument-by-instrument basis and then report unrealized gains and losses for those items in the Company’s earnings. FAS 159, is effective for fiscal years beginning after November 15, 2007. We adopted FAS 159 on January 1, 2008. As we did not elect to measure existing assets and liabilities at fair value, the adoption did not have an effect on our financial statements.
Note 3—Acquisitions
In December 2007, the FASB issued Statement of Financial Accounting Standards No. 141R, Business Combinations (“SFAS No. 141R”), to replace Statement of Financial Accounting Standards No. 141, Business Combinations (“SFAS No. 141”). SFAS No. 141R requires use of the acquisition method of accounting, defines
72
Table of Contents
FLOTEK INDUSTRIES, INC.
NOTES TO CONSOLIDATED FINANCIAL STATEMENTS
the acquirer, establishes the acquisition date and broadens the scope to all transactions and other events in which one entity obtains control over one or more other businesses. This statement is effective for financial statements issued for fiscal years beginning on or after December 15, 2008 with earlier adoption prohibited. We have not acquired any companies since adopting SFAS No. 141R and accordingly the companies we acquired prior to December 15, 2008 have been accounted for under SFAS 141. The Company had no deferred acquisition costs capitalized on its Balance Sheet as of December 15, 2008 related to unconsummated acquisitions.
Acquisitions have been accounted for using the purchase method of accounting under SFAS No. 141 “Accounting for Business Combinations”. The acquired companies’ results have been included in the accompanying financial statements from their respective dates of acquisition. Allocation of the purchase price for acquisitions was based on the estimates of fair value of the net assets acquired and is subject to adjustment upon finalization of the purchase price allocation within the one year anniversary of the acquisition.
On February 14, 2008, Teledrift Acquisition, Inc, a wholly-owned subsidiary of the Company, acquired substantially all of the assets of Teledrift, Inc. (“Teledrift”) for the aggregate cash purchase price of approximately $98.0 million, which includes a purchase price adjustment of $1.8 million recorded in the third quarter of 2008. The asset purchase agreement provides for a potential adjustment in the aggregate purchase price. Teledrift designs and manufactures wireless survey and measurement while drilling, or MWD, tools. The Company used the proceeds from issuance of the convertible senior notes to fund this acquisition.
The purchase price of the Teledrift acquisition, including acquisition costs of $0.8 million, was allocated to the assets acquired and liabilities assumed based on estimated fair values. In accordance with FAS 141, the excess of the purchase price over the net fair value of the assets acquired and liabilities assumed was allocated to goodwill. Management has completed its assessment of intangible assets acquired and the associated fair market value and useful life of those assets. The table below details the recorded investment in Teledrift:
| Recorded Investment |
||||
| (in thousands) | ||||
| Accounts receivable |
$ | 3,663 | ||
| Other current assets |
14 | |||
| Inventories |
2,488 | |||
| Property, plant and equipment |
14,596 | |||
| Goodwill |
46,396 | |||
| Intangible assets |
31,642 | |||
| Accounts payable |
(826 | ) | ||
| Total purchase price |
$ | 97,973 | ||
The following pro forma table presents information related to the Teledrift acquisition for the years ended December 31, 2008, 2007 and 2006 and assumes the acquisition had been completed as of January 1, 2006:
| 2008(1) | 2007 | 2006 | ||||||||
| (unaudited) | ||||||||||
| Revenue |
$ | 227,971 | $ | 175,104 | $ | 114,639 | ||||
| Income before income taxes |
(40,270 | ) | 29,709 | 18,187 | ||||||
| Net income (loss) |
(33,658 | ) | 18,319 | 11,515 | ||||||
| Basic earnings (loss) per common share (2) |
$ | (1.76 | ) | $ | 1.00 | $ | 0.67 | |||
| Diluted earnings (loss) per common share |
$ | (1.76 | ) | $ | 0.97 | $ | 0.62 | |||
73
Table of Contents
FLOTEK INDUSTRIES, INC.
NOTES TO CONSOLIDATED FINANCIAL STATEMENTS
| (1) | Amounts have been retrospectively revised as a result of the adoption, effective January 1, 2009, of FASB Staff Position APB 14-1, Accounting for Convertible Debt Instruments That May Be Settled in Cash Upon Conversion (including Partial Cash Settlement). |
| (2) | Amounts have been retrospectively revised as a result of the adoption, effective January 1, 2009, of FASB Staff Position EITF 03-6-1, Determining Whether Instruments Granted in Share-Based Payment Transactions Are Participating Securities. |
The Company made three acquisitions in 2006. On January 2, 2006, the Company purchased the assets of Can-Ok Oil Field Services, Inc. and Stabilizer Technology, Inc. (collectively “Can-Ok”), a downhole oilfield tool company located in Chickasha, Oklahoma. On April 3, 2006, the Company purchased the tangible assets and licensed the rights to exercise the exclusive worldwide rights to a patented gas separator used in coal bed methane production from Total Well Solutions, LLC (“TWS”). TWS markets and services electric submersible pumps and downhole gas/water separators primarily to coal bed methane gas producers in the Powder River Basin. On June 6, 2006, the Company purchased the assets of LifTech, LLC (“LifTech”) which markets and services electric submersible pumps and downhole gas/water separators primarily to coal bed methane gas producers in the Powder River Basin.
On January 4, 2007, the Company acquired substantially all the assets of Triumph Drilling Tools, Inc. (“Triumph”) for $31.1 million in cash. Triumph is a leading regional provider of down-hole rental equipment to the oil and gas industry. Results of operations for Triumph are included in the Company’s consolidated condensed statements of income as of January 1, 2007.
The purchase price of the Triumph acquisition was allocated to the assets acquired and liabilities assumed based on estimated fair values. In accordance with FAS No. 141, the excess of the purchase price over the net fair value of the assets acquired and liabilities assumed was allocated to goodwill. The table below details the recorded investment in Triumph, (in thousands):
| Accounts receivable |
$ | 3,304 | ||
| Other current assets |
263 | |||
| Inventories |
827 | |||
| Property, plant and equipment |
7,028 | |||
| Intangible assets |
1,884 | |||
| Goodwill |
19,872 | |||
| Accounts payable |
(1,414 | ) | ||
| Accrued liabilities |
(533 | ) | ||
| Notes payable |
(109 | ) | ||
| Total purchase price |
$ | 31,122 | ||
74
Table of Contents
FLOTEK INDUSTRIES, INC.
NOTES TO CONSOLIDATED FINANCIAL STATEMENTS
The following pro forma table presents information related to the Triumph acquisition for the year ended December 31, 2006 and assumes the acquisition had been completed as of January 1, 2006:
| 2006 | |||
| (in thousands, except share data) | |||
| Unaudited | |||
| Revenue |
$ | 116,638 | |
| Income before income taxes |
20,044 | ||
| Net income |
12,684 | ||
| Basic earnings per common share |
0.73 | ||
| Diluted earnings per common share |
0.68 | ||
In January 2007, the Company acquired a 50% partnership interest in CAVO Drilling Motors Ltd Co. (“CAVO”) for approximately $2.6 million in cash, 143,434 shares of our common stock valued at $1.9 million and a $1.5 million promissory note to the seller. CAVO is a complete downhole motor solutions provider specializing in the rental, servicing and sale of high-performance mud motors for a variety of drilling applications. CAVO serves both the domestic and international drilling markets with a customer base extending throughout North America, South America, Russia and West Africa. For the first ten months of 2007 the Company reported the partnership interest in CAVO using the equity method of accounting as the Company did not own a controlling interest. The equity in earnings and other adjustments affecting the Company’s investment in CAVO during 2007 were approximately $1.2 million.
On November 15, 2007, the Company completed its acquisition of the remaining 50% partnership interest in CAVO. The Company paid aggregate consideration of $12.5 million in cash and assumed $0.2 million in long-term debt. From November 1, 2007 through the end of the year CAVO was accounted for as a fully owned subsidiary.
On August 31, 2007, the Company acquired Sooner Energy Services, Inc. (“Sooner”) for $7.2 million in cash. Sooner develops, produces and distributes specialty chemical products and services for drilling and production of natural gas. Sooner serves natural gas producers, oilfield supply stores, drilling mud and other service companies in North America. Results of operations for Sooner are included in the Company’s consolidated condensed statement of income as of September 1, 2007.
Note 4—Product Revenue
The Company generates revenue through three main sales channels: Products, Rentals and Services. In most instances we generate revenue through these channels on an integrated basis. Sales channel information is set out in the table below (in thousands):
| For the Year Ended December 31, | |||||||||
| 2008 | 2007 | 2006 | |||||||
| Revenue: |
|||||||||
| Product |
$ | 145,074 | $ | 118,443 | $ | 81,374 | |||
| Rental |
60,343 | 24,349 | 12,144 | ||||||
| Service |
20,646 | 15,216 | 7,124 | ||||||
| $ | 226,063 | $ | 158,008 | $ | 100,642 | ||||
75
Table of Contents
FLOTEK INDUSTRIES, INC.
NOTES TO CONSOLIDATED FINANCIAL STATEMENTS
| For the Year Ended December 31, | |||||||||
| 2008 | 2007 | 2006 | |||||||
| Cost of Revenue: |
|||||||||
| Product |
$ | 88,384 | $ | 71,190 | $ | 49,456 | |||
| Rental |
28,093 | 11,086 | 5,985 | ||||||
| Service |
11,556 | 8,021 | 4,023 | ||||||
| Depreciation |
7,274 | 4,264 | 1,785 | ||||||
| $ | 135,307 | $ | 94,561 | $ | 61,249 | ||||
Note 5—Inventories
The components of inventories as of December 31, 2008 and 2007 were as follows:
| 2008 | 2007 | |||||||
| (in thousands) | ||||||||
| Raw materials |
$ | 16,258 | $ | 9,040 | ||||
| Work-in-process |
1,890 | 366 | ||||||
| Finished goods (includes in-transit) |
22,286 | 14,005 | ||||||
| Gross inventories |
40,434 | 23,411 | ||||||
| Less: Slow-moving and obsolescence reserve |
(2,407 | ) | (2,394 | ) | ||||
| Inventories, net |
$ | 38,027 | $ | 21,017 | ||||
The Company periodically reviews its slow-moving inventories for indications of obsolescence or excess quantities by reviewing historical trends and current market conditions and records a reserve based upon this analysis using management judgment.
Note 6—Property, Plant and Equipment
As of December 31, 2008 and 2007, property, plant and equipment were comprised of the following:
| 2008 | 2007 | |||||||
| (in thousands) | ||||||||
| Land |
$ | 1,381 | $ | 921 | ||||
| Buildings and leasehold improvements |
16,354 | 13,767 | ||||||
| Machinery, equipment and rental tools |
55,866 | 30,574 | ||||||
| Equipment in progress |
5,472 | 277 | ||||||
| Furniture and fixtures |
1,172 | 603 | ||||||
| Transportation equipment |
4,927 | 3,737 | ||||||
| Computer equipment |
1,255 | 584 | ||||||
| Gross property, plant and equipment |
86,427 | 50,463 | ||||||
| Less: Accumulated depreciation |
(19,592 | ) | (10,639 | ) | ||||
| Property, plant and equipment, net |
$ | 66,835 | $ | 39,824 | ||||
Depreciation expense for the years ended December 31, 2008, 2007 and 2006 was $9.4 million, $5.4 million and $2.4 million. Depreciation expense that directly relates to activities that generate revenue amounted to $7.3 million, $4.3 million and $1.8 million for the years ended December 31, 2008, 2007 and 2006, respectively, is recorded within Cost of revenues in our Statement of Income and Comprehensive Income.
76
Table of Contents
FLOTEK INDUSTRIES, INC.
NOTES TO CONSOLIDATED FINANCIAL STATEMENTS
Note 7—Goodwill
We evaluate the carrying value of goodwill during the fourth quarter of each year and on an interim basis, if events occur or circumstances change that would more likely than not reduce the fair value of the reporting unit below its carrying amount. Such circumstances could include, but are not limited to: (i) a significant adverse change in legal factors or in business climate, (ii) unanticipated competition, or (iii) an adverse action or assessment by a regulator. When evaluating whether goodwill is impaired, the Company compares the fair value of the reporting unit to which the goodwill is assigned to the reporting unit’s carrying amount, including goodwill. The fair value of the reporting unit is estimated using a combination of the income, or discounted cash flows approach and the market approach, which utilizes comparable companies’ data. If the carrying amount of a reporting unit exceeds its fair value, then the amount of the impairment loss must be measured. The impairment loss is calculated by comparing the implied fair value of reporting unit goodwill to its carrying amount. In calculating the implied fair value of reporting unit’s goodwill, the fair value of the reporting unit is allocated to all of the other assets and liabilities of that unit based on their fair values. The excess of the fair value of a reporting unit over the amount assigned to its other assets and liabilities is the implied fair value of goodwill. An impairment loss would be recognized when the carrying amount of goodwill exceeds its implied fair value.
As a result of our annual fourth quarter review of goodwill, we recorded non-cash impairment charges of $61.5 million. Our recoverability assessment of these non-amortizing intangible assets considered company-specific projections, assumptions about market participant views and the company’s overall market capitalization around the testing period. All of those factors worsened during 2008 compared to amounts used for the 2007 evaluations.
For the 2008 test, the estimated fair values indicated that the second step of goodwill impairment analysis was required in three of our four reporting units, and that analysis showed that the current value of goodwill could not be sustained in those three reporting units. Accordingly, we recorded a goodwill impairment charge of $61.5 million, relating to the following reporting units: Artificial Lift, $5.9 million; Drilling Products (other than Teledrift), $43.0 million and Teledrift, $12.6 million. Included in these impairment charges is goodwill resulting from 2005 and later acquisitions. All of these entities are considered integrated into their respective reporting units and their cash flows were aggregated with all other cash flows of the respective reporting unit in the determination of estimated fair value.
77
Table of Contents
FLOTEK INDUSTRIES, INC.
NOTES TO CONSOLIDATED FINANCIAL STATEMENTS
The following is a reconciliation of goodwill by segment:
| Balance and Activity as of: |
Chemicals and Logistics |
Drilling Products |
Artificial Lift |
Total | |||||||||||
| January 1, 2006 |
$ | 7,620 | $ | 4,768 | $ | — | $ | 12,388 | |||||||
| Goodwill acquired: |
|||||||||||||||
| Can-OK |
— | 4,521 | — | 4,521 | |||||||||||
| TWS |
— | — | 2,977 | 2,977 | |||||||||||
| LifTech |
— | — | 3,899 | 3,899 | |||||||||||
| Purchase price adjustment |
— | 400 | — | 400 | |||||||||||
| 2006 Changes |
— | 4,921 | 6,876 | 11,797 | |||||||||||
| December 31, 2006 |
7,620 | 9,689 | 6,876 | 24,185 | |||||||||||
| Goodwill acquired: |
|||||||||||||||
| Triumph |
— | 19,872 | — | 19,872 | |||||||||||
| CAVO |
— | 13,487 | — | 13,487 | |||||||||||
| Sooner |
3,990 | — | — | 3,990 | |||||||||||
| Purchase price adjustments and reclassifications to intangible assets |
— | (39 | ) | (1,015 | ) | (1,054 | ) | ||||||||
| 2007 Changes |
3,990 | 33,320 | (1,015 | ) | 36,295 | ||||||||||
| December 31, 2007 |
11,610 | 43,009 | 5,861 | 60,480 | |||||||||||
| Goodwill acquired: |
|||||||||||||||
| Teledrift |
— | 46,396 | — | 46,396 | |||||||||||
| Impairments |
— | (55,572 | ) | (5,861 | ) | (61,433 | ) | ||||||||
| 2008 Changes |
— | (9,176 | ) | (5,861 | ) | (15,037 | ) | ||||||||
| December 31, 2008 |
$ | 11,610 | $ | 33,833 | $ | — | $ | 45,443 | |||||||
78
Table of Contents
FLOTEK INDUSTRIES, INC.
NOTES TO CONSOLIDATED FINANCIAL STATEMENTS
Note 8—Intangible and Other Assets
The components of intangible and other assets as of December 31, 2008 and 2007 are as follows:
| 2008 | 2007 | |||||||
| (in thousands) | ||||||||
| Intangibles assets: |
||||||||
| Patents |
$ | 6,280 | $ | 2,877 | ||||
| Customer lists |
28,543 | 6,404 | ||||||
| Non-compete agreements |
1,715 | 1,715 | ||||||
| Brand name |
6,199 | 47 | ||||||
| Supply contract |
1,700 | 1,700 | ||||||
| Other |
501 | 502 | ||||||
| Accumulated amortization |
(11,459 | ) | (1,839 | ) | ||||
| Total |
33,479 | 11,406 | ||||||
| Deferred financing costs |
5,650 | 162 | ||||||
| Accumulated amortization |
(1,114 | ) | (83 | ) | ||||
| Net deferred financing costs |
4,536 | 79 | ||||||
| Intangible assets, net |
$ | 38,015 | $ | 11,485 | ||||
| Other assets |
$ | 4 | $ | 405 | ||||
Intangible and other assets are being amortized on a straight-line basis ranging from 2 to 20 years. We recorded amortization expense related to our intangible assets in Depreciation and amortization in our Consolidated Statement of Income and Comprehensive Income of $3.4 million, $1.1 million and $0.4 million for the years ended December 31, 2008, 2007 and 2006, respectively.
The Company estimates the aggregate amortization expense of intangibles for the years ending December 31, 2009, 2010, 2011, 2012 and 2013 to be $3.8 million, $3.8 million, $3.4 million, $2.9 million and $2.1 million, respectively.
On September 30, 2007, the Company acquired, the patent underlying the exclusive license agreement which was part of the acquisition of TWS in April 2006 for $2.5 million in cash. With the purchase, the Company was immediately relieved of the payment obligations under the exclusive license agreement. The purchase was funded using the Company’s revolving line of credit under the Senior Credit Facility with Wells Fargo. The patent is being amortized over 15 years.
At least annually, we review our other assets for possible impairment if market conditions indicate a potential for impairment. We review our amortizing intangible assets at least annually to determine whether events and circumstances warrant a revision to the remaining period of amortization. In developing forecasts for our assessment of goodwill, we concluded that the value of certain amortizing intangible assets was impaired. During 2008, we recorded a charge of approximately $6.2 million related to the impairment of our intangible assets primarily related to the customer lists and patents in our Artificial Lift and Drilling Products segments.
79
Table of Contents
FLOTEK INDUSTRIES, INC.
NOTES TO CONSOLIDATED FINANCIAL STATEMENTS
Note 9—Long-term Debt and Capital Leases
Long-term debt as of December 31, 2008 and 2007 consisted of the following:
| 2008 | 2007 | |||||||
| (in thousands) | ||||||||
| Convertible Senior Notes |
$ | 115,000 | $ | — | ||||
| Discount on Convertible Senior Notes |
(24,197 | ) | — | |||||
| Convertible Senior Notes, net of discount |
$ | 90,803 | $ | — | ||||
| Long-term debt: |
||||||||
| Senior Credit Facility |
||||||||
| Equipment term loans |
34,000 | 41,167 | ||||||
| Real estate term loans |
787 | 857 | ||||||
| Revolving line of credit |
2,311 | 15,448 | ||||||
| Promissory notes to stockholders of acquired businesses, maturing February 2008 |
— | 159 | ||||||
| Promissory note to stockholders of acquired business, maturing December 2009 |
515 | 1,030 | ||||||
| Capital lease obligations |
882 | 750 | ||||||
| Total |
38,495 | 59,411 | ||||||
| Less: Current portion |
(9,017 | ) | (7,034 | ) | ||||
| Long-term debt, less current portion |
$ | 29,478 | $ | 52,377 | ||||
Convertible Senior Notes
On February 11, 2008, the Company entered into an underwriting agreement (the “Notes Underwriting Agreement”) with the subsidiary guarantors named therein (the “Guarantors”) and Bear, Stearns & Co. Inc. (the “Underwriter”). The Notes Underwriting Agreement related to the issuance and sale (the “Notes Offering”) of $100.0 million aggregate principal amount of the Company’s 5.25% Convertible Senior Notes due 2028 (the “Notes”). The Notes are guaranteed on a senior, unsecured basis by the Guarantors. Pursuant to the Notes Underwriting Agreement, the Company granted the Underwriter a 13-day over-allotment option to purchase up to an additional $15.0 million aggregate principal amount of Notes, which was exercised in full on February 12, 2008. The net proceeds received from the issuance of the Notes was $111.8 million.
The Notes Underwriting Agreement contains customary representations, warranties and agreements by the Company and the Guarantors, and customary conditions to closing, indemnification obligations of both the Company and the Guarantors, on the one hand, and the Underwriter, on the other hand, including for liabilities under the Securities Act of 1933, obligations of the parties and termination provisions.
The Company used the net proceeds from the Notes Offering to finance the acquisition of Teledrift and for general corporate purposes.
In applying FSP 14-1, $27.8 million of the carrying value of our Convertible Notes was reclassified to equity as of the February 2008 issuance date and offset by a related deferred tax liability of $10.6 million, assuming the effective tax rate at inception of the Convertible Notes was 38%. This discount represents the equity component of the proceeds from the Convertible Notes, calculated assuming an 11.5% non-convertible borrowing rate. The discount will be accreted to interest expense over the expected term of five years, which is based on the call/put
80
Table of Contents
FLOTEK INDUSTRIES, INC.
NOTES TO CONSOLIDATED FINANCIAL STATEMENTS
option on the debt at February 2013. Accordingly, $3.6 million of additional non-cash interest expense was recorded in the Consolidated Statement of Income (Loss) and Comprehensive Income (Loss) for the year ended December 31, 2008.
Senior Credit Facility
On February 4, 2008, the Company entered into a Second Amendment (the “Amendment”) to the Amended and Restated Credit Agreement (as amended, modified or supplemented prior to the date thereof, the “Senior Credit Facility”), dated as of August 31, 2007, between the Company and Wells Fargo Bank, National Association. The Senior Credit Facility consisted of a revolving line of credit, an equipment term loan and two real estate term loans. The Amendment permitted the Company to consummate the acquisition of Teledrift, to issue up to $150 million in convertible senior notes due 2028 to fund the purchase price of Teledrift, and to incur additional capital expenditures, and includes new financial covenants and other amendments.
The Amendment increased the principal payment required to be made by the Company from $0.5 million monthly to $2.0 million quarterly effective June 30, 2008.
On March 31, 2008, the Company entered into a new Credit Agreement with Wells Fargo Bank, National Association (the “New Credit Agreement”). The New Credit Agreement provides for a revolving credit facility of a maximum of $25 million (the “New Revolving Credit Facility”) and a term loan facility of $40 million (the “New Term Loan Facility”) (collectively, the “New Senior Credit Facility”). The Company refinanced all but approximately $0.8 million of the outstanding indebtedness under its Senior Credit Facility with borrowings under the New Credit Facility. The amount under the Senior Credit Facility that was not refinanced relates to certain existing real estate loans.
The obligations of the Company under the New Credit Agreement are guaranteed by the Company’s domestic subsidiaries and are secured by substantially all present and future assets of the Company and its subsidiaries.
The New Revolving Credit Facility will mature and be payable in full on March 31, 2011. The maximum amount of credit available under the Revolving Credit Facility is equal to the lesser of $25 million or the sum of: (i) 85% of the Company’s eligible accounts receivable, plus (ii) 50% of the Company’s eligible inventory. The Company is required to repay the aggregate outstanding principal amount of the New Term Loan Facility in quarterly installments of $2.0 million each, commencing with the quarter ending June 30, 2008. All remaining amounts owed pursuant to the New Term Loan Facility mature and will be payable in full on March 31, 2011.
The Company must make mandatory prepayments under the New Term Loan Facility annually beginning April 15, 2009, equal to 50% of the Company’s excess cash flow for the previous calendar year. The Company is further required to make certain mandatory prepayments under the New Term Loan Facility upon the receipt of proceeds from any debt or equity issuances and upon certain assets sales. In addition, if the outstanding balance under the New Term Loan Facility exceeds 75% of the appraised orderly liquidation value of the Company’s fixed assets at any time, the Company must reduce the New Term Loan Facility by such excess amount.
Interest accrues on amounts under the New Credit Facility at variable rates based on, at the Company’s election, the prime rate or LIBOR, plus an applicable margin specified in the New Credit Agreement as amended by the Second Amendment. A minimum of 50% of Advances as defined in the New Credit Agreement must be swapped from a floating to a fixed interest rate. At December 31, 2008, $23 million of the debt was swapped to a 3.32% fixed rate. The rate of interest related to borrowings outstanding under the New Credit Agreement at December 31, 2008 was 5.14%.
81
Table of Contents
FLOTEK INDUSTRIES, INC.
NOTES TO CONSOLIDATED FINANCIAL STATEMENTS
The New Credit Agreement contains certain financial and other covenants, including a minimum net worth covenant, a maximum leverage ratio covenant, a minimum fixed charge coverage ratio covenant, a maximum senior leverage ratio covenant, a covenant restricting capital expenditures, a covenant limiting the incurrence of additional indebtedness, and a covenant restricting acquisitions, which are substantially the same as the covenants under the prior Senior Credit Facility.
As of December 31, 2008, we had $2.3 million outstanding under the revolving line of credit of the New Senior Credit Facility. Availability under the revolving line of credit as of December 31, 2008 is approximately $1.0 million. Bank borrowings are subject to certain covenants and a material adverse change subjective acceleration clause. Affirmative covenants include compliance with laws, various reporting requirements, visitation rights, maintenance of insurance, maintenance of properties, keeping of records and books of account, preservation of existence of assets, notification of adverse events, ERISA compliance, joint agreement with new subsidiaries, borrowing base audits and use of treasury management services. Negative covenants include limitations associated with liens, indebtedness, change in nature of business, transactions with affiliates, investments, distributions, subordinate debt, leverage ratio, fixed charge coverage ratio, consolidated net income, prohibition of fundamental changes, asset sales and capital expenditures.
The Company evaluated its goodwill and other intangible assets in the fourth quarter of 2008, and recorded an impairment of $67.7 million. As a result, we did not meet the Minimum Net Worth covenant contained within our credit agreement as of December 31, 2008. On February 25, 2009, we entered into a First Amendment and Temporary Waiver Agreement (the “Amendment”) with our lenders, which amended the terms of our New Credit Agreement dated as of March 31, 2008. The Amendment, among other things, increased the interest rate margins applicable to advances under the New Credit Agreement, decreased the aggregate revolving commitment under the New Credit Agreement to $15.0 million, and provides a temporary waiver of any breach by Flotek of the Minimum Net Worth covenant in the Credit Agreement through the earlier of May 15, 2009 or the occurrence of certain other specified events. The Amendment also permits the Company to exchange shares of its common stock for up to $40.0 million of our Convertible Senior Notes.
Our financial projections for 2009 indicated that we could potentially be in non-compliance with the Leverage Ratio, Minimum Net Worth and Fixed Charge Coverage Ratio Covenants contained within our New Credit Agreement during 2009. Due to all of these factors, we negotiated a Second Amendment (the “Second Amendment”) to our New Credit Agreement with our lenders. The Second Amendment changes the manner in which our borrowing base is computed and increases our interest rate and fees associated with borrowings under the New Credit Agreement, limits our permitted maximum capital expenditures to $8.0 million and $11.0 million for 2009 and 2010, respectively and established new covenants related to the Minimum Net Worth, Leverage and Fixed Charge Coverage Ratios.
82
Table of Contents
FLOTEK INDUSTRIES, INC.
NOTES TO CONSOLIDATED FINANCIAL STATEMENTS
The Second Amendment reduces the maximum amount of credit available under the Revolving Credit Facility by changing the manner in which our borrowing base is determined. The changes in our maximum available credit under this amended facility are described in the table below:
| Equal to the lesser of: | New Credit Agreement | New Credit Agreement, As Amended | ||
| $25 million or | $15 million or | |||
| 85% of the Company’s eligible accounts receivable, plus | 80% of the Company’s eligible accounts receivable, plus | |||
| 50% of the Company’s eligible inventory | 50% of the Company’s eligible inventory is limited to eligible inventory, limited to the lesser of $5.0 million or 50% of the Company’s borrowing base, as defined |
A summary of the changes to the Minimum Net Worth covenant, Leverage Ratio and Fixed Charge Coverage Ratio are as follows:
Minimum Net Worth:
| Criteria | New Credit Agreement | New Credit Agreement, As Amended | ||||||
| Company’s net worth, plus | As of the fiscal quarter ending December 31, 2007 | 80% | As of the fiscal quarter ending December 31, 2008 | 90% | ||||
| An amount equal to, plus | Borrowers consolidated Net Income for each fiscal quarter ending after December 31, 2007 in which such consolidated Net Income is greater than $0 | 75% | Borrowers consolidated Net Income for each fiscal quarter ending after December 31, 2008 in which such consolidated Net Income is greater than $0 | 75% | ||||
| An amount equal to | Equity issuance proceeds received by Borrower or any Subsidiary after December 31, 2007 | 100% | Equity issuance proceeds received by Borrower or any Subsidiary after December 31, 2008 | 100% | ||||
Leverage Ratio:
| Criteria | New Credit Agreement | New Credit Agreement, As Amended | ||||||
| Period | Covenant | Period | Covenant | |||||
| Borrower shall not permit the Leverage Ratio as of the end of the period to be more than: | For each fiscal quarter ending prior to September 30, 2008 | 3.50 to 1.00 |
||||||
| For each fiscal quarter ending on or after September 30, 2008 but prior to March 31, 2009 | 3.00 to 1.00 |
|||||||
83
Table of Contents
FLOTEK INDUSTRIES, INC.
NOTES TO CONSOLIDATED FINANCIAL STATEMENTS
| Criteria | New Credit Agreement | New Credit Agreement, As Amended | ||||||
| Period | Covenant | Period | Covenant | |||||
| For each fiscal quarter ending prior to March 31, 2009 | 3.00 to 1.00 | |||||||
| For each fiscal quarter ending on or after March 31, 2009 but prior to September 30, 2009 | 2.75 to 1.00 |
For fiscal quarter ending on March 31, 2009 | 3.35 to 1.00 | |||||
| For fiscal quarter ending on June 30, 2009 | 3.95 to 1.00 | |||||||
| For each fiscal quarter ending on or after September 30, 2009 | 2.50 to 1.00 |
For fiscal quarter ending on September 30, 2009 | 4.80 to 1.00 | |||||
| For fiscal quarter ending on December 31, 2009 | 5.30 to 1.00 | |||||||
| For fiscal quarter ending on March 31, 2010 | 4.60 to 1.00 | |||||||
| For fiscal quarter ending on June 30, 2010 | 3.90 to 1.00 | |||||||
| For fiscal quarter ending on September 30, 2010 | 3.40 to 1.00 | |||||||
| For each fiscal quarter ending on or after December 30, 2010 | 3.10 to 1.00 | |||||||
Fixed Charge Coverage Ratio
| Criteria | New Credit Agreement | New Credit Agreement, As Amended | ||||||
| Period | Covenant | Period | Covenant | |||||
| Borrow shall not permit the Fixed Charge Coverage Ratio for the period described to be less than: | For each fiscal quarter | 1.25 to 1.00 |
For each fiscal quarter ending prior to March 31, 2009 | 1.25 to 1.00 | ||||
| For fiscal quarter ending on December 31, 2009 | 1.10 to 1.00 | |||||||
| For each fiscal quarter ending after December 31, 2009 | 1.25 to 1.00 | |||||||
As of December 31, 2008, the Company had approximately $0.8 million in vehicle loans and capitalized vehicle leases.
84
Table of Contents
FLOTEK INDUSTRIES, INC.
NOTES TO CONSOLIDATED FINANCIAL STATEMENTS
Promissory note to stockholders of acquired business, maturing December 2009
In conjunction with the acquisition of a 50% interest in CAVO in January 2007, the Company issued a note to the seller in the amount of $1.5 million. The note bears interest at 6% and is payable quarterly through December 31, 2009.
Maturities of long-term debt obligations, capital leases, and convertible senior notes at December 31, 2008 are as follows (in thousands):
| Long-term Debt |
Capital Leases |
Total Long-term Debt and Capital Leases |
Convertible Senior Notes | |||||||||
| Year Ending December 31,: |
||||||||||||
| 2009 |
$ | 8,585 | $ | 432 | $ | 9,017 | $ | — | ||||
| 2010 |
8,716 | 186 | 8,902 | — | ||||||||
| 2011 |
20,312 | 125 | 20,437 | — | ||||||||
| 2012 |
— | 102 | 102 | — | ||||||||
| Thereafter |
— | 37 | 37 | 115,000 | ||||||||
| Total |
$ | 37,613 | $ | 882 | $ | 38,495 | $ | 115,000 | ||||
Note 10—Interest Rate Swap
As required by the Senior Credit Facility, the Company has entered into an interest rate swap agreement on 50% of the New Term Loan Facility to partially reduce our exposure to interest rate risk. At December 31, 2008, the interest rate swap had a notional amount of $23.0 million, swap rate of 3.32% and a fair value of ($0.5) million. The Company records the fair value of the swap in accrued liabilities and the unrealized loss in other income (expense).
Note 11—Fair Value Disclosure
The Company adopted FAS 157 as of January 1, 2008, which defines fair value, establishes a frame work for measuring fair value and establishes a valuation hierarchy for disclosure of the inputs to the valuation used to measure fair value. The implementation of FAS 157 did not cause a change in the method of calculating fair value of assets and liabilities. The primary impact from the adoption was additional disclosures.
The Company adopted FAS 157, except as it applies to those nonfinancial assets and nonfinancial liabilities addressed in FASB Staff Position FAS 157-2 (“FSP FAS 157-2”). The FASB issued FSP FAS 157-2 which delays the effective date of FAS No. 157 to fiscal years beginning after November 15, 2008 for all nonfinancial assets and nonfinancial liabilities, except those that are recognized or disclosed at fair value in the financial statements on a recurring basis (at least annually).
FAS 157 establishes a hierarchy for disclosure into three broad levels. The valuation hierarchy categorizes assets and liabilities measured at fair value into one of three different levels depending on the observability of the inputs employed in the measurement. The three levels are defined as follows:
| • | Level 1—inputs are quoted prices (unadjusted) in active markets for identical assets or liabilities. |
85
Table of Contents
FLOTEK INDUSTRIES, INC.
NOTES TO CONSOLIDATED FINANCIAL STATEMENTS
| • | Level 2—inputs are quoted prices for similar assets and liabilities in active markets or inputs that are observable for the asset or liability, either directly or indirectly through market corroboration, for substantially the full term of the financial instrument. |
| • | Level 3—inputs are unobservable inputs based on the Company’s assumptions used to measure assets and liabilities at fair value. |
A financial asset or liability’s classification within the hierarchy is determined based on the lowest level input that is significant to the fair value measurement. The Company’s assessment of the significance of a particular input to the fair value measurement in its entirety requires judgment and considers factors specific to the asset or liability. The following table presents information about the Company’s liability measured at fair value on a recurring basis as of December 31, 2008, and indicates the fair value hierarchy of the valuation techniques utilized by the Company to determine such a fair value (in thousands):
| Level 1 |
Level 2 | Level 3 |
Total | |||||||
| Convertible Senior Notes |
— | $ | 28,750 | — | $ | 28,750 | ||||
The Company determined the estimated fair value amount of the Convertible Senior Notes by using available market information and commonly accepted valuation methodologies. However, considerable judgment is required in interpreting market data to develop estimates of fair value. Accordingly, the fair value estimate presented herein is not necessarily indicative of the amount that the Company or the debt-holder could realize in a current market exchange. The use of different assumptions and/or estimation methodologies may have a material effect on the estimated fair value.
Note 12—Earnings Per Share (“EPS”)
Basic EPS excludes dilution and is computed by dividing net income by the weighted average number of common shares outstanding for the period. Diluted EPS is based on the weighted average number of shares outstanding during each period and the assumed exercise of dilutive instruments (stock options and unvested restricted stock) less the number of common shares assumed to be purchased with the exercise proceeds using the average market price of the Common Stock for each of the periods presented. Due to the Net loss in 2008, 170,446 shares of dilutive shares relating to stock options have been excluded from the calculation of Diluted EPS due to their anti-dilutive effect.
In connection with the Notes Offering, the Company entered into a Share Lending Agreement with Bear Stearns International Ltd. (“BSIL”). In view of the contractual undertakings of BSIL in the Share Lending Agreement (see Note 14), which have the effect of substantially eliminating the economic dilution that otherwise would result from the issuance of the borrowed shares, the Company believes that under accounting principles generally accepted in the United States of America, the borrowed shares should not be considered outstanding for the purpose of computing and reporting the Company’s earnings per share.
86
Table of Contents
FLOTEK INDUSTRIES, INC.
NOTES TO CONSOLIDATED FINANCIAL STATEMENTS
Note 13—Income Taxes
The following are the components of total income tax expense:
| For the Years Ended December 31, | |||||||||||
| 2008 | 2007 | 2006 | |||||||||
| (in thousands) | |||||||||||
| Current: |
|||||||||||
| Federal |
$ | 8,681 | $ | 9,718 | $ | 5,142 | |||||
| State |
1,254 | 1,525 | 594 | ||||||||
| Foreign |
447 | 272 | 305 | ||||||||
| Total current |
10,382 | 11,515 | 6,041 | ||||||||
| Deferred: |
|||||||||||
| Federal |
(20,287 | ) | (1,091 | ) | 542 | ||||||
| State |
(594 | ) | (10 | ) | — | ||||||
| Total deferred |
(20,881 | ) | (1,101 | ) | 542 | ||||||
| Provision (benefit) for income taxes |
$ | (10,499 | ) | $ | 10,414 | $ | 6,583 | ||||
Our effective income tax rate differs from the federal statutory rate primarily due to state income taxes, permanent tax differences, impairments and changes in valuation allowances. As of December 31, 2008, we had estimated U.S. net operating loss carryforwards of approximately $18.9 million, expiring in various amounts in 2018 to 2028.
| For the Years Ended December 31, |
|||||||||
| 2008 | 2007 | 2006 | |||||||
| Federal statutory rate |
35.0 | % | 35.0 | % | 35.0 | % | |||
| State income taxes, net of federal benefit |
(0.8 | ) | 3.2 | 2.2 | |||||
| Write-off of NOL deferred tax asset |
— | — | 0.9 | ||||||
| Change in valuation allowance |
— | — | (0.9 | ) | |||||
| Goodwill impairment |
(11.6 | ) | — | — | |||||
| Other |
0.9 | 0.2 | (0.5 | ) | |||||
| Effective income tax rate |
23.5 | % | 38.4 | % | 36.7 | % | |||
87
Table of Contents
FLOTEK INDUSTRIES, INC.
NOTES TO CONSOLIDATED FINANCIAL STATEMENTS
Deferred income taxes reflect the net tax effects of temporary differences between the carrying amounts of assets and liabilities for financial reporting purposes and the amounts reported for income tax purposes at the enacted tax rates in effect when the differences reverse. The components of our deferred tax asset and liabilities are as follows:
| December 31, | ||||||||
| 2008 | 2007 | |||||||
| (in thousands) | ||||||||
| Deferred tax assets: |
||||||||
| Allowance of doubtful accounts |
$ | 533 | $ | 494 | ||||
| Inventory valuations |
707 | — | ||||||
| Equity compensation |
170 | 580 | ||||||
| Intangibles |
15,055 | — | ||||||
| Convertible debt |
317 | — | ||||||
| Net operating loss carryforwards |
6,783 | 1,713 | ||||||
| Other deferred assets |
14 | 3 | ||||||
| Deferred tax assets |
23,579 | 2,790 | ||||||
| Deferred tax liabilities: |
||||||||
| Inventory valuations |
— | (168 | ) | |||||
| Intangibles |
— | (3,066 | ) | |||||
| Property, plant and equipment |
(6,696 | ) | (2,120 | ) | ||||
| Discount on convertible debt |
(9,195 | ) | — | |||||
| Prepaid insurance |
(101 | ) | — | |||||
| Other deferred assets |
(30 | ) | (38 | ) | ||||
| Deferred tax liabilities |
(16,022 | ) | (5,392 | ) | ||||
| Net deferred tax assets (liabilities) |
$ | 7,557 | $ | (2,602 | ) | |||
The current portion of deferred tax assets and liabilities is presented net in current assets or current liabilities of the Balance Sheet, as appropriate. Long-term deferred tax assets and liabilities are presented net in other assets or long-term liabilities of the Balance Sheet, as appropriate. At December 31, 2008, total net deferred tax assets of $7.6 million is distributed between Deferred tax assets, current ($0.9 million) and Deferred tax assets, less current portion ($6.7 million). At December 31, 2007, total net deferred tax liabilities of $2.6 million is distributed between Deferred tax assets, current ($0.3 million) and Deferred tax liabilities, less current portion ($2.9 million).
Our current corporate organizational structure requires us to file two separate consolidated U.S. Federal income tax returns. As a result, taxable income of one group cannot be offset by tax attributes, including net operating losses, of the other group.
We have not provided for withholding and U.S. taxes for the unremitted earnings of certain non-U.S. subsidiaries because we intend to permanently reinvest a portion of the unremitted earnings of our non-U.S. subsidiaries in their foreign operations. At December 31, 2008, we had approximately $0.5 million in unremitted earnings outside the United States for which withholding and U.S. taxes were not provided. Income tax expense would be incurred if these funds were remitted to the United States. It is not practicable to estimate the amount of the deferred tax liability on such unremitted earnings.
FIN 48 clarifies the criteria that an individual tax position must satisfy for some or all of the benefits of that position to be recognized in a company’s financial statements. FIN 48 prescribes a recognition threshold of
88
Table of Contents
FLOTEK INDUSTRIES, INC.
NOTES TO CONSOLIDATED FINANCIAL STATEMENTS
more-likely-than-not, and a measurement attribute for all tax positions taken or expected to be taken on a tax return, in order for those tax positions to be recognized in the financial statements. Effective January 1, 2007, the Company adopted the provisions of FIN 48. There were no unrecognized tax positions upon adoption or at December 31, 2007. As a result, the cumulative effect related to adopting FIN 48 was a $73,000 charge to retained earnings related to additional penalties and interest. In addition, certain amounts have been reclassified in the Consolidated Condensed Balance Sheets in order to comply with the requirements of the statement.
In 2008 the Company closed the 2005 and 2006 Internal Revenue Service audits with no material impact to the Company. The Company and its subsidiaries’ state income tax returns are open to audit under the statute of limitations for the years ending December 31, 2005 through 2007.
Beginning January 1, 2007, the Company accounts for interest and penalties related to uncertain tax positions as part of its provision for income taxes. Prior to 2007, the Company recorded interest related to uncertain tax positions in interest expense and did not include it as part of its provision for income taxes. As of December 31, 2008, the Company has accrued $217,000 of interest and penalties related to uncertain tax positions.
Note 14—Capital Stock
On July 11, 2007, the Company effected a two-for-one stock split in the form of a 100% stock dividend to stockholders of record as of July 3, 2007. All share and per share information has been retroactively adjusted to reflect the stock split.
The Company’s Certificate of Incorporation, as amended, authorizes the Company to issue up to 40,000,000 shares of common stock, par value $0.0001 per share, and 100,000 shares of one or more series of preferred stock.
Equity Awards
The Company issues equity awards to our officers, key employees, and non-employee directors In 2003 stockholders approved the 2003 Long Term Incentive Plan (“2003 Plan”), under which awards may be granted to employees and non-employee directors in the form of stock options, restricted stock and certain other incentive awards. The maximum number of shares or units that may be issued under the 2003 Plan is 1,400,000. In 2005, shareholders approved the 2005 Long Term Incentive Plan (“2005 Plan”). Under the 2005 Plan the number of shares that may be used for awards other than stock options, restricted stock and certain other incentive awards was 1,900,000. In 2007, shareholders approved the 2007 Long Term Incentive Plan (“2007 Plan”). Under the 2007 Plan the number of shares that may be used for awards other than stock options, restricted stock and certain other incentive awards was 2,200,000. At December 31, 2008, options to purchase a total of 857,251 shares were outstanding under the 2003 and 2005 Plans. At December 31, 2008 there were zero and 104,558 shares available for grant under the 2003 Plan and 2005 Plans, respectively. No equity awards have been granted under the 2007 Plan in 2008. Under the Plans, the option exercise price is equal to the fair market value of our common stock at the date of grant. Options currently expire no later than 10 years from the grant date and generally vest within four years or less. Proceeds received by us from exercises of stock options are credited to common stock and additional paid-in capital.
The weighted-average estimated fair value of stock options granted during 2008 and 2007 was $4.37 and $7.21 per share, respectively. These amounts were determined using the Black-Scholes option-pricing model, which values options based on the stock price at the grant date, the expected life of the option, the estimated volatility of
89
Table of Contents
FLOTEK INDUSTRIES, INC.
NOTES TO CONSOLIDATED FINANCIAL STATEMENTS
the stock, the expected dividend payments, and the risk-free interest rate over the expected life of the option. The assumptions used in the Black-Scholes model were as follows for stock options granted in 2008 and 2007:
| For the Years Ended December 31, | |||||
| 2008 | 2007 | ||||
| Risk-free interest rate |
2.30% | 4.06% - 4.82% | |||
| Expected volatility of common stock |
47.0% | 39.7% - 42.0% | |||
| Expected life of options |
4.25 years | 5.00 years | * | ||
| Vesting period |
4 years | 1 - 4 years | |||
| Dividend yield |
0.0% | 0.0% | |||
| * | During 2007 significant options were also granted with a weighted-average expected life of 3.5 years. |
The risk free interest rate is based on the yield of U.S. Treasury securities that correspond to the expected holding period of the options. Volatility for the options granted in 2008 represents the weighted average of volatility of a group of companies which are considered peers. The results of the analysis support one expected term for all groups of employees. The expected forfeiture rate of 5% for 2008 was determined based on the historical stock option forfeiture data.
The Black-Scholes option valuation model was developed for estimating the fair value of traded options that have no vesting restrictions and are fully-transferable. Because option valuation models require the use of subjective assumptions, changes in these assumptions can materially affect the fair value of the options, and our options do not have the characteristics of traded options, the option valuation models do not necessarily provide a reliable measure of the fair value of our options.
At December 31, 2008, there was $6.1 million of total measured but unrecognized compensation expense related to non-vested compensation arrangements granted under our plans. The cost is expected to be recognized over a weighted average period of 2.6 years.
A summary of stock option activity for the years ended December 31, 2006, 2007 and 2008 is as follows:
| Shares Underlying Options |
Weighted- average Exercise Price | |||||
| Outstanding as of January 1, 2006 |
2,246,872 | $ | 2.07 | |||
| Exercised |
(600,432 | ) | $ | 0.96 | ||
| Outstanding as of December 31, 2006 |
1,646,440 | $ | 2.47 | |||
| Granted |
295,488 | $ | 17.90 | |||
| Exercised |
(594,724 | ) | $ | 2.53 | ||
| Cancelled |
(11,570 | ) | $ | 5.32 | ||
| Outstanding as of December 31, 2007 |
1,335,634 | $ | 5.77 | |||
| Granted |
139,812 | $ | 22.16 | |||
| Exercised |
(518,973 | ) | $ | 1.74 | ||
| Cancelled |
(99,222 | ) | $ | 17.65 | ||
| Outstanding as of December 31, 2008 |
857,251 | $ | 9.57 | |||
90
Table of Contents
FLOTEK INDUSTRIES, INC.
NOTES TO CONSOLIDATED FINANCIAL STATEMENTS
| Shares Underlying Options |
Weighted- average Exercise Price | ||||
| Options exercisable as of December 31, 2006 |
1,646,440 | $ | 2.47 | ||
| Options exercisable as of December 31, 2007 |
1,043,216 | $ | 2.44 | ||
| Options exercisable as of December 31, 2008 |
625,594 | $ | 6.00 | ||
The total intrinsic value of stock options exercised in 2008, 2007 and 2006 was $9.0 million, $12.3 million and $6.3 million, respectively. The aggregate intrinsic value of stock options outstanding and exercisable at December 31, 2008 was $0.4 million and $0.4 million, respectively. The intrinsic value is calculated as the difference between the fair value as of the end of the period and the exercise price of the stock options.
The weighted average contractual life remaining on outstanding stock options was approximately five, six and eight years as of December 31, 2008, 2007 and 2006, respectively.
In 2007, the Company awarded 338,017 restricted shares of common stock (“RSAs”) to certain employees under the 2005 Plan. Of these RSAs 64,417 were four year performance based and 273,600 were time-vesting.
In 2008, the Company awarded 52,392 RSAs to certain employees under the 2005 Plan. Of these RSAs, 40,072 were 4 year performance based and 12,320 were time-vesting. A summary of RSA activity for the years ended December 31, 2007 and 2008 follows:
| Shares Underlying RSA’s |
|||
| Unvested as of January 1, 2007 |
— | ||
| Granted |
338,017 | ||
| Forfeited |
(1,256 | ) | |
| Unvested as of December 31, 2007 |
336,761 | ||
| Granted |
52,392 | ||
| Vested |
(85,788 | ) | |
| Forfeited |
(69,867 | ) | |
| Unvested as of December 31, 2008 |
233,498 | ||
The weighted average grant date fair value of unvested RSAs at December 31, 2008 was $24.51.
Treasury Stock
During 2007, the Company repurchased 70,174 shares of its common stock issued in conjunction with the acquisition of Spidle Sales and Services, Inc. The repurchase of these shares was optional by the parties involved in the acquisition agreement.
In 2008, the Company purchased 17,400 shares of its common stock upon the vesting of employee restricted stock awards granted in 2007 which vested. The shares repurchased from employees at the vesting of the restricted stock offset the income taxes owed by the employee. Additionally, shares previously issued as restricted stock awards to employees were forfeited during 2008 and accounted for as treasury stock.
The Company accounts for treasury stock using the cost method and includes treasury stock as a component of stockholders’ equity. The Company currently does not have or intend to initiate a share repurchase program.
91
Table of Contents
FLOTEK INDUSTRIES, INC.
NOTES TO CONSOLIDATED FINANCIAL STATEMENTS
Share Lending Agreement
On February 11, 2008, and in connection with the Common Stock Underwriting Agreement and the Notes Underwriting Agreement, the Company entered into a share lending agreement (the “Share Lending Agreement”) with Bear Stearns International Limited (“BSIL”) and the Underwriter, as agent for BSIL. Under this agreement, the Company agreed to loan to BSIL 3,800,000 shares of Common Stock during a period beginning the date the Company entered into the Share Lending Agreement and ending on February 15, 2028, or earlier, if the Company notifies BSIL in writing of its intent to terminate the Share Lending Agreement in accordance with the agreement’s terms or in certain other circumstances including a breach by BSIL of any of its representations and warrantees covenants or agreements under the share lending agreement, or the bankruptcy of BSIL. BSIL borrowed all 3,800,000 shares on the closing of the Stock Offering. The Company did not receive any proceeds from the sale of the borrowed shares of Common Stock pursuant to the Share Lending Agreement, but the Company did receive a loan fee of $0.0001 per share for each share of Common Stock that the Company loaned to BSIL. Under the Share Lending Agreement, BSIL is permitted to use the shares borrowed from the Company and offered in the Stock Offering only for the purpose of directly or indirectly facilitating the sale of the Notes and the hedging of the Notes by holders.
Upon the conversion of the Notes, a number of shares of Common Stock proportional to the conversion rate for such Notes must be returned to the Company. Any borrowed shares returned to the Company cannot be re-borrowed.
The shares that the Company loaned to BSIL are issued and outstanding for corporate law purposes, and accordingly, the holders of the borrowed shares have all of the rights of a holder of the Company’s outstanding shares, including the right to vote the shares on all matters submitted to a vote of the Company’s shareholders and the right to receive any dividends or other distributions that the Company may pay or makes on its outstanding shares of Common Stock. However, under the Share Lending Agreement, BSIL has agreed:
| • | To pay, within one business day after the relevant payment date, to the Company an amount equal to any cash dividends that the Company pays on the borrowed shares; and |
| • | To pay or deliver to the Company, upon termination of the loan of borrowed shares, any other distribution, in liquidation or otherwise, that the Company makes on the borrowed shares. |
To the extent the borrowed shares the Company lent under the Share Lending Agreement and offered in the Stock Offering have not been sold or returned to the Company, BSIL has agreed that it will not vote any such borrowed shares of which it is the record owner. BSIL has also agreed under the Share Lending Agreement that it will not transfer or dispose of any borrowed shares, other than to its affiliates, unless such transfer or disposition is pursuant to a registration statement that is effective under the Securities Act. However, investors that purchase the shares from BSIL (and any subsequent transferees of such purchasers) will be entitled to the same voting rights with respect to those shares as any other holder of Common Stock.
In view of the contractual undertakings of BSIL in the Share Lending Agreement, which have the effect of substantially eliminating the economic dilution that otherwise would result from the issuance of the borrowed shares, the Company believes that under generally accepted accounting principles in the United States currently in effect, the borrowed shares will not be considered outstanding for the purpose of computing and reporting the Company’s earnings per share.
We did not receive any proceeds from the sale by BSIL of the borrowed shares. If BSIL were to become bankrupt, we would be an unsecured creditor and could receive significantly less than the value of the shares we have loaned to BSIL under the share lending agreement. In such event, we would also likely have to consider the shares that we have loaned to BSIL to be outstanding for the purpose of computing our earnings per share.
92
Table of Contents
FLOTEK INDUSTRIES, INC.
NOTES TO CONSOLIDATED FINANCIAL STATEMENTS
Common Stock Underwriting Agreement
Concurrently with the Notes Offering, on February 11, 2008, the Company entered into an underwriting agreement (the “Stock Underwriting Agreement”) with BSIL and the Underwriter, as agent for BSIL. The Stock Underwriting Agreement related to the issuance and delivery to BSIL (the “Stock Offering”) of 3,800,000 shares of the Company’s common stock, par value $0.0001 per share (the “Common Stock” and, together with the Notes, the “Securities”). The Stock Underwriting Agreement contemplates that the Underwriter will sell the shares of Common Stock loaned to BSIL in accordance with the Share Lending Agreement (as defined below). Under the Stock Underwriting Agreement, the Underwriter will initially offer 3,138,200 loaned shares of Common Stock to the public at $17.50 per share in a fixed price offering and, following such offering, will offer additional loaned shares in variable price offerings from time to time on the terms and in the amounts the Underwriter deems advisable. Accordingly, the Company will not receive any proceeds from the sale of the Common Stock, but will receive a nominal lending fee of $0.0001 per share from BSIL for use of the shares. BSIL or its affiliate will receive all the proceeds from the sale of the shares.
The Stock Underwriting Agreement contains customary representations, warranties and agreements by the Company, and customary conditions to closing, indemnification obligations of the Company, on the one hand, and the Underwriter, on the other hand, including for liabilities under the Securities Act of 1933, obligations of the parties and termination provisions.
The Securities were and will be sold pursuant to the Company’s shelf registration statement on Form S-3 (File No. 333-148384), which was originally declared effective December 28, 2007 and subsequently amended by Post-Effective Amendment No. 1 filed on February 5, 2008, and related prospectuses filed with the Securities and Exchange Commission.
Note 15—Related Party Transactions
The Company purchased from Phoenix E&P Technology, LLC (‘Phoenix”) its manufacturing assets, inventory and intellectual property rights to produce oilfield shale shaker screens on January 28, 2005. The assets were purchased for $46,640 with a three-year royalty interest on all shale shaker screens produced. Phoenix is 75% owned by Chisholm Energy Partners (“CEP”). Jerry D. Dumas, Sr., our Chief Executive Officer and Chairman, and Dr. Glenn Penny, our former President, each has a 2 1/2% indirect ownership interest in CEP, and John Chisholm, a director of Flotek, has a 30% ownership interest in CEP. No royalties were earned during 2008, 2007 or 2006.
Note 16—Commitments and Contingencies
The Company is involved, on occasion, in routine litigation incidental to our business.
93
Table of Contents
FLOTEK INDUSTRIES, INC.
NOTES TO CONSOLIDATED FINANCIAL STATEMENTS
The Company has entered into operating leases for office space, vehicles and equipment. Future minimum lease payments under our operating and capital leases are as follows (in thousands):
| For the Years Ended December 31, |
Operating Leases |
Capital Leases |
Total | ||||||||
| 2009 |
$ | 1,898 | $ | 485 | $ | 2,383 | |||||
| 2010 |
1,466 | 216 | 1,682 | ||||||||
| 2011 |
1,377 | 143 | 1,520 | ||||||||
| 2012 |
1,149 | 106 | 1,255 | ||||||||
| 2013 |
420 | 39 | 459 | ||||||||
| Thereafter |
1,503 | — | 1,503 | ||||||||
| Less: Imputed Interest |
— | (107 | ) | (107 | ) | ||||||
| Total |
$ | 7,813 | $ | 882 | $ | 8,695 | |||||
Total rent expense under these operating leases totaled approximately $1.7 million, $1.5 million and $0.4 million during the years ended December 31, 2008, 2007 and 2006, respectively.
401(k) Retirement Plan
The Company maintains a 401(k) retirement plan for the benefit of eligible employees in the United States. All employees are eligible for the plan upon date of employment. In March 2006, the Company began matching 0.25% of each employee’s 1% contribution up to 0.75% of qualified compensation. As of January 1, 2008, the Company increased its match to 100% of each employee’s 401(k) contribution up to 4% of qualified compensation. The consolidated financial statements for 2008, 2007 and 2006 include expense of approximately $940,000, $89,000 and $16,000, respectively, related to the Company 401(k) match.
Concentrations
Essentially all of our revenue is derived from the oil and gas industry. This concentration of customers in one industry increases our credit and business risk, particularly given the volatility of activity levels in the industry. The majority of our sales are to major or large independent oilfield service companies with established credit histories, and actual credit losses have been insignificant.
The customers for our products and services include major integrated oil and natural gas companies, independent oil and natural gas companies, pressure pumping service companies and state-owned national oil companies. One of our customers accounted for 12% of our consolidated revenues for each of the years ended December 31, 2008 and 2007. No single customer accounted for more than 10% of our consolidated revenues in the year ended December 31, 2006. Our top five customers accounted for 34% of our consolidated revenues for each of the years ended December 31, 2008 and 2007 and 30% of consolidated revenue for the year ended December 31, 2006.
The majority of the sales to our top five customers were in the Chemicals and Logistics segment and collectively accounted for approximately 63%, 52% and 47% of revenue for this segment for the years ended December 31, 2008, 2007 and 2006, respectively. Our top three customers accounted for 25%, 15% and 12% of the segments revenue for the year ended December 31, 2008, respectively. In fiscal 2007, these companies accounted for 21%, 14% and 10% of segment revenue, respectively, while in fiscal 2006 these companies accounted for 11%, 15% and 14% of segment revenue, respectively.
Two of our top customers also make purchases for another one of our other top customers as part of their normal business operations. We cannot quantify the magnitude of purchase made by one of our customers on behalf of
94
Table of Contents
FLOTEK INDUSTRIES, INC.
NOTES TO CONSOLIDATED FINANCIAL STATEMENTS
another entity. While these three customers are not under common control nor are they affiliates of each other or Flotek, combined they accounted for 40%, 38% and 28% of segment revenue for the years ended December 31, 2008, 2007 and 2006 respectively. These two customers accounted for 20%, 21% and 14% of consolidated revenues for the same periods, respectively. A loss of this combined customer group would negatively impact the Company’s operating results.
One customer, accounted for 56%, 53% and 43% of the Artificial Lift segment revenue for the years ended December 31, 2008, 2007 and 2006, respectively.
None of these customers were a related party or affiliate of Flotek during any of the years ended December 31, 2008, 2007 or 2006.
Note 17—Segment Information
Operating segments are defined as components of an enterprise about which separate financial information is available that is evaluated regularly by the chief operating decision-maker in deciding how to allocate resources and in assessing performance.
The Company has determined that there are three reportable segments:
| • | The Chemicals and Logistics segment is made up of two business units. The specialty chemical business unit designs, develops, manufactures packages and sells chemicals used by oilfield service companies in oil and gas well drilling, cementing, stimulation and production. The logistics business unit manages automated bulk material handling, loading facilities, and blending capabilities for oilfield service companies. |
| • | The Drilling Products segment rents, inspects, manufactures and markets downhole drilling equipment for the energy, mining, water well and industrial drilling sectors. |
| • | The Artificial Lift segment manufactures and markets artificial lift equipment which includes the Petrovalve line of beam pump components, electric submersible pumps, gas separators, valves and services to support coal bed methane production. |
The Company evaluates performance based on several factors, of which the primary financial measure is business segment income before taxes. The accounting policies of the business segments are the same as those described in “Note 2—Summary of Significant Accounting Policies.” Inter-segment sales are accounted for at fair value as if sales were to third parties and are eliminated in the consolidated financial statements.
95
Table of Contents
FLOTEK INDUSTRIES, INC.
NOTES TO CONSOLIDATED FINANCIAL STATEMENTS
Summarized financial information concerning the segments as of and for the years ending December 31, 2008, 2007 and 2006 is shown in the following table (in thousands):
| Chemicals and Logistics |
Drilling Products |
Artificial Lift |
Corporate and Other |
Total | |||||||||||||||
| 2008 |
|||||||||||||||||||
| Net revenue to external customers |
$ | 109,356 | $ | 98,262 | $ | 18,445 | $ | — | $ | 226,063 | |||||||||
| Income (loss) from operations |
$ | 37,433 | $ | (43,840 | ) | $ | (6,709 | ) | $ | (17,635 | ) | $ | (30,751 | ) | |||||
| Depreciation and amortization (1) |
$ | 1,782 | $ | 10,121 | $ | 633 | $ | 308 | $ | 12,844 | |||||||||
| Total assets (2) |
$ | 44,060 | $ | 176,287 | $ | 16,104 | $ | (1,906 | ) | $ | 234,575 | ||||||||
| Goodwill |
$ | 11,610 | $ | 33,833 | $ | — | $ | — | $ | 45,443 | |||||||||
| Capital expenditures |
$ | 2,464 | $ | 19,840 | $ | 293 | $ | 1,114 | $ | 23,711 | |||||||||
| Interest expense (2) |
$ | — | $ | 43 | $ | — | $ | 13,770 | $ | 13,813 | |||||||||
| 2007 |
|||||||||||||||||||
| Net revenue to external customers |
$ | 86,271 | $ | 56,836 | $ | 14,901 | $ | — | $ | 158,008 | |||||||||
| Income (loss) from operations |
$ | 32,389 | $ | 5,632 | $ | 1,381 | $ | (9,716 | ) | $ | 29,686 | ||||||||
| Depreciation and amortization (1) |
$ | 960 | $ | 4,909 | $ | 557 | $ | 111 | $ | 6,537 | |||||||||
| Total assets |
$ | 42,849 | $ | 97,730 | $ | 17,827 | $ | 2,387 | $ | 160,793 | |||||||||
| Goodwill |
$ | 11,610 | $ | 42,887 | $ | 5,861 | $ | 122 | $ | 60,480 | |||||||||
| Capital expenditures |
$ | 6,313 | $ | 8,532 | $ | 653 | $ | 174 | $ | 15,672 | |||||||||
| Interest expense |
$ | 2 | $ | 73 | $ | — | $ | 3,426 | $ | 3,501 | |||||||||
| 2006 |
|||||||||||||||||||
| Net revenue to external customers |
$ | 50,545 | $ | 36,753 | $ | 13,344 | $ | — | $ | 100,642 | |||||||||
| Income (loss) from operations |
$ | 16,845 | $ | 6,325 | $ | 1,514 | $ | (5,831 | ) | $ | 18,853 | ||||||||
| Depreciation and amortization (1) |
$ | 395 | $ | 2,044 | $ | 154 | $ | 157 | $ | 2,750 | |||||||||
| Total assets |
$ | 25,459 | $ | 39,748 | $ | 16,860 | $ | 823 | $ | 82,890 | |||||||||
| Goodwill |
$ | 7,620 | $ | 9,689 | $ | 6,876 | $ | — | $ | 24,185 | |||||||||
| Capital expenditures |
$ | 3,222 | $ | 5,293 | $ | 635 | $ | 51 | $ | 9,201 | |||||||||
| Interest expense |
$ | 3 | $ | 33 | $ | 6 | $ | 963 | $ | 1,005 | |||||||||
| (1) | Includes depreciation expense included in cost of revenue of $7,274, $4,264 and $1,785 for the years ended December 31, 2008, 2007 and 2006, respectively. |
| (2) | Amounts have been retrospectively revised as a result of the adoption, effective January 1, 2009, of FASB Staff Position APB 14-1, Accounting for Convertible Debt Instruments That May Be Settled in Cash Upon Conversion (including Partial Cash Settlement). |
96
Table of Contents
FLOTEK INDUSTRIES, INC.
NOTES TO CONSOLIDATED FINANCIAL STATEMENTS
Note 18—Quarterly Financial Data (Unaudited)
| First Quarter |
Second Quarter |
Third Quarter |
Fourth Quarter |
Total | |||||||||||||
| (in thousands, except per share data) | |||||||||||||||||
| 2008 |
|||||||||||||||||
| Revenue |
$ | 46,471 | $ | 56,809 | $ | 62,787 | $ | 59,996 | $ | 226,063 | |||||||
| Net income (loss) (1) |
3,209 | 4,439 | 5,173 | (46,982 | ) | (34,161 | ) | ||||||||||
| Earnings (loss) per share (2) |
|||||||||||||||||
| Basic |
0.17 | 0.23 | 0.27 | (2.44 | ) | (1.78 | ) | ||||||||||
| Diluted |
0.17 | 0.23 | 0.26 | (2.44 | ) | (1.78 | ) | ||||||||||
| 2007 |
|||||||||||||||||
| Revenue |
$ | 35,079 | $ | 37,802 | $ | 41,728 | $ | 43,399 | $ | 158,008 | |||||||
| Net income |
3,703 | 4,856 | 5,049 | 3,119 | 16,727 | ||||||||||||
| Earnings per share (2) |
|||||||||||||||||
| Basic |
0.21 | 0.27 | 0.27 | 0.17 | 0.91 | ||||||||||||
| Diluted |
0.20 | 0.25 | 0.27 | 0.16 | 0.88 | ||||||||||||
| (1) | Amounts have been retrospectively revised as a result of the adoption, effective January 1, 2009, of FASB Staff Position APB 14-1, Accounting for Convertible Debt Instruments That May Be Settled in Cash Upon Conversion (including Partial Cash Settlement). |
| (2) | Amounts have been retrospectively revised as a result of the adoption, effective January 1, 2009, of FASB Staff Position EITF 03-6-1, Determining Whether Instruments Granted in Share-Based Payment Transactions Are Participating Securities. |
Note 19—Subsequent Events
Through August 25, 2009, management has evaluated the events or transactions that have occurred for potential recognition or disclosure in the financial statements, the circumstances under which the Company should recognize events or transactions occurring after the June 30, 2009 balance sheet date in its financial statements and the disclosures that the Company should make about events or transactions that occurred after the balance sheet date.
Shareholder Lawsuit
On August 7, 2009, a class action suit was commenced in the United States District Court for the Southern District of Texas on behalf of purchasers of the common stock of the Company between May 8, 2007 and January 23, 2008, inclusive, seeking to pursue remedies under the Securities Exchange Act of 1934.
The complaint alleges that, throughout the time period indicated, Flotek failed to disclose material adverse facts about the Company’s true financial condition, business and prospects. Specifically, the complaint alleges that defendants failed to disclose the following adverse facts, among others: (i) the Company was experiencing weakness in its Rocky Mountain sales region due to its decision to not cut prices to the level of its competitors; (ii) the Company’s operating profit margins were being negatively impacted as customers increasingly opted to rent equipment instead of purchasing it; (iii) sales in the Company’s chemicals division were declining due to a decrease in fracing activity; and (iv) as a result of the foregoing, defendants’ positive statements concerning the Company’s guidance and prospects were lacking in a reasonable basis at all relevant times.
Since August 7, 2009, several other class action suits have been commenced by others concerning the foregoing matters. At this time and due to the recent filing of the lawsuits the Company is unable to provide further details.
97
Table of Contents
FLOTEK INDUSTRIES, INC.
NOTES TO CONSOLIDATED FINANCIAL STATEMENTS
The Company is subject to claims and legal actions in the ordinary course of our business. The Company believes that all such claims and actions currently pending against the Company are either adequately covered by insurance or would not have a material adverse effect.
Issuance of Preferred Stock
On August 11, 2009, we entered into agreements with a limited number of accredited investors to issue and sell in a private placement an aggregate of 16,000 units (“Units”) at a price of $1,000 per Unit. Each Unit is comprised of (i) one share of cumulative redeemable convertible preferred stock, (ii) warrants to purchase up to 155 shares of Flotek’s common stock at an exercise price of $2.31 per share and (iii) contingent warrants to purchase up to 500 shares of Flotek’s Common Stock at an exercise price of $2.45 per share. Each share of preferred stock will be convertible into 434.782 shares of common stock (for a conversion price of $2.30 per share), subject to adjustment in certain events. The closing of this private placement occurred on August 12, 2009, resulting in our receipt of gross proceeds of $16.0 million. The net proceeds received by Flotek in the private placement will be approximately $15 million. Flotek will use the net proceeds to reduce borrowings under its bank credit facility, thereby providing additional liquidity, and for general corporate purposes.
Each share of preferred stock has a liquidation preference of $1,000. Dividends on the preferred stock are payable quarterly in cash or, at Flotek’s option after obtaining shareholder approval, in shares of Flotek common stock based on the volume weighted average price of such shares for the ten trading days prior to the date the dividend is paid. Dividends will accrue at the rate of 15% of the liquidation preference per annum, and will be cumulative from the date on which the preferred stock is issued. The dividend rate will increase to 17.5% if Flotek has not obtained shareholder approval of (1) the contingent warrants described below, (2) the payment of dividends on the preferred stock in shares of common stock, and (3) an amendment to the Company’s certificate of incorporation increasing the shares of authorized common stock (“Shareholder Approval”) within 120 days following the closing of the private placement, will increase further to 20% if Shareholder Approval is not obtained within 240 days, and will revert to 15% upon any subsequent obtaining of such Shareholder Approval. Dividends will accumulate if not paid quarterly. Classification of the preferred shares as an equity instrument is contingent upon shareholder approval, which is expected to be obtained before the end of the next reporting period.
The preferred stock will, at Flotek’s option after Shareholder Approval (but not earlier than six months after the date on which the preferred stock was issued), be automatically converted into shares of common stock if the closing price of the common stock is equal to or greater than 150% of the then current conversion price for any 15 trading days during any 30 consecutive trading day period. If the preferred stock automatically converts and Flotek has not previously paid holders amounts equal to at least 8 quarterly dividends on the preferred stock, Flotek will also pay to the holders, in connection with any automatic conversion, and amount, in cash or shares of common stock (based on the market value of the common stock), equal to 8 quarterly dividends less any dividends previously paid to holders of the preferred stock.
Holders of the preferred stock will have no voting rights except as provided by law and as provided in the certificate of designation for the preferred stock. Holders of the preferred stock will have voting rights with respect to issuances of other preferred stock that is senior in rights to the preferred stock issued in the private placement and to amendments to the Company’s certificate of incorporation or the certificate of designations governing the preferred stock that would amend or adversely affect the rights of the preferred stock. In addition, in the event that dividends are not paid for any six quarters, whether or not consecutive, then the number of directors that make up Flotek’s Board of Directors will be increased to permit the holders of the majority of the then outstanding shares of preferred stock, voting separately as a class, to elect two directors.
98
Table of Contents
FLOTEK INDUSTRIES, INC.
NOTES TO CONSOLIDATED FINANCIAL STATEMENTS
Flotek will be required to make an offer to the holders of the preferred stock to repurchase any or all outstanding shares of preferred stock for cash at a price equal to 110% the liquidation preference of the preferred stock, plus accrued and unpaid dividends to the repurchase date, if Shareholder Approval has not been obtained by June 30, 2011. Flotek may redeem any of the preferred stock beginning on the third anniversary of the closing of the private placement. The initial redemption price will be 105% of the liquidation preference, declining to 102.5% on the fourth anniversary of the closing, and to 100% on or after the fifth anniversary of the closing, in each case plus accrued and unpaid dividends to the redemption date.
We also issued warrants in the private placement, of which warrants to purchase up to an aggregate of 2,480,000 shares of our Common Stock are currently exercisable at an exercise price of $2.31 per share (the “Exercisable Warrants”) and warrants to purchase up to 8,000,000 shares of our Common Stock are only exercisable after we obtain shareholder approval at an exercise price of $2.45 per share (the “Contingent Warrants”, and collectively with the Current Warrants, the “Warrants”).
The Exercisable Warrants will expire if not exercised within 60 months after the closing of the private placement. Subject to shareholder approval, the Exercisable warrants will contain anti-dilution price protection in the event Flotek issues shares of Common Stock or securities exercisable for or convertible into Common Stock at a price per share less than the exercise price of the Exercisable Warrants, subject to certain exceptions.
The Contingent Warrants will not be exercisable until after Shareholder Approval has been obtained (but regardless of whether shareholders approve payment of dividends on the preferred stock in shares of common stock). The Contingent Warrants will be exercisable only for cash unless Flotek is in breach of its obligations under the purchase agreements to provide an effective registration statement for the resale of the shares of common stock issuable upon exercise of the Contingent Warrants. The Contingent Warrants will expire if not exercised within the earlier of 60 months after Shareholder Approval or 98 months after the closing of the private placement. The Contingent warrants will contain anti-dilution price protection in the event Flotek issues shares of Common Stock or securities exercisable for or convertible into Common Stock at a price per share less than the exercise price of the Contingent Warrants, subject to certain exceptions.
Neither the Units nor the securities comprising the Units have been registered under the Securities Act of 1933, as amended, and may not be offered or sold in the United States absent a registration statement or exemption from registration.
Amendment of Credit Facility
In connection with the private placement, we also entered into an amendment to our Credit Facility. We entered into a Third Amendment and Waiver to the Credit Agreement (the “Third Amendment”) which (i) waives certain potential defaults would have occurred pursuant to the Credit Agreement as of June 30, 2009 without such a waiver, (ii) modifies certain of the financial and other covenants contained in the Credit Agreement, (iii) provides that we are permitted us to retain all of the net proceeds of the private placement, and also under most circumstances any proceeds derived by the Company from the exercise of any of the warrants issued in the private placement, and (iv) permits us to pay dividends in cash on the preferred stock in certain circumstances.
We determined during the second quarter of 2009 that the Company would breach the Leverage Ratio, the Fixed Charge Coverage Ratio, and the Net Worth covenants of the Credit Agreement as of the quarter end of June 30, 2009 and during subsequent quarters unless the Bank waived the possible June 30, 2009 breaches and these covenants were amended prospectively. The Third Amendment modifies these covenants in the manner requested by the Company as described below.
99
Table of Contents
FLOTEK INDUSTRIES, INC.
NOTES TO CONSOLIDATED FINANCIAL STATEMENTS
The Third Amendment amended the Leverage Ratio covenant. “Leverage Ratio” is defined as the ratio that the debt of the Company bears to its trailing EBITDA (net income plus interest, tax, depreciation and amortization expense and other non-cash charges). The Third Amendment amends this covenant as follows: (i) there would be no Leverage Ratio covenant applicable to the periods beginning with the second quarter of 2009 through and including the first quarter of 2010, and (ii) thereafter, the Leverage Ratio could not exceed (a) 4.75 to 1.00 for the quarter ending on June 30, 2010, (b) 4.00 to 1.00 for the quarter ending on September 30, 2010, and (c) 3.75 to 1.00 for each quarter ending on or after December 31, 2010.
The Third Amendment also amends the Fixed Charge Coverage Ratio covenant of the Credit Agreement. The Credit Agreement defines “Fixed Charge Coverage Ratio” as the ratio of (a) the Company’s EBITDA for the trailing four quarters to (b) Fixed Charges for those four quarters. “Fixed Charges” is defined as the sum of (i) interest expense, (ii) scheduled debt payments, including capital leases payments, (iii) taxes payments, and (iv) actual maintenance capital expenditures. The Third Amendment modifies this covenant by: (a) waiving the Fixed Charge Coverage Ratio for the second quarter of 2009, and (b) amending the Fixed Charge Coverage Ratio covenant for subsequent periods to provide that this ratio may not be less than: (i) 0.75 to 1.00 for the quarter ending September 30, 2009, (ii) 1.10 to 1.00 for the quarters ending December 31, 2009, March 31, 2010, and June 30, 2010, and (iii) 1.25 to 1.00 for each quarter ending on or after June 30, 2010. EBITDA and Fixed Charges will be determined for this purpose based on annualized results beginning with the results of the quarter ending September 30, 2009.
In addition, the Third Amendment amends the minimum Net Worth requirement set forth in the Credit Agreement. “Net Worth” is the shareholder’s equity of the Company and its subsidiaries, subject to certain adjustments. The Third Amendment modifies this covenant to now require that Net Worth at least equal (i) 90% of the Company’s Net Worth as of the end of the fiscal quarter ended June 30, 2009, plus (ii) 75% of the Company’s net income for each fiscal quarter ending after June 30, 2009 in which such net income is greater than $0 plus (iii) an amount equal to 100% of any proceeds of equity issuances by the Company after June 30, 2009.
Pursuant to the Third Amendment, the Company will be required to maintain through June 30, 2010 at least $5.0 million of cash and availability under its revolving line of credit pursuant to the Credit Agreement, and has agreed to increase the amount of the annual principal payment it is required to make pursuant to the Credit Agreement with respect to its term facility from 50% of Excess Cash Flow to 75% of Excess Cash Flow. “Excess Cash Flow” is the Company’s EBITDA, subject to certain adjustments, minus (b) the sum of the following during such period: (i) taxes, (ii) permitted capital expenditures, (iii) cash interest expense, and (iv) principal installment payments and optional prepayments of the term facility.
In addition, the Third Amendment makes certain other changes to the Credit Agreement, including making changes to the Credit Agreement relating to permitted debt, operating leases, acquisitions, and asset sales.
CEO Retirement
On August 11, 2009, we entered into a Retirement Agreement with Jerry Dumas, our Chairman and Chief Executive Officer, providing for his retirement from the Company. Pursuant to this Retirement Agreement: (i) Mr. Dumas will remain as Chief Executive Officer of the Company until the earlier of the date of the election of his replacement or January 1, 2010, (ii) Mr. Dumas will remain as Chairman of the Board and a director of the Company until the Company’s 2010 annual stockholders’ meeting, (iii) Mr. Dumas will remain as an employee of the Company through June 30, 2010, (iv) Mr. Dumas will perform throughout the term of his employment such duties as shall be assigned to him by the Board of Directors of the Company, which duties will not exceed the scope of the responsibilities of the Chief Executive Officer or President of the Company, and (v) Mr. Dumas
100
Table of Contents
FLOTEK INDUSTRIES, INC.
NOTES TO CONSOLIDATED FINANCIAL STATEMENTS
will assist in the transition of his duties as the Chief Executive Officer and President of the Company to his successor for 3 months after any such successor is elected. John W. Chisholm, one of our directors, will act as our interim President pending the election of a new Chief Executive Officer of the Company by providing services to Flotek through two companies controlled by Mr. Chisholm for which he will receive remuneration of $32,000 per month. The Retirement Agreement provides for the payment to Mr. Dumas of his current salary through June 30, 2010, a one-time payment of $225,000 on June 30, 2010, and for acceleration of vesting of his outstanding equity grants as of June 30, 2010.
Additionally, on August 11, 2009, Mr. Dumas purchased 200 Units related to the private placement for $200,000.
Other Matters
On March 13, 2009, William R. Ziegler resigned as a director of the Company. The Company will file a current report on Form 8-K reporting such event within the required time period.
101
Table of Contents
| Item 9. | Changes in and Disagreements With Accountants on Accounting and Financial Disclosure. |
None.
| Item 9A. | Controls and Procedures. |
We maintain disclosure controls and procedures that are designed to ensure that information required to be disclosed by the Company in reports filed or submitted under the Securities Exchange Act of 1934, as amended (the Act), is recorded, processed, summarized and reported within the time periods specified in the SEC’s rules and forms. Our disclosure controls and procedures include controls and procedures designed to ensure that information required to be disclosed under the Act is accumulated and communicated to management, including our Chief Executive Officer (CEO), Chief Financial Officer (CFO) and Chief Accounting Officer (CAO), as appropriate, to allow timely decisions regarding required disclosure. There are inherent limitations to the effectiveness of any system of disclosure controls and procedures, including the possibility of human error and the circumvention or overriding of controls and procedures. Accordingly, even effective disclosure controls and procedures can only provide reasonable assurance of achieving their control objectives. Our disclosure controls and procedures are designed to provide such reasonable assurance.
With the participation of our CEO, CFO and CAO, we evaluated the effectiveness of the design and operation of our disclosure controls and procedures as of December 31, 2008, as required by Rule 13a-15 of the Act. Based on that evaluation, our CEO, CFO and CAO have concluded that, as of December 31, 2008, our disclosure controls and procedures are effective at that reasonable assurance level.
Changes in Internal Control Over Financial Reporting
There were no changes in our internal control over financial reporting during the year ended December 31, 2008, that have materially affected, or are reasonably likely to materially affect, our internal control over financial reporting.
Management’s Report on Internal Control over Financial Reporting
Our management is responsible for establishing and maintaining adequate internal control over financial reporting, as defined in Rules 13a-15(f) and 15d-15(f) under the Act. Our internal control over financial reporting is a process designed to provide reasonable assurance regarding the reliability of financial reporting and the preparation of our financial statements for external reporting purposes in accordance with generally accepted accounting principles. It should be noted, however, that because of inherent limitations any system of internal controls, however well-designed and operated, can provide only reasonable, but not absolute, assurance that financial reporting objectives will be met. In addition, projections of any evaluation of effectiveness to future periods are subject to the risk that controls may become inadequate because of changes in conditions or that the degree of compliance with the policies or procedures may deteriorate.
Our management, including our CEO, CFO and CAO, assessed the effectiveness of internal control over financial reporting as of December 31, 2008, based on criteria established in Internal Control—Integrated Framework issued by the Committee of Sponsoring Organizations of the Treadway Commission (COSO). As permitted by the guidance issued by the Office of the Chief Accountant of the SEC, our assessment has excluded the acquisitions of Teledrift, Inc. (“Teledrift”). The acquisition of Teledrift was completed on February 14, 2008. This acquisition constituted 40% of total consolidated assets as of December 31, 2008, and 12% of total consolidated revenues for the year then ended.
Based on the results of its assessment, management concluded that the Company’s internal control over financial reporting was effective as of December 31, 2008.
The effectiveness of the Company’s internal control over financial reporting as of December 31, 2008, has been audited by UHY LLP, the independent registered public accounting firm that also audited the Company’s financial statements. UHY’s attestation report appears in Item 8 of this Report.
| Item 9B. | Other Information. |
None.
102
Table of Contents
| Item 10. | Directors, Executive Officers and Corporate Governance. |
Information under the caption “Directors, Executive Officers and Corporate Governance”, which will be contained in our Definitive Proxy Statement for our 2009 Annual Meeting of Stockholders to be filed within 120 days of year end, is incorporated herein by reference.
| Item 11. | Executive Compensation. |
Information under the caption “Executive Compensation”, which will be contained in our Definitive Proxy Statement for our 2009 Annual Meeting of Stockholders to be filed within 120 days of year end, is incorporated herein by reference.
| Item 12. | Security Ownership of Certain Beneficial Owners and Management and Related Stockholder Matters. |
Information under the caption “Security Ownership of Certain Beneficial Owners and Management and Related Stockholder Matters”, which will be contained in our Definitive Proxy Statement for our 2009 Annual Meeting of Stockholders to be filed within 120 days of year end, is incorporated herein by reference.
| Item 13. | Certain Relationships and Related Transactions, and Director Independence. |
Information under the caption “Certain Relationships and Transactions with Management”, which will be contained in our Definitive Proxy Statement for our 2009 Annual Meeting of Stockholders to be filed within 120 days of year end, is incorporated herein by reference.
| Item 14. | Principal Accounting Fees and Services. |
Information under the caption “Principal Accounting Fees and Services”, which will be contained in our Definitive Proxy Statement for our 2009 Annual Meeting of Stockholders to be filed within 120 days of year end, is incorporated herein by reference.
103
Table of Contents
| Item 15. | Exhibits and Financial Statement Schedules. |
| Exhibit |
Description of Exhibit | |
| 3.1 | Amended and Restated Certificate of Incorporation (incorporated by reference to Exhibit 3.1 to the Company’s Form 10-Q for the quarter ended September 30, 2007). | |
| 3.2 | Bylaws (incorporated by reference to Appendix F to the Company’s Definitive Proxy Statement filed on September 27, 2001). | |
| 4.1 | Form of certificate of Common Stock (incorporated by reference to Appendix E to the Company’s Definitive Proxy Statement filed on September 27, 2001). | |
| 4.2 | Form of Warrant to purchase common stock of the Company dated August 31, 2000 (incorporated by reference to Exhibit 4.3 to the Company’s Registration Statement on Form SB-2 (file no. 333-129308) filed on October 28, 2005). | |
| 4.3 | Base Indenture dated as of February 14, 2008 by and among the Company, the subsidiary guarantors named therein and American Stock Transfer & Trust Company (incorporated by reference to Exhibit 4.1 to the Company’s Form 8-K filed February 14, 2008). | |
| 4.4 | First Supplemental Indenture dated as of February 14, 2008 by and among the Company, the subsidiary guarantors named therein and American Stock Transfer & Trust Company (incorporated by reference to Exhibit 4.2 to the Company’s Form 8-K filed February 14, 2008). | |
| 4.5 | Form of Global Security (incorporated by reference to Exhibit A to the First Supplemental Indenture filed as Exhibit 4.2 to the Company’s Form 8-K filed February 14, 2008). | |
| 4.6 | Form of Indenture for Subordinated Debt Securities (incorporated by reference to Exhibit 4.5 to the Company’s Registration Statement on Form S-3 (SEC File No. 333-148384), filed on December 28, 2007). | |
| 10.1 | Amended and Restated Credit Agreement between the Company and Wells Fargo Bank, N.A. dated August 31, 2007 (incorporated by reference to Exhibit 10.1 to the Company’s Form 10-Q for the quarter ended September 30, 2009). | |
| 10.2 | Amendment to Amended and Restated Credit Agreement between the Company and Wells Fargo Bank, N.A. dated November 15, 2007 (incorporated by reference to Exhibit 10.2 to the Company’s Form 10-K for the year ended December 31, 2007). | |
| 10.3 | Second Amendment to Amended and Restated Credit Agreement between the Company and Wells Fargo Bank, N.A. dated February 4, 2008 (incorporated by reference to Exhibit 10.1 to the Company’s Form 8-K filed on February 7, 2008). | |
| 10.4 | 2003 Long Term Incentive Plan of the Company (incorporated by reference to Exhibit 10.1 to the Company’s Form S-8 registration statement filed on October 27, 2005). | |
| 10.5 | 2005 Long Term Incentive Plan of the Company (incorporated by reference to Exhibit 10.2 to the Company’s Form S-8 registration statement filed on October 27, 2005). | |
| 10.6 | 2007 Long Term Incentive Plan of the Company (incorporated by reference to Exhibit 10.6 to the Company’s Form 10-K for the year ended December 31, 2007). | |
| 10.7 | Asset Purchase Agreement dated April 3, 2006 among Total Energy Technologies, LLC, USA Petrovalve, Inc. and Total Well Solutions, LLC. (incorporated by reference to Exhibit 10.1 to the Company’s Form 10-QSB for the quarter ended June 30, 2006). | |
104
Table of Contents
| Exhibit |
Description of Exhibit | |
| 10.8 | Exclusive License Agreement dated April 3, 2006 among Flotek Industries, Inc., USA Petrovalve, Inc. and Total Well Solutions, LLC. (incorporated by reference to Exhibit 10.2 to the Company’s Form 10-QSB for the quarter ended June 30, 2006). | |
| 10.9 | Asset Purchase Agreement dated June 6, 2006 among LifTech, LLC, its owners and USA Petrovalve, Inc. (incorporated by reference to Exhibit 10.3 to the Company’s Form 10-QSB for the quarter ended June 30, 2006). | |
| 10.10 | Membership Interest Purchase Agreement dated October 5, 2006 between Turbeco, Inc. and the owner of a 50% interest in CAVO Drilling Motors, Ltd Co. (incorporated by reference to Exhibit 10.1 to the Company’s Form 10-QSB for the quarter ended September 30, 2006). | |
| 10.11 | Asset Purchase Agreement dated November 17, 2006 among Teal Supply Co., dba Triumph Drilling Tools, Inc., Turbeco Inc. and Michael E. Jensen (incorporated by reference to Exhibit 10.21 to the Company’s Form 10-K for the year ended December 31, 2006). | |
| 10.12 | Stock Purchase Agreement dated August 31, 2007 among the Company and SES Holdings, Inc. and the stockholders thereof (incorporated by reference to Exhibit 10.1 to the Company’s Form 10-Q for the quarter ended September 30, 2007). | |
| 10.13 | Assignment of Membership Interest dated November 15, 2007 between Turbeco, Inc. and the owner of the remaining 50% interest in CAVO Drilling Motors, Ltd Co. (incorporated by reference to Exhibit 10.13 to the Company’s Form 10-K for the year ended December 31, 2007). | |
| 10.14 | Asset Purchase Agreement dated as of February 4, 2008 by and among Teledrift Acquisition, Inc., the Company, Teledrift, Inc. and the stockholders named therein (incorporated by reference to Exhibit 10.2 to the Company’s Form 8-K filed February 7, 2008). | |
| 10.15 | Share Lending Agreement among the Company, Bear Stearns & Co. Inc. and Bear Stearns International Limited (incorporated by reference to Exhibit 10.1 to the Company’s Form 8-K filed February 13, 2008). | |
| 10.16 | Credit Agreement, dated as of March 31, 2008, among Flotek Industries, Inc., Wells Fargo Bank, National Association and the Lenders named therein (incorporated by reference to Exhibit 10.2 to the Company’s Form 10-Q for the quarter ended September 30, 2009). | |
| 10.17 | Pledge and Security Agreement, dated as of March 31, 2008, among Flotek Industries, Inc. and the subsidiaries named therein, in favor of Wells Fargo Bank, N.A. (incorporated by reference to Exhibit 10.5 to the Company’s Form 10-Q for the quarter ended March 31, 2008). | |
| 10.18 | Guaranty Agreement, dated as of March 31, 2008, among the guarantors named therein, Wells Fargo Bank, N.A., the Lenders named therein, the Issuing Lender named therein and the Swap Counterparties named therein (incorporated by reference to Exhibit 10.6 to the Company’s Form 10-Q for the quarter ended March 31, 2008). | |
| 10.19 | Separation and Release Agreement, dated as of August 5, 2008, between Lisa Meier and Flotek Industries, Inc. (incorporated by reference to Exhibit 10.1 to the Company’s Form 8-K filed on August 6, 2008). | |
| 10.20 | First Amendment and Temporary Waiver, dated February 25, 2009, among Flotek Industries, Inc., Wells Fargo Bank, National Association and the Lenders named therein (incorporated by reference to Exhibit 10.1 to the Company’s Form 8-K filed on March 3, 2009). | |
| 10.21 | Second Amendment to Credit Agreement, dated March 13, 2009, among Flotek Industries, Inc., Wells Fargo Bank, National Association and the Lenders named therein (incorporated by reference to Exhibit 10.3 to the Company’s Form 10-Q for the quarter ended September 30, 2009). | |
| 12* | Ratio of earnings to fixed charges. | |
105
Table of Contents
| Exhibit |
Description of Exhibit | |
| 21* | List of Subsidiaries. | |
| 23* | Consent of UHY LLP. | |
| 31.1* | Rule 13a-14(a) Certification of Principal Executive Officer. | |
| 31.2* | Rule 13a-14(a) Certification of Principal Financial Officer. | |
| 32.1* | Section 1350 Certification of Principal Executive Officer. | |
| 32.2* | Section 1350 Certification of Principal Financial Officer. | |
*Filed herewith
106
Table of Contents
Pursuant to the requirements of Section 13 or 15(d) of the Securities Exchange Act of 1934, the registrant has duly caused this report to be signed on its behalf by the undersigned, thereunto duly authorized.
| FLOTEK INDUSTRIES, INC. | ||
| By: | /s/ John W. Chisholm | |
| John W. Chisholm | ||
| Interim President | ||
Date: December 21, 2009
107
Table of Contents
EXHIBITS INDEX
| Exhibit |
Description of Exhibit | |
| 3.1 | Amended and Restated Certificate of Incorporation (incorporated by reference to Exhibit 3.1 to the Company’s Form 10-Q for the quarter ended September 30, 2007). | |
| 3.2 | Bylaws (incorporated by reference to Appendix F to the Company’s Definitive Proxy Statement filed on September 27, 2001). | |
| 4.1 | Form of certificate of Common Stock (incorporated by reference to Appendix E to the Company’s Definitive Proxy Statement filed on September 27, 2001). | |
| 4.2 | Form of Warrant to purchase common stock of the Company dated August 31, 2000 (incorporated by reference to Exhibit 4.3 to the Company’s Registration Statement on Form SB-2 (file no. 333-129308) filed on October 28, 2005). | |
| 4.3 | Base Indenture dated as of February 14, 2008 by and among the Company, the subsidiary guarantors named therein and American Stock Transfer & Trust Company (incorporated by reference to Exhibit 4.1 to the Company’s Form 8-K filed February 14, 2008). | |
| 4.4 | First Supplemental Indenture dated as of February 14, 2008 by and among the Company, the subsidiary guarantors named therein and American Stock Transfer & Trust Company (incorporated by reference to Exhibit 4.2 to the Company’s Form 8-K filed February 14, 2008). | |
| 4.5 | Form of Global Security (incorporated by reference to Exhibit A to the First Supplemental Indenture filed as Exhibit 4.2 to the Company’s Form 8-K filed February 14, 2008). | |
| 4.6 | Form of Indenture for Subordinated Debt Securities (incorporated by reference to Exhibit 4.5 to the Company’s Registration Statement on Form S-3 (SEC File No. 333-148384), filed on December 28, 2007). | |
| 10.1 | Amended and Restated Credit Agreement between the Company and Wells Fargo Bank, N.A. dated August 31, 2007 (incorporated by reference to Exhibit 10.1 to the Company’s Form 10-Q for the quarter ended September 30, 2009). | |
| 10.2 | Amendment to Amended and Restated Credit Agreement between the Company and Wells Fargo Bank, N.A. dated November 15, 2007 (incorporated by reference to Exhibit 10.2 to the Company’s Form 10-K for the year ended December 31, 2007). | |
| 10.3 | Second Amendment to Amended and Restated Credit Agreement between the Company and Wells Fargo Bank, N.A. dated February 4, 2008 (incorporated by reference to Exhibit 10.1 to the Company’s Form 8-K filed on February 7, 2008). | |
| 10.4 | 2003 Long Term Incentive Plan of the Company (incorporated by reference to Exhibit 10.1 to the Company’s Form S-8 registration statement filed on October 27, 2005). | |
| 10.5 | 2005 Long Term Incentive Plan of the Company (incorporated by reference to Exhibit 10.2 to the Company’s Form S-8 registration statement filed on October 27, 2005). | |
| 10.6 | 2007 Long Term Incentive Plan of the Company (incorporated by reference to Exhibit 10.6 to the Company’s Form 10-K for the year ended December 31, 2007). | |
| 10.7 | Asset Purchase Agreement dated April 3, 2006 among Total Energy Technologies, LLC, USA Petrovalve, Inc. and Total Well Solutions, LLC. (incorporated by reference to Exhibit 10.1 to the Company’s Form 10-QSB for the quarter ended June 30, 2006). | |
| 10.8 | Exclusive License Agreement dated April 3, 2006 among Flotek Industries, Inc., USA Petrovalve, Inc. and Total Well Solutions, LLC. (incorporated by reference to Exhibit 10.2 to the Company’s Form 10-QSB for the quarter ended June 30, 2006). | |
| 10.9 | Asset Purchase Agreement dated June 6, 2006 among LifTech, LLC, its owners and USA Petrovalve, Inc. (incorporated by reference to Exhibit 10.3 to the Company’s Form 10-QSB for the quarter ended June 30, 2006). | |
Table of Contents
| Exhibit |
Description of Exhibit | |
| 10.10 | Membership Interest Purchase Agreement dated October 5, 2006 between Turbeco, Inc. and the owner of a 50% interest in CAVO Drilling Motors, Ltd Co. (incorporated by reference to Exhibit 10.1 to the Company’s Form 10-QSB for the quarter ended September 30, 2006). | |
| 10.11 | Asset Purchase Agreement dated November 17, 2006 among Teal Supply Co., dba Triumph Drilling Tools, Inc., Turbeco Inc. and Michael E. Jensen (incorporated by reference to Exhibit 10.21 to the Company’s Form 10-K for the year ended December 31, 2006). | |
| 10.12 | Stock Purchase Agreement dated August 31, 2007 among the Company and SES Holdings, Inc. and the stockholders thereof (incorporated by reference to Exhibit 10.1 to the Company’s Form 10-Q for the quarter ended September 30, 2007). | |
| 10.13 | Assignment of Membership Interest dated November 15, 2007 between Turbeco, Inc. and the owner of the remaining 50% interest in CAVO Drilling Motors, Ltd Co. (incorporated by reference to Exhibit 10.13 to the Company’s Form 10-K for the year ended December 31, 2007). | |
| 10.14 | Asset Purchase Agreement dated as of February 4, 2008 by and among Teledrift Acquisition, Inc., the Company, Teledrift, Inc. and the stockholders named therein (incorporated by reference to Exhibit 10.2 to the Company’s Form 8-K filed February 7, 2008). | |
| 10.15 | Share Lending Agreement among the Company, Bear Stearns & Co. Inc. and Bear Stearns International Limited (incorporated by reference to Exhibit 10.1 to the Company’s Form 8-K filed February 13, 2008). | |
| 10.16 | Credit Agreement, dated as of March 31, 2008, among Flotek Industries, Inc., Wells Fargo Bank, National Association and the Lenders named therein (incorporated by reference to Exhibit 10.2 to the Company’s Form 10-Q for the quarter ended September 30, 2009). | |
| 10.17 | Pledge and Security Agreement, dated as of March 31, 2008, among Flotek Industries, Inc. and the subsidiaries named therein, in favor of Wells Fargo Bank, N.A. (incorporated by reference to Exhibit 10.5 to the Company’s Form 10-Q for the quarter ended March 31, 2008). | |
| 10.18 | Guaranty Agreement, dated as of March 31, 2008, among the guarantors named therein, Wells Fargo Bank, N.A., the Lenders named therein, the Issuing Lender named therein and the Swap Counterparties named therein (incorporated by reference to Exhibit 10.6 to the Company’s Form 10-Q for the quarter ended March 31, 2008). | |
| 10.19 | Separation and Release Agreement, dated as of August 5, 2008, between Lisa Meier and Flotek Industries, Inc. (incorporated by reference to Exhibit 10.1 to the Company’s Form 8-K filed on August 6, 2008). | |
| 10.20 | First Amendment and Temporary Waiver, dated February 25, 2009, among Flotek Industries, Inc., Wells Fargo Bank, National Association and the Lenders named therein (incorporated by reference to Exhibit 10.1 to the Company’s Form 8-K filed on March 3, 2009). | |
| 10.21 | Second Amendment to Credit Agreement, dated March 13, 2009, among Flotek Industries, Inc., Wells Fargo Bank, National Association and the Lenders named therein (incorporated by reference to Exhibit 10.3 to the Company’s Form 10-Q for the quarter ended September 30, 2009). | |
| 12* | Ratio of earnings to fixed charges. | |
| 21* | List of Subsidiaries. | |
| 23* | Consent of UHY LLP. | |
| 31.1* | Rule 13a-14(a) Certification of Principal Executive Officer. | |
| 31.2* | Rule 13a-14(a) Certification of Principal Financial Officer. | |
Table of Contents
| Exhibit |
Description of Exhibit | |
| 32.1* | Section 1350 Certification of Principal Executive Officer. | |
| 32.2* | Section 1350 Certification of Principal Financial Officer. | |
| * | Filed herewith |