Attached files
UNITED STATES
SECURITIES AND EXCHANGE COMMISSION
WASHINGTON, D.C. 20549
FORM 10-K
| x | ANNUAL REPORT PURSUANT TO SECTION 13 OR 15(D) OF THE SECURITIES EXCHANGE ACT OF 1934 |
For the fiscal year ended October 2, 2009
or
| ¨ | TRANSITION REPORT PURSUANT TO SECTION 13 OR 15(D) OF THE SECURITIES EXCHANGE ACT OF 1934 |
For the transition period from to
Commission file number: 001-04762
ARAMARK CORPORATION
(Exact name of registrant as specified in its charter)
| Delaware | 95-2051630 | |
| (State of Incorporation) | (I.R.S. Employer Identification No.) |
ARAMARK Tower
1101 Market Street
Philadelphia, Pennsylvania 19107
(Address of principal executive offices)
Telephone Number: 215-238-3000
Securities registered pursuant to Section 12(b) of the Act: None
Securities registered pursuant to Section 12(g) of the Act: None
Indicate by check mark if the registrant is a well-known seasoned issuer, as defined in Rule 405 of the Securities Act. Yes ¨ No x
Indicate by check mark if the registrant is not required to file reports pursuant to Section 13 or Section 15(d) of the Act. Yes ¨ No x
Indicate by check mark whether the registrant (1) has filed all reports required to be filed by Section 13 or 15(d) of the Securities Exchange Act of 1934 during the preceding 12 months (or for such shorter period that the registrant was required to file such reports), and (2) has been subject to such filing requirements for the past 90 days. Yes x No ¨
Indicate by check mark whether the registrant has submitted electronically and posted on its corporate Web site, if any, every Interactive Data File required to be submitted and posted pursuant to Rule 405 of Regulation S-T (§232.405 of this chapter) during the preceding 12 months (or for such shorter period that registrant was required to submit and post such files). Yes ¨ No ¨
Indicate by check mark if disclosure of delinquent filers pursuant to Item 405 of Regulation S-K is not contained herein, and will not be contained, to the best of registrant’s knowledge, in definitive proxy or information statements incorporated by reference in Part III of this Form 10-K or any amendment to this Form 10-K. ¨
Indicate by check mark whether the registrant is a large accelerated filer, an accelerated filer, a non-accelerated filer, or a smaller reporting company. See the definitions of “large accelerated filer,” “accelerated filer” and “smaller reporting company” in Rule 12b-2 of the Exchange Act.
| Large accelerated filer ¨ | Accelerated filer ¨ | |||
| Non-accelerated filer x (Do not check if a smaller reporting company) | Smaller reporting company ¨ |
Indicate by check mark whether the registrant is a shell company (as defined in Rule 12b-2 of the Exchange Act). Yes ¨ No x
There is no established public trading market for any of the common stock of the registrant. The aggregate market value of the voting securities held by non-affiliates of the registrant as of April 3, 2009 was $-0-. As of November 27, 2009, the common stock of the registrant was owned by ARAMARK Intermediate Holdco Corporation.
DOCUMENTS INCORPORATED BY REFERENCE
None
PART I
Item 1.
BUSINESS
Overview
ARAMARK Corporation (“ARAMARK,” the “Company,” “we” or “us”) is a leading provider of a broad range of managed services to business, educational, healthcare and governmental institutions and sports, entertainment and recreational facilities.
In the United States, we are one of the largest food, hospitality and facility services companies, and in most of the other countries in which we operate, we are one of the leading providers. Our uniform and career apparel business is the second largest in the United States and provides both rental and direct marketing services. Through our geographic presence and our approximately 255,000 employees (including seasonal employees), we serve thousands of clients and millions of customers in 22 countries around the world. In this Annual Report, when we refer to our fiscal years, we say “fiscal” and the year number, as in “fiscal 2009,” which refers to our fiscal year ended October 2, 2009.
Segment and geographic information is incorporated by reference to Note 16 to the consolidated financial statements.
On January 26, 2007, we completed a merger whereby prior ARAMARK stockholders received $33.80 in cash for each share of ARAMARK common stock held. Investment funds associated with or designated by the GS Capital Partners, CCMP Capital Advisors, J.P. Morgan Partners, Thomas H. Lee Partners and Warburg Pincus (our “Sponsors”) invested $1,705.0 million in equity securities of ARAMARK Holdings Corporation (“Holdings” or the “Parent Company”), our ultimate parent company, as part of our going-private transaction (the “Transaction”). In addition, Joseph Neubauer contributed 7,055,172.83 shares of Class A common stock (having an aggregate value of $200.0 million) to Holdings. In addition, approximately 250 members of the Company’s management were offered the opportunity to invest in the equity of Holdings in connection with the Transaction and such members of management contributed approximately $143.4 million in the aggregate. Since the closing of the Transaction, additional members of the Company’s management also have invested.
Fiscal 2009 Acquisitions
During fiscal 2009, the Company paid approximately $26.7 million for the acquisition of the remaining 20% of its Chilean subsidiary and the Company paid $85.0 million as additional consideration related to the fiscal 2006 acquisition of SeamlessWeb Professional Solutions, Inc. per the terms of the acquisition agreement. The Company also acquired a refreshment services business and several regional uniform rental companies. Subsequent to October 2, 2009, the Company completed the acquisition of the facilities management and property management businesses of Veris Plc, an Irish company, for consideration of approximately $75 million in cash (see Note 3 to the consolidated financial statements).
1
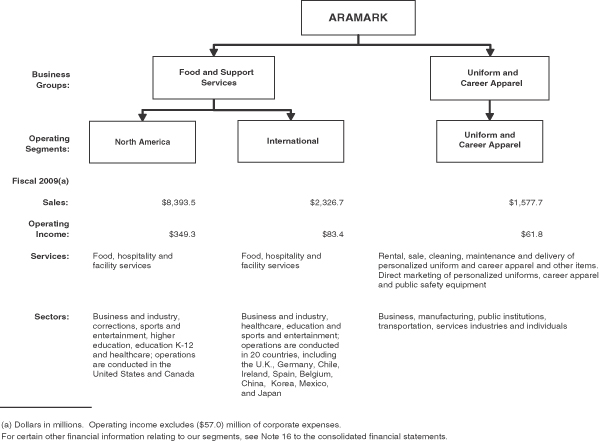
The following chart provides a brief overview of our business:
History
Our business traces its history back to the 1930s, when we began providing vending services to plant employees in the aviation industry in Southern California. In 1959, our founders, Davre J. Davidson and William S. Fishman, combined their two businesses to form our predecessor company, which became publicly traded in 1960. In the ensuing years, we broadened our service offerings and expanded our client base, including through the acquisition of our uniform services business in 1977. In 1984, we completed a management buyout, and from 1984, our management and employees increased their ownership of the Company and, directly and through our employee benefit plans, owned approximately 90% of our equity capital until our public offering was completed in December 2001. On January 26, 2007, the Company completed a going-private transaction and became a subsidiary of a holding company owned by our Sponsors and members of the Company’s management.
Food and Support Services
Our Food and Support Services group manages a number of interrelated services—including food, hospitality and facility services—for businesses, healthcare facilities, school districts, colleges and universities, sports, entertainment and recreational venues, conference and convention centers, national and state parks and correctional institutions. In fiscal 2009, our Food and Support Services—North America segment generated $8.4 billion in sales, or 68% of our total sales, and our Food and Support Services—International segment generated $2.3 billion in sales, or 19% of our total sales. No individual client represents more than 2% of our consolidated sales, other than, collectively, a number of U.S. government agencies.
2
We are the exclusive provider of food and beverage services at most of the facilities we serve and are responsible for hiring, training and supervising substantially all of the food service personnel in addition to ordering, receiving, preparing and serving food and beverage items sold at those facilities. In governmental, business, educational and healthcare facilities (for example, offices and industrial plants, schools and universities and hospitals), our clients generally provide us access to customers, namely their employees, students and patients. At sports, entertainment and recreational facilities, which include convention centers, our clients generally are responsible for attracting patrons, usually on an event-specific basis. We focus on new business development, client retention and sales growth at existing locations through marketing efforts directed toward customers and potential customers at the locations we serve.
Industry Overview
The food and support service industry involves the supply of food and beverage services and facility services to a range of clients, including businesses, educational, governmental, correctional and healthcare facilities, and operators of sports, entertainment and recreational facilities in a variety of formats and service levels.
Although we provide a range of services and call on a wide variety of clients, in recent years the food and support service industry has experienced some consolidation and multi-national expansion. We believe that other recent dynamics in the food and support services industry include continued growth in the outsourcing of food service and facilities management as a result of:
| • | clients focusing on their core competencies and outsourcing their non-core activities and services; |
| • | clients addressing the need to satisfy demanding customers; |
| • | clients facing increasing cost pressures and looking for cost-effective alternatives to self-administered food and support activities; |
| • | an increase in the retail orientation of food service management; and |
| • | continuing client interest in obtaining multiple support services from one supplier. |
Customers and Services—North America Segment
Our Food and Support Services—North America segment serves a number of client sectors in the United States and Canada, distinguished by the types of customers served and types of services offered. Our Food and Support Services operations focus on serving clients in four principal sectors:
Business and Industry. We provide a range of business dining services, including on-site restaurants, catering, convenience stores and executive dining rooms.
We provide coffee and vending services to business and industry clients at thousands of locations in the United States and Canada. Our service and product offerings include a full range of coffee and beverage offerings, “grab and go” food operations, convenience stores, home meal replacement programs and a proprietary drinking water filtration system.
We also offer a variety of facility management services to business and industry clients. These services include the management of housekeeping, plant operations and maintenance, energy management, laundry and linen, groundskeeping, landscaping, transportation, capital program management and commissioning services and other facility consulting services relating to building operations.
We provide correctional food services, operate commissaries, laundry facilities and property rooms and/or provide facilities management services for state, county and municipal clients.
3
Sports and Entertainment. We provide concessions, banquet and catering services, retail, merchandise and novelty sales, recreational and lodging services and facilities management services at sports, entertainment and recreational facilities. We serve 84 professional and college sports teams, including 42 teams in Major League Baseball, the National Basketball Association, the National Football League and the National Hockey League. We also serve 35 convention and civic centers, 15 national and state parks and other resort operations, plus numerous concert venues, entertainment complexes and other popular tourist attractions across North America.
Higher Education and Education K-12. We provide a wide range of food and facility services at more than 1,000 colleges, universities, school systems and districts and private schools. We offer our education clients a single source provider for managed service solutions, including dining, catering, food service management, convenience-oriented retail operations, facilities maintenance, custodial, grounds, energy, construction management, capital project management and building commissioning.
Healthcare. We provide a wide range of non-clinical support services to more than 1,100 healthcare and senior living facilities in North America. We offer healthcare organizations a single source provider for managed service solutions, including patient food and nutrition services, retail food services, clinical equipment maintenance, environmental services, laundry and linen distribution, plant operations, energy management, strategic/technical services, supply chain management and central transportation.
Customers and Services—International Segment
Our Food and Support Services—International segment provides a similar range of services as that provided to our North American clients and operates in several sectors, including business and industry, sports and entertainment, healthcare and education. Our international services are provided in 20 countries outside the United States and Canada. Our largest international operations are in the United Kingdom, Germany, Chile, Ireland and Spain, and in each of these countries we are one of the leading food service providers. We also have operations in Belgium, China, South Korea, Argentina and the Czech Republic and we own 50% of AIM Services Co., Ltd., a leader in providing outsourced food services in Japan. The clients we serve in each country are typically similar to those served in the United States and Canada and vary by country depending upon local dynamics and conditions. There are particular risks attendant with our international operations. Please see the “Risk Factors” section.
Purchasing
We negotiate the pricing and other terms for the majority of our purchases of food and related products in the U.S. and Canada directly with national manufacturers. We purchase these products and other items through SYSCO Corporation and other distributors. We have a master distribution agreement with SYSCO that covers a significant amount of our purchases of these products and items in the United States and another distribution agreement with SYSCO that covers our purchases of these products in Canada. SYSCO and other distributors are responsible for tracking our orders and delivering products to our specific locations. Due to our ability to negotiate favorable terms with our suppliers, we receive vendor consideration, including rebates, allowances and volume discounts. See “Types of Contracts” below. With respect to purchases from SYSCO, these discounts include discounts on SYSCO-branded products. Our location managers also purchase a number of items, including bread, dairy products and alcoholic beverages from local suppliers, and we purchase certain items directly from manufacturers.
Our agreements with our distributors are generally for an indefinite term, subject to termination by either party after a notice period, which is generally 60 to 120 days. The pricing and other financial terms of these agreements are renegotiated periodically. We have had distribution agreements with SYSCO for more than 15 years. Our current agreement with SYSCO is terminable by either party with 180 days notice.
4
Our relationship with SYSCO is important to our operations. In fiscal 2009, SYSCO distributed approximately 56% of our food and non-food products in the United States and Canada, and we believe that we are one of SYSCO’s largest customers. However, we believe that the products acquired through SYSCO can, in significant cases, be purchased through other sources and that termination of our relationship with SYSCO or any disruption of SYSCO’s business would cause only short-term disruptions to our operations.
Sales and Marketing
We employ sales personnel focused on each specific client or service sector who are responsible for identifying and pursuing potential new business opportunities, analyzing and evaluating such opportunities together with our operational and financial management and developing specific contract proposals. In addition to these professionals dedicated exclusively to sales efforts, our food and support field management shares responsibility for identifying and pursuing new sales opportunities, both with the clients for which they are directly responsible and for potential clients in their geographic area of responsibility. In addition, in several sectors we also have dedicated client retention teams.
Types of Contracts
We use two general contract types in our Food and Support Services segments: profit and loss contracts and client interest contracts. These contracts differ in their provision for the amount of financial risk that we bear and, accordingly, the potential compensation, profits or fees we may receive. Commission rates and management fees, if any, may vary significantly among contracts based upon various factors, including the type of facility involved, the term of the contract, the services we provide and the amount of capital we invest.
Profit and Loss Contracts. Under profit and loss contracts, we receive all of the revenue from, and bear all of the expenses of, the provision of our services at a client location. Expenses under profit and loss contracts sometimes include commissions paid to the client, typically calculated as a fixed or variable percentage of various categories of sales, and, in some cases, require minimum guaranteed commissions. While we may benefit from greater upside potential with a profit and loss contract, we are responsible for all the operating costs and consequently bear greater downside risk than with a client interest contract. For fiscal 2009, approximately 74% of our food and support services sales were derived from profit and loss contracts.
Client Interest Contracts. Client interest contracts include management fee contracts, under which our clients reimburse our operating costs and pay us a management fee, which may be calculated as a fixed dollar amount or a percentage of sales or operating costs. Some management fee contracts entitle us to receive incentive fees based upon our performance under the contract, as measured by factors such as sales, operating costs and customer satisfaction surveys. Client interest contracts also include limited profit and loss contracts, under which we receive a percentage of any profits earned from the provision of our services at the facility and we generally receive no payments if there are losses. As discussed above under “Purchasing,” we receive vendor consideration, including rebates, allowances and volume discounts that we retain except in those cases and to the extent that, under certain arrangements, they are passed through to our clients. For our client interest contracts, both our upside potential and downside risk are reduced compared to our profit and loss contracts. For fiscal 2009, approximately 26% of our food and support services revenues were derived from client interest contracts.
Generally, our contracts require that the client’s consent be obtained in order to raise prices on the food, beverages and merchandise we sell within a particular facility. The length of contracts that we enter into with clients varies. Contracts generally are for fixed terms, some of which may be well in excess of one year. Client contracts for sports, entertainment and recreational services typically require larger capital investments, but have correspondingly longer and fixed terms, usually from five to fifteen years.
When we enter into new contracts, or extend or renew existing contracts, particularly those for stadiums, arenas, convention centers and other sports, entertainment and recreational facilities, we are sometimes
5
contractually required to make some form of up-front or future capital investment to help finance improvement or renovation, typically to the food and beverage facilities of the venue from which we operate. Contractually required capital expenditures typically take the form of investment in leasehold improvements, food service equipment and/or grants to clients. At the end of the contract term or its earlier termination, assets such as equipment and leasehold improvements typically become the property of the client, but generally the client must reimburse us for any undepreciated or unamortized capital expenditures.
Contracts within the Food and Support Services group are generally obtained and renewed either through a competitive process or on a negotiated basis, although contracts in the public sector are frequently awarded on a competitive bid basis, as required by applicable law. Contracts for food services with school districts and correctional clients are typically awarded through a formal bid process. Contracts in the private sector may be entered into on a less formal basis, but we and other companies will often compete in the process leading up to the award or the completion of contract negotiations. Typically, after the award, final contract terms are negotiated and agreed upon.
Competition
There is significant competition in the food and support services business from local, regional, national and international companies, as well as from the businesses, healthcare institutions, colleges and universities, correctional facilities, school districts and public assembly facilities that decide to provide these services themselves. Institutions may decide to operate their own services following the expiration or termination of contracts with us or with our competitors. In our Food and Support Services—North America segment, our external competitors include other multi-regional food and support service providers, such as Centerplate, Inc., Compass Group plc, Delaware North Companies Inc. and Sodexo Alliance SA. Internationally, our external food service and support service competitors include Compass Group plc, Elior SA, International Service System A/S and Sodexo Alliance SA. We also face competition from many regional and local service providers.
We believe that the principal competitive factors in our business include:
| • | quality and breadth of services and management talent; |
| • | service innovation; |
| • | reputation within the industry; |
| • | pricing; and |
| • | financial strength and stability. |
Seasonality
Our sales and operating results have varied, and we expect them to continue to vary, from quarter to quarter as a result of different factors. Within our Food and Support Services—North America segment, historically there has been a lower level of activity during the first and second fiscal quarters in the generally higher margin sports, entertainment and recreational services. This lower level of activity historically has been partially offset during our first and second fiscal quarters by the increased provision in our educational operations. Conversely, historically there has been a significant increase in the provision of sports, entertainment and recreational services during the third and fourth fiscal quarters, which is partially offset by the effect of summer recess at colleges, universities and schools.
Uniform and Career Apparel
Our Uniform and Career Apparel segment provides uniforms, career and image apparel, safety equipment, work clothes and accessories to meet the needs of clients in a wide range of industries in the United States, including manufacturing, transportation, construction, restaurants and hotels, public safety, healthcare and
6
pharmaceutical industries and many others. We supply garments, other textile and paper products, public safety equipment and other accessories through rental and direct purchase programs to businesses, government agencies and individuals. Through our rental and direct marketing businesses, we provide a total uniform solution to our clients. In fiscal 2009, our Uniform and Career Apparel segment generated $1.6 billion in sales, or 13% of our total fiscal 2009 sales.
Customers use our uniforms to meet a variety of needs, including:
| • | establishing corporate identity and brand awareness—uniforms can help identify employees working for a particular company or department and promote a company’s brand identity; |
| • | projecting a professional image—uniformed employees are perceived as trained, competent and dependable, and uniforms provide a professional image of employees by enhancing the public appearance of those employees and their company; |
| • | protecting workers—uniforms can help protect workers from difficult environments such as heavy soils, heat, flame or chemicals; |
| • | protecting products—uniforms can help protect products against contamination in the food, pharmaceutical, electronics, health care and automotive industries; and |
| • | retaining employees—uniforms can enhance worker morale and help promote teamwork. |
We provide a full service employee uniform solution, including design, sourcing and manufacturing, delivery, cleaning and maintenance. We rent or lease uniforms, career and image apparel, work clothing, outerwear, particulate-free garments and additional textile and related products to businesses in a wide range of industries throughout the United States. Our uniform products include shirts, pants, jackets, coveralls, jumpsuits, smocks, aprons and specialized protective wear. We also offer nongarment items and related services, including industrial towels, floor mats, mops, linen products, as well as paper products and safety products.
The outsourcing of career apparel needs through a uniform rental program offers customers advantages over ownership. Renting eliminates investment in uniforms and the related costs associated with employee turnover, offers flexibility in styles, colors and quantities as customer requirements change, assures consistent professional cleaning, finishing, repair and replacement of items in use and decreases expense and management time necessary to administer a uniform program. Centralized services, specialized equipment and economies of scale generally allow us to be more cost effective in providing garments and garment services than customers could be by themselves.
We also design, sell and distribute personalized uniforms, rugged work clothing, outerwear, business casual apparel and footwear, public safety equipment and accessories through mail order catalogs, the internet, telemarketing, retail and field sales representatives.
Customers and Services
As part of our full service approach, we offer fabric, style and color options specific to a customer’s needs. We stock a broad product line of uniforms and career apparel. We typically visit our customers’ sites weekly, delivering clean, finished uniforms and, at the same time, removing the soiled uniforms or other items for cleaning, repair or replacement. Under our leasing program, we provide the customer with rental garments that are cleaned either by the customer or individual employees. This program benefits clients by reducing their capital investment in garments. We administer and manage the program, and repair and replace garments as necessary.
We serve businesses of all sizes in many different industries. We have a diverse customer base, serving customers in 45 states, Puerto Rico and one Canadian province, from over 200 service location and distribution
7
centers across the United States and one service center in Ontario, Canada. We offer a range of garment rental service options, from full-service rental programs in which we clean and service garments and replace uniforms as needed, to lease programs in which garments are cleaned and maintained by individual employees. We also clean and service customer-owned uniforms.
Our cleanroom service offers advanced static dissipative garments, barrier apparel, sterile garments and cleanroom application accessories for customers with contamination-free operations in the technology, food, healthcare and pharmaceutical industries.
We conduct our direct marketing business through four primary brands—WearGuard, Crest, Galls and ARAMARK. Through WearGuard-Crest, we design, source or manufacture and distribute distinctive image apparel to workers in a wide variety of industries including construction, utilities, repair and maintenance services, restaurant and hospitality. We deliver expanded services to customers through catalog, the internet, dedicated sales representatives and telemarketing sales channels. We customize and embroider personalized uniforms and logos for customers through an extensive computer assisted design center and distribute work clothing, outerwear, business casual apparel and footwear throughout the United States. During the second quarter of fiscal 2009, we initiated a repositioning effort to reduce the cost structure and address the demand softness in the WearGuard direct marketing business (see Note 13 to the consolidated financial statements).
Galls is one of the country’s leading suppliers of uniforms and equipment to public safety professionals. This multi-channel business (catalog, telemarketing sales, field sales, the internet and retail) caters to the special needs of people involved in public safety, law enforcement, fire fighting, federal government agency, military and emergency medical services. Galls markets public safety equipment and apparel under the Galls, Dynamed and other brand names to over 750,000 customers, as well as to public safety departments, private security companies and the military. Galls also operates six retail store locations in California and Kentucky.
Operations
We operate our uniform rental business as a network of 76 laundry plants and 155 satellite plants and depots supporting over 2,600 pick-up and delivery routes. We operate a fleet of service vehicles that pick up and deliver uniforms for cleaning and maintenance. We operate a cutting and sewing plant in Mexico, which satisfies a substantial amount of our standard uniform inventory needs. We also purchase additional uniform and textile products as well as equipment and supplies from domestic and international suppliers. The loss of any one vendor would not have a significant impact on us.
We conduct our direct marketing activities principally from our facilities in Lexington, Kentucky; Salem, Virginia; Norwell, Massachusetts; and Reno, Nevada. We will be closing the vast majority of our Norwell facility by the second quarter of fiscal 2010 and migrating its distribution and customization functions to our facilities in Salem, Virginia and Reno, Nevada (see note 13 to the consolidated financial statements). We market our own brands of apparel and offer a variety of customized personalization options such as embroidery and logos. We also source uniforms and other products to our specifications from a number of domestic and international suppliers and also manufacture a significant portion of our uniform requirements. None of our customers individually represents a material portion of our sales.
Sales and Marketing
Our route sales drivers and sales representatives are responsible for selling our services to current and potential customers and developing new accounts through the use of an extensive, proprietary database of pre-screened and qualified business prospects. Our customer service representatives and district managers are active salespeople as well. We build our brand identity through local advertising, promotional initiatives and through our distinctive service vehicles. Our customers frequently come to us through client referrals, either from our uniform rental business or from our other service sectors. Our customer service representatives generally
8
interact on a weekly basis with their clients, while our support personnel are charged with expeditiously handling customer requirements regarding the outfitting of new customer employees and other customer service needs.
In connection with the provision of our services, we have developed or acquired long-standing brand name recognition through our ApparelOne®, WearGuard® and Crest® uniform programs. Our ApparelOne program assists customers in meeting their specific needs by offering quality and brand name products through a combination of rental, lease or purchase options. We customize the program on an individual client basis to offer a single catalog and/or website specifically tailored to the client’s needs.
Our direct marketing businesses distribute approximately 7 million catalogs annually to approximately 1.1 million existing and prospective customers. Catalog distribution is based on the selection of recipients in accordance with predetermined criteria from customer lists developed by WearGuard and Galls as well as those purchased or rented from other organizations. Our in-bound and out-bound telemarketing operations are staffed by approximately 195 trained professionals. We also sell across the Internet at www.aramark-uniform.com and www.galls.com.
Types of Contracts
We typically serve our rental customers under written service contracts for an initial term of three to five years. While customers are not required to make an up-front investment for their uniforms, in the case of nonstandard uniforms and certain specialty products or programs, customers typically agree to reimburse us for our costs if they terminate their agreement before completion of the current service term.
Because the bulk of our customers purchase on a recurring basis, our backlog of orders at any given time consists principally of orders in the process of being filled. With the exception of certain governmental bid business, most of our direct marketing business is conducted under invoice arrangement with repeat customers. Our direct marketing business is, to a large degree, relationship-centered. While we have long term relationships with some of our larger customers, we generally do not have contracts with these customers.
Competition
Although the U.S. rental industry has experienced some consolidation, there is significant competition in all the areas that we serve, and such competition varies from location to location. Although much of the competition consists of smaller local and regional firms, we also face competition from other large national firms such as Cintas Corporation, G&K Services, Inc. and Unifirst Corporation. We believe that the primary competitive factors that affect our operations are quality, service, design, consistency of product, garment cost and distribution capability, particularly for large multi-location customers, and price. We believe that our ability to compete effectively is enhanced by the quality and breadth of our product line.
Competition for direct sales varies based on numerous factors such as geographic, product, customer and marketing issues. We believe that the primary competitive factors that affect our direct marketing operations are quality, service, design, consistency of products, distribution and price. While there are other companies in the uniform, work clothing or public safety direct marketing business that have financial resources comparable to ours, much of the competition consists of smaller local and regional companies and numerous retailers, including some large chain apparel retailers, as well as numerous catalog sales sources.
Seasonality
Due to a number of factors, primarily related to the weather in the northern tier of the United States and the Thanksgiving-Christmas holiday period, there historically has been a seasonal increase in the sales of direct sale apparel and outerwear during our first fiscal quarter.
9
Employees of ARAMARK
As of October 2, 2009, we had a total of approximately 255,000 employees, including seasonal employees, consisting of approximately 165,000 full-time and approximately 90,000 part-time employees in our three business segments. The number of part-time employees varies significantly from time to time during the year due to seasonal and other operating requirements. We generally experience our highest level of employment during the fourth quarter. The approximate number of employees by segment is as follows: Food and Support Services—North America: 160,000; Food and Support Services—International: 81,000; Uniform and Career Apparel—14,000. In addition, the ARAMARK corporate staff is approximately 200 employees. Approximately 39,000 employees in the United States are covered by collective bargaining agreements. We have not experienced any material interruptions of operations due to disputes with our employees and consider our relations with our employees to be satisfactory.
Governmental Regulation
We are subject to various governmental regulations, such as environmental, labor, employment, immigration, health and safety laws and liquor licensing and dram shop laws. In addition, our facilities and products are subject to periodic inspection by federal, state, and local authorities. We have established, and periodically update, various internal controls and procedures designed to maintain compliance with these regulations. Our compliance programs are subject to changes in federal or state legislation, or changes in regulatory interpretation, implementation or enforcement. From time to time both federal and state government agencies have conducted audits of our billing practices as part of routine investigations of providers of services under government contracts, or otherwise. Like others in our business, we receive requests for information from governmental agencies in connection with these audits. If we fail to comply with applicable laws, we may be subject to criminal sanctions or civil remedies, including fines, injunctions, seizures or debarment from government contracts.
Our operations are subject to various governmental regulations, including those governing:
| • | the service of food and alcoholic beverages; |
| • | minimum wage, overtime, wage payment and employment discrimination; |
| • | immigration; |
| • | governmentally funded entitlement programs; |
| • | environmental protection; |
| • | human health and safety; |
| • | customs, import and export control laws; |
| • | federal motor carrier safety; and |
| • | privacy and customer data security. |
There are a variety of regulations at various governmental levels relating to the handling, preparation and serving of food, including in some cases requirements relating to the temperature of food, the cleanliness of the kitchen, and the hygiene of personnel, which are enforced primarily at the local public health department level. While we attempt to comply with applicable laws and regulations, we cannot assure you that we are in full compliance at all times with all of the applicable laws and regulations referenced above. Furthermore, additional or amended regulations in this area may significantly increase the cost of compliance.
In addition, various federal and state and provincial agencies impose nutritional guidelines and other requirements on us at certain of the education and corrections facilities we serve. We may also be subject to
10
regulations that limit or restrict the use of trans fats in the food we serve or other requirements relating to ingredient or nutrient labeling. There can be no assurance that federal or state legislation, or changes in regulatory implementation or interpretation of government regulations, would not limit our activities in the future or significantly increase the cost of regulatory compliance.
Because we serve alcoholic beverages at many sports, entertainment and recreational facilities, including convention centers and national and state parks, we also hold liquor licenses incidental to our contract food service business and are subject to the liquor license requirements of the jurisdictions in which we hold a liquor license. As of October 2, 2009, our subsidiaries held liquor licenses in 44 states and the District of Columbia, four Canadian provinces and certain other countries. Typically, liquor licenses must be renewed annually and may be revoked or suspended for cause at any time. Alcoholic beverage control regulations relate to numerous aspects of our operations, including minimum age of patrons and employees, hours of operation, advertising, wholesale purchasing, inventory control and handling, and storage and dispensing of alcoholic beverages. We have not encountered any material problems relating to alcoholic beverage licenses to date. The failure to receive or retain a liquor license in a particular location could adversely affect our ability to obtain such a license elsewhere. Some of our contracts require us to pay liquidated damages during any period in which our liquor license for the facility is suspended, and most contracts are subject to termination if we lose our liquor license for the facility. Our service of alcoholic beverages is also subject to state, provincial and local service laws, commonly called dram shop statutes. Dram shop statutes generally prohibit serving alcoholic beverages to minors or visibly intoxicated persons. If we violate dram shop laws, we may be liable to the patron or to third parties for the acts of the patron. We sponsor regular training programs designed to minimize the likelihood of such a situation. However, we cannot guarantee that intoxicated or minor patrons will not be served or that liability for their acts will not be imposed on us.
Our uniform rental business and part of our food and support service business are subject to various federal, state and local laws and regulations, including the federal Clean Water Act, Clean Air Act, Resource Conservation and Recovery Act, Comprehensive Environmental Response, Compensation, and Liability Act and similar state statutes and regulations. In particular, industrial laundries use and discharge wastewater containing detergents and other residues from the laundering of garments and other merchandise through sewer systems to publicly operated treatment works. Our industrial laundries are subject to volume and chemical discharge limits and we could face penalties and fines for non-compliance. We are attentive to the environmental concerns surrounding the disposal of waste materials and have through the years taken measures in an effort to avoid their improper disposal. In the past, we have settled, or contributed to the settlement of, actions or claims brought against us relating to the disposal of hazardous materials, either on or off-site. We may, in the future, be required to expend material amounts to rectify the consequences of any such disposal. Under federal and state environmental laws, we may be liable for the costs of removal or remediation of certain hazardous or toxic substances located on or in or emanating from our owned or leased property, as well as related costs of investigation and property damage. Such laws often impose liability without regard to whether we knew about or were responsible for the presence of such hazardous or toxic substances. We may not know whether acquired or leased locations have been operated in compliance with environmental laws and regulations or that our future uses or conditions will not result in the imposition of liability upon us under such laws or expose us to third party actions such as tort suits.
We do not anticipate any capital expenditures for environmental remediation that would have a material effect on our financial condition.
Intellectual Property
We have the patents, trademarks, trade names and licenses that are necessary for the operation of our business. Other than the ARAMARK brand, we do not consider our patents, trademarks, trade names and licenses to be material to the operation of our business in any material respect.
11
Available Information
We file annual, quarterly and current reports and other information with the Securities and Exchange Commission (the “SEC”). These filings are available to the public over the Internet at the Securities and Exchange Commission’s web site at http://www.sec.gov. You may also read and copy any document we file at the Securities and Exchange Commission’s public reference room at 100 F. Street, N.E., Washington, D.C. 20549. Please call the Securities and Exchange Commission at 1-800-SEC-0330 for further information on the public reference room.
Our principal Internet address is www.aramark.com. We make available free of charge on www.aramark.com our annual, quarterly and current reports, and amendments to those reports, as soon as reasonably practicable after we electronically file such material with, or furnish it to, the SEC.
Our Business Conduct Policy includes a code of ethics for our principal executive officer, our principal financial officer and our principal accounting officer and applies to all of our employees and non-employee directors. Our Business Conduct Policy is available on the Investor Relations section of our website at www.aramark.com and is available in print to any person who requests it by writing or telephoning us at the address or telephone number set forth below.
You may request a copy of our SEC filings (excluding exhibits) and our Business Conduct Policy at no cost by writing or telephoning us at the following address or telephone number:
ARAMARK Corporation
1101 Market Street
Philadelphia, PA 19107
Attention: Assistant Corporate Secretary
Telephone: (215) 238-3000
The references to our web site and the SEC’s web site are intended to be inactive textual references only and the contents of those websites are not incorporated by reference herein.
The Company files with each of its Form 10-Qs and its Form 10-K certifications by the CEO and the CFO under sections 302 and 906 of the Sarbanes Oxley Act of 2002.
Item 1A. Risk Factors
Risks related to our business
General
Unfavorable economic conditions and increased operating costs could adversely affect our results of operations and financial condition.
A national or international economic downturn would reduce demand for our services in each of our operating segments, which may result in the loss of business or increased pressure to contract for business on less favorable terms than our generally preferred terms. Economic hardship among our client base can also impact our business. For example, during the recent period of economic distress, certain of our businesses have been negatively affected by reduced employment levels at our clients’ locations and declining levels of business and consumer spending. In addition, insolvency experienced by clients, especially larger clients, particularly in the financial services, non-profit healthcare, automotive and airline industries, could make it difficult for us to collect amounts we are owed and could result in the voiding of existing contracts. Similarly, financial distress or insolvency, if experienced by our key vendors and service providers such as insurance carriers, could significantly increase our costs. Any terrorist attacks, particularly against venues that we serve, and the national
12
and global military, diplomatic and financial response to such attacks or other threats, also may adversely affect our sales and operating results. Natural disasters, including hurricanes, or global calamities such as a flu pandemic also may affect our sales and operating results. In the past, ARAMARK experienced lost and closed client locations, business disruptions and delays, the loss of inventory and other assets, and the effect of the temporary conversion of a number of ARAMARK client locations to provide food and shelter to those left homeless by storms.
Our profitability can be adversely affected to the extent we are faced with cost increases for food, wages, other labor related expenses (including workers’ compensation, state unemployment insurance and state mandated health benefits and other healthcare costs), insurance, fuel, utilities, piece goods, clothing and equipment, especially to the extent we are unable to recover such increased costs through increases in the prices for our products and services, due to one or more of general economic conditions, competitive conditions or contractual provisions in our client contracts. With regard to healthcare, changes in eligibility requirements or enrollment procedures (such as automatic enrollment or mandated coverage) contemplated by certain of the health reform proposals currently under consideration in Congress could significantly increase our costs if we were required to cover more employees than we do currently or pay penalty amounts in the event that employees do not elect our offered coverage. In addition, oil and natural gas prices have fluctuated significantly in the last several years. Substantial increases in the cost of fuel and utilities have historically resulted in substantial cost increases in our uniform services business, and to a lesser extent in our food and support services segments. From time to time we have experienced increases in our food costs, which particularly adversely affected our corrections business. While we believe a portion of these increases were attributable to fuel prices, we believe the increases also resulted from rising global food demand and the increased production of biofuels such as ethanol. In addition, food prices can fluctuate as a result of temporary changes in supply, including as a result of incidences of severe weather such as droughts, heavy rains and late freezes. Approximately 74% of our food and support services sales are from profit and loss contracts under which we have limited ability to pass on cost increases to our clients.
Our business may suffer if we are unable to hire and retain sufficient qualified personnel or if labor costs increase.
In the past, at times when the United States has periodically experienced reduced levels of unemployment, there has been a shortage of qualified workers at all levels. Given that our workforce requires large numbers of entry level and skilled workers and managers, low levels of unemployment when such conditions exist can compromise our ability in certain of our businesses to continue to provide quality service or compete for new business. From time to time, we have had difficulty in hiring and maintaining qualified management personnel, particularly at the entry management level. We will continue to have significant requirements to hire such personnel. Our success also depends to a substantial extent on the ability, experience and performance of our management, particularly our Chairman and Chief Executive Officer, Joseph Neubauer.
We also regularly hire a large number of part-time workers, particularly in our food and support services segments. Any difficulty we may encounter in hiring such workers could result in significant increases in labor costs, which could have a material adverse effect on our business, financial condition and results of operations. Competition for labor has at times resulted in wage increases in the past and future competition could substantially increase our labor costs. Due to the labor intensive nature of our businesses and the fact that 74% of our food and support services segments’ sales are from profit and loss contracts under which we have limited ability to pass along cost increases, a shortage of labor or increases in wage levels in excess of normal levels could have a material adverse effect on our results of operations.
Our expansion strategy involves risks.
We may seek to acquire companies or interests in companies or enter into joint ventures that complement our business, and our inability to complete acquisitions, integrate acquired companies successfully or enter into
13
joint ventures may render us less competitive. We may be evaluating acquisitions or engaging in acquisition negotiations at any given time. We cannot be sure that we will be able to continue to identify acquisition candidates or joint venture partners on commercially reasonable terms or at all. If we make additional acquisitions, we also cannot be sure that any benefits anticipated from the acquisitions will actually be realized. Likewise, we cannot be sure that we will be able to obtain necessary financing for acquisitions, particularly given the current difficulty in obtaining financing in the credit markets. Such financing could be restricted by the terms of our debt agreements or it could be more expensive than our current debt. The amount of such debt financing for acquisitions could be significant and the terms of such debt instruments could be more restrictive than our current covenants. In addition, our ability to control the planning and operations of our joint ventures and other less than majority owned affiliates may be subject to numerous restrictions imposed by the joint venture agreements and majority shareholders. Our joint venture partners may also have interests which differ from ours.
The process of integrating acquired operations into our existing operations may result in operating, contract and supply chain difficulties, such as the failure to retain clients or management personnel and problems coordinating technology and supply chain arrangements. Also, in connection with any acquisition, we could fail to discover liabilities of the acquired company for which we may be responsible as a successor owner or operator in spite of any investigation we make prior to the acquisition. In addition, labor laws in certain countries may require us to retain more employees than would otherwise be optimal from entities we acquire. Such difficulties may divert significant financial, operational and managerial resources from our existing operations, and make it more difficult to achieve our operating and strategic objectives. The diversion of management attention, particularly in a difficult operating environment, may affect our sales. Similarly, our business depends on effective information technology systems and implementation delays or poor execution of the integration of different information technology systems could disrupt our operations and increase costs. Possible future acquisitions could result in the incurrence of additional debt and related interest expense or contingent liabilities and amortization expenses related to intangible assets, which could have a material adverse effect on our financial condition, operating results and/or cash flow. In addition, goodwill resulting from business combinations represents a significant portion of our assets. If the goodwill were deemed to be impaired, we would need to take a charge to earnings to write down the goodwill to its fair value.
If we fail to comply with requirements imposed by applicable law or other governmental regulations, we could become subject to lawsuits, investigations and other liabilities and restrictions on our operations that could significantly and adversely affect our business.
We are subject to governmental regulation at the federal, state, international, national, provincial and local levels in many areas of our business, such as food safety and sanitation, the sale of alcoholic beverages, minimum wage, overtime, wage payment, wage and hour and employment discrimination, immigration, human health and safety, including regulations of the U.S. Occupational Safety and Health Administration, federal motor carrier safety, data privacy, environmental protection, the import and export of goods and customs regulations, the False Claims Act, the Foreign Corrupt Practices Act and the services we provide in connection with governmentally funded entitlement programs.
From time to time, both federal and state governmental agencies have conducted audits of our billing practices as part of investigations of providers of services under governmental contracts, or otherwise. We also receive requests for information from governmental agencies in connection with these audits. While we attempt to comply with all applicable laws and regulations, we cannot assure you that we are in full compliance with all applicable laws and regulations or interpretations of these laws and regulations at all times or that we will be able to comply with any future laws, regulations or interpretations of these laws and regulations.
If we fail to comply with applicable laws and regulations, including those referred to above, we may be subject to investigations, criminal sanctions or civil remedies, including fines, injunctions, prohibitions on exporting, seizures or debarments from government contracts or the loss of liquor licenses. The cost of compliance or the consequences of non-compliance, including debarments, could have a material adverse effect
14
on our business and results of operations. In addition, governmental units may make changes in the regulatory frameworks within which we operate that may require either the corporation as a whole or individual businesses to incur substantial increases in costs in order to comply with such laws and regulations.
Changes in or new interpretations of the governmental regulatory framework may affect our contract terms and may reduce our sales or profits.
A portion of our sales, estimated to be approximately 13% in fiscal 2009, is derived from business with U.S. federal, state and local governments and agencies. Changes or new interpretations in, or changes in the enforcement of, the statutory or regulatory framework applicable to services provided under governmental contracts or bidding procedures, particularly by our food and support services businesses, could result in fewer new contracts or contract renewals, modifications to the methods we apply to price government contracts, or in contract terms of shorter duration than we have historically experienced, any of which could result in lower sales or profits than we have historically achieved, which could have an adverse effect on our results of operations. For example, the United States Department of Agriculture recently enacted regulations which changed the manner in which food service management companies who contract with school districts participating in the National School Lunch Program, among other programs, must handle the receipt, storage, usage and crediting of federally donated commodities. As a result of these regulatory changes, we may need to revise our practices relating to federally donated commodities provided to our school district clients that participate in one of these programs, which could impact our profitability under the contracts with those clients.
Further unionization of our workforce may increase our costs.
Approximately 39,000 employees in our U.S. operations are represented by unions and covered by collective bargaining agreements. Certain unions representing employees in our Food and Support Services—North America and Uniform and Career Apparel segments have targeted us and the other major companies in our industries for increased representation of our workforce. We have always respected our employees’ right to unionize or not to unionize. However, the unionization of a significantly greater portion of our workforce could increase our overall costs at the affected locations and adversely affect our flexibility to run our business in the most efficient manner to remain competitive or acquire new business. In addition, any significant increase in the number of work stoppages at our various operations could adversely affect our business, financial condition or results of operations.
Our international business results are influenced by currency fluctuations and other risks that could have an effect on our results of operations and financial condition.
A significant portion of our sales is derived from international business. During fiscal 2009, approximately 19% of our sales was generated outside the United States and Canada. We currently have a presence in 20 countries outside of the United States and Canada with approximately 81,000 personnel. The operating results of our Canadian business and our international subsidiaries are translated into U.S. dollars and such results are affected by movements in foreign currencies relative to the U.S. dollar. Our international operations are also subject to other risks, including the requirement to comply with changing and conflicting national and local regulatory requirements; Foreign Corrupt Practices Act compliance matters; potential difficulties in staffing and labor disputes; differing local labor laws; managing and obtaining support and distribution for local operations; credit risk or financial condition of local customers; potential imposition of restrictions on investments; potentially adverse tax consequences, including imposition or increase of withholding, VAT and other taxes on remittances and other payments by subsidiaries; foreign exchange controls; and local political and social conditions. There can be no assurance that the foregoing factors will not have a material adverse effect on our international operations or on our consolidated financial condition and results of operations. We intend to continue to develop our business in emerging countries over the long term. Emerging international operations present several additional risks, including greater fluctuation in currencies relative to the U.S. dollar; economic and governmental instability; civil disturbances; volatility in gross domestic production; and nationalization and expropriation of private assets.
15
Our failure to retain our current clients and renew our existing client contracts could adversely affect our business.
Our success depends on our ability to retain our current clients and renew our existing client contracts. Our ability to do so generally depends on a variety of factors, including the quality, price and responsiveness of our services, as well as our ability to market these services effectively and differentiate ourselves from our competitors. We cannot assure you that we will be able to renew existing client contracts at the same or higher rates or that our current clients will not turn to competitors, cease operations, elect to self-operate or terminate contracts with us. The failure to renew a significant number of our existing contracts would have a material adverse effect on our business and results of operations.
We may be adversely affected if customers reduce their outsourcing or use of preferred vendors.
Our business and growth strategies depend in large part on the continuation of a current trend toward outsourcing services. Customers will outsource if they perceive that outsourcing may provide higher quality services at a lower overall cost and permit them to focus on their core business activities. We cannot be certain that this trend will continue or not be reversed or that customers that have outsourced functions will not decide to perform these functions themselves. In addition, labor unions representing employees of some of our current and prospective customers have occasionally opposed the outsourcing trend to the extent that they believed that current union jobs for their memberships might be lost. In these cases, unions typically seek to ensure that jobs that are outsourced continue to be unionized and thus, the unions seek to direct to union employees jobs in our industry. We have also identified a trend among some of our customers toward the retention of a limited number of preferred vendors to provide all or a large part of their required services. We cannot be certain that this trend will continue or not be reversed or, if it does continue, that we will be selected and retained as a preferred vendor to provide these services. Unfavorable developments with respect to either of these trends could have a material adverse effect on our business and results of operations.
Our operations are seasonal and quarter to quarter comparisons may not be a good indicator of our performance.
In the first and second fiscal quarters, within the Food and Support Services—North America segment, there historically has been a lower level of sales at the historically higher margin sports, entertainment and recreational food service operations, which is partly offset by increased activity in the educational sector. In the third and fourth fiscal quarters, there historically has been a significant increase in sales at sports, entertainment and recreational accounts, which is partially offset by the effect of summer recess in the educational sector. For these reasons, a quarter-to-quarter comparison is not a good indication of our performance or how we will perform in the future.
Environmental regulations may subject us to significant liability and limit our ability to grow.
We are subject to various federal, state and local laws and regulations, including the federal Clean Water Act, Clean Air Act, Resource Conservation and Recovery Act, Comprehensive Environmental Response, Compensation, and Liability Act and similar state statutes and regulations. For example, industrial laundries in our uniform rental segment use and discharge wastewater containing detergents and other residues from the laundering of garments and other merchandise through publicly operated treatment works or sewer systems and are subject to volume and chemical discharge limits and penalties and fines for non-compliance. In the course of our business, we settle, or contribute to the settlement of, actions or claims brought against us relating to the disposal of hazardous materials. We may, in the future, be required to expend material amounts to rectify the consequences of any such disposal. In addition, changes to federal or state environmental laws may subject us to additional costs or cause us to change aspects of our business. Under federal and state environmental laws, as an owner or operator of real estate we may be liable for the costs of removal or remediation of certain hazardous or toxic substances located on or in or emanating from our owned or leased property, as well as related costs of investigation and property damage. Liability may be imposed upon us without regard to whether we knew of or
16
were responsible for the presence of such hazardous or toxic substances. There can be no assurances that locations that we own, lease or otherwise operate, either for ourselves or for our clients, or that we may acquire in the future, have been operated in compliance with environmental laws and regulations or that future uses or conditions will not result in the imposition of liability upon us under such laws or expose us to third party actions such as tort suits. In addition, such regulations may limit our ability to identify suitable sites for new or expanded plants. In connection with our operations and the operations of our predecessors or companies that we have acquired, hazardous or toxic substances may migrate from properties on which we operate or which were operated by our predecessors or companies we acquired to other properties. We may be subject to significant liabilities to the extent that human health is damaged or the value of such properties is diminished by such migration.
Our Sponsors can strongly influence us and may have conflicts of interest with us or you in the future.
The Sponsors indirectly own, through their ownership in Holdings, a substantial majority of our capital stock on a fully-diluted basis because of the Transaction. As a result, the Sponsors have the ability to prevent any transaction that requires the approval of stockholders. Additionally, the Sponsors are in the business of making investments in companies and may from time to time acquire and hold interests in businesses that compete directly or indirectly with us. One or more of the Sponsors may also pursue acquisition opportunities that may be complementary to our business and, as a result, those acquisition opportunities may not be available to us. So long as the Sponsors, or funds controlled by or associated with the Sponsors, continue to own a significant amount of the outstanding shares of Holdings’ common stock, even if such amount is less than 50%, the Sponsors will continue to be able to strongly influence our decisions.
Food and Support Services
Competition in our industry could adversely affect our results of operations.
There is significant competition in the food and support services business from local, regional, national and international companies, of varying sizes, many of which have substantial financial resources. Our ability to successfully compete depends on our ability to provide quality services at a reasonable price and to provide value to our customers. Certain of our competitors have been and may in the future be willing to underbid us or accept a lower profit margin or expend more capital in order to obtain or retain business. Also, certain regional and local service providers may be better established than we are within a specific geographic region. In addition, existing or potential clients may elect to self operate their food service, eliminating the opportunity for us to serve them or compete for the account. While we have a significant international presence, should business sector clients require multinational bidding, we may be placed at a competitive disadvantage because we may not be able to offer as extensive a portfolio of services or services in as many countries as some of our competitors.
Sales of sports, entertainment and recreational services would be adversely affected by a decline in attendance at client facilities or by a reduction or cessation of events.
The portion of our food and support services business which provides services in public facilities such as convention centers and tourist and recreational attractions is sensitive to an economic downturn, as expenditures to take vacations or hold or attend conventions are funded to a partial or total extent by discretionary income. A decrease in such discretionary income on the part of potential attendees at our clients’ facilities could result in a reduction in our sales. For example, our convention centers business has recently experienced softness due to declining levels of business and consumer spending as a result of the weakening economy. Further, because our exposure to the ultimate consumer of what we provide is limited by our dependence on our clients to attract customers to their facilities and events, our ability to respond to such a reduction in attendance, and therefore our sales, is limited. There are many factors that could reduce the numbers of events in a facility or attendance at an event, including labor disruptions involving sports leagues, poor performance by the teams playing in a facility, inclement weather and adverse economic conditions which would adversely affect sales and profits.
17
The pricing and cancellation terms of our food and support services contracts may constrain our ability to recover costs and to make a profit on our contracts.
The amount of risk that we bear and our profit potential vary depending on the type of contract under which we provide food and support services. We may be unable to fully recover costs on contracts that limit our ability to increase prices. In addition, we provide many of our services under contracts of indefinite term, which are subject to termination on short notice by either party without cause. Some of our profit and loss contracts contain minimum guaranteed remittances to our client regardless of our sales or profit at the facility involved. If sales do not exceed costs under a contract which contains minimum guaranteed commissions, we will bear any losses which are incurred, as well as the guaranteed commission. Generally, our contracts limit our ability to raise prices on the food, beverages and merchandise we sell within a particular facility without the client’s consent. In addition, some of our contracts exclude certain events or products from the scope of the contract, or give the client the right to modify the terms under which we may operate at certain events. The refusal by individual clients to permit the sale of some products at their venues, the imposition by clients of limits on prices which are not economically feasible for us, or decisions by clients to curtail their use of the services we provide could adversely affect our sales and results of operations.
Our business is contract intensive and may lead to client disputes.
Our business is contract intensive and we are parties to many contracts with clients all over the world. Our client interest contracts provide that client billings, and for some contracts the sharing of profits and losses, are based on our determinations of costs of service. Contract terms under which we base these determinations may be subject to differing interpretations which could result in disputes with our clients from time to time. Clients generally have the right to audit our contracts, and we periodically review our compliance with contract terms and provisions. If clients were to dispute our contract determinations, the resolution of such disputes in a manner adverse to our interests could negatively affect sales and operating results. While we do not believe any reviews, audits or other such matters should result in material adjustments, if a large number of our client arrangements were modified in response to any such matter, the effect could be materially adverse to our business or results of operations.
Claims of illness or injury associated with the service of food and beverage to the public could adversely affect us.
Claims of illness or injury relating to food quality or food handling are common in the food service industry, and a number of these claims may exist at any given time. As a result, we could be adversely affected by negative publicity resulting from food quality or handling claims at one or more of the facilities that we serve. In addition to decreasing sales and profitability at our facilities, adverse publicity could negatively impact our service reputation, hindering our ability to renew contracts on favorable terms or to obtain new business. In addition, future food product recalls and health concerns associated with food contamination may from time to time disrupt our business.
In fiscal 2009, one distributor provided approximately 56% of our food and non-food products in the United States and Canada, and if our relationship or their business were to be disrupted, we could experience disruptions to our operations and cost structure in such countries.
If our relationship with, or the business of, SYSCO, our main U.S. and Canadian distributor of our food and non-food products were to be disrupted, we would have to arrange alternative distributors and our operations and cost structure could be adversely affected in the short term. Similarly, a sudden termination of the relationship with a significant provider in other geographic areas could in the short term adversely affect our ability to provide services and disrupt our customer relationships in such areas.
18
Governmental regulations relating to food and beverages may subject us to significant liability.
The regulations relating to each of our food and support service segments are numerous and complex. A variety of regulations at various governmental levels relating to the handling, preparation and serving of food (including in some cases requirements relating to the temperature of food), and the cleanliness of food production facilities and the hygiene of food-handling personnel are enforced primarily at the local public health department level. We cannot assure you that we are in full compliance with all applicable laws and regulations at all times or that we will be able to comply with any future laws and regulations. Furthermore, additional or amended regulations in this area may significantly increase the cost of compliance.
We serve alcoholic beverages at many facilities, and must comply with applicable licensing laws, as well as state and local service laws, commonly called dram shop statutes. Dram shop statutes generally prohibit serving alcoholic beverages to certain persons such as an individual who is intoxicated or a minor. If we violate dram shop laws, we may be liable to the patron and/or third parties for the acts of the patron. Although we sponsor regular training programs designed to minimize the likelihood of such a situation, we cannot guarantee that intoxicated or minor patrons will not be served or that liability for their acts will not be imposed on us. There can be no assurance that additional regulation in this area would not limit our activities in the future or significantly increase the cost of regulatory compliance. We must also obtain and comply with the terms of licenses in order to sell alcoholic beverages in the states in which we serve alcoholic beverages. Some of our contracts require us to pay liquidated damages during any period in which our liquor license for the facility is suspended, and most contracts are subject to termination if we lose our liquor license for the facility.
Uniform and Career Apparel
Competition in the uniform rental industry could adversely affect our results of operations.
We have a number of major national competitors in the uniform rental industry with significant financial resources. In addition, there are regional and local uniform suppliers whom we believe may have strong customer loyalty. While most customers focus primarily on quality of service, uniform rental also is a price-sensitive service and if existing or future competitors seek to gain customers or accounts by reducing prices, we may be required to lower prices, which would reduce our sales and profits. The uniform rental business requires investment capital for growth. Failure to maintain capital investment in this segment would put us at a competitive disadvantage. In addition, due to competition in our uniform business, it has become increasingly important for us to source garments and other products overseas, particularly in Asia. To the extent we are not able to effectively source such products in Asia and gain the related cost savings, we may be at a further disadvantage in relation to some of our competitors.
Economic and business conditions affecting our customer base and our operating costs could negatively impact our sales and operating results.
We supply uniform services to the airline, auto, hospitality, retail and manufacturing industries, among others, all of which have been subject to one or more of shifting employment levels, changes in worker productivity, uncertainty regarding the impacts of rehiring, a shift to offshore manufacturing and bankruptcy. Economic hardship among our client base could cause some of our clients to restrict expenditures or even cease to conduct business, both of which could negatively affect our sales and operating results.
Our operations are exposed to increases in garment and fuel prices. The cost of gasoline and natural gas has fluctuated significantly in the United States in the last several years. To the extent we are not able to mitigate or pass on our increased costs to customers—for fuel expenses or any other of our costs that may increase—our operating results may be negatively affected.
19
Risks associated with the suppliers from whom our products are sourced could adversely affect our results of operations.
The products we sell are sourced from a wide variety of domestic and international suppliers. Global sourcing of many of the products we sell is an important factor in our financial performance. We seek to require our suppliers to comply with applicable laws and otherwise be certified as meeting our supplier standards of conduct. Our ability to find qualified suppliers who meet our standards, and to access products in a timely and efficient manner is a significant challenge, especially with respect to suppliers located and goods sourced outside the United States. In addition, insolvency experienced by suppliers could make it difficult for us to source our products. Political and economic stability in the countries in which foreign suppliers are located, the financial stability of suppliers, suppliers’ failure to meet our supplier standards, labor problems experienced by our suppliers, the availability of raw materials to suppliers, currency exchange rates, transport availability and cost, inflation and other factors relating to the suppliers and the countries in which they are located are beyond our control. In addition, United States foreign trade policies, tariffs and other impositions on imported goods, trade sanctions imposed on certain countries, the limitation on the importation of certain types of goods or of goods containing certain materials from other countries and other factors relating to foreign trade are beyond our control. These and other factors affecting our suppliers and our access to products could adversely affect our results of operations.
Risks related to our indebtedness
Our leverage could adversely affect our ability to raise additional capital to fund our operations, limit our ability to react to changes in the economy or our industry, expose us to interest rate risk to the extent of our variable rate debt and prevent us from meeting our obligations.
We are highly leveraged. As of October 2, 2009, our outstanding indebtedness was $5,722 million, including our senior notes. We also had an additional $581.0 million available for borrowing under our revolving credit facility at that date. In addition, approximately $235.4 million of funding was outstanding under our receivables facility as of October 2, 2009.
This degree of leverage could have important consequences, including:
| • | exposing us to the risk of increased interest rates as certain of our borrowings, including borrowings under our senior secured credit facilities, our receivables facility and our senior floating rate notes are at variable rates of interest; |
| • | making it more difficult for us to make payments on our indebtedness; |
| • | increasing our vulnerability to general economic and industry conditions; |
| • | requiring a substantial portion of cash flow from operations to be dedicated to the payment of principal and interest on our indebtedness, therefore reducing our ability to use our cash flow to fund our operations, capital expenditures and future business opportunities; |
| • | restricting us from making strategic acquisitions or causing us to make non-strategic divestitures; |
| • | limiting our ability to obtain additional financing for working capital, capital expenditures, debt service requirements, acquisitions and general corporate or other purposes; and |
| • | limiting our ability to adjust to changing market conditions and placing us at a competitive disadvantage compared to our competitors who are less highly leveraged. |
We and our subsidiaries may be able to incur substantial additional indebtedness in the future, subject to the restrictions contained in our senior secured credit facilities and the indenture governing our senior fixed rate notes and our senior floating rate notes. If new indebtedness is added to our current debt levels, the related risks that we now face could increase.
20
If our financial performance were to deteriorate, we may not be able to generate sufficient cash to service all of our indebtedness and may be forced to take other actions to satisfy our obligations under our indebtedness, which may not be successful.
Our ability to make scheduled payments on or to refinance our debt obligations depends on our financial condition and operating performance, which is subject to prevailing economic and competitive conditions and to certain financial, business and other factors beyond our control. While we believe that we currently have adequate cash flows to service our indebtedness, if our financial performance were to deteriorate significantly, we might be unable to maintain a level of cash flows from operating activities sufficient to permit us to pay the principal, premium, if any, and interest on our indebtedness.
If, due to such a deterioration in our financial performance, our cash flows and capital resources were to be insufficient to fund our debt service obligations, we may be forced to reduce or delay investments and capital expenditures, or to sell assets, seek additional capital or restructure or refinance our indebtedness. These alternative measures may not be successful and may not permit us to meet our scheduled debt service obligations. In addition, if we were required to raise additional capital in the current financial markets, the terms of such financing, if available, could result in higher costs and greater restrictions on our business. In addition, although a significant amount of our long-term borrowings do not mature until 2012 and later, if we were to need to refinance our existing indebtedness, the current conditions in the financial markets could make it difficult to refinance our existing indebtedness on acceptable terms or at all. If such alternative measures proved unsuccessful, we could face substantial liquidity problems and might be required to dispose of material assets or operations to meet our debt service and other obligations. Our senior secured credit agreement and the indenture governing our senior fixed rate notes and senior floating rate notes restricts our ability to dispose of assets and use the proceeds from any disposition of assets and to refinance our indebtedness. We may not be able to consummate those dispositions or to obtain the proceeds that we could realize from them and these proceeds may not be adequate to meet any debt service obligations then due.
Our debt agreements contain restrictions that limit our flexibility in operating our business.
Our senior secured credit agreement and the indenture governing our senior fixed rate notes due 2015 and senior floating rate notes due 2015 contain various covenants that limit our ability to engage in specified types of transactions. These covenants limit our and our restricted subsidiaries’ ability to, among other things:
| • | incur additional indebtedness, refinance or restructure indebtedness or issue certain preferred shares; |
| • | pay dividends on, repurchase or make distributions in respect of our capital stock, make unscheduled payments on our notes, repurchase or redeem our notes or make other restricted payments; |
| • | make certain investments; |
| • | sell certain assets; |
| • | create liens; |
| • | consolidate, merge, sell or otherwise dispose of all or substantially all of our assets; and |
| • | enter into certain transactions with our affiliates. |
Our senior notes due 2012 contain covenants that, among other things, limit our ability to merge or consolidate with or into any person, enter into liens on principal property, enter into sale and lease back transactions, or to sell, lease or convey all or substantially all of our assets.
In addition, our senior secured revolving credit facility requires us to satisfy and maintain specified financial ratios and other financial condition tests. Our ability to meet those financial ratios and tests can be affected by events beyond our control, and in the event of a significant deterioration of our financial performance, we cannot assure you that we will satisfy those ratios and tests. A breach of any of these covenants could result in a default
21
under the senior secured credit agreement. Upon our failure to maintain compliance with these covenants that is not waived by the lenders under the revolving credit facility, the lenders under the senior secured credit facilities could elect to declare all amounts outstanding under the senior secured credit facilities to be immediately due and payable and terminate all commitments to extend further credit under such facilities. If we were unable to repay those amounts, the lenders under the senior secured credit facilities could proceed against the collateral granted to them to secure that indebtedness. We have pledged a significant portion of our assets as collateral under the senior secured credit agreement. If the lenders under the senior secured credit facilities accelerate the repayment of borrowings, we cannot assure you that we will have sufficient assets to repay those borrowings, as well as our unsecured indebtedness. If our senior secured indebtedness was accelerated by the lenders as a result of a default, our senior notes due 2015 and our senior notes due 2012 may become due and payable as well.
Item 1B. Unresolved Staff Comments
Not Applicable.
Item 2. Properties
Our principal executive offices are located at ARAMARK Tower, 1101 Market Street, Philadelphia, Pennsylvania 19107. Our principal real estate is primarily comprised of Uniform and Career Apparel facilities. As of October 2, 2009, we operated 261 service facilities in our Uniform and Career Apparel segment, consisting of industrial laundries, cleanroom laundries, warehouses, distribution centers, satellites, depots, stand alone garages and retail stores that are located in 40 states, Mexico, Canada and Puerto Rico. Of these, approximately 54% are leased and approximately 46% are owned. In addition, we operate one cutting and sewing plant in Mexico. We own 14 buildings that we use in our Food and Support Services—North America segment, including two office buildings, three hotels and several office/warehouse spaces, and we lease 144 premises, consisting of offices, office/warehouses and distribution centers. In addition, we own two distribution centers and lease 85 facilities throughout the world that we use in our Food and Support Services—International segment. We also maintain other real estate and leasehold improvements, which we use in the Uniform and Career Apparel and Food and Support Services business groups. No individual parcel of real estate owned or leased is of material significance to our total assets.
Item 3. Legal Proceedings
See Item 7, “Management’s Discussion and Analysis of Financial Condition and Results of Operations,” for a description of the Company’s legal proceedings.
Item 4. Submission of Matters to a Vote of Security Holders
On September 9, 2009, ARAMARK Intermediate Holdco Corporation, the sole stockholder of ARAMARK Corporation, acted by written consent to re-elect Joseph Neubauer, L. Frederick Sutherland and Christopher S. Holland as directors of ARAMARK Corporation. Messrs. Neubauer, Sutherland and Holland will serve as directors of ARAMARK Corporation until their successors are duly elected and qualified.
22
PART II
Item 5. Market for Registrant’s Common Equity, Related Stockholder Matters and Issuer Purchases of Equity Securities
All of the outstanding common stock of ARAMARK Corporation is held by ARAMARK Intermediate Holdco Corporation, which is 100% owned by Holdings.
See Item 7, “Liquidity and Capital Resources,” for a description of restrictions on our ability to pay dividends.
23
Item 6.
SELECTED CONSOLIDATED FINANCIAL DATA
The following table presents selected consolidated financial data. This information should be read in conjunction with the consolidated financial statements and the related notes thereto, Management’s Discussion and Analysis of Financial Condition and Results of Operations, and Risk Factors, each included elsewhere herein (dollars in millions, except per share amounts).
| Successor | Predecessor | |||||||||||||||||||||||||
| Fiscal Year Ended on or near September 30(1) |
Period
from January 27, 2007 through September 28, 2007 |
Period from September 30, 2006 through January 26, 2007 |
Fiscal Year Ended on or near September 30(1) |
|||||||||||||||||||||||
| 2009 | 2008 | 2006 | 2005 | |||||||||||||||||||||||
| Income Statement Data: |
||||||||||||||||||||||||||
| Sales |
$ | 12,297.9 | $ | 13,470.2 | $ | 8,438.4 | $ | 3,945.9 | $ | 11,621.2 | $ | 10,963.4 | ||||||||||||||
| Depreciation and amortization |
503.1 | 509.1 | 322.5 | 116.4 | 339.3 | 320.1 | ||||||||||||||||||||
| Operating income (2) |
437.5 | 566.1 | 386.6 | 68.5 | 530.5 | 580.2 | ||||||||||||||||||||
| Interest and other financing costs, net (6) |
472.3 | 514.7 | 365.9 | 48.7 | 139.9 | 127.0 | ||||||||||||||||||||
| Income (loss) from continuing operations (3) |
(6.9 | ) | 39.5 | 16.1 | 14.8 | 261.4 | 288.5 | |||||||||||||||||||
| Net income (loss) (4) (7) |
(6.9 | ) | 39.5 | 16.1 | 14.8 | 261.1 | 288.5 | |||||||||||||||||||
| Cash dividends per common share (8) |
— | — | — | $ | 0.07 | $ | 0.28 | $ | 0.22 | |||||||||||||||||
| Ratio of earnings to fixed charges (5) |
0.9 | x | 1.1 | x | 1.0 | x | 1.2 | x | 3.0 | x | 3.5 | x | ||||||||||||||
| Balance Sheet Data (at period end): |
||||||||||||||||||||||||||
| Total assets |
$ | 10,299.4 | $ | 10,523.4 | $ | 10,593.7 | $ | 5,263.3 | $ | 5,157.1 | ||||||||||||||||
| Long-term borrowings |
5,677.7 | 5,804.9 | 5,839.1 | 1,763.1 | 1,794.5 | |||||||||||||||||||||
| Shareholders’ equity |
1,360.4 | 1,339.8 | 1,439.6 | 1,521.6 | 1,325.5 | |||||||||||||||||||||
| (1) | Our fiscal year ends on the Friday nearest to September 30th. Fiscal years 2009, 2008, 2006 and 2005 refer to the fiscal years ended October 2, 2009, October 3, 2008, September 29, 2006, and September 30, 2005, respectively. Fiscal 2008 is a 53-week year. All other periods presented are 52-week years. |
| (2) | Fiscal 2009 includes share-based compensation expense of $25.4 million. During the second quarter of fiscal 2009, the Company initiated a repositioning effort to reduce the cost structure and address the demand softness in the WearGuard direct marketing business. In addition, the Company has been reducing its headcount in all the businesses in the Uniform and Career Apparel segment. As a result of these actions, the Company recorded a total charge of approximately $34.2 million during the second quarter of fiscal 2009 related to these actions (see Note 13 to the consolidated financial statements). For fiscal 2008, share-based compensation expense was $11.8 million and included a reversal of approximately $13.3 million of share-based compensation expense during the fourth quarter of fiscal 2008 related to expense previously recognized for Performance-Based Options (see Note 11 to the consolidated financial statements). During the Successor period from January 27, 2007 through September 28, 2007, the Company recorded share-based compensation expense of $27.5 million and $5.7 million of costs related to the Transaction. The Company also recorded a gain of $21.2 million from the sale of its 50% interest in SMG (see Note 3 to the consolidated financial statements) and a charge of $4.2 million for the impairment of a technology asset. During the Predecessor period from September 30, 2006 through January 26, 2007, the Company recorded costs of $112.1 million related to the Transaction. These costs consist of $11.2 million of accounting, |
24
| investment banking, legal and other costs associated with the Transaction, a compensation charge of approximately $77.1 million related to the accelerated vesting and buyout of employee stock options and restricted stock units, and a charge of approximately $23.8 million related to change in control payments to certain executives. During fiscal 2006, the Company recorded a charge of approximately $43.0 million to reflect goodwill impairment, inventory write-downs and severance accruals in the Uniform and Career Apparel segment. The Company adopted the accounting pronouncement for share-based payments during the first quarter of fiscal 2006 and recorded shared-based compensation expense of $22.0 million for fiscal 2006. During fiscal 2005, the Company recorded a gain of $9.7 million from the sale of real estate by an equity affiliate, as well as charges of $7.4 million for exiting the Company’s West Africa business and severance. |
| (3) | During fiscal 2006, the Company recorded a $14.9 million favorable income tax adjustment based on the settlement of certain open tax years. |
| (4) | During fiscal 2006, the Company adopted the provisions of the accounting pronouncement for conditional asset retirement obligations and recognized an after-tax charge of $3.4 million for the cumulative effect of the change in accounting principle. |
| (5) | For the purpose of determining the ratio of earnings to fixed charges, earnings include pre-tax income from continuing operations plus fixed charges (excluding capitalized interest). Fixed charges consist of interest on all indebtedness (including capitalized interest) plus that portion of operating lease rentals representative of the interest factor (deemed to be one-third of operating lease rentals). |
| (6) | During the Successor period from January 27, 2007 through September 28, 2007, the Company recorded a charge of $12.8 million for the cost of obtaining a bridge financing facility. See Note 2 to the consolidated financial statements. |
| (7) | In fiscal 2003, ARAMARK completed the sale of ARAMARK Educational Resources (AER) to Knowledge Learning Corporation for approximately $250 million in cash. AER has been accounted for as a discontinued operation. At the time of sale, certain accruals were established for liabilities expected pursuant to the indemnification provisions of the sale agreement. In fiscal 2006, the remaining accrual balances were adjusted to reflect current expectations, resulting in additional income from discontinued operations of $3.1 million, net of tax. |
| (8) | During the Predecessor period from September 30, 2006 through January 26, 2007, the Company paid cash dividends totaling $12.6 million ($0.07/share for the first quarter of fiscal 2007). During fiscal 2006, the Company paid cash dividends totaling $50.5 million ($0.07/share in each of the four quarters of fiscal 2006). During fiscal 2005, the Company paid cash dividends totaling $40.3 million ($0.055/share in each of the four quarters of fiscal 2005). |
25
Item 7.
MANAGEMENT’S DISCUSSION AND ANALYSIS
OF FINANCIAL CONDITION AND RESULTS OF OPERATIONS
The following discussion and analysis of our financial condition and results of operations for the fiscal years ended October 2, 2009, October 3, 2008 and September 28, 2007, should be read in conjunction with Selected Consolidated Financial Data and our audited consolidated financial statements and the notes to those statements.
ARAMARK Corporation (the “Company” or “ARAMARK”) was acquired on January 26, 2007 through a merger transaction with RMK Acquisition Corporation, a Delaware corporation controlled by investment funds associated with GS Capital Partners, CCMP Capital Advisors, J.P. Morgan Partners, Thomas H. Lee Partners and Warburg Pincus LLC (collectively, the “Sponsors”), Joseph Neubauer, Chairman and Chief Executive Officer of ARAMARK, and certain other members of the Company’s management. The acquisition was accomplished through the merger of RMK Acquisition Corporation with and into ARAMARK Corporation with ARAMARK Corporation being the surviving company (the “Transaction”).
The Company is a wholly-owned subsidiary of ARAMARK Intermediate Holdco Corporation, which is wholly-owned by ARAMARK Holdings Corporation (the “Parent Company”). ARAMARK Holdings Corporation, ARAMARK Intermediate Holdco Corporation and RMK Acquisition Corporation were formed for the purpose of facilitating the Transaction and have no operations other than ownership of the Company.
Although ARAMARK Corporation continued as the same legal entity after the Transaction, the accompanying consolidated statements of operations and cash flows are presented for two periods: Predecessor and Successor, which relate to the period preceding the Transaction and the period succeeding the Transaction, respectively. As a result of the Transaction and the related purchase accounting described in Note 2 of the consolidated financial statements, the Predecessor and Successor financial statements are not comparable. The Company refers to the operations of ARAMARK Corporation and subsidiaries for both the Predecessor and Successor periods.
On March 30, 2007, ARAMARK Corporation was merged with and into ARAMARK Services, Inc. with ARAMARK Services, Inc. being the surviving corporation. In connection with the consummation of the merger, ARAMARK Services, Inc. changed its name to ARAMARK Corporation.
Our discussion contains forward-looking statements based upon current expectations that involve risks and uncertainties, such as our plans, objectives, opinions, expectations, anticipations and intentions and beliefs. Actual results and the timing of events could differ materially from those anticipated in those forward-looking statements as a result of a number of factors, including those set forth under the Risk Factors, Special Note About Forward-Looking Statements and Business sections and elsewhere in this Annual Report on Form 10-K. In the following discussion and analysis of results of operations and financial condition, certain financial measures may be considered “non-GAAP financial measures” under Securities and Exchange Commission (“SEC”) rules. These rules require supplemental explanation and reconciliation, which is provided elsewhere in this Annual Report on Form 10-K.
Critical Accounting Policies and Estimates
The Company’s significant accounting policies are described in the notes to the consolidated financial statements included in this Annual Report. As described in such notes, the Company recognizes sales in the period in which services are provided pursuant to the terms of our contractual relationships with our clients.
In preparing our financial statements, management is required to make estimates and assumptions that, among other things, affect the reported amounts of assets, liabilities, sales and expenses. These estimates and
26
assumptions are most significant where they involve levels of subjectivity and judgment necessary to account for highly uncertain matters or matters susceptible to change, and where they can have a material impact on our financial condition and operating performance. We discuss below the more significant estimates and related assumptions used in the preparation of our consolidated financial statements. If actual results were to differ materially from the estimates made, the reported results could be materially affected.
Asset Impairment Determinations
Goodwill and trade name are indefinite lived intangible assets that are not amortizable and are subject to an impairment test that we conduct annually or more frequently if a change in circumstances or the occurrence of events indicates that potential impairment exists, using discounted cash flows. The Company performs its assessment of goodwill at the operating segment level unless specific circumstances require evaluation at a lower level. Within the Food and Support Services—International segment, each country is evaluated separately since such operating units are relatively autonomous and separate goodwill balances have been recorded for each entity. The Company has completed its annual goodwill impairment test, which did not result in an impairment charge. In addition, no reporting units were at risk of failing the annual goodwill impairment test.
With respect to our other long-lived assets, we are required to test for asset impairment whenever events or circumstances indicate that the carrying value of an asset may not be recoverable. If indicators of impairment are present, the Company compares the sum of the future expected cash flows from the asset, undiscounted and without interest charges, to the asset’s carrying value. If the sum of the future expected cash flows from the asset is less than the carrying value, an asset impairment must be recognized in the financial statements. The amount of the impairment is the difference between the fair value of the asset and the carrying value of the asset.
In making future cash flow analyses of various assets, the Company makes assumptions relating to the following:
| • | The intended use of assets and the expected future cash flows resulting directly from such use; |
| • | Comparable market valuations of businesses similar to ARAMARK’s business segments; |
| • | Industry specific economic conditions; |
| • | Competitor activities and regulatory initiatives; and |
| • | Client and customer preferences and behavior patterns. |
We believe that an accounting estimate relating to asset impairment is a critical accounting estimate because the assumptions underlying future cash flow estimates are subject to change from time to time and the recognition of an impairment could have a significant impact on our income statement.
Environmental Loss Contingencies
Accruals for environmental loss contingencies (i.e., environmental reserves) are recorded when it is probable that a liability has been incurred and the amount can reasonably be estimated. Management views the measurement of environmental reserves as a critical accounting estimate because of the considerable uncertainty surrounding estimation, including the need to forecast well into the future. We are involved in legal proceedings under state, federal and local environmental laws in connection with operations of our Uniform and Career Apparel segment or businesses conducted by our predecessors or companies that we have acquired. The calculation of environmental reserves is based on the evaluation of currently available information, prior experience in the remediation of contaminated sites and assumptions with respect to government regulations and enforcement activity, changes in remediation technology and practices, and financial obligations and creditworthiness of other responsible parties and insurers.
27
Litigation and Claims
The Company is a party to various legal actions and investigations including, among others, employment matters, compliance with government regulations, including import and export controls and customs laws, federal and state employment laws, including wage and hour laws, human health and safety laws, dram shop laws, environmental laws, false claim statutes, contractual disputes and other matters, including matters arising in the ordinary course of business. These claims may be brought by, among others, the government, clients, customers, employees and third parties. Management considers the measurement of litigation reserves as a critical accounting estimate because of the significant uncertainty in some cases relating to the outcome of potential claims or litigation and the difficulty of predicting the likelihood and range of potential liability involved, coupled with the material impact on our results of operations that could result from litigation or other claims. In determining legal reserves, management considers, among other issues:
| • | Interpretation of contractual rights and obligations; |
| • | The status of government regulatory initiatives, interpretations and investigations; |
| • | The status of settlement negotiations; |
| • | Prior experience with similar types of claims; |
| • | Whether there is available insurance; and |
| • | Advice of counsel. |
Allowance for Doubtful Accounts
We encounter risks associated with sales and the collection of the associated accounts receivable. We record a provision for accounts receivable that are considered to be uncollectible. In order to calculate the appropriate provision, management analyzes the creditworthiness of specific customers and the aging of customer balances. Management also considers general and specific industry economic conditions, industry concentrations, such as exposure to small and medium-sized businesses, the non-profit healthcare sector and the automotive, airline and financial services industries, and contractual rights and obligations. Management believes that the accounting estimate related to the allowance for doubtful accounts is a critical accounting estimate because the underlying assumptions used for the allowance can change from time to time and uncollectible accounts could potentially have a material impact on our results of operations.
Inventory Obsolescence
We record an inventory obsolescence reserve for obsolete, excess and slow-moving inventory, principally in the Uniform and Career Apparel segment. In calculating our inventory obsolescence reserve, management analyzes historical and projected data regarding customer demand within specific product categories and makes assumptions regarding economic conditions within customer specific industries, as well as style and product changes. Management believes that its accounting estimate related to inventory obsolescence is a critical accounting estimate because customer demand in certain of our businesses can be variable and changes in our reserve for inventory obsolescence could materially affect our financial results.
Income Taxes
We use the asset and liability method of accounting for income taxes. Under this method, income tax expense is recognized for the amount of taxes payable or refundable for the current year and for deferred tax liabilities and assets for the future tax consequences of events that have been recognized in our financial statements or tax returns. We must make assumptions, judgments and estimates to determine our current provision for income taxes and also our deferred tax assets and liabilities and any valuation allowance to be recorded against a deferred tax asset. Our assumptions, judgments and estimates relative to the current provision for income taxes take into account current tax laws, our interpretation of current tax laws and possible outcomes of current and future audits conducted by foreign and domestic tax authorities. Changes in tax law or our
28
interpretation of tax laws and the resolution of current and future tax audits could significantly impact the amounts provided for income taxes in our consolidated financial statements. Our assumptions, judgments and estimates relative to the amount of deferred income taxes take into account estimates of the amount of future taxable income, and actual operating results in future years could render our current assumptions, judgments and estimates inaccurate. Any of the assumptions, judgments and estimates mentioned above could cause our actual income tax obligations to differ from our estimates.
Share-Based Compensation
As discussed in our consolidated financial statements, we value our employee stock options using the Black-Scholes option valuation model. The Black-Scholes option valuation model uses assumptions of expected volatility, the expected dividend yield of our stock, the expected term of the options and the risk-free interest rate. Since our stock is not publicly traded, the expected volatility is based on an average of the historical volatility of our competitors’ stocks over the expected term of the stock options. The dividend yield assumption is based on our history and expected future of dividend payouts. The expected term of stock options represents the weighted-average period the stock options are expected to remain outstanding. The expected term was calculated using the simplified method permitted under SEC rules and regulations due to the lack of history. The risk-free interest rate assumption is based upon the rate applicable to the U.S. Treasury security with a maturity equal to the expected term of the option on the grant date.
As share-based compensation expense recognized in the Consolidated Statements of Operations is based on awards ultimately expected to vest, it has been reduced for estimated forfeitures. The authoritative accounting pronouncement for share-based compensation expense requires forfeitures to be estimated at the time of grant and revised, if necessary, in subsequent periods if actual forfeitures differ from those estimates. Forfeitures were estimated based on our historical experience.
For the Performance-Based Options, management must assess the probability of the achievement of the earnings before interest and taxes (“EBIT”) targets. If the EBIT targets are not probable of achievement, changes in the recognition of share-based compensation expense may occur. Management makes its probability assessments based on the Company’s actual and projected results of operations.
Management believes that the accounting estimate related to the expense of stock options is a critical accounting estimate because the underlying assumptions can change from time to time and, as a result, the compensation expense that we record in future periods may differ significantly from what we have recorded in the current period with respect to similar instruments.
Fair Value of Financial Assets and Financial Liabilities
In the first quarter of fiscal 2009, the Company adopted the new accounting pronouncement on fair value measurements for financial assets and financial liabilities, which defines fair value, provides guidance for measuring fair value and requires certain disclosures. This accounting pronouncement does not require any new fair value measurements, but rather applies to all other accounting pronouncements that require or permit fair value measurements. It also discusses valuation techniques, such as the market approach (comparable market prices), the income approach (present value of future income or cash flow), and the cost approach (cost to replace the service capacity of an asset or replacement cost). The pronouncement utilizes a fair value hierarchy that prioritizes the inputs to valuation techniques used to measure fair value into three broad levels. The following is a brief description of those three levels:
| • | Level 1—inputs to the valuation methodology are quoted prices (unadjusted) for identical assets or liabilities in active markets |
| • | Level 2—inputs to the valuation methodology include quoted prices for similar assets and liabilities in active markets, and inputs that are observable for the asset or liability, either directly or indirectly, for substantially the full term of the financial instrument |
29
| • | Level 3—inputs to the valuation methodology are unobservable and significant to the fair value measurement |
We disclosed the fair values of our financial instruments in Note 17 to the consolidated financial statements. Management believes that the carrying value of cash and cash equivalents, accounts receivable and accounts payable are representative of their respective fair values. The fair value of the Company’s debt was computed using market quotes, if available, or based on discounted cash flows using market interest rates as of the end of the period. The fair values for interest rate swap agreements, foreign currency forward exchange contracts and natural gas, gasoline and diesel fuel hedge agreements are based on quoted market prices from various banks for similar instruments, adjusted for the Company and the counterparties’ credit risk. The Company performs an independent review of these values to determine if they are reasonable. The fair value of our derivative instruments are impacted by changes in interest rates, foreign exchange rates, and the prices of natural gas, gasoline and diesel fuel. The fair value of our undivided retained interest in trade receivables and common stock subject to repurchase are derived principally from unobservable inputs. Management believes that the accounting estimate related to the fair value of our financial assets and financial liabilities is a critical accounting estimate due to its complexity and the significant judgments and estimates involved in determining fair value in the absence of quoted market prices.
*****
Critical accounting estimates and the related assumptions are evaluated periodically as conditions warrant, and changes to such estimates are recorded as new information or changed conditions require revision.
30
Results of Operations
Consolidated Overview
The following table presents our results of operations for fiscal 2009, fiscal 2008, the Successor period from January 27, 2007 through September 28, 2007 and the Predecessor period from September 30, 2006 through January 26, 2007 (dollars in millions).
| Successor | Predecessor | ||||||||||||||
| Fiscal Year Ended October 2, 2009 |
Fiscal Year Ended October 3, 2008 |
Period from January 27, 2007 through September 28, 2007 |
Period from September 30, 2006 through January 26, 2007 | ||||||||||||
| Sales |
$ | 12,297.9 | $ | 13,470.2 | $ | 8,438.4 | $ | 3,945.9 | |||||||
| Costs and Expenses |
11,860.4 | 12,904.1 | 8,051.8 | 3,877.4 | |||||||||||
| Operating Income |
437.5 | 566.1 | 386.6 | 68.5 | |||||||||||
| Interest and Other Financing Costs, net |
472.3 | 514.7 | 365.9 | 48.7 | |||||||||||
| Income (Loss) Before Income Taxes |
(34.8 | ) | 51.4 | 20.7 | 19.8 | ||||||||||
| Provision (Benefit) for Income Taxes |
(27.9 | ) | 11.9 | 4.6 | 5.0 | ||||||||||
| Net Income (Loss) |
$ | (6.9 | ) | $ | 39.5 | $ | 16.1 | $ | 14.8 | ||||||
Sales for fiscal 2009, fiscal 2008, the Successor period from January 27, 2007 through September 28, 2007 and the Predecessor period from September 30, 2006 through January 26, 2007 were $12,297.9 million, $13,470.2 million, $8,438.4 million and $3,945.9 million, respectively. The fiscal 2009 period was impacted by foreign currency translation, the business decline in certain sectors in our Food and Support Services—North America segment resulting from the economic environment and the continued softness in our uniform direct marketing business. The fiscal 2008 period benefited from base business growth in our Food and Support Services—North America segment, base business growth and net new business in our Food and Support Services—International segment and growth in our uniform rental business. Fiscal 2008 also benefited from the 53rd week, the estimated impact of which was approximately $246.9 million. The 2007 periods benefited from base business growth in our worldwide Food and Support Services business and sales in the Uniform and Career Apparel segment increased due to growth in the uniform rental business partially offset by reduced direct marketing sales, in part due to our decision to exit the healthcare uniform line late in fiscal 2006.
Operating income for fiscal 2009, fiscal 2008, the Successor period from January 27, 2007 through September 28, 2007 and the Predecessor period from September 30, 2006 through January 26, 2007 was $437.5 million, $566.1 million, $386.6 million and $68.5 million, respectively. Depreciation and amortization expense increased significantly in fiscal 2009 and fiscal 2008 compared to the periods in fiscal 2007 as a result of purchase accounting for the Transaction, which resulted in the allocation of approximately $1.7 billion of purchase consideration to amortizable customer relationship intangible assets and fair value adjustments to property and equipment. Depreciation and amortization expense for fiscal 2009, fiscal 2008, the Successor period from January 27, 2007 through September 28, 2007 and the Predecessor period from September 30, 2006 through January 26, 2007 was $503.1 million, $509.1 million, $322.5 million and $116.4 million, respectively. Operating income for fiscal 2009 was impacted by foreign currency translation, the approximately $34.2 million charge related to the repositioning of our Uniform and Career Apparel segment, severance related charges of $19.7 million in our Food and Support Services—North America and International segments, share-based compensation expense of approximately $13.8 million for the modification of the portion of the Performance-Based Options whose vesting was subject to the achievement of the Company’s fiscal 2008 EBIT target and a favorable non-income tax settlement in the U.K. of $8.4 million. Operating income for fiscal 2008 benefited from the 53rd week, the estimated impact of which was approximately $16.2 million, and includes the reversal of share-based compensation expense of approximately $13.3 million during the fourth quarter of fiscal 2008 related to expense previously recognized for Performance-Based Options (see Note 11 to the consolidated
31
financial statements). Operating income for the Successor period from January 27, 2007 through September 28, 2007 includes Transaction-related costs of $5.7 million, a gain of $21.2 million from the sale of our 50% interest in SMG (which generated approximately $7.8 million of income during the period), $2.9 million of insurance proceeds related to Hurricane Katrina, a $3.8 million currency transaction gain and a $4.2 million technology asset impairment charge in the Uniform and Career Apparel segment. Operating income for the Predecessor period from September 30, 2006 through January 26, 2007 includes Transaction-related costs of $112.1 million and $6.8 million of income from SMG.
Interest and other financing costs, net, for fiscal 2009, fiscal 2008 and the Successor period from January 27, 2007 through September 28, 2007 reflect the significant increase in debt levels resulting from the Transaction. The Successor period from January 27, 2007 through September 28, 2007 also includes a charge of $12.8 million for the cost of obtaining a bridge financing facility for the Transaction (see Note 2 to the consolidated financial statements).
The effective income tax rates varied during fiscal 2009, fiscal 2008 and the Successor period from January 27, 2007 through September 28, 2007 due to the more significant rate effect of tax credits and other items on our pretax income (loss) as a result of the Transaction. We anticipate that our effective tax rate may be volatile in future periods.
Net income (loss) for fiscal 2009, fiscal 2008, the Successor period from January 27, 2007 through September 28, 2007 and the Predecessor period from September 30, 2006 through January 26, 2007 was ($6.9) million, $39.5 million, $16.1 million and $14.8 million, respectively, reflecting the significant Transaction-related costs, increased interest expense, increased intangible asset amortization and property and equipment depreciation resulting from the Transaction and the other items described above.
Supplementary Presentation of Results of Operations
We have prepared our supplementary discussion of the results of operations for the fiscal years ended October 2, 2009, October 3, 2008, and September 28, 2007 by comparing the fiscal years ended October 2, 2009 and October 3, 2008 to the mathematical combination of the Successor and Predecessor periods in the fiscal year ended September 28, 2007. Although this presentation does not comply with generally accepted accounting principles in the United States (“U.S. GAAP”), we believe that it provides a meaningful method of comparison because it enables us to compare our consolidated results over equivalent periods of time. The combined operating results have not been prepared as pro forma results under applicable regulations and may not reflect the actual results we would have achieved absent the Transaction and may not be predictive of future results of operations.
The following tables present our sales and operating income, and the related percentages attributable to each operating segment for fiscal years 2009, 2008 and 2007 (dollars in millions).
| Successor | Predecessor | Combined(1) | ||||||||||||||||||||||||
| Sales by Segment |
Fiscal Year Ended October 2, 2009 |
Fiscal Year Ended October 3, 2008 |
Period from January 27, 2007 through September 28, 2007 |
Period from September 30, 2006 through January 26, 2007 |
Fiscal Year Ended September 28, 2007 |
|||||||||||||||||||||
| Food and Support Services—North America |
$ | 8,393.5 | 68 | % | $ | 8,924.9 | 66 | % | $ | 5,759.0 | $ | 2,674.4 | $ | 8,433.4 | 68 | % | ||||||||||
| Food and Support Services—International |
2,326.7 | 19 | % | 2,783.0 | 21 | % | 1,561.5 | 714.6 | 2,276.1 | 18 | % | |||||||||||||||
| Uniform and Career Apparel |
1,577.7 | 13 | % | 1,762.3 | 13 | % | 1,117.9 | 556.9 | 1,674.8 | 14 | % | |||||||||||||||
| $ | 12,297.9 | 100 | % | $ | 13,470.2 | 100 | % | $ | 8,438.4 | $ | 3,945.9 | $ | 12,384.3 | 100 | % | |||||||||||
32
| Successor | Predecessor | Combined(1) | |||||||||||||||||||||||||||||
| Operating Income by Segment |
Fiscal Year Ended October 2, 2009 |
Fiscal Year Ended October 3, 2008 |
Period from January 27, 2007 through September 28, 2007 |
Period from September 30, 2006 through January 26, 2007 |
Fiscal Year Ended September 28, 2007 |
||||||||||||||||||||||||||
| Food and Support Services— North America |
$ | 349.3 | 80 | % | $ | 386.8 | 68 | % | $ | 267.5 | $ | 130.7 | $ | 398.2 | 88 | % | |||||||||||||||
| Food and Support Services—International |
83.4 | 19 | % | 97.2 | 17 | % | 64.7 | 22.6 | 87.3 | 19 | % | ||||||||||||||||||||
| Uniform and Career Apparel |
61.8 | 14 | % | 126.6 | 22 | % | 82.0 | 51.2 | 133.2 | 29 | % | ||||||||||||||||||||
| 494.5 | 113 | % | 610.6 | 107 | % | 414.2 | 204.5 | 618.7 | 136 | % | |||||||||||||||||||||
| Corporate |
(57.0 | ) | -13 | % | (44.5 | ) | -7 | % | (48.8 | ) | (136.0 | ) | (184.8 | ) | -41 | % | |||||||||||||||
| Other Income (Expense) (2) |
— | — | — | — | 21.2 | — | 21.2 | 5 | % | ||||||||||||||||||||||
| $ | 437.5 | 100 | % | $ | 566.1 | 100 | % | $ | 386.6 | $ | 68.5 | $ | 455.1 | 100 | % | ||||||||||||||||
| (1) | Our combined results for the fiscal year ended September 28, 2007 represent the mathematical sum of the Predecessor period from September 30, 2006 through January 26, 2007 and the Successor period from January 27, 2007 through September 28, 2007. This combination does not comply with U.S. GAAP or with the rules for pro forma presentation, but is presented because we believe it provides a meaningful comparison of our results. |
| (2) | In June 2007, the Company recorded a gain of approximately $21.2 million from the sale of its 50% interest in SMG. |
Fiscal 2009 Compared to Fiscal 2008
Consolidated Overview
Sales of $12.3 billion for fiscal 2009 represented a decrease of 9% over the prior year. The decrease is attributable to the impact of foreign currency translation (approximately -4%), the estimated impact of the 53rd week in fiscal 2008 (approximately -2%), declines in our Business & Industry and Sports & Entertainment sectors, which are highly correlated to employment levels and consumer discretionary spending, and the continued softness in our uniform direct marketing business.
Operating income was $437.5 million for fiscal 2009 compared to $566.1 million for the prior year. The decline in operating income in fiscal 2009 was caused by the negative impact of foreign currency translation (approximately -3%), the approximately $34.2 million charge related to the repositioning of our Uniform and Career Apparel segment, severance related charges of approximately $19.7 million in our Food and Support Services—North America and International segments, increased share-based compensation expense of approximately $13.6 million primarily due to the modification of the portion of the Performance-Based Options whose vesting was subject to the achievement of the Company’s fiscal 2008 EBIT target (see Note 11 to the consolidated financial statements) and the 53rd week in fiscal 2008, the estimated impact of which was approximately $16.2 million, that more than offset the $8.4 million favorable non-income tax settlement in the U.K.
Interest and other financing costs, net, for fiscal 2009 decreased approximately $42.4 million from the prior year primarily due to lower interest rates, foreign currency translation and the estimated impact of the 53rd week in fiscal 2008. The effective tax rate for fiscal 2009 was 80.1% compared to 23.3% in the prior year. The higher effective tax rate in fiscal 2009 principally relates to benefiting current year losses coupled with the effect of tax credits and other items.
The net loss for fiscal 2009 was $6.9 million compared to net income of $39.5 million in the prior year.
33
Segment Results
The following tables present a 2009/2008 comparison of segment sales and operating income together with the amount of and percentage change between periods (dollars in millions).
| Sales by Segment |
Fiscal Year Ended October 2, 2009 |
Fiscal Year Ended October 3, 2008 |
$ | % | |||||||||
| Food and Support Services—North America |
$ | 8,393.5 | $ | 8,924.9 | $ | (531.4 | ) | -6 | % | ||||
| Food and Support Services—International |
2,326.7 | 2,783.0 | (456.3 | ) | -16 | % | |||||||
| Uniform and Career Apparel |
1,577.7 | 1,762.3 | (184.6 | ) | -10 | % | |||||||
| $ | 12,297.9 | $ | 13,470.2 | $ | (1,172.3 | ) | -9 | % | |||||
| Operating Income by Segment |
Fiscal Year Ended October 2, 2009 |
Fiscal Year Ended October 3, 2008 |
$ | % | |||||||||||
| Food and Support Services—North America |
$ | 349.3 | $ | 386.8 | $ | (37.5 | ) | -10 | % | ||||||
| Food and Support Services—International |
83.4 | 97.2 | (13.8 | ) | -14 | % | |||||||||
| Uniform and Career Apparel |
61.8 | 126.6 | (64.8 | ) | -51 | % | |||||||||
| Corporate |
(57.0 | ) | (44.5 | ) | (12.5 | ) | 28 | % | |||||||
| $ | 437.5 | $ | 566.1 | $ | (128.6 | ) | -23 | % | |||||||
Food and Support Services—North America Segment
Food and Support Services—North America segment sales for fiscal 2009 decreased 6% compared to the prior year, primarily due to the estimated impact of the 53rd week in fiscal 2008 (approximately -2%), foreign currency translation (approximately -1%) and the declines in the Business & Industry and Sports & Entertainment sectors of our business. The Business & Industry sector had a low-double digit sales decline compared to the prior year, resulting from a decline in Business food services and Refreshment Services due to lower populations at client locations, reduced consumer discretionary spending across our account portfolio and the estimated impact of the 53rd week in fiscal 2008. The Education sector had low-single digit sales decline compared to the prior year, with base business growth in our Higher Education food and facilities businesses being more than offset by the impact of the 53rd week in fiscal 2008 and lost business in K-12. In our Healthcare sector, we realized a low-single digit sales decline compared to the prior year, with base business growth in both our facility services and Canada business offset by the impact of the 53rd week in fiscal 2008. Our Sports & Entertainment sector had a low-double digit sales decline compared to the prior year, reflecting the estimated impact of the 53rd week in fiscal 2008 and lower average attendance and spending at Major League Baseball games and at our Parks locations, as well as continued weakness in our Convention Centers business.
Operating income in the Food and Support Services—North America segment was $349.3 million in fiscal 2009 compared to $386.8 million in the prior year, with increased profit performance in the Higher Education, Healthcare and Corrections sectors being more than offset by the estimated impact of the 53rd week in fiscal 2008 (approximately -3%), severance related expenses of $11.5 million, the negative effect of currency translation related to the Canadian dollar (approximately -2%) and declines in the Business & Industry and Sports & Entertainment sectors.
Food and Support Services—International Segment
Sales in the Food and Support Services—International segment for fiscal 2009 decreased 16% over the prior year as a result of foreign currency translation (approximately -14%), the estimated impact of the 53rd week in fiscal 2008 (approximately -1%) and sales in the prior year related to the Beijing Olympics (approximately -3%).
34
Sales in fiscal 2009 benefited from new business growth in Chile and China offset by lower populations and reduced discretionary spending across our Business & Industry sector accounts in many of our country operations.
Operating income in the Food and Support Services—International segment for fiscal 2009 was $83.4 million, down 14% compared to the prior year, as currency translation (approximately -12%), severance related expenses of $8.2 million and the estimated impact of the 53rd week in fiscal 2008 (approximately -4%) offset by profit growth in Chile, Germany, China and Japan and a favorable non-income tax settlement in the U.K. of $8.4 million.
Uniform and Career Apparel Segment
In the Uniform and Career Apparel segment, fiscal 2009 sales of $1.6 billion were down 10% from the prior year, as our uniform rental business experienced a 6% sales decline and our direct marketing business declined 24%. The sales decline in our uniform rental business results from our clients continuing to reduce employee headcounts and spending across many of our client service locations. Sales in our direct marketing business declined as our clients continue to defer or delay their spending.
Operating income for fiscal 2009 was $61.8 million compared to $126.6 million in fiscal 2008. During the second quarter of fiscal 2009, the Company initiated a repositioning effort to reduce the cost structure and address the demand softness in the WearGuard direct marketing business. The Company will be exiting a portion of its direct marketing business by the second quarter of fiscal 2010 and migrating its distribution and customization functions from its facilities in Norwell, Massachusetts to its facilities in Salem, Virginia and Reno, Nevada. In addition, the Company has been reducing its headcount in all of the businesses in this segment. As a result of these actions, the Company recorded a total charge of approximately $34.2 million during the second quarter of fiscal 2009 related to severance and other related costs, inventory write-downs and other asset write-downs. The Company expects to incur additional costs of approximately $1.1 million in association with these repositioning efforts over the next two fiscal quarters as the relocation of the WearGuard distribution and operations functions are completed. Operating income was also negatively impacted by the decline in sales in both the uniform rental and direct marketing businesses, with the direct marketing businesses generating losses for the year.
Corporate
Corporate expenses, those administrative expenses not allocated to the business segments, were $57.0 million for fiscal 2009, compared to $44.5 million for the prior year period. The increase is mainly due to increased share-based compensation expense of approximately $13.6 million primarily due to the modification of the portion of the Performance-Based Options whose vesting was subject to the achievement of the Company’s fiscal 2008 EBIT target (see Note 11 to the consolidated financial statements).
Fiscal 2008 Compared to Fiscal 2007
Consolidated Overview
Sales of $13.5 billion for fiscal 2008 represented an increase of 9% over the prior year. This increase includes the impact of acquisitions and divestitures (less than 1%), foreign currency translation (approximately 2%), conforming the fiscal reporting period of a subsidiary to that of the Company in fiscal 2007 (less than 1%) and the estimated impact of the 53 rd week in fiscal 2008 (approximately 2%). The 9% sales increase was driven by a 6% increase in sales in the Food and Support Services—North America segment, a 22% increase in sales in the Food and Support Services—International segment and a 5% increase in sales in the Uniform and Career Apparel segment.
Operating income was $566.1 million for fiscal 2008 compared to $455.1 million for the prior year. Fiscal 2008 benefited from the 53rd week, the estimated impact of which was approximately $16.2 million, and includes
35
the reversal of share-based compensation expense of approximately $13.3 million during the fourth quarter of fiscal 2008 related to expense previously recognized for Performance-Based Options (see Note 11 to the consolidated financial statements). Fiscal 2007 includes Transaction-related costs of $117.8 million, a gain of $21.2 million from the sale of our 50% interest in SMG (which generated approximately $14.6 million of income in fiscal 2007), $2.9 million of insurance proceeds related to Hurricane Katrina, a $3.8 million currency transaction gain and a $4.2 million technology asset impairment charge in the Uniform and Career Apparel segment. Operating income in fiscal 2008 was negatively impacted by the increase in depreciation and amortization expense, which was $509.1 million in fiscal 2008 compared to $438.9 million in the prior year. Depreciation and amortization expense increased significantly in fiscal 2008 compared to fiscal 2007 as a result of purchase accounting for the Transaction, which resulted in the allocation of approximately $1.7 billion of purchase consideration to amortizable customer relationship intangible assets and fair value adjustments to property and equipment.
Interest and other financing costs, net, for fiscal 2008 increased approximately $100.1 million from the prior year due to the significant increase in debt levels resulting from the Transaction. In addition, fiscal 2007 includes a charge of $12.8 million for the cost of obtaining a bridge financing facility for the Transaction.
The effective income tax rate for fiscal 2008 was 23.3% compared to 23.9% in the prior year. We anticipate that our effective tax rate may be volatile in future periods due to the effect that tax credits and other items have on our reduced pretax income as a result of the Transaction.
Net income for fiscal 2008 was $39.5 million compared to $30.9 million in the prior year, also reflecting the significant Transaction-related costs in fiscal 2007, increased interest expense in fiscal 2008, increased intangible asset amortization and property and equipment depreciation resulting from the Transaction, reduced share-based payment expense in fiscal 2008 and the divestiture of our 50% interest in SMG in the third quarter of fiscal 2007, including the $21.2 million gain from the sale.
Segment Results
The following tables present a 2008/2007 comparison of segment sales and operating income together with the amount of and percentage change between periods (dollars in millions).
| Successor | Predecessor | Combined(1) | Change | |||||||||||||||||
| Sales by Segment |
Fiscal Year Ended October 3, 2008 |
Period from January 27, 2007 through September 28, 2007 |
Period from September 30, 2006 through January 26, 2007 |
Fiscal Year Ended September 28, 2007 |
$ | % | ||||||||||||||
| Food and Support Services—North America |
$ | 8,924.9 | $ | 5,759.0 | $ | 2,674.4 | $ | 8,433.4 | $ | 491.5 | 6 | % | ||||||||
| Food and Support Services—International |
2,783.0 | 1,561.5 | 714.6 | 2,276.1 | 506.9 | 22 | % | |||||||||||||
| Uniform and Career Apparel |
1,762.3 | 1,117.9 | 556.9 | 1,674.8 | 87.5 | 5 | % | |||||||||||||
| $ | 13,470.2 | $ | 8,438.4 | $ | 3,945.9 | $ | 12,384.3 | $ | 1,085.9 | 9 | % | |||||||||
36
| Successor | Predecessor | Combined(1) | Change | ||||||||||||||||||||||
| Operating Income by Segment |
Fiscal Year Ended October 3, 2008 |
Period from January 27, 2007 through September 28, 2007 |
Period from September 30, 2006 through January 26, 2007 |
Fiscal Year Ended September 28, 2007 |
$ | % | |||||||||||||||||||
| Food and Support Services— North America |
$ | 386.8 | $ | 267.5 | $ | 130.7 | $ | 398.2 | $ | (11.4 | ) | -3 | % | ||||||||||||
| Food and Support Services—International |
97.2 | 64.7 | 22.6 | 87.3 | 9.9 | 11 | % | ||||||||||||||||||
| Uniform and Career Apparel |
126.6 | 82.0 | 51.2 | 133.2 | (6.6 | ) | -5 | % | |||||||||||||||||
| Corporate |
(44.5 | ) | (48.8 | ) | (136.0 | ) | (184.8 | ) | 140.3 | n/m | (2) | ||||||||||||||
| Other Income (Expense) (3) |
— | 21.2 | — | 21.2 | (21.2 | ) | n/m | (2) | |||||||||||||||||
| $ | 566.1 | $ | 386.6 | $ | 68.5 | $ | 455.1 | $ | 111.0 | 24 | % | ||||||||||||||
| (1) | Our combined results for the fiscal year ended September 28, 2007 represent the mathematical sum of the Predecessor period from September 30, 2006 through January 26, 2007 and the Successor period from January 27, 2007 through September 28, 2007. This combination does not comply with U.S. GAAP or with the rules for pro forma presentation, but is presented because we believe it provides a meaningful comparison of our results. |
| (2) | Not meaningful |
| (3) | In June 2007, the Company recorded a gain of approximately $21.2 million from the sale of its 50% interest in SMG. |
Food and Support Services—North America Segment
Food and Support Services—North America segment sales for fiscal 2008 increased 6% over the prior year due principally to base business growth in the Higher Education, Healthcare and Sports & Entertainment businesses and the estimated impact of the 53rd week in fiscal 2008. This increase includes the impact of acquisitions (less than 1%), foreign currency translation (approximately 1%) and the estimated impact of the 53rd week in fiscal 2008 (approximately 2%). Our Business & Industry sector had mid-single digit sales growth compared to the prior year, with the 53rd week in fiscal 2008 contributing about half the growth. Net new business in Refreshment Services was somewhat offset by softness in Business Services. The Education sector had high-single digit sales growth compared to the prior year, with the 53rd week in fiscal 2008 contributing about 3% of the growth. Base business growth in our Higher Education food and facilities business was offset somewhat by a sales decline in K-12 primarily due to lost business. In our Healthcare sector, we realized high-single digit sales growth compared to the prior year, with the 53rd week in fiscal 2008 contributing about 2% of the growth. The sales growth was driven primarily by base business growth in both facility services and our Canadian healthcare business. Our Sports and Entertainment sector had mid-single digit sales growth compared to the prior year, with the 53rd week in fiscal 2008 contributing about 2% of the growth. The sales growth was led by base business growth in Stadiums & Arenas offset by softness in Convention Centers, especially in the fourth quarter.
Operating income in the Food and Support Services—North America segment was $386.8 million in fiscal 2008 compared to $398.2 million in fiscal 2007, as profit performance in the Education, Business & Industry and Healthcare sectors and the positive impact of the 53rd week in fiscal 2008 was more than offset by profit declines in the Convention Centers and Corrections businesses, the divestiture of SMG in 2007 (which contributed approximately $14.6 million of income in fiscal 2007) and the increase in depreciation and amortization expense due to the application of purchase accounting for the Transaction, which was $329.0 million in fiscal 2008 compared to $283.3 million is fiscal 2007.
37
Food and Support Services—International Segment
Food and Support Services—International segment sales for fiscal 2008 increased 22% over the prior year due to net new business (approximately 10%), base business growth (approximately 5%) and foreign currency translation (approximately 8%) offset by the conforming of the fiscal reporting period of a subsidiary to that of the Company in fiscal 2007 (approximately -1%). The 53rd week in fiscal 2008 contributed approximately 1% of the combined growth for net new and base business. Sales growth in the U.K., Chile and China, which benefited from the 2008 Summer Olympics held in Beijing, drove the increase, along with contributions from a number of other countries.
Operating income in the Food and Support Services—International segment was $97.2 million in fiscal 2008 compared to $87.3 million in fiscal 2007, as profit performance in the U.K., Germany and Chile and the positive impact of the 53rd week in fiscal 2008 was offset by the increase in depreciation and amortization expense due to the application of purchase accounting for the Transaction, which was $61.4 million in fiscal 2008 compared to $51.9 million in fiscal 2007.
Uniform and Career Apparel Segment
Uniform and Career Apparel segment sales increased 5% compared to the prior year, driven by an 8% growth in the rental business. Organic sales growth, which excludes the effects of acquisitions and the estimated impact of the 53rd week, was 2%, led by a 5% organic growth rate for the rental business primarily due to price increases. Segment sales growth for fiscal 2008 was negatively impacted by continued softness in demand across several of WearGuard’s sales channels.
Operating income in the Uniform and Career Apparel segment was $126.6 million in fiscal 2008 compared to $133.2 million in fiscal 2007. Our rental business experienced positive operating performance despite the negative impact of fuel cost increases. However, the positive performance, in addition to the estimated impact of the 53rd week in fiscal 2008 and the effect of the $4.2 million technology asset impairment charge in fiscal 2007, were more than offset by losses in our direct marketing operations and the increase in depreciation and amortization expense due to the application of purchase accounting for the Transaction, which was $118.1 million in fiscal 2008 compared to $102.2 million is fiscal 2007.
Corporate
Corporate expenses, those administrative expenses not allocated to the business segments, were $44.5 million in fiscal 2008 compared to $184.8 million in fiscal 2007. The decrease from 2007 is due to a reduction in share-based compensation expense and the costs related to the Transaction recognized in 2007. Share-based compensation expense was $11.8 million in fiscal 2008, down from $111.6 million in fiscal 2007. The decrease was primarily due to the charge of approximately $77.1 million in fiscal 2007 related to the accelerated vesting and buyout of employee stock options and restricted stock units in connection with the Transaction and the reversal of approximately $13.3 million of share-based compensation expense during the fourth quarter of fiscal 2008 related to expense previously recognized for the Performance-Based Options. The other costs related to the Transaction recognized in fiscal 2007 included $16.9 million of accounting, investment banking, legal and other costs associated with the Transaction and a charge of approximately $23.8 million related to change in control payments to certain executives.
Other Income (Expense)
In June 2007, the Company recorded a gain of approximately $21.2 million from the sale of its 50% interest in SMG (see Note 3 to the consolidated financial statements).
38
Outlook
We anticipate that the current economic environment, including reduced consumer and client spending, reduced headcount at our clients, an increase in bankruptcies and companies going out of business and the variability of food and fuel costs, will likely continue to have an impact on our operations, particularly at our business, sports and entertainment and uniform client locations. In response to the lower levels of demand across our more economically sensitive food and facility services businesses, our teams will continue to pursue both revenue enhancements and appropriate cost controls. Our uniform team is focused on managing the business through this environment with a particular focus on appropriately reducing the cost structure, while maintaining high levels of customer service and continued efforts to acquire new customers. The repositioning of our WearGuard direct marketing business should enable us to operate more efficiently while allowing us to continue to provide our uniform customers with a broad set of both rental and direct sale options. Finally, as we experienced during fiscal 2009, to the extent the U.S. dollar fluctuates against other currencies, it could continue to affect the reported results for our international operations.
Liquidity and Capital Resources
Reference to the Consolidated Statements of Cash Flows will facilitate understanding of the discussion that follows.
Cash provided by operating activities in fiscal 2009 was $707.2 million compared to $494.2 million in fiscal 2008. The principal components (in millions) of the net change of $213.0 million were:
| • Decrease in the total of net income (loss) and noncash charges |
$ | (88.6 | ) | |
| • Decrease in accounts receivable sale proceeds |
(31.6 | ) | ||
| • Reduced working capital requirements |
290.4 | |||
| • Other, net |
42.8 | |||
| $ | 213.0 | |||
The decrease in the total of net income (loss) and noncash charges results mainly from the lower operating results of the Company, as discussed above, and deferred income taxes (see Note 9 to the consolidated financial statements). The accounts receivable proceeds decreased primarily due to the decline in eligible receivables. The change in working capital requirements relates principally to changes in Accounts Receivable (approximately $256.6 million), primarily due to lower days sales outstanding and lower sales in fiscal 2009, Inventory (approximately $84.1 million), primarily due to the Company-wide inventory reduction efforts and increased inventory reserves and write-downs, and Accrued Expenses (approximately $18.9 million), primarily due to the increase in self-insurance reserves, offset by Accounts Payable (approximately $84.7 million) due to timing of disbursements and lower operating results. The other increases in cash were primarily due to $24.2 million of cash distributions received from our 50% ownership interest in AIM Services Co., Ltd. and increases in certain noncurrent liabilities (retirement plans and self-insurance).
While the global capital markets have experienced adverse conditions, management continues to believe that the Company’s cash and cash equivalents, cash flows provided by operating activities and the unused committed credit availability under our senior secured revolving credit facility (approximately $517.8 million and $581.0 million at November 27, 2009 and October 2, 2009, respectively) will be adequate to meet anticipated cash requirements to fund working capital, capital spending, debt repayments and other cash needs. While we believe we enjoy a strong liquidity position overall, the Company will continue to seek to invest strategically but prudently in certain sectors and geographies. Over time, the Company has repositioned its service portfolio so that today a significant portion of the Food and Support Services operating income in North America comes from sectors such as education, healthcare and corrections, which we believe to be economically less sensitive. In addition, we have worked to further diversify our international business by geography and sector. The Company is closely monitoring its cash flow as well as the condition of the capital markets and cannot predict with any certainty the impact further disruption in these markets may have on the Company.
39
As of October 2, 2009, there was approximately $430.8 million outstanding in foreign currency borrowings. The Company entered into $500 million of interest rate swap agreements during fiscal 2009, which will be effective beginning in fiscal 2010. These swaps have been designated as cash flow hedging instruments and fix the rate on a like amount of variable rate term loan borrowings and floating rate notes.
During fiscal 2009, the Company paid approximately $26.7 million for the acquisition of the remaining 20% of its Chilean subsidiary and the Company paid $85.0 million as additional consideration related to the fiscal 2006 acquisition of an online catering company per the terms of the acquisition agreement. The Company also acquired a refreshment services business and several regional uniform rental companies. Subsequent to October 2, 2009, the Company completed the acquisition of the facilities management and property management businesses of Veris Plc, an Irish company, for consideration of approximately $75 million in cash.
The Transaction
In connection with the completion of the Transaction on January 26, 2007, the Company (i) entered into a new $4.15 billion senior secured term loan facility, (ii) issued $1.28 billion of 8.50% senior notes due 2015 and $500 million of senior floating rate notes due 2015, (iii) entered into a new $600 million senior secured revolving credit facility with a six-year maturity, and (iv) entered into a new synthetic letter of credit facility for up to $250 million (which was reduced to $200 million in January 2008).
Senior Secured Credit Facilities
The senior secured revolving credit facility consists of the following subfacilities:
| • | A revolving credit facility available for loans in U.S. dollars to the Company with aggregate commitments of $435 million; |
| • | A revolving credit facility available for loans in sterling or U.S. dollars to the Company or a U.K. subsidiary with aggregate commitments of $40 million; |
| • | A revolving credit facility available for loans in Euros or U.S. dollars to the Company or an Irish subsidiary with aggregate commitments of $20 million; |
| • | A revolving credit facility available for loans in Euros or U.S. dollars to the Company or German subsidiaries with aggregate commitments of $30 million; and |
| • | A revolving credit facility available for loans in Canadian dollars or U.S. dollars to the Company or a Canadian subsidiary with aggregate commitments of $75 million. |
The senior secured term loan facility consists of the following subfacilities:
| • | A U.S. dollar denominated term loan to the Company in the amount of $3,547 million ($3,048.1 million as of October 2, 2009); |
| • | A yen denominated term loan to the Company in the amount of ¥5,422 million (¥5,273.0 million as of October 2, 2009); |
| • | A U.S. dollar denominated term loan to a Canadian subsidiary in the amount of $170 million ($165.3 million as of October 2, 2009); |
| • | A Euro denominated term loan to an Irish subsidiary in an amount of €44 million (€42.8 million as of October 2, 2009); |
| • | A sterling denominated term loan to a U.K. subsidiary in an amount of £122 million (£118.6 million as of October 2, 2009); and |
| • | A Euro denominated term loan to German subsidiaries in the amount of €70 million (€68.1 million as of October 2, 2009). |
40
The senior secured credit facilities provide that the Company has the right at any time to request up to $750 million of incremental commitments in the aggregate under one or more incremental term loan facilities and/or synthetic letter of credit facilities and/or revolving credit facilities and/or by increasing commitments under the revolving credit facility. The Company’s ability to obtain extensions of credit under these incremental facilities or commitments will be subject to the same conditions as extensions of credit under the existing credit facilities. However, the lenders under these facilities will not be under any obligation to provide any such incremental facilities or commitments, and any such addition of or increase in facilities or commitments will be subject to pro forma compliance with an incurrence-based financial covenant and customary conditions precedent.
Borrowings under the senior secured credit facilities bear interest at a rate equal to an applicable margin plus, at the Company’s option, either (a) a LIBOR rate determined by reference to the costs of funds for deposits in the currency of such borrowing for the interest period relevant to such borrowing adjusted for certain additional costs, (b) with respect to borrowings denominated in U.S. Dollars, a base rate determined by reference to the higher of (1) the prime rate of the administrative agent, and (2) the federal funds rate plus 0.50% or (c) with respect to borrowings denominated in Canadian dollars, (1) a base rate determined by reference to the prime rate of Canadian banks or (2) a BA (bankers’ acceptance) rate determined by reference to the rate offered for bankers’ acceptances in Canadian dollars for the interest period relevant to such borrowing.
The applicable margin spread for borrowings under the revolving credit facility are 1.25% to 2.00% (as of October 2, 2009—2.00%) with respect to LIBOR borrowings and 0.25% to 1.00% (as of October 2, 2009—1.00%) with respect to base-rate borrowings.
Prior to April 16, 2007, the applicable margin spreads for borrowings under the term loan facilities were 2.00% to 2.125% with respect to LIBOR borrowings and 1.00% to 1.125% with respect to base-rate borrowings. On March 28, 2007, the Company amended the senior secured credit agreement (i) to lower the interest rate spread on the U.S. dollar and Euro term loans, (ii) to reduce the fees that it pays on the synthetic letter of credit facility, (iii) to add a provision requiring payment of a prepayment fee upon certain repayments for the purpose of reducing the interest rate spread effected within one year of the date of the amendment and (iv) to make certain other modifications set forth in the amendment. Effective on April 16, 2007, the applicable margin spreads under the U.S. dollar and Euro term loan facilities and the synthetic letter of credit facilities are 1.875% to 2.125% (as of October 2, 2009—1.875%) with respect to LIBOR borrowings and 0.875% to 1.125% (as of October 2, 2009—0.875%) with respect to base-rate borrowings. The applicable margin spreads under the yen and sterling term loan facilities are 2.00% to 2.125% (as of October 2, 2009—2.125%) with respect to LIBOR borrowings and 1.00% to 1.125% (as of October 2, 2009—1.125%) with respect to base-rate borrowings.
In addition to paying interest on outstanding principal under the senior secured credit facilities, the Company is required to pay a commitment fee to the lenders under the revolving credit facility in respect of the unutilized commitments thereunder. The commitment fee rate ranges from 0.375% to 0.50% per annum (as of October 2, 2009—0.50%).
Prior to April 16, 2007, fees on the $200 million synthetic letter of credit facility ranged from 2.00% to 2.125%. Effective on April 16, 2007, fees on the synthetic letter of credit facilities are 1.875% to 2.125% (as of October 2, 2009—1.875%).
The actual spreads within all ranges referred to above are based on a ratio of Consolidated Secured Debt to EBITDA, each as defined in the senior secured credit agreement.
All obligations under the senior secured credit facilities are secured by a security interest in substantially all assets of the Company and its U.S. subsidiaries.
The senior secured credit facilities require the Company to prepay outstanding term loans, subject to certain exceptions, with (i) 50% of the Company’s Excess Cash Flow (as defined in the senior secured credit agreement)
41
commencing with fiscal year 2008, (ii) 100% of the net cash proceeds of all nonordinary course asset sales or other dispositions of property subject to certain exceptions and customary reinvestment rights, and (iii) 100% of the net cash proceeds of any incurrence of debt, including debt incurred by any business securitization subsidiary in respect of any business securitization facility, but excluding proceeds from the Company’s receivables facilities and other debt permitted under the senior secured credit agreement. Any mandatory prepayments would be applied to the term loan facilities as directed by the Company. The Company may voluntarily repay outstanding loans under the senior secured credit facilities at any time without premium or penalty, other than customary “breakage” costs with respect to LIBOR loans. Prepaid term loans may not be reborrowed. In fiscal 2009, the Company prepaid outstanding term loan of $100.0 million based on 50% of the Company’s Excess Cash Flow (as defined in the senior secured credit agreement).
The Company is required to repay the senior secured term loan facilities in quarterly principal amounts of 0.25% of the funded total principal amount for the first six years and nine months, with the remaining amount payable on January 26, 2014. On March 30, 2007, June 29, 2007 and September 28, 2007, the Company voluntarily prepaid an additional $40.0 million, $300.0 million and $50.0 million, respectively. All required quarterly principal amounts of the U.S. term loan have been paid through its maturity in January 2014.
Principal amounts outstanding under the revolving credit facility are due and payable in full at maturity, January 26, 2013, on which day the commitments thereunder will terminate.
Principal amounts outstanding under the synthetic letter of credit facility are due and payable in full at maturity, January 26, 2014, on which day the commitments thereunder will terminate.
8.50% Senior Notes due 2015 and Senior Floating Rate Notes due 2015
The senior floating rate notes due 2015 bear interest equal to three-month LIBOR (as defined in the indenture) plus a spread of 3.50%.
The 8.50% senior notes due 2015 and senior floating rate notes due 2015 are senior unsecured obligations of the Company.
The Company may redeem some or all of the 8.50% senior notes due 2015 at any time on or after February 1, 2011 and some or all of the senior floating rate notes due 2015 at any time, in each case at varying redemption prices that are stated in the indenture and generally include premiums. Prior to February 1, 2011, the Company may redeem some or all of the 8.50% senior notes due 2015 at a price equal to 100% of the principal amount of the notes redeemed plus the applicable “make-whole” premium as defined in the indenture. At any time before February 1, 2010, the Company may also redeem up to 35% of the 8.50% senior notes due 2015 at a redemption price equal to 108.5% of the principal amount using the proceeds of certain equity offerings.
If the Company experiences specific kinds of “changes in control,” it will be required to make an offer to purchase the 8.50% senior notes due 2015 and senior floating rate notes due 2015 at a purchase price of 101% of the principal amount thereof, plus accrued and unpaid interest to the purchase date. If the Company sells assets under certain circumstances, it will be required to make an offer to purchase the 8.50% senior notes due 2015 and senior floating rate notes due 2015 at a purchase price of 100% of the principal amount thereof, plus accrued and unpaid interest to the purchase date.
5.00% Senior Notes due 2012
During the third quarter of fiscal 2005, ARAMARK Services, Inc. issued $250 million of 5.00% senior unsecured notes due 2012. The notes are recorded at $237.0 million as of October 2, 2009 as a result of the fair value accounting adjustments made in connection with the Transaction. The discount of $13.0 million will be accreted as interest expense over the remaining period to maturity.
42
Repayment of Indebtedness
With a portion of the proceeds of the new borrowings and the equity contributions in connection with the Transaction, the Company repaid the outstanding balances of its senior unsecured revolving credit facility, senior European unsecured revolving credit facility, bank term loan due March 2007, Japanese borrowings due March 2007, 6.375% senior notes due 2008, 7.00% senior notes due 2007, 7.25% senior notes and debentures due 2007 and certain other obligations. In connection with the repayment of the 6.375% senior notes due 2008 and 7.00% senior notes due 2007, the Company incurred prepayment penalties of approximately $2.4 million and $0.8 million, respectively, which were included in the purchase price of the Transaction.
Covenant Compliance
The senior secured credit agreement contains a number of covenants that, among other things, restrict our ability to: incur additional indebtedness; issue preferred stock or provide guarantees; create liens on assets; engage in mergers or consolidations; sell assets; pay dividends, make distributions or repurchase our capital stock; make investments, loans or advances; repay or repurchase any notes, except as scheduled or at maturity; create restrictions on the payment of dividends or other amounts to us from our restricted subsidiaries; make certain acquisitions; engage in certain transactions with affiliates; amend material agreements governing the notes (or any indebtedness that refinances the notes); and fundamentally change the Company’s business. The indenture governing the 8.50% senior notes due 2015 and the senior floating rate notes due 2015 contains similar provisions. As of October 2, 2009, we are in compliance with these covenants.
Under the senior secured credit agreement and the indenture governing the 8.50% senior notes due 2015 and the senior floating rate notes due 2015, we are required to satisfy and maintain specified financial ratios and other financial condition tests and covenants. Our continued ability to meet those financial ratios, tests and covenants can be affected by events beyond our control, and we cannot assure you that we will meet those ratios, tests and covenants.
EBITDA is defined for purposes of these covenants as income (loss) from continuing operations before cumulative effect of change in accounting principle plus interest and other financing costs, net, provision for income taxes, and depreciation and amortization. Adjusted EBITDA is defined for purposes of these covenants as EBITDA, further adjusted to give effect to adjustments required in calculating covenant ratios and compliance under our senior secured credit agreement and the indenture. EBITDA and Adjusted EBITDA are not presentations made in accordance with U.S. GAAP, are not measures of financial performance or condition, liquidity or profitability, and should not be considered as an alternative to (1) net income, operating income or any other performance measures determined in accordance with U.S. GAAP or (2) operating cash flows determined in accordance with U.S. GAAP. Additionally, EBITDA and Adjusted EBITDA are not intended to be measures of free cash flow for management’s discretionary use, as they do not consider certain cash requirements such as interest payments, tax payments and debt service requirements.
Our presentation of EBITDA has limitations as an analytical tool, and should not be considered in isolation or as a substitute for analysis of our results as reported under U.S. GAAP. Because not all companies use identical calculations, these presentations of EBITDA and Adjusted EBITDA may not be comparable to other similarly titled measures of other companies. We believe that the presentation of EBITDA and Adjusted EBITDA is appropriate to provide additional information about the calculation of certain financial covenants in the senior secured credit agreement and the indenture. Adjusted EBITDA is a material component of these covenants. For instance, our senior secured credit agreement and the indenture contain financial ratios that are calculated by reference to Adjusted EBITDA. Non-compliance with the maximum Consolidated Secured Debt Ratio contained in our senior secured credit agreement could result in the requirement to immediately repay all amounts outstanding under such agreement, while non-compliance with the Interest Coverage Ratio contained in our senior secured credit agreement and the Fixed Charge Coverage Ratio contained in the indenture could prohibit us from being able to incur additional indebtedness, other than the additional funding provided for under the senior secured credit agreement and pursuant to specified exceptions, and make certain restricted payments.
43
The following is a reconciliation of income (loss), which is a U.S. GAAP measure of our operating results, to Adjusted EBITDA as defined in our debt agreements. The terms and related calculations are defined in the senior secured credit agreement and indenture.
| (dollars in millions) |
Three Months Ended October 2, 2009 |
Three Months Ended July 3, 2009 |
Three Months Ended April 3, 2009 |
Three Months Ended January 2, 2009 |
Twelve Months Ended October 2, 2009 |
||||||||||||||
| Net income (loss) |
$ | 16.5 | $ | (6.2 | ) | $ | (25.4 | ) | $ | 8.2 | $ | (6.9 | ) | ||||||
| Interest and other financing costs, net |
108.5 | 119.4 | 119.2 | 125.2 | 472.3 | ||||||||||||||
| Provision (benefit) for income taxes |
6.1 | (13.7 | ) | (22.4 | ) | 2.2 | (27.8 | ) | |||||||||||
| Depreciation and amortization |
127.6 | 128.0 | 123.6 | 124.0 | 503.2 | ||||||||||||||
| EBITDA |
258.7 | 227.5 | 195.0 | 259.6 | 940.8 | ||||||||||||||
| Share-based compensation expense (1) |
3.0 | 3.0 | 9.6 | 9.8 | 25.4 | ||||||||||||||
| Unusual or non-recurring losses (2) |
— | 0.2 | 34.2 | — | 34.4 | ||||||||||||||
| Pro forma EBITDA for equity method investees (3) |
2.4 | 4.0 | 8.0 | 6.0 | 20.4 | ||||||||||||||
| Pro forma EBITDA for certain transactions (4) |
— | — | — | 0.4 | 0.4 | ||||||||||||||
| Other (5) |
10.0 | — | 3.7 | (0.4 | ) | 13.3 | |||||||||||||
| Adjusted EBITDA |
$ | 274.1 | $ | 234.7 | $ | 250.5 | $ | 275.4 | $ | 1,034.7 | |||||||||
| (1) | Represents share-based compensation expense resulting from the application of accounting for stock options and deferred stock unit awards (see Note 11 to the consolidated financial statements). |
| (2) | Represents charges for the repositioning of the Uniform and Career Apparel segment (see Note 13 to the consolidated financial statements). |
| (3) | Represents our estimated share of EBITDA from our AIM Services Co., Ltd. equity method investment not already reflected in our EBITDA. EBITDA for this equity method investee is calculated in a manner consistent with consolidated EBITDA but does not represent cash distributions received from this investee. |
| (4) | Represents the annualizing of estimated EBITDA from acquisitions made during the period. |
| (5) | Other includes certain other miscellaneous items (the three months ended October 2, 2009 and the three months ended April 3, 2009 include approximately $10.3 million and $3.7 million, respectively, of severance and other related costs incurred in the Food and Support Services— North American and Food and Support Services— International segments). |
Our covenant requirements and actual ratios for the twelve months ended October 2, 2009 are as follows:
| Covenant Requirements |
Actual Ratios |
|||||
| Maximum Consolidated Secured Debt Ratio (1) |
5.25 | x | 3.72 | x | ||
| Interest Coverage Ratio (Fixed Charge Coverage Ratio) (2) |
2.00 | x | 2.24 | x |
| (1) | Beginning with the twelve months ended June 29, 2007, our senior secured credit agreement requires us to maintain a maximum Consolidated Secured Debt Ratio, defined as consolidated total indebtedness secured by a lien to Adjusted EBITDA, of 5.875x, being reduced over time to 4.25x by the end of 2013. Consolidated total indebtedness secured by a lien is defined in the senior secured credit agreement as total indebtedness outstanding under the senior secured credit agreement, capital leases, advances under the Receivables Facility and any other indebtedness secured by a lien reduced by the lesser of the amount of cash and cash equivalents on our balance sheet that is free and clear of any lien and $75 million. Non-compliance with the maximum Consolidated Secured Debt Ratio could result in the requirement to immediately repay all amounts outstanding under such agreement, which, if our lenders failed to waive any such default, would also constitute a default under our indenture. |
44
| (2) | Our senior secured credit agreement establishes an incurrence-based minimum Interest Coverage Ratio, defined as Adjusted EBITDA to consolidated interest expense, the achievement of which is a condition for us to incur additional indebtedness and to make certain restricted payments. If we do not maintain this minimum Interest Coverage Ratio calculated on a pro forma basis for any such additional indebtedness or restricted payments, we could be prohibited from being able to incur additional indebtedness, other than the additional funding provided for under the senior secured credit agreement and pursuant to specified exceptions, and make certain restricted payments, other than pursuant to certain exceptions. The minimum Interest Coverage Ratio is 2.00x for the term of the senior secured credit agreement. Consolidated interest expense is defined in the senior secured credit agreement as consolidated interest expense excluding interest income, adjusted for acquisitions (including the Transaction) and dispositions, further adjusted for certain non-cash or nonrecurring interest expense and our estimated share of interest expense from one equity method investee. The indenture includes a similar requirement which is referred to as a Fixed Charge Coverage Ratio. |
In connection with the Transaction, the Company and its Parent Company paid the Sponsors and certain affiliates $27.0 million of transaction fees, $30.0 million for acquisition advisory services, approximately $105.2 million in underwriting discount, commitment, arranging and similar fees related to the senior secured credit agreement and the issuance of the $1.28 billion of 8.50% senior notes due 2015 and $500 million of senior floating rate notes due 2015, and approximately $1.1 million for the reimbursement of out-of-pocket expenses. These amounts have been included in the total purchase price of the Transaction, recorded as debt issue cost or expensed as incurred, as appropriate.
The Company and its subsidiaries, affiliates or significant shareholders may from time to time, in their sole discretion, purchase, repay, redeem or retire any of the Company’s outstanding debt securities (including any publicly issued debt securities), in privately negotiated or open market transactions, by tender offer or otherwise.
The following table summarizes the Company’s future obligations for debt repayments, capital leases, estimated interest payments, future minimum rental and similar commitments under noncancelable operating leases as well as contingent obligations related to outstanding letters of credit and guarantees as of October 2, 2009 (dollars in thousands):
| Payments Due by Period | |||||||||||||||
| Contractual Obligations as of October 2, 2009 |
Total | Less than 1 year |
1-3 years | 3-5 years | More than 5 years | ||||||||||
| Long-term borrowings (1) |
$ | 5,674,881 | $ | 28,483 | $ | 268,396 | $ | 3,598,002 | $ | 1,780,000 | |||||
| Capital lease obligations |
59,834 | 15,460 | 26,618 | 11,945 | 5,811 | ||||||||||
| Estimated interest payments (2) |
1,432,100 | 369,900 | 629,800 | 389,500 | 42,900 | ||||||||||
| Operating leases |
603,796 | 189,637 | 143,049 | 99,173 | 171,937 | ||||||||||
| Purchase obligations (3) |
299,273 | 191,773 | 56,800 | 30,103 | 20,597 | ||||||||||
| Other long-term liabilities reflected on the balance sheet (4) |
229,890 | 7,100 | 8,700 | 4,900 | 209,190 | ||||||||||
| $ | 8,299,774 | $ | 802,353 | $ | 1,133,363 | $ | 4,133,623 | $ | 2,230,435 | ||||||
| Total Amounts Committed |
Amount of Commitment Expiration Per Period | ||||||||||||||
| Other Commercial Commitments as of October 2, 2009 |
Less than 1 year |
1-3 years | 3-5 years | More than 5 years | |||||||||||
| Letters of credit |
$ | 199,489 | $ | 199,489 | $ | — | $ | — | $ | — | |||||
| Guarantees |
— | — | — | — | — | ||||||||||
| $ | 199,489 | $ | 199,489 | $ | — | $ | — | $ | — | ||||||
| (1) | Excludes the remaining discount of $13.0 million recorded as a result of the fair value accounting adjustments made in connection with the Transaction (see Note 5 to the consolidated financial statements). |
45
| (2) | These amounts represent future interest payments related to our existing debt obligations based on fixed and variable interest rates specified in the associated debt agreements. Payments related to variable debt are based on applicable rates at October 2, 2009 plus the specified margin in the associated debt agreements for each period presented. The amounts provided relate only to existing debt obligations and do not assume the refinancing or replacement of such debt. The average debt balance for each fiscal year from 2010 through 2015 is $5,659,300, $5,647,200, $5,555,000, $5,382,300, $2,979,800 and $593,300, respectively. The average interest rate (after giving effect to interest rate swaps) for each fiscal year from 2010 through 2015 is 6.58%, 6.46%, 5.39%, 4.46%, 5.50% and 7.23%, respectively. Refer to Note 5 to the consolidated financial statements for the terms and maturities of existing debt obligations. |
| (3) | Represents commitments for capital projects, client contract investments and business acquisitions. |
| (4) | Includes certain unfunded employee retirement obligations. |
The Company has excluded from the table above uncertain tax liabilities due to the uncertainty of the amount and period of payment. As of October 2, 2009, the Company has gross uncertain tax liabilities of $39.8 million (see Note 9 to the consolidated financial statements).
Pursuant to the Stockholders Agreement of the Parent Company, commencing on January 26, 2008, upon termination of employment from the Company or one of its subsidiaries, members of the Company’s management (other than Mr. Neubauer) who hold shares of common stock of the Parent Company can cause the Parent Company to repurchase all of their initial investment shares (as defined) at appraised fair market value. Generally, payment for shares repurchased could be, at the Parent Company’s option, in cash or installment notes. The amount of common stock subject to repurchase as of October 2, 2009 was $176.4 million, which is based on approximately 13.4 million shares of common stock of the Parent Company valued at $13.15 per share. The fair value of our common stock subject to repurchase is calculated using discounted cash flow techniques, comparable public company trading multiples and transaction multiples. The Stockholders Agreement, the senior secured credit agreement and the indenture governing the 8.50% senior notes due 2015 and the senior floating rate notes due 2015 contain limitations on the amount the Company can expend for such share repurchases.
The Company has an agreement (the Receivables Facility) with several financial institutions whereby it sells on a continuous basis an undivided interest in all eligible trade accounts receivable, as defined in the Receivables Facility. As part of the Transaction, the Company amended and restated the Receivables Facility, increasing the maximum sales amount from $225 million to $250 million. Pursuant to the Receivables Facility, the Company formed ARAMARK Receivables, LLC, a wholly-owned, consolidated, bankruptcy-remote subsidiary. ARAMARK Receivables, LLC was formed for the sole purpose of buying and selling receivables generated by certain subsidiaries of the Company. Under the Receivables Facility, the Company and certain of its subsidiaries transfer without recourse all of their accounts receivable to ARAMARK Receivables, LLC. ARAMARK Receivables, LLC, in turn, has sold and, subject to certain conditions, may from time to time sell an undivided interest in these receivables. As collections reduce previously sold interests, interests in new, eligible receivables can be sold, subject to meeting certain conditions. This two-step transaction is accounted for as a sale of receivables.
The Company has retained an undivided interest in the transferred receivables of approximately $264.3 million and $296.2 million at October 2, 2009 and October 3, 2008, respectively, which is subject to a security interest. Because the sold accounts receivable underlying the retained ownership interest are generally short-term in nature, the fair value of the retained interest approximated its carrying value at both October 2, 2009 and October 3, 2008. The fair value of the retained interest is measured based on expected future cash flows adjusted for unobservable inputs used to assess the risk of credit losses. Those inputs reflect the diversified customer base, the short-term nature of the securitized asset, aging trends and historic collections experience. The Company believes that the allowance for doubtful accounts balance is a reasonable approximation of any credit risk of the customers that generated the receivables. At October 2, 2009 and October 3, 2008, approximately $235.4 million and $250.0 million of accounts receivable were sold and removed from the Consolidated Balance Sheets, respectively. The Company has retained collection and administrative responsibility for the participating interest
46
sold but has not recorded an asset or liability related to the servicing responsibility retained as the fees earned for servicing were estimated to approximate fair value of the services provided. During fiscal 2009 and fiscal 2008, ARAMARK Receivables, LLC sold an undivided interest in approximately $2.90 billion and $2.96 billion of trade account receivables, respectively, and remitted to bank conduits, pursuant to the servicing agreement, approximately $2.91 billion and $2.95 billion in collections on trade account receivables previously sold, respectively. The discount on the sale of the undivided interest in the transferred receivables is based on the cost of the commercial paper borrowings of the buyers. The loss on the sale of receivables was approximately $5.1 million, $11.7 million, $9.9 million and $4.1 million for fiscal 2009, fiscal 2008, the Successor period from January 27, 2007 through September 28, 2007 and the Predecessor period from September 30, 2006 through January 26, 2007, respectively, and is included in “Interest and Other Financing Costs, net” in the Consolidated Statements of Operations.
The Company’s business activities do not include the use of unconsolidated special purpose entities, and there are no significant business transactions that have not been reflected in the accompanying financial statements. The Company is self-insured for the risk retained under its health and welfare and general liability and workers’ compensation arrangements. Self-insurance reserves are recorded based on historical claims experience and actuarial analyses.
Legal Proceedings
Our business is subject to various federal, state and local laws and regulations governing, among other things, the generation, handling, storage, transportation, treatment and disposal of water wastes and other substances. We engage in informal settlement discussions with federal, state and local authorities regarding allegations of violations of environmental laws at operations primarily relating to our uniform rental segment or to businesses conducted by our predecessors, the aggregate amount of which and related remediation costs we do not believe should have a material adverse effect on our financial condition or results of operations.
From time to time, we are a party to various legal actions and investigations involving claims incidental to the conduct of our business, including actions by clients, customers, employees, government entities and third parties, including under federal and state employment laws, wage and hour laws, immigration laws, customs, import and export control laws, environmental laws, false claims statutes and dram shop laws. Based on information currently available, advice of counsel, available insurance coverage, established reserves and other resources, we do not believe that any such current actions are likely to be, individually or in the aggregate, material to our business, financial condition, results of operations or cash flows. However, in the event of unexpected future developments, it is possible that the ultimate resolution of these matters, or other similar matters, if unfavorable, may be materially adverse to our business, financial condition, results of operations or cash flows.
On October 3, 2008, the Company and a subsidiary were served with a complaint in a Qui Tam action filed by Relator Robert Pritsker (which was originally filed on October 30, 2003) naming the Company and certain other companies in its industry in the United States District Court, E.D.PA. and alleging, among other things, that the defendants, including the Company, caused the making of certain false certifications to the federal government of compliance with U.S.D.A. regulations and seeking unspecified damages. The United States declined to join in this action in 2005. On March 6, 2009, in response to motions by all defendants, the Court dismissed this action with prejudice. On April 3, 2009, the Relator filed notice of an appeal to the United States Court of Appeals for the Third Circuit, which appeal is still pending. The Company intends to continue to vigorously defend against these claims.
On July 29, 2009, Genaro Zendejas Morales, a former employee of the Company, and Ricky Silva and Cristian Sanchez, current employees of ARAMARK Sports, LLC, filed a proposed class action complaint against the Company, ARAMARK Sports, Inc., and ARAMARK Sports, LLC in the United States District Court, Central District of California. The complaint, as filed, purports to assert class claims that defendants did not pay all monies due under California wage and hour laws. The plaintiffs are seeking unspecified monetary damages and injunctive relief. The case is being vigorously defended by the Company.
47
New Accounting Pronouncements
See Note 1 of the Notes to Consolidated Financial Statements for a full description of recent accounting pronouncements, including the expected dates of adoption.
SPECIAL NOTE ABOUT FORWARD-LOOKING STATEMENTS
This report includes “forward-looking statements” within the meaning of the Private Securities Litigation Reform Act of 1995 that reflect our current views as to future events and financial performance with respect to our operations. These statements can be identified by the fact that they do not relate strictly to historical or current facts. They use words such as “aim,” “anticipate,” “are confident,” “estimate,” “expect,” “will be,” “will continue,” “will likely result,” “project,” “intend,” “plan,” “believe” and other words and terms of similar meaning in conjunction with a discussion of future operating or financial performance.
These statements are subject to risks and uncertainties that could cause actual results to differ materially from those expressed or implied in the forward-looking statements. Factors that might cause such a difference include: unfavorable economic conditions, including ramifications of any future terrorist attacks or increased security alert levels; increased operating costs, including increased food costs, labor-related, energy or product sourcing and distribution costs; shortages of qualified personnel or increases in labor costs; costs and possible effects of further unionization of our workforce; currency risks and other risks associated with international markets; risks associated with acquisitions, including acquisition integration issues and costs; our ability to integrate and derive the expected benefits from our recent acquisitions; competition; a decline in attendance at client facilities; the unpredictability of sales and expenses due to contract terms and terminations; the impact of natural disasters or a flu pandemic on our sales and operating results; the risk that clients may become insolvent; the risk that our insurers may become insolvent or may liquidate; the contract intensive nature of our business, which may lead to client disputes; high leverage; claims relating to the provision of food services; costs of compliance with governmental regulations and government investigations; liability associated with noncompliance with our business conduct policy and governmental regulations, including regulations pertaining to food services, the environment, the Federal school lunch program, Federal and state employment and wage and hour laws, human health and safety laws and import and export controls and customs laws; dram shop compliance and litigation; contract compliance and administration issues, inability to retain current clients and renew existing client contracts; a determination by customers to reduce their outsourcing and use of preferred vendors; seasonality; our competitor’s activities or announced planned activities; the effect on our operations of increased leverage and limitations on our flexibility as a result of increased restrictions in our debt agreements; potential future conflicts of interest between our Sponsors and other stakeholders; the impact on our business if we are unable to generate sufficient cash to service all of our indebtedness; the inability of our subsidiaries to generate enough cash flow to repay our debt; risks related to the structuring of our debt; our potential inability to repurchase our notes upon a change of control; and other risks that are set forth in the “Risk Factors,” “Legal Proceedings” and “Management Discussion and Analysis of Financial Condition and Results of Operations” sections and other sections of this Annual Report on Form 10-K.
Forward-looking statements speak only as of the date made. We undertake no obligation to update any forward-looking statements to reflect the events or circumstances arising after the date as of which they are made. As a result of these risks and uncertainties, readers are cautioned not to place undue reliance on the forward-looking statements included in this report or that may be made in other filings with the Securities and Exchange Commission or elsewhere from time to time by, or on behalf of, us.
48
Item 7A. Quantitative and Qualitative Disclosure About Market Risk
We are exposed to the impact of interest rate changes and manage this exposure through the use of variable-rate and fixed-rate debt and by utilizing interest rate swaps. We do not enter into contracts for trading purposes and do not use leveraged instruments. The information below summarizes our market risks associated with debt obligations and other significant financial instruments as of October 2, 2009 and October 3, 2008 (see Notes 5 and 6 to the consolidated financial statements). Fair values were computed using market quotes, if available, or based on discounted cash flows using market interest rates as of the end of the respective periods. For debt obligations, the table presents principal cash flows and related interest rates by contractual fiscal year of maturity. Variable interest rates disclosed represent the weighted-average rates of the portfolio at October 2, 2009 and October 3, 2008. For interest rate swaps, the table presents the notional amounts and related weighted-average interest rates by fiscal year of maturity. The variable rates presented are the average forward rates for the term of each contract.
| Expected Fiscal Year of Maturity | ||||||||||||||||||||||||||||||||
| As of October 2, 2009 |
2010 | 2011 | 2012 | 2013 | 2014 | Thereafter | Total | Fair Value | ||||||||||||||||||||||||
| (US$ equivalent in millions) | ||||||||||||||||||||||||||||||||
| Debt: |
||||||||||||||||||||||||||||||||
| Fixed rate |
$ | 16 | $ | 19 | $ | 258 | (a) | $ | 6 | $ | 5 | $ | 1,286 | (b) | $ | 1,590 | $ | 1,553 | ||||||||||||||
| Average interest rate |
5.0 | % | 5.0 | % | 5.0 | % | 5.0 | % | 5.0 | % | 8.5 | % | 7.8 | % | ||||||||||||||||||
| Variable rate |
$ | 29 | (d) | $ | 12 | (d) | $ | 6 | (d) | $ | 6 | (d) | $ | 3,592 | (d) | $ | 500 | (c) | $ | 4,145 | $ | 3,861 | ||||||||||
| Average interest rate |
2.7 | % | 2.7 | % | 2.4 | % | 2.4 | % | 2.4 | % | 4.0 | % | 2.6 | % | ||||||||||||||||||
| Interest Rate Swaps: |
||||||||||||||||||||||||||||||||
| Receive variable/pay fixed |
$ | 1,260 | $ | 2,356 | $ | 665 | $ | (239.9 | ) | |||||||||||||||||||||||
| Average pay rate |
5.0 | % | 4.9 | % | 3.8 | % | ||||||||||||||||||||||||||
| Average receive rate |
0.4 | % | 0.3 | % | 0.3 | % | ||||||||||||||||||||||||||
| (a) | Balance includes $250 million of senior notes callable by us at any time. |
| (b) | Balance includes $1,280 million of senior notes callable by us at any time with any applicable prepayment penalty. |
| (c) | Balance includes $500 million of senior notes callable by us at any time with any applicable prepayment penalty. |
| (d) | Balance includes $13 million for fiscal 2010, $6 million for fiscal 2011 through 2013 and $3,592 million for fiscal 2014 of senior secured term loan facilities callable by us any time. |
As of October 2, 2009, the Company had foreign currency forward exchange contracts outstanding with notional amounts of €12.1 million, £6.5 million and CAD 75.0 million to mitigate the risk of changes in foreign currency exchange rates on short-term intercompany loans to certain international subsidiaries. As of October 2, 2009, the fair value of these foreign exchange contracts was a loss of $0.4 million.
During fiscal 2009, the Company entered into a series of pay fixed/receive floating natural gas hedge agreements based on a NYMEX price in order to limit its exposure to price increases for natural gas, primarily in the Uniform and Career Apparel segment. As of October 2, 2009, the Company has contracts for approximately 763,000 MMBtu’s outstanding for fiscal 2010. As of October 2, 2009, the fair value of the Company’s natural gas hedge agreements was a loss of $1.0 million.
During fiscal 2009, the Company entered into a series of gasoline and diesel fuel hedge agreements based on the Department of Energy weekly retail on-highway index in order to limit its exposure to price fluctuations for gasoline and diesel fuel. The Company has contracts for approximately 7.7 million gallons outstanding for fiscal 2010. As of October 2, 2009, the fair value of the Company’s gasoline and diesel fuel hedge agreements was a loss of $1.8 million.
49
Item 8. Financial Statements and Supplementary Data
See Financial Statements and Schedule beginning on page S-1.
Item 9. Changes and Disagreements with Accountants on Accounting and Financial Disclosure
Not applicable.
Item 9A(T). Controls and Procedures
(a) Evaluation of Disclosure Controls and Procedures
The Company’s management, with the participation of the Company’s Chief Executive Officer and Chief Financial Officer, evaluated the effectiveness of the Company’s disclosure controls and procedures (as that term is defined in Rules 13a-15(e) and 15d-15(e) under the Securities Exchange Act of 1934, as amended) as of the end of the period covered by this report. Based on that evaluation, management, with the participation of the Chief Executive Officer and Chief Financial Officer, concluded that the Company’s disclosure controls and procedures, as of the end of the period covered by this report, are functioning effectively to provide reasonable assurance that the information required to be disclosed by the Company in reports filed under the Securities Exchange Act of 1934 is recorded, processed, summarized and reported within the time periods specified in the SEC’s rules and forms. A controls system, no matter how well designed and operated, cannot provide absolute assurance that the objectives of the controls system are met, and no evaluation of controls can provide absolute assurance that all control issues and instances of fraud, if any, within a company have been detected.
(b) Internal Control over Financial Reporting
Refer to “Management’s Report on Internal Control Over Financial Reporting” on page S-2 herein.
(c) Change in Internal Control over Financial Reporting
No change in the Company’s internal control over financial reporting occurred during the Company’s fourth fiscal quarter that has materially affected, or is reasonably likely to materially affect, the Company’s internal control over financial reporting.
Item 9B. Other Information
On December 9, 2009, the requirement that the Company achieve the performance target for fiscal 2009 with respect to 35% of the portion of the performance-based stock options whose vesting was subject to the achievement of the Company’s fiscal 2009 annual performance target was waived by the Parent Company Board. These performance-based stock options included stock options held by the named executive officers.
Schedule 1 to the outstanding non-qualified stock option agreements and to the form of non-qualified stock option agreement was also amended to adjust the performance targets for fiscal 2010 (both annual and cumulative) that determine the vesting of performance-based stock options. The amended schedules also reflect adjustments to the targets for acquisitions as provided in the stock option agreements. The amended Schedule 1s are attached hereto as Exhibits 10.18 and 10.19 and are incorporated by reference herein. See also “Executive Compensation—2009 Grants of Plan Based Awards.”
50
The new 2010 annual and cumulative EBIT targets and the adjusted other EBIT targets for outstanding options of our named executive officers are as follows:
| Fiscal 2007 Grants |
||||
| Year |
Annual EBIT Target |
Cumulative EBIT Target | ||
| 2010 |
$718.1 million | $2,957.5 million | ||
| Fiscal 2008 Grants |
||||
| Year |
Annual EBIT Target |
Cumulative EBIT Target | ||
| 2010 |
$718.1 million | $2,252.4 million | ||
| 2011 |
$959.4 million | $3,211.8 million | ||
| Fiscal 2009 Grants |
||||
| Year |
Annual EBIT Target |
Cumulative EBIT Target | ||
| 2010 |
$718.1 million | N.A. | ||
| 2011 |
$959.4 million | $1,677.5 million | ||
| 2012 |
$1,016.0 million | $2,693.5 million | ||
| 2013 |
$1,076.0 million | $3,769.6 million | ||
51
PART III
Item 10. Directors and Executive Officers of the Registrant
Directors and Executive Officers of the Registrant
The following table presents the names and positions of our directors and executive officers, their ages as of November 27, 2009 and the length of time they have been officers:
| Name |
Age | Position |
Director/Officer Since | |||
| Joseph Neubauer |
68 | Chairman and Chief Executive Officer and Director | 1979 | |||
| Christopher S. Holland |
43 | Senior Vice President, Treasurer and Director | 2003 | |||
| Andrew C. Kerin |
46 | Executive Vice President and Group President, ARAMARK Global Food, Hospitality and Facility Services | 2004 | |||
| Lynn B. McKee |
54 | Executive Vice President, Human Resources | 2004 | |||
| Joseph M. Munnelly |
45 | Senior Vice President, Controller and Chief Accounting Officer | 2008 | |||
| Ravi K. Saligram |
53 | Executive Vice President, President, ARAMARK International and Chief Globalization Officer | 2004 | |||
| L. Frederick Sutherland |
57 | Executive Vice President, Chief Financial Officer; Group Executive, ARAMARK Uniform and Career Apparel and Director | 1983 | |||
| Thomas J. Vozzo |
47 | Executive Vice President and President, ARAMARK Uniform and Career Apparel | 2004 |
Joseph Neubauer has been our Chairman and Chief Executive Officer since September 2004. From January 2004 to September 2004, he served as our Executive Chairman. Mr. Neubauer also served as our Chief Executive Officer from February 1983 to December 2003 and as our Chairman from April 1984 to December 2003. He was our President from February 1983 to May 1997. He is a director of Verizon Communications Inc. and Macy’s, Inc.
Christopher S. Holland has been our Senior Vice President and Treasurer since May 2006. He joined us in November 2003, and he became our Vice President and Treasurer in December 2003. Prior to joining us, Mr. Holland served as Vice President, Investment Banking at J.P. Morgan Chase & Co. since 1998.
Andrew C. Kerin has served as our Executive Vice President since November 2006 and Group President, ARAMARK Global Food, Hospitality and Facility Services Group since June 2009. He served as President, ARAMARK North America Food, Hospitality and Facilities from April 2006 to June 2009. From November 2004 to November 2006 he served as Senior Vice President and from November 2004 to April 2006 as President, ARAMARK Healthcare, Facilities and Education. He served as President, ARAMARK Healthcare and Education from January 2004 to November 2004, and from May 2002 to January 2004, as President, Healthcare and Facilities Group. Prior to that, he served as President, ARAMARK ServiceMaster Facility Services from November 2001 to May 2002 and as President, ARAMARK Correctional Services from June 2001 to November 2001. Mr. Kerin served with ARAMARK Facility Support Services as President from September 1999 to June 2001, as Senior Vice President from April 1998 to September 1999 and as Vice President from when he joined us in October 1995 to April 1998.
Lynn B. McKee has been our Executive Vice President, Human Resources since May 2004. From January 2004 to May 2004, she was our Senior Vice President of Human Resources and from September 2001 to December 2003, she served as Senior Vice President of Human Resources for our Food and Support Services Group. From August 1998 to August 2001, Ms. McKee served as our Staff Vice President, Executive Development and Compensation.
52
Joseph M. Munnelly joined us in September 2007 and was elected as our Senior Vice President and appointed Controller and Chief Accounting Officer effective March 2008. Prior to joining us, he served as Vice President and Corporate Controller at Unisys Corporation, a worldwide information technology services and solutions company, since 2005. Prior to that, he served as a partner at KPMG LLP in the Audit and Risk Advisory Services Practice. Prior to his tenure at KPMG, he spent 16 years with Arthur Andersen LLP, most recently as a partner in the Audit and Business Advisory practice.
Ravi K. Saligram was elected as Executive Vice President in November 2006 and President, ARAMARK International in November 2004. In June 2009, he also became our Chief Globalization Officer. From November 2004 to November 2006, Mr. Saligram served as Senior Vice President. He joined us in June 2003 as President, ARAMARK International. Prior to joining us, Mr. Saligram held various positions with the Inter-Continental Hotel Group from 1994 to 2002, most recently as President, Brands & Franchise, North America from October 2000 to July 2002, as Chief Marketing Officer & Managing Director, Global Strategy from August 1999 to September 2000, and as President, International from June 1998 to July 1999. Mr. Saligram is a director of Church & Dwight Co., Inc.
L. Frederick Sutherland became our Chief Financial Officer in May 1997. He has served as an Executive Vice President since May 1993. In June 2009, he also became Group Executive, ARAMARK Uniform and Career Apparel. From May 1993 to May 1997, he also served as President of our Uniform Services division and from February 1991 to May 1993, he served as our Senior Vice President of Finance and Corporate Development. Mr. Sutherland served as our Treasurer from February 1984 to February 1991. Mr. Sutherland is a director of Consolidated Edison, Inc.
Thomas J. Vozzo was elected as Executive Vice President in November 2006 and has served as President, ARAMARK Uniform and Career Apparel since April 2003. From November 2004 to November 2006, he served as our Senior Vice President. Prior to that, Mr. Vozzo served in various divisions of ARAMARK Uniform and Career Apparel, including as President, Direct Marketing Group from July 2002 to April 2003 and President, Galls from January 1997 to April 2003. He served as Executive Vice President, Galls from April 1996 to January 1997 and as WearGuard Vice President, Marketing and then Vice President, Sales and Marketing from January 1992 to April 1996.
Our executive officers are elected annually by the Board of Directors and serve at its discretion or until their successors are duly elected and qualified.
Section 16(a) Beneficial Ownership Reporting Compliance
Not Applicable.
Code of Conduct
We have a business conduct policy that applies to all employees and non-employee directors, which includes the code of ethics for our principal executive officer, our principal financial officer and our principal accounting officer or controller within the meaning of the SEC regulations adopted under the Sarbanes-Oxley Act of 2002. Our business conduct policy is posted under the Investor Relations section of our website at www.aramark.com.
Copies of our business conduct policy also are available at no cost to any person who requests them by writing or telephoning us at the following address or telephone number:
ARAMARK Corporation
1101 Market Street
Philadelphia, PA 19107
Attention: Vice President, Audit & Controls
Telephone: (215) 238-3000
53
We will post on our website at www.aramark.com any amendments to the business conduct policy and any waivers that are required to be disclosed by SEC rules.
Audit Committee Financial Expert
The Board of Directors of the Company does not have any separate standing committees. The Audit and Corporate Practices Committee of the Holdings board performs the functions of an audit committee for the Company. Because the Company does not have an audit committee, the Board of Directors of the Company does not make a determination with regard to an Audit Committee Financial Expert.
Item 11. Executive Compensation
Compensation Discussion and Analysis
Background
Holdings, our parent Company, is a party to or sponsor of some of the plans and arrangements we discuss below, while we are a party to or sponsor of other plans or arrangements. In addition, our executive officers are also executive officers of Holdings and the board and compensation committee of Holdings make the determinations with regard to their compensation. Therefore, when we discuss the board or compensation committee, we are referring to the board and Compensation and Human Resources Committee of Holdings.
In connection with our going private transaction in 2007, the members of our management committee, which is composed of our named executive officers, Joseph Neubauer, L. Frederick Sutherland, Andrew C. Kerin, Thomas J. Vozzo and Ravi Saligram and one other executive vice president, Lynn B. McKee, along with approximately 250 other executives, each made a substantial investment in the common stock of Holdings. To encourage investment in the going-private transaction and to drive performance, executives, including management committee members other than Mr. Neubauer, received grants of stock options designed to “match” their investments (up to a certain maximum investment amount), with the number of stock options granted equal to 1.25 options for every share of stock purchased up to a specified target investment amount (which was based on each executive’s base salary for 2007) and one option for each share purchased above that target investment amount up to a maximum multiple of the executive’s base salary (which maximum ranged from seven to fourteen times base salary for management committee members—with one member of our management committee investing more than fourteen times his base salary). Mr. Neubauer did not receive a stock option grant in connection with his investment in Holdings because he was a primary investor in the going-private transaction, along with the Sponsors. In addition to the matching stock options that were granted based on their investment, non-investment stock options were granted soon after the Transaction was completed in 2007 and additional non-investment stock options were granted in March 2008 and September 2009. These options now serve as a substantial component of our compensation program for our management committee and provide significant motivation and retention value to us for two reasons:
| • | The investment in Holdings common stock generally is illiquid while management committee members remain employed by the Company. If one of our management committee members or other executives were to voluntarily terminate his or her employment with us, Holdings can compel the executive to sell that stock back to Holdings for a price equal to the fair market value at the time of that sale (fair market value of the common stock will be the most recent quarterly appraisal value). Holdings does not have this right until one year after termination of employment. The Company can pay for the stock in whole or in part with cash or a note with a term of up to three years, except in the case of death, disability, retirement or involuntary termination, when it must pay cash. Similarly, the executive can require Holdings to repurchase his or her shares, subject to an overall dollar amount limitation for all such purchases for consideration of cash or a note except in the case of death, disability or retirement, when Holdings must pay cash. The Company also has a Hardship Stock Repurchase Policy, which provides that an executive may request that ARAMARK repurchase all or some of the shares owned by him or |
54
| her in the event of an unforeseeable emergency, which would include events such as a severe financial hardship resulting from an illness or accident, loss of property due to casualty or other similar extraordinary and unforeseeable circumstances. |
| • | One half of all options granted have a time-based vesting schedule and vest over a four-year period, provided that the employee continues to be employed by ARAMARK. The other half of the options are intended to be performance-based and require that ARAMARK achieve specified financial targets before those options will vest. See “Components of Executive Compensation—Equity Incentives.” |
Our Executive Compensation Policy
Our compensation programs are designed to support our overall commitment to continued growth and the provision of quality services to our clients and customers. Our programs are focused on three important goals:
| • | Attraction and Retention—to enable us to recruit and retain the best performers; |
| • | Company and Individual Performance—to provide compensation levels consistent with the level of contribution and degree of accountability; |
| • | Alignment and Stockholder Value Creation—to use performance measures consistent with our goals and to include a significant portion of incentive compensation to motivate business results and strengthen the connection between the long-term interests of our executives and the interests of stockholders by encouraging each executive to maintain a significant ownership interest in the Company. |
Attraction and Retention
Our compensation programs are an integral part of attracting and retaining members of our management committee. We believe these programs are competitive with those of others in our industry and are well balanced to provide annual and longer-term capital accumulation opportunities by way of salary, annual incentives and equity vehicles. With regard to cash compensation, we aim to be in line with the median in our industry, and our total compensation is in line with that market median. All of our options, including both time-based and performance-based options, vest over four years, which provides significant retention value.
Company and Individual Performance
Our business requires us to deliver exceptional, value driven experiences to our clients and customers. Our compensation programs, particularly the bonus, are designed to reward all executives, including members of our management committee, who perform to or exceed our standards by recognizing each executive’s scope of responsibilities, and management capabilities, and providing incentive to him or her to optimize company-wide financial results including, among other measures, earnings before interest and taxes, or EBIT.
Alignment and Stockholder Value Creation
We attempt to align our management committee members’ and other executives’ goals with those of our clients, customers and stockholders. As a result of the going-private transaction, our management committee members’ and other executives’ interests have been strongly aligned with our stockholders since a significant amount of our management committee members’ and other executives’ personal capital has been invested in Holdings. In addition, because 50% of stock options granted are subject to performance-based vesting, if ARAMARK performs well and satisfies the EBIT targets for performance vesting of stock options as described in “Components of Executive Compensation—Equity Incentives,” portions of the total number of stock options held by members of our management committee will vest. Therefore, if any executive helps us to achieve corporate EBIT growth, he or she can have a direct impact on the vesting of a portion of his or her equity. This emphasis on long-term compensation underscores the importance of maintaining our executives’ focus on creating long-term success and sustained stockholder value.
55
Role of Compensation Consultants
The compensation committee re-engaged Frederic W. Cook & Co., Inc. in August 2008 to assist in the evaluation of compensation for the management committee and the board of directors, as well as other compensation-related matters for fiscal 2009. Prior to the compensation committee’s original engagement of Frederic W. Cook & Co., Inc., which began in October 2007, from time to time, the compensation committee had consulted with Frederic W. Cook & Co., Inc. and our Human Resources Services department had discussed with Frederic W. Cook & Co., Inc. the design of programs that affect executive officer compensation. Lynn McKee, our Executive Vice President, Human Resources, participated in the selection of and discussions with representatives from Frederic W. Cook & Co., Inc. None of our other executive officers has participated in the selection of any particular compensation consultant. Frederic W. Cook & Co., Inc. has provided us with market intelligence and guidance on compensation trends, along with general views on specific compensation programs being designed by our Human Resources management. Management consulted with both Frederic W. Cook & Co., Inc and Watson Wyatt in connection with the design of the equity compensation programs and other compensation issues in connection with the going-private transaction. While only the compensation committee may formally engage compensation consultants with respect to the compensation of executive officers and directors, our management may seek the advice of these or other compensation consultants from time to time with the approval of our compensation committee chairman.
In October 2008, Frederic W. Cook & Co., Inc. performed its periodic review of peer group companies to which the compensation committee benchmarks compensation for management committee members and after receiving Frederic W. Cook & Co., Inc.’s recommendation, the compensation committee changed the peer group. See “Components of Executive Compensation.”
In June 2009, the compensation committee again consulted Frederic W. Cook & Co., Inc. to assist in compensation determinations in connection with the realignment of the executive management of the Company. To compensate the affected executives for additional responsibilities and to encourage retention, Frederic W. Cook & Co., Inc. recommended changes to base salaries and bonus targets and additional non-investment stock option grants for the four management committee members impacted by the realignment.
In November 2009, the compensation committee reengaged Frederic W. Cook & Co., Inc. to update its June report with regard to management committee compensation, analyze market trends and to review our existing equity compensation plan design and recommend any modifications. The compensation committee wanted to begin looking at alternatives with regard to equity compensation plan design to continue to attract and motivate key talent. This review is ongoing.
Role of Compensation Committee and Executive Officers
The compensation committee is responsible for the oversight of our executive compensation program. The compensation committee makes or approves all decisions concerning compensation awarded to members of our management committee. Although Mr. Neubauer is a member of the compensation committee, he recuses himself from compensation committee discussions regarding his own compensation.
Our Human Resources department initially prepares a tally sheet for use by Frederic W. Cook & Co., Inc. in its analysis of the compensation of our management committee members. The tally sheet contains the following information for each of our management committee members: current base salary, bonus target and prior year’s bonus award, current year option grant and current equity holdings. Frederic W. Cook & Co., Inc. uses the information contained in the tally sheet along with market data (relating to our peer group plus a few additional companies with whom we compete for talent) to prepare a report and recommendation to the compensation committee, which it provides directly to the chairman of the compensation committee. Frederic W. Cook & Co., Inc. then provides the report to Ms. McKee and discusses the report with the chairman of the compensation committee and Ms. McKee. With regard to bonus awards, our Human Resources department also prepares a report containing hypothetical bonus amounts based on business results, including EBIT and net income and, for
56
Messrs. Kerin, Saligram and Vozzo, client retention. Ms. McKee then engages in discussions with Mr. Neubauer regarding the compensation of members of the management committee other than himself and herself. Following this consultation, Mr. Neubauer presents a recommendation for Ms. McKee’s compensation and Ms. McKee presents the recommendations for the other management committee members’ compensation, including Mr. Neubauer’s compensation, to the compensation committee for its consideration. The compensation committee alone uses this information to make the final decisions regarding executive compensation for our management committee members, including Mr. Neubauer.
The Compensation Committee’s Processes
The compensation committee generally makes its compensation decisions at its November meetings. New hires and promotions and other compensation adjustments are considered at its meetings throughout the year. Annual base salary decisions are made in early November and are effective at the beginning of the next calendar year, while bonus awards to members of our management committee generally are made in late November for the immediately preceding fiscal year. In addition, the bonus pool under the Senior Executive Annual Performance Bonus Plan for the current fiscal year is set at the late November meeting. The compensation committee makes its decisions after review and discussion of recommendations made by Ms. McKee, with input from Mr. Neubauer, and materials prepared by Frederic W. Cook Co., Inc., and in the case of bonus recommendations, by our Human Resources department. In addition, Mr. Neubauer provides the compensation committee with qualitative assessments of the other management committee members’ performance including individual business results (with regard to Messrs. Kerin, Saligram and Vozzo) and his review of their performance before it makes its compensation decisions. Non-investment stock options were granted to all members of our management committee in March 2008 and to certain management committee members in September 2009 in connection with the management realignment. See “Components of Executive Compensation—Equity Incentives.” We have not established a cycle for any future grants to members of our management committee. The compensation committee is entitled to exercise its discretion with regard to any element of compensation and does exercise negative discretion with regard to bonuses.
Components of Executive Compensation
The principal components of our executive compensation program are base salary, bonus and equity incentives. We also provide employee and post-employment benefits and perquisites.
In October 2008, the compensation committee, with the assistance of Frederic W. Cook & Co., Inc., performed its periodic review of peer group companies to which the compensation committee benchmarks compensation for management committee members. The compensation committee, based on the results of its discussion with representatives of Frederic W. Cook & Co., Inc., determined to change the composition of the peer group by removing Brinks, Mitchells & Butlers and Wendy’s International from the peer group to which the Company benchmarks compensation and adding RR Donnelley, Hertz, Manpower and Tyco International. The peer companies that were removed are significantly smaller than the Company or are not direct competitors of the Company. The new companies included in the peer group were added due to their similar size, private equity investment profile or the employee-intensive nature of their business. The newly-composed peer group consists of Cintas, Compass Group PLC, Darden Restaurants, FedEx, Hertz, Manpower, Marriott, McDonald’s, Performance Food Group, RR Donnelley, Ryder Systems, Starbucks, SYSCO, Tyco International, UPS, Waste Management and Yum Brands. The newly-composed peer group data was utilized by the compensation committee as a benchmark to make its compensation determinations for fiscal 2009. In terms of size, our revenues approximated the median of the peer companies, our enterprise value approximates the 25th percentile and the number of our employees was above the 75th percentile. Total cash compensation paid to our management committee members in fiscal 2009 was between the median and the 75th percentile, which generally is consistent with our competitive positioning. Base salaries paid to our management committee members in fiscal 2009 approximated the 75th percentile of peer companies and target bonus approximated between the median and the 75th percentile.
57
Base Salary
We use base salary to reflect the value of a particular position—to the Company and the marketplace, and the value the individual contributes to our Company. Salary levels for our management committee members are reviewed at least annually. The specific salary increases for each member of our management committee in fiscal 2009 were based upon a review of his or her individual performance along with a comparison to published market data relating to over 500 companies, as well as a review of the peer companies described above. Salaries for all management committee members other than Mr. Neubauer are reviewed by Mr. Neubauer. Ms. McKee participated in all reviews except her own. The survey of competitive salaries is conducted and recommendations are made to the compensation committee for its review and approval. Salary adjustments generally are effective at the beginning of the following calendar year. On November 11, 2008, the compensation committee approved increases to the base salaries of all of the members of the management committee other than Mr. Neubauer. These salaries, which took effect on January 1, 2009, were as follows: for Mr. Sutherland, $710,000, for Mr. Kerin, $690,000, for Mr. Saligram, $590,000, for Mr. Vozzo, $575,000, and for Ms. McKee, $575,000. Salary increases also can be recommended and approved for a promotion or a significant change in responsibilities, as was the case with the salary increases for the four management committee members impacted by the realignment of executive management in June 2009. Effective June 15, 2009, the compensation committee approved new base salaries as follows: for Mr. Sutherland, $750,000, for Mr. Kerin, $750,000, for Mr. Saligram, $615,000, and for Mr. Vozzo, $595,000.
On November 17, 2009, the compensation committee approved a calendar year 2010 salary increase to $590,000 for Ms. McKee. No salary increases were approved for the other members of the management committee, including Mr. Neubauer.
Bonus
In fiscal 2009, members of our management committee participated in ARAMARK’s Senior Executive Annual Performance Bonus Plan (the “Bonus Plan”). Under the Bonus Plan, the compensation committee approved in November 2008 the establishment of a bonus pool which was funded based on a percentage of adjusted EBIT. For purposes of the Bonus Plan and the formula used to determine the bonus pool approved by the compensation committee, adjusted EBIT is income from both continuing and discontinued operations before income taxes, if any, and before interest expense and other financing costs, in each case as shown on the Company’s consolidated financial statements and notes thereto. In addition, the compensation committee adjusted the calculation of EBIT for purposes of the Bonus Plan to exclude share-based compensation expense, an impairment charge or similar asset write-off in accordance with Generally Accepted Accounting Principles, effects of changes in foreign currency translation rates from such rates used in the business plan and incremental contract right amortization and incremental depreciation as a result of the going private transaction. These adjustments were made to normalize the adjusted EBIT number so that it does not reflect unusual or non-operational items. The percentages of adjusted EBIT for each member of our management committee represent the maximum amount that could have been awarded to him or her for fiscal 2009 and are as follows: for Mr. Neubauer, 0.7%, for Mr. Sutherland, 0.35%, and for Messrs. Kerin, Vozzo and Saligram and Ms. McKee, 0.28%. For fiscal 2010, the compensation committee approved the following percentages of adjusted EBIT for each member of our management committee, which represent the maximum amount that can be awarded to him or her in respect of his or her fiscal 2010 bonus: for Mr. Neubauer, 0.7%, for Messrs. Sutherland and Kerin, 0.37%, for Messrs. Vozzo and Saligram and Ms. McKee, 0.30%. This pool method was chosen to satisfy the requirements of Section 162(m) of the Internal Revenue Code (when the Company was subject to Section 162(m) prior to the going-private transaction). Although neither we, nor Holdings, is currently subject to Section 162(m) because we are not considered “publicly held” companies as defined in the regulations, Holdings may, in the future, be required to register securities under the Securities Exchange Act of 1934 and become subject to Section 162(m). Therefore, we have continued to operate our Bonus Plan to comply with Section 162(m). For fiscal 2009, the compensation committee exercised negative discretion with regard to the actual bonus amounts awarded to members of our management committee.
58
Bonuses are designed to encourage and reward performance that is consistent with our financial objectives and individual performance goals and targets. In determining the actual bonuses paid to members of our management committee other than Mr. Neubauer, the compensation committee considers the maximum bonus amount based on the above adjusted EBIT formula and then considers as reference points, in the case of our group presidents, individual business results of their business, based upon sales, managed cash flow and client retention. Other factors include our company-wide results, based upon sales, and managed cash flow (in the case of the other management committee members, other than Mr. Neubauer), the bonuses awarded by our peer companies to comparable officers and the management committee member’s historical bonus awards. Ms. McKee presents these reference points, along with a specific recommendation, except with respect to herself and Mr. Neubauer, to Mr. Neubauer for his review. After consultation with Mr. Neubauer, who considers the individual contributions of the management committee members other than himself (including individual business results (with regard to group presidents) and execution of business strategy), final bonus recommendations for management committee members, other than Mr. Neubauer, are made to the compensation committee. The recommendation for fiscal 2009 represented less than the amount derived from the formula described above. The compensation committee considers the reference points and recommendations and, to the extent that the amount awarded is lower than the maximum bonus payable based on the EBIT formula, exercises negative discretion to determine the bonus amounts for members of our management committee, other than Mr. Neubauer. The compensation committee also considers a target or threshold amount which represents the compensation committee’s view of a market competitive award. For fiscal 2009, as determined in November 2008, these bonus targets were $500,000 for Messrs. Sutherland and Kerin and $425,000 for Messrs. Vozzo and Saligram and Ms. McKee. On June 15, 2009, the compensation committee approved new bonus targets for those management committee members impacted by the realignment of the Company’s executive management of $600,000 for Messrs. Sutherland and Kerin, $450,000 for Mr. Saligram and $445,000 for Mr. Vozzo. The new targets were effective for the period between June 15, 2009 and October 2, 2009, the end of the fiscal year, with the previous targets applicable from the beginning of fiscal 2009 until June 15, 2009. For fiscal 2010, the bonus targets are $600,000 for Messrs. Sutherland and Kerin, $450,000 for Mr. Saligram and $445,000 for Mr. Vozzo and Ms. McKee. For fiscal 2009 our management committee members’ actual bonus amounts paid ranged from 50.4% to 65.2% of their base salaries.
In determining the actual bonus paid to Mr. Neubauer, the compensation committee considers the maximum bonus amount based on the above formula and considers as reference points the bonuses awarded by our peer companies to their chief executive officers, as well as Mr. Neubauer’s historical bonus awards and company-wide results. The chairman of the compensation committee engages in a discussion with a representative of Frederic W. Cook & Co., Inc., who provides a recommendation of a bonus range for Mr. Neubauer based on a view of bonuses paid to chief executive officers of our peer companies and discusses the recommendation with Ms. McKee. The chairman of the compensation committee then consults with each of the compensation committee members and receives their input. The chairman of the compensation committee presents Mr. Neubauer’s bonus recommendation to the compensation committee. The recommendation for fiscal 2009 represented less than the amount derived from the formula described above. The compensation committee considers the reference points and recommendation and, to the extent that the amount awarded is lower than the maximum bonus payable based on the EBIT formula, exercises negative discretion to determine the bonus amount for Mr. Neubauer. Mr. Neubauer was not involved in the determination of his bonus for fiscal 2009. The compensation committee also considers a target amount, which represents the compensation committee’s view of a market competitive award (for 2010, Mr. Neubauer’s target bonus amount is $2.3 million, which is the same as his target bonus amount for 2009). For fiscal 2009, Mr. Neubauer was awarded a bonus of $1.95 million which is equal to 43.3% of his maximum bonus potential for fiscal 2009 and is equal to 150% of his base salary. See the Summary Compensation Table for bonus amounts paid to members of our management committee for fiscal 2009.
Equity Incentives
In March 2008, the compensation committee adopted new guidelines for awards of equity compensation, which provide that, because non-investment option awards are currently an important means for retention and
59
motivation, awards of non-investment stock options to members of our management committee will be targeted to the 75th percentile of publicly traded peer companies, rather than the median.
In January 2007, members of our management committee were granted stock options in connection with their investment in Holdings and in February 2007 and March 2008, members of our management committee received grants of non-investment stock options in accordance with Holdings’ 2007 Management Stock Incentive Plan. In September 2009, four management committee members received non-investment stock option grants in connection with the realignment of the Company’s executive management and to encourage retention. As was negotiated with the Sponsors in connection with the going-private transaction, half of all of the options granted have a time-based vesting schedule and vest over a four year period, while half are intended to have a performance-based vesting schedule and require that ARAMARK achieve specified financial targets in addition to the four year vesting period before those options will vest, subject to the compensation committee’s discretion to accelerate vesting. In December 2008, the board of directors of Holdings waived the requirement that the EBIT target be satisfied with respect to 75% of the portion of performance-based stock options whose vesting was subject to the achievement of the 2008 EBIT target. As discussed below, in December 2009, the Holdings board, after considering, among other things: (1) the challenging economic circumstances facing the Company that were not contemplated at the time the performance targets were originally set and (2) management’s efforts in particularly difficult economic circumstances, determined that management’s performance during fiscal 2009 deserved to be rewarded and decided to waive the requirement that the Company achieve the performance target with respect to 35% of the portion of the performance-based stock options whose vesting was subject to the achievement of the 2009 EBIT target, even though such EBIT target was not achieved. See “2009 Grants of Plan Based Awards” for additional information.
Equity Grant Policy
On May 8, 2007, the board of directors of Holdings adopted a policy on the grant of equity awards. The board made minor modifications to the policy in December 2009. Under this policy, stock option grants may be approved by the compensation committee (or a subcommittee thereof) at regularly scheduled compensation committee meetings that are held shortly following each new appraisal of Holdings’ common stock. In addition, the compensation committee may grant newly hired or promoted executives the right to purchase shares of common stock of Holdings within approximately one year of the date of approval to give new or promoted employees adequate decision-making time. These purchase rights become exercisable once a quarter, generally on the twentieth day of the month in which an appraisal of Holdings’ common stock is delivered, and are generally exercisable, on one or two occasions within the approximately one year period following the latest appraisal of Holdings common stock. The compensation committee will grant one investment stock option for each share of stock purchased by the newly hired or promoted executive pursuant to the purchase right. The grant date for such investment stock options is the date the employee purchases his or her shares of stock of Holdings and the exercise price is the most recent appraisal price in effect on the date of such purchase.
Other Components of Compensation
Employee and Post Employment Benefits. We offer basic employee benefits to provide our workforce with a reasonable level of coverage in the event of illness or injury. The cost of certain employee benefits is partially or fully borne by the employee, including each management committee member. We offer comparable benefits to our eligible U.S. employees, which include medical and dental and vision coverage, disability insurance and optional life insurance. In addition, members of our management committee receive excess medical coverage that provides reimbursement for medical, dental and vision expenses in excess of $1,500 per covered individual per year. Members of our management committee also receive excess term life insurance or participate in a Survivor Income Protection Plan, which entitles a surviving spouse or domestic partner and dependent children to receive the executive’s full base salary for one year after the executive’s death and one-half of the executive’s base salary for the subsequent nine years. A participant in the Survivor Income Protection Plan who is 65 and has attained 5 years of employment with the Company is entitled to a benefit equal to one times his or her base salary upon his or her retirement or death in lieu of the benefit described above. Mr. Neubauer will receive this benefit on his retirement. Mr. Neubauer is also entitled to a supplemental retirement benefit as discussed under “Employment Agreements and Change of Control Arrangements.”
60
Generally, our highly compensated employees (for 2009, those earning more than $105,000), including members of our management committee other than Mr. Vozzo, are not eligible to participate in ARAMARK’s 401(k) plans because of certain legal requirements. Instead, those employees are eligible to participate in a non-qualified savings plan that we call our Savings Incentive Retirement Plan, the successor plan to our Stock Unit Retirement Plan. This plan is intended to be a substitute for those employees’ participation in our 401(k) plans. See “2009 Non Qualified Deferred Compensation” on page 72 for further information.
Management committee members are also parties to employment and post-employment competition agreements that entitle them to lump sum payments and severance if ARAMARK or Holdings experiences a change of control as described in the agreements and their employment is terminated under specified circumstances. These provisions are intended to align executive and shareholder interests by enabling executives to consider corporate transactions that are in the best interests of the shareholders and other constituents of the Company without concern over whether the transactions may jeopardize the executives’ own employment.
The agreements with members of the management committee other than Mr. Neubauer were entered into following the going-private transaction and contain a “double trigger”—for payments to be made, there must be a change of control followed by an involuntary loss of employment within three years or their employment must be terminated in anticipation of a change of control. We chose to implement a “double trigger” for management committee members other than Mr. Neubauer after advice from Frederic W. Cook & Co., Inc. that a “double trigger” is more common practice in the market than a single trigger. Mr. Neubauer’s employment agreement has a “single trigger” that permits him to resign for any reason within twelve months after a change of control and be paid out under his agreement. This single trigger provision has been included in his agreement for at least the past ten years and was not triggered by the going-private transaction because Mr. Neubauer was part of the group that was responsible for the change of control. For more information on change of control and severance payments for members of our management committee, see the disclosure under “Employment Agreements and Change of Control Arrangements” on page 68 and under “Potential Post Employment Benefits” on page 73.
Perquisites. We provide members of our management committee with other benefits, reflected in the All Other Compensation column in the Summary Compensation Table on page 63, that we believe are reasonable and encourage retention. We believe that these benefits enable our executives to focus on the business and enhance their commitment to us. In addition, the availability of financial planning services assists those who receive them to optimize the value received from all of the compensation and benefit programs offered. The costs of these benefits constitute a small percentage of each management committee member’s total compensation, and include premiums paid on life insurance or the survivor income protection plan, disability insurance, excess health insurance, use of a car leased by the Company or receipt of a car allowance, no cost parking at a garage near company offices, an executive physical, reimbursement for a club membership or financial planning services and personal use of company tickets or the company box at sporting or other events. Company provided perquisites are reviewed by the compensation committee in consultation with Frederic W. Cook & Co., Inc. on an annual basis and based upon the usefulness of such perquisites for retention, the compensation committee determines whether or not to continue them.
Our compensation committee has established a policy that directs Mr. Neubauer to use company aircraft, whenever possible, for all air travel, whether personal or business, in the Company’s business interest. Some of Mr. Neubauer’s business use of the corporate aircraft in fiscal 2009 included flights to attend outside board meetings at the companies or organizations for which he serves as a director or trustee. We believe that Mr. Neubauer’s service on these boards, and his ability to conduct company business while traveling to these board meetings, provides benefits to us and therefore deem it to be business use. In addition, depending on seat availability, Mr. Neubauer’s spouse or family members may accompany him on the company aircraft. Although there is little or no incremental cost to the Company for these trips, we reflect a $500 per seat charge in his “All Other Compensation” amount in the Summary Compensation Table for flights in which those additional passengers’ travel is not business related (for example, if Mr. Neubauer’s spouse’s presence at a business function is not required). Mr. Neubauer also has a car and driver that we provide to him. Much of Mr. Neubauer’s use of the company-provided car and driver, which generally enables him to make efficient use
61
of his travel time, is business use, although Mr. Neubauer does utilize the car and driver for commuting to and from the office, which is considered personal use, and for other limited personal use.
Impact of Regulatory Requirements on our Executive Compensation
Section 162(m). Section 162(m) of the Internal Revenue Code disallows a Federal income tax deduction to publicly held companies for compensation paid to specified executive officers to the extent that compensation exceeds $1 million per covered officer in any fiscal year. This limitation applies only to compensation that is not considered performance-based. Although neither we, nor Holdings, are currently considered “publicly held” companies, Holdings may, in the future, be required to register securities under the Securities Exchange Act of 1934 and become subject to Section 162(m). The 2007 Management Stock Incentive Plan has been structured so that any compensation paid in connection with the exercise of option grants made under the program is intended to qualify as performance-based compensation, which will not be subject to the $1 million limitation. The Bonus Plan also has been structured so that awards thereunder are intended to qualify as performance-based compensation not subject to the $1 million limitation. In implementing all of our compensation policies, the compensation committee generally strives to preserve the tax deductibility of compensation paid, to the extent that this objective does not impair the operation or effectiveness of our executive compensation plan. However, the compensation committee has maintained flexibility to enter into arrangements that may result in payment of non-deductible compensation to management committee members if the compensation committee believes that such non-deductible compensation is in the best interest of the Company. Mr. Neubauer’s current salary is $1,300,000. Because Mr. Neubauer’s 2009 salary exceeded $1 million, a portion of his salary and the value of his perquisites and other benefits would not be deductible under Section 162(m) if Section 162(m) were to apply to us.
Code Sections 280G and 4999. Sections 280G and 4999 of the Internal Revenue Code limit our ability to, respectively, take a tax deduction for certain “excess parachute payments” (as defined in Sections 280G and 4999) and impose excise taxes on each executive that receives “excess parachute payments” in connection with his or her severance from our Company in connection with a change of control of our Company. The compensation committee considered the adverse tax liabilities imposed by Sections 280G and 4999, as well as other competitive factors, when it structured certain post-termination compensation payable to members of our management committee. The potential adverse tax consequences to us and/or the executive, however, are not necessarily determinative factors in such decisions. Our agreements with members of our management committee relating to employment require us to make a gross-up payment to compensate them for any excise taxes (and income taxes on such gross-up payment) that they incur under Section 4999 and other similar local tax laws as a result of these provisions.
Compensation Committee Interlocks and Insider Participation
Mr. Neubauer, who is our Chairman and Chief Executive Officer, serves on the Compensation and Human Resources Committee of Holdings.
Compensation Committee Report
The compensation committee has reviewed the Compensation Discussion and Analysis and discussed that Compensation Discussion and Analysis with management. Based on its review and discussions with management, the compensation committee recommended to our Board of Directors that the Compensation Discussion and Analysis be included in the Company’s Annual Report on Form 10-K for fiscal 2009. This report is provided by the following directors, who constitute the compensation committee:
Robert J. Callander, Chairman
Joseph Neubauer
Leonard S. Coleman, Jr.
Thomas H. Kean
Stephen P. Murray
62
Summary Compensation Table
The following table lists the compensation we paid to our chief executive officer, our chief financial officer and our three other most highly paid executive officers during fiscal 2009, or our “named executive officers” as defined in Item 402 of Regulation S-K. Also included in this table and discussed throughout this disclosure is the one other member of our management committee, Ms. McKee.
| Name and Principal Position |
Year | Salary(1) | Bonus | Stock Awards(2) |
Option Awards(3) |
Change in Pension Value and Non-Qualified Deferred Compensation Earnings(4) |
All Other Compensation(5)(6) |
Total | ||||||||
| (all amounts in dollars) | ||||||||||||||||
| Joseph Neubauer |
2009 | 1,300,000 | 1,950,000 | — | — | 1,686,571 | 239,472 | 5,176,043 | ||||||||
| Chairman and Chief Executive Officer |
2008 | 1,250,000 | 2,100,000 | — | 592,875 | 138,677 | 215,082 | 4,296,634 | ||||||||
| 2007 | 1,000,000 | 2,100,000 | 344,275 | 1,774,563 | 436,302 | 2,767,564 | 8,422,704 | |||||||||
| L. Frederick Sutherland |
2009 | 715,385 | 450,000 | — | 1,379,521 | 12,747 | 53,648 | 2,611,301 | ||||||||
| EVP, Chief Financial Officer and Group Executive, ARAMARK Uniform and Career Apparel |
2008 | 680,577 | 500,000 | 315,000 | 57,160 | 11,549 | 48,672 | 1,612,958 | ||||||||
| 2007 | 622,500 | 575,000 | 1,799,187 | 1,901,211 | 8,513 | 2,265,258 | 7,171,669 | |||||||||
| Andrew Kerin |
2009 | 700,385 | 450,000 | — | 1,090,107 | 6,862 | 33,277 | 2,280,631 | ||||||||
| EVP and President, ARAMARK Global Food, Hospitality and Facilities |
2008 | 660,192 | 500,000 | 305,000 | 46,329 | 5,223 | 35,482 | 1,552,226 | ||||||||
| 2007 | 601,250 | 575,000 | 1,700,754 | 2,184,066 | 3,071 | 2,544,720 | 7,608,861 | |||||||||
| Thomas J. Vozzo |
2009 | 576,154 | 300,000 | — | 1,115,408 | — | 34,506 | 2,026,068 | ||||||||
| EVP and President, ARAMARK Uniform and Career Apparel |
2008 | 558,173 | 400,000 | 262,500 | 46,987 | — | 43,343 | 1,311,003 | ||||||||
| 2007 | 518,750 | 450,000 | 1,628,551 | 2,765,516 | — | 1,895,470 | 7,258,287 | |||||||||
| Ravi Saligram |
2009 | 591,442 | 380,000 | — | 1,008,421 | 2,192 | 29,185 | 2,011,240 | ||||||||
| EVP, President, ARAMARK International and Chief Globalization Officer |
2008 | 565,865 | 450,000 | 175,000 | 42,481 | 2,040 | 26,280 | 1,261,666 | ||||||||
| 2007 | 518,750 | 500,000 | 1,402,770 | 1,991,352 | 1,433 | 1,978,679 | 6,392,984 | |||||||||
| Lynn B. McKee |
2009 | 570,385 | 375,000 | — | 920,563 | 6,775 | 43,885 | 1,916,608 | ||||||||
| EVP, Human Resources |
2008 | 558,173 | 415,000 | 262,500 | 39,830 | 6,032 | 41,267 | 1,322,802 | ||||||||
| 2007 | 518,750 | 475,000 | 1,696,559 | 1,789,037 | 4,390 | 1,941,755 | 6,425,491 | |||||||||
| (1) | All of the members of our management committee except Messrs. Vozzo and Saligram deferred a portion of their fiscal 2009, 2008 and 2007 salaries under the 2007 Savings Incentive Retirement Plan or the 2005 Stock Unit Retirement Plan, the predecessor plan of the 2007 Savings Incentive Retirement Plan, which is also included in the Nonqualified Deferred Compensation Table on page 72. Mr. Saligram deferred a portion of his salary in fiscal 2007 under the 2007 Savings Incentive Retirement Plan and its predecessor, but did not defer salary or bonus in fiscal 2008 or 2009. Mr. Saligram also deferred a portion of his salary in fiscal 2007 under the 2005 Deferred Compensation Plan, which is also reflected in the Nonqualified Deferred Compensation Table. |
| (2) | This column represents the dollar amount recognized for financial statement reporting purposes with respect to the 2008 and 2007 fiscal years for the fair value of restricted stock and restricted stock units granted in 2007, as well as restricted stock units granted in prior fiscal years (in the case of fiscal 2007), in accordance with the authoritative accounting pronouncement for share-based compensation expense. Pursuant to SEC rules, the amounts shown exclude the impact of estimated forfeitures related to service-based vesting conditions. In connection with the going-private transaction, on January 26, 2007, the vesting of all unvested restricted stock units was accelerated, which resulted in share-based compensation expense for the recognition of all unrecognized compensation cost. Unvested restricted stock units vested in accordance with their terms. In addition, due to provisions included in our 2001 Equity Incentive Plan that allowed for the cash settlement of restricted stock units upon a change of control, share-based compensation expense was recognized for the reclassification of restricted stock units from equity awards to liability awards. It was calculated as the difference between the grant-date fair value of the restricted stock unit and $33.80 per share, the price paid for each share of ARAMARK common stock in the going-private transaction. This resulted in a much larger dollar amount of expense for restricted stock units in fiscal 2007 than would have been reported in a year without this type of going-private transaction. For additional information, see Note 11 to the consolidated financial statements. These amounts reflect our accounting expense for these awards, and do not correspond to the actual value that will be recognized by |
63
| the individuals in the table. No restricted stock awards were granted in fiscal 2009 or 2008. See Note 11 to the consolidated financial statements. |
| (3) | This column represents the dollar amount recognized for financial statement reporting purposes with respect to the 2009, 2008 and 2007 fiscal years for the fair value of stock options granted to each of the members of our management committee, in 2009, 2008 and 2007 as well as prior fiscal years (in the case of fiscal 2007), in accordance with the authoritative accounting pronouncement for share-based compensation expense. Due to provisions in Mr. Neubauer’s employment agreement that effectively result in the vesting of all stock options issued to him upon his termination of employment (in most cases) or disability, the authoritative accounting pronouncement for share-based compensation expense requires the Company to expense the full value of his stock options upon grant. Pursuant to SEC rules, the amounts shown exclude the impact of estimated forfeitures related to service-based vesting conditions. In connection with the going-private transaction, on January 26, 2007, the vesting of all unvested stock options was accelerated, which resulted in share-based compensation expense for the recognition of all previously unrecognized compensation cost. In addition, due to provisions included in our 2001 Equity Incentive Plan that allowed for the cash settlement of stock options upon a change of control, share-based compensation expense was recognized for the reclassification of stock options from equity awards to liability awards. For stock options, the reclassification expense was calculated as the excess of (1) the difference between the exercise price and $33.80, the price per share paid in the going-private transaction, over (2) the Black-Scholes grant-date fair value, to the extent that this amount was greater than zero. This resulted in a much larger dollar amount of expense for option awards in fiscal 2007 than would have been reported in a year without this type of going-private transaction. These amounts reflect our accounting expense for these awards, and do not correspond to the actual value that will be recognized by the individuals in the table. See the Grants of Plan-Based Awards Table for information on stock options granted in fiscal 2009. Fiscal 2008 numbers reflect the reversal of previously recognized expense for the performance-based options tied to the EBIT targets for fiscal 2008 through fiscal 2011 because the Company determined that achieving the EBIT targets for fiscal 2008 through fiscal 2011 was not probable. Fiscal 2009 numbers reflect the vesting of 75% of the performance-based stock options that were eligible to vest in fiscal 2009, based on fiscal 2008 performance targets. See “2009 Grants of Plan Based Awards.” For additional information on the valuation assumptions and more discussion with respect to the stock options, refer to Note 11 to the consolidated financial statements. |
| (4) | Includes, for each of those listed in the table, amounts earned on deferred compensation in excess of 120% of the applicable federal rate. Based upon the above-market return at the time the rate basis was set, this column has been corrected for fiscal years prior to fiscal 2009. Also includes, for Mr. Neubauer, $1,645,273 in 2009, $101,087 in 2008 and $409,704 in 2007, which are the aggregate changes in the actuarial present value of his supplemental executive retirement benefit for such years. The amounts attributable to Mr. Neubauer’s earnings on deferred compensation were $41,298 in 2009, $37,590 in 2008 and $26,598 in 2007. See “Employment Agreements and Change of Control Arrangements” on page 68 and “2009 Pension Benefits” on page 71. |
| (5) | The following are included in this column for fiscal 2009: |
| (a) | The aggregate incremental cost to the Company of the following perquisites: car allowance payments or the cost to the Company of providing the management committee member a company leased vehicle (including maintenance and insurance), country club fees or financial planning, fees for an executive physical, premium payments for disability insurance, participation in an excess health insurance plan, personal use of company-owned tickets and parking fees paid by the Company, and, for Mr. Neubauer, personal use of the company aircraft and personal use of a company-provided car and driver. |
| (b) | With regard to Mr. Neubauer, $99,641 for premiums the Company pays for the Survivor Income Protection Plan on Mr. Neubauer’s behalf and $83,969 for Mr. Neubauer’s personal use of the company aircraft. The calculation of incremental cost for personal use of company aircraft includes the variable costs incurred as a result of personal flight activity: a portion of ongoing maintenance and repairs, aircraft fuel, telephone communications and any travel expenses for the flight crew. |
| (c) | With regard to Mr. Sutherland, $15,974 for premiums the Company pays for the Survivor Income Protection Plan on Mr. Sutherland’s behalf. |
| (d) | With respect to each individual listed in the table other than Messrs. Vozzo and Saligram, the amount of company matching contributions to the Savings Incentive Retirement Plan for fiscal 2009 ($8,250). Includes, with respect to Mr. Vozzo, the amount of company matching contributions to the ARAMARK Uniform and Career Apparel Group Retirement Savings Plan for fiscal 2009 ($6,900). |
| (6) | For fiscal 2007, this column includes, among other items, amounts equal to what would have been paid to the members of the management committee (other than Mr. Neubauer) had they been terminated after the change of control or had they chosen to leave 13 months following a change of control in connection with the going-private transaction that was completed on January 26, 2007, as follows: for Mr. Sutherland, $2,210,000, for Mr. Kerin, $2,170,000, for Ms. McKee, $1,900,000, for Mr. Vozzo, $1,850,000, and for Mr. Saligram, $1,900,000. These payments resulted in the reporting of much larger dollar amounts in this column for fiscal 2007 than would otherwise be the case. Also includes in 2007, with respect to Mr. Neubauer, $280,000 for a Hart-Scott-Rodino filing fee and $2,263,776 for going-private transaction-related legal fees, each paid by the Company on Mr. Neubauer’s behalf. Also includes in fiscal 2007, with respect to Mr. Saligram, a payment to Mr. Saligram approved by the compensation committee in November 2007 of $42,655 for costs he incurred (including a tax gross up of $17,465) in connection with options he exercised. |
2009 Grants of Plan-Based Awards
The following table provides information about equity awards granted to our named executive officers and one other member of our management committee in fiscal 2009: (1) the grant date, (2) estimated future payouts under equity incentive plan awards, which consist of the stock options with performance-based vesting schedules, (3) all other option awards, which consist of the number of shares underlying stock options with
64
time-based vesting schedules, (4) the exercise price of the stock option awards, which reflects the appraisal price of Holdings common stock on the date of grant, and (5) the grant date fair value of each equity award computed under the authoritative accounting pronouncement for share-based compensation expense.
All of the grants in the 2009 Grants of Plan Based Awards table and the 2009 Outstanding Equity Awards at Fiscal Year End table refer to grants of options to purchase common stock of Holdings. ARAMARK Corporation no longer has an equity incentive plan and no longer grants any equity awards.
| Name |
Grant Date |
Estimated Future Payouts under Equity Incentive Plan Awards |
All Other Option Awards: Number of Securities Underlying Options(2) |
Exercise or Base Price of Option Awards(3) ($/sh) |
Grant Date Fair Value of Stock and Option Awards(4) |
||||||||||||||
| Threshold(#) | Target(1)(#) | Max(#) | |||||||||||||||||
| Neubauer |
12/10/08 | (6) | 42,188 | (6) | $ | 10.00 | $ | 108,856 | (6) | ||||||||||
| 12/10/08 | (7) | 14,063 | (7) | $ | 14.30 | $ | 7,952 | (7) | |||||||||||
| Sutherland |
|||||||||||||||||||
| 12/10/08 | (5) | 93,023 | (5) | $ | 10.00 | $ | 225,126 | (5) | |||||||||||
| 12/10/08 | (6) | 33,750 | (6) | $ | 10.00 | $ | 87,085 | (6) | |||||||||||
| 12/10/08 | (7) | 7,031 | (7) | $ | 14.30 | $ | 3,976 | (7) | |||||||||||
| 9/2/09 | 100,000 | $ | 13.15 | $ | 525,000 | ||||||||||||||
| 9/2/09 | 0 | 100,000 | 100,000 | $ | 13.15 | $ | 516,000 | ||||||||||||
| Kerin |
|||||||||||||||||||
| 12/10/08 | (5) | 66,258 | (5) | $ | 10.00 | $ | 160,351 | (5) | |||||||||||
| 12/10/08 | (6) | 32,813 | (6) | $ | 10.00 | $ | 84,666 | (6) | |||||||||||
| 12/10/08 | (7) | 7,031 | (7) | $ | 14.30 | $ | 3,976 | (7) | |||||||||||
| 9/2/09 | 100,000 | $ | 13.15 | $ | 525,000 | ||||||||||||||
| 9/2/09 | 0 | 100,000 | 100,000 | $ | 13.15 | $ | 516,000 | ||||||||||||
| Vozzo |
|||||||||||||||||||
| 12/10/08 | (5) | 74,238 | (5) | $ | 10.00 | $ | 179,664 | (5) | |||||||||||
| 12/10/08 | (6) | 30,000 | (6) | $ | 10.00 | $ | 77,409 | (6) | |||||||||||
| 12/10/08 | (7) | 4,688 | (7) | $ | 14.30 | $ | 2,651 | (7) | |||||||||||
| 9/2/09 | 25,000 | $ | 13.15 | $ | 131,250 | ||||||||||||||
| 9/2/09 | 0 | 25,000 | 25,000 | $ | 13.15 | $ | 129,000 | ||||||||||||
| Saligram |
|||||||||||||||||||
| 12/10/08 | (5) | 64,863 | (5) | $ | 10.00 | $ | 156,976 | (5) | |||||||||||
| 12/10/08 | (6) | 28,125 | (6) | $ | 10.00 | $ | 72,571 | (6) | |||||||||||
| 12/10/08 | (7) | 5,625 | (7) | $ | 14.30 | $ | 3,181 | (7) | |||||||||||
| 9/2/09 | 25,000 | $ | 13.15 | $ | 131,250 | ||||||||||||||
| 9/2/09 | 0 | 25,000 | 25,000 | $ | 13.15 | $ | 129,000 | ||||||||||||
| McKee |
|||||||||||||||||||
| 12/10/08 | (5) | 57,363 | (5) | $ | 10.00 | $ | 138,825 | (5) | |||||||||||
| 12/10/08 | (6) | 28,125 | (6) | $ | 10.00 | $ | 72,571 | (6) | |||||||||||
| 12/10/08 | (7) | 4,688 | (7) | $ | 14.30 | $ | 2,651 | (7) | |||||||||||
| (1) | Management committee members may receive all or less than all of the target amount of performance-based options when certain events occur, including the achievement of certain percentage returns by our sponsors. See the discussion under “Compensation Discussion and Analysis—Components of Executive Compensation—Equity Incentives” above. Consists of shares underlying options granted that vest in 25% increments on each of the first four anniversaries of the date of grant and upon the attainment of certain EBIT targets that are set forth in the Option Agreements and described in the Compensation Discussion and Analysis and the narrative to the table. These stock options will expire ten years from the date of grant. |
| (2) | These stock options vest 25% per year over 4 years and have a ten year term. |
| (3) | The exercise price of the options reported in the table is the appraisal price of a share of Holdings common stock on the original date of grant. |
65
| (4) | This column shows the full grant date fair value of stock options granted to the members of our management committee in fiscal 2009 under the authoritative accounting pronouncement for share-based compensation expense. No restricted stock was granted in fiscal 2009. For additional information on the valuation assumptions, refer to Note 11 to the consolidated financial statements. These amounts reflect the accounting expense, and do not correspond to the actual value that will be recognized by the management committee members. |
| (5) | Represents the incremental fair value attributable to the 75% of eligible performance-based stock options originally granted on 1/26/07 whose vesting was subject to the achievement of the 2008 EBIT target, and for which the Board waived the attainment of the EBIT target as a condition to vesting. See discussion below. |
| (6) | Represents the incremental fair value attributable to the 75% of eligible performance-based stock options originally granted on 2/27/07 whose vesting was subject to the achievement of the 2008 EBIT target, and for which the Board waived the attainment of the EBIT target as a condition to vesting. See discussion below. |
| (7) | Represents the incremental fair value attributable to the 75% of eligible performance-based stock options originally granted on 3/5/08 whose vesting was subject to the achievement of the 2008 EBIT target, and for which the Board waived the attainment of the EBIT target as a condition to vesting. See discussion below. |
The performance targets for 50% of the stock options granted to members of our management committee are based upon our annual EBIT. If we do not achieve the performance target for any particular fiscal year (other than that of the “Final Fiscal Year” for each grant, as defined below), but we do achieve a cumulative performance target at the end of a later fiscal year, then all installments of performance-based options that did not become vested because of a missed performance target or targets in a prior year will vest. Our EBIT targets over the four-year vesting schedule of options granted to our management committee members in fiscal 2007 are as follows (in $ millions):
| Year |
Annual EBIT Target | Cumulative EBIT Target | ||||
| 2007 |
$ | 705.1 | N.A. | |||
| 2008 |
$ | 755.1 | $ | 1,460.2 | ||
| 2009 |
$ | 779.3 | $ | 2,239.4 | ||
| 2010 (the “Final Fiscal Year”) |
$ | 718.1 | $ | 2,957.5 | ||
Our EBIT targets over the four-year vesting schedule of options granted to our management committee members in fiscal 2008 are as follows (in $ millions):
| Year |
Annual EBIT Target | Cumulative EBIT Target | ||||
| 2008 |
$ | 755.1 | N.A. | |||
| 2009 |
$ | 779.3 | $ | 1,534.3 | ||
| 2010 |
$ | 718.1 | $ | 2,252.4 | ||
| 2011 (the “Final Fiscal Year”) |
$ | 959.4 | $ | 3,211.8 | ||
Our EBIT targets over the four-year vesting schedule of options granted to our management committee members in fiscal 2009 are as follows (in $ millions):
| Year |
Annual EBIT Target | Cumulative EBIT Target | ||||
| 2010 |
$ | 718.1 | N.A. | |||
| 2011 |
$ | 959.4 | $ | 1,677.5 | ||
| 2012 |
$ | 1,016.0 | $ | 2,693.5 | ||
| 2013 (the “Final Fiscal Year”) |
$ | 1,076.0 | $ | 3,769.6 | ||
When we calculate our EBIT (which calculation is subject to review and approval by the compensation committee) for purposes of determining whether we have achieved our annual EBIT target, we take our net income and increase it by: (1) net interest expense and (2) the provision for income taxes. We are then required to exclude a number of categorical amounts as follows:
| • | any extraordinary gains or losses, cumulative effect of a change in accounting principle, income or loss from disposed or discontinued operations and any gains or losses on disposed or discontinued operations, all as determined in accordance with generally accepted accounting principles; |
66
| • | any gain or loss greater than $2 million attributable to asset dispositions, contract terminations and similar items, provided that losses on contract terminations and asset dispositions in connection with client contract terminations are limited in any given fiscal year to $5 million; |
| • | any increase in amortization or depreciation resulting from the application of purchase accounting to the going-private transaction, including the current amortization of existing acquired intangibles; |
| • | any gain or loss from the early extinguishment of indebtedness including any hedging obligation or other derivative instrument; |
| • | any impairment charge or similar asset write off required by generally accepted accounting principles; |
| • | any non cash compensation expense resulting from the application of the authoritative accounting pronouncement for share-based compensation expense or similar accounting requirements; |
| • | any expenses or charges related to any equity offering, acquisition, disposition, recapitalization, refinancing or similar transaction, including the going-private transaction; |
| • | any transaction, management, monitoring, consulting, advisory and related fees and expenses paid or payable to the sponsors; |
| • | the effects of changes in foreign currency translation rates from the rates used in the calculation of the EBIT targets; and |
| • | the impact of the 53rd week of operations on the Company’s financial results during fiscal 2008. |
Our calculation of EBIT is adjusted for acquisitions as follows:
| • | for small acquisitions, which have purchase prices of less than $20 million each, there is no adjustment until the total consideration for all small acquisitions exceeds $20 million in any fiscal year, and then the EBIT targets will be adjusted for the percentage of EBIT that results from the cumulative amounts of such acquisitions over $20 million; and |
| • | for larger acquisitions, which have purchase prices of more than $20 million, our EBIT targets are adjusted based on the amount of EBIT that we project for that acquisition when it is approved by our board. |
Our calculation of EBIT also is adjusted when we sell a business by an amount equal to the last twelve months earnings of the divested business.
The terms of the performance targets and calculation of EBIT, including the adjustments, were initially negotiated with the Sponsors in connection with the going-private transaction and were approved by the Holdings board in connection with the closing of the going-private transaction and subsequently modified twice in 2007. The EBIT targets were also modified in November 2008 and in December 2009 to reflect acquisitions and divestitures, pursuant to the terms of the Non-Qualified Stock Option Agreements. The EBIT targets are intended to measure achievement of the plan presented by ARAMARK to the Sponsors at the time of the negotiation of the going-private transaction, as modified in response to changed circumstances, and the adjustments to EBIT described above primarily represent elements of ARAMARK’s performance that are either beyond the control of management or were not predictable at the time the targets were set. On December 10, 2008, the Holdings board approved new annual and cumulative targets for fiscal 2009 that were revised to recognize the effects of the economic turmoil on the Company’s business and correspondingly reduced the cumulative targets for 2010 and beyond. The 2013 EBIT target, which originally was $1,074.1 million and which applies to option grants made beginning September 2, 2009, was approved by the board in August 2009. The 2013 EBIT target was modified for acquisitions in December 2009 and is now $1,076.0 million.
67
Although in fiscal 2008 ARAMARK did not achieve the 2008 EBIT target, the Holdings board, after considering, among other things: (1) the challenging economic circumstances facing the Company that were not contemplated at the time the performance targets were originally set and (2) the performance of the Company during fiscal 2008 including the fact that the 2008 EBIT target was almost achieved, determined that management’s performance during the period deserved to be rewarded and decided to waive the requirement that the Company achieve the performance target with respect to 75% of the portion of the performance-based stock options whose vesting was subject to the achievement of the 2008 EBIT target including performance-based stock options held by the named executive officers.
The Company did not achieve the 2009 EBIT target in fiscal 2009. After considering, among other things: (1) the challenging economic circumstances facing the Company that were not contemplated at the time the performance targets were originally set and (2) management’s efforts in particularly difficult economic circumstances, the Holdings board determined that management’s performance during fiscal 2009 deserved to be rewarded and decided to waive the requirement that the Company achieve the performance target with respect to 35% of the portion of the performance-based stock options whose vesting was subject to the achievement of the 2009 EBIT target, including performance-based stock options held by the named executive officers. Accordingly, such portion of the performance-based options will vest when the time-based vesting requirement of such options is satisfied (e.g. for options granted in January and February 2007 the vesting date for such performance-based options will be January 26, 2010).
On December 9, 2009, the Holdings board approved a new annual target for fiscal 2010 that was revised to recognize the effects of the current economic circumstances on the Company’s business.
The above performance targets do not represent a prediction of how ARAMARK will perform during the fiscal years 2010 through 2013. ARAMARK is not providing any guidance, nor updating any prior guidance, of its future performance with the disclosure of these performance targets, and you are cautioned not to rely on these performance targets as a prediction of ARAMARK’s future performance.
Some or all of the performance-based options also will vest when certain other events occur, including the achievement of a return or internal rate of return by our sponsors. For example, if our sponsors were to sell a portion of their investment in Holdings and, in connection with that sale, achieve an internal rate of return on or after the third anniversary of the grant date of the options equal to 22%, or prior to the third anniversary of the grant date, that equals or exceeds 200% of that sponsor’s investment, the sale would be a qualified partial liquidity event and a percentage of the unvested performance-based options will vest. The percentage will be based upon the percentage of our sponsors’ interest in Holdings that was sold in the qualified partial liquidity event. In addition, if there is a change of control of Holdings in which our sponsors do not achieve the return or internal rate of return described above, a portion of the unvested performance-based options will vest, with the percentage vesting based upon the percentage of eligible performance-based options that had previously vested. Finally, upon death, disability or retirement (attaining at least age 60 with five years of service), unvested performance-based options that would have vested during the twelve month period immediately following termination had the termination not occurred during that period will vest if the performance targets for that period are satisfied. Time-based options that would have vested in the year following retirement, death or disability would also vest according to the vesting schedule. In addition, if employment terminates due to death, disability or retirement, the exercise period for vested options is 1 year, rather than the 90-day period that is otherwise available for terminations other than for cause.
Employment Agreements and Change of Control Arrangements
We have agreements with all of the members of our management committee for indeterminate periods terminable by either party, in most cases subject to post-employment severance and benefit obligations. While we do have these agreements in place, from time to time, it has been necessary to renegotiate some terms upon actual termination.
68
For more information regarding change of control and severance payments for members of our management committee, see the disclosure under “Potential Post Employment Benefits” on page 73.
Mr. Neubauer
Under Mr. Neubauer’s employment agreement, he receives a base salary of $1,300,000, which is reviewed annually by the compensation committee in connection with its review of Mr. Neubauer’s performance. The compensation committee can increase, but not decrease, his salary in its discretion. Mr. Neubauer’s bonus is determined by the compensation committee pursuant to the terms of the Company’s Senior Executive Annual Performance Bonus Plan and Mr. Neubauer is eligible to participate in the Company’s equity plan and all retirement and welfare programs applicable to senior executives of the Company. Mr. Neubauer’s agreement provides for two year’s advance notice of termination, either by us or by him. Mr. Neubauer’s employment agreement also provides that he will receive a supplemental retirement benefit for the duration of his life following his termination of employment, with a 50% survivor benefit for his surviving spouse for her lifetime, which is described more fully in “2009 Pension Benefits” below. Mr. Neubauer’s employment agreement provides for certain payments upon termination that are more fully discussed in the “Potential Post Employment Benefits” section below.
During his employment term and for a period of two years thereafter, Mr. Neubauer is subject to a non-competition covenant according to which he would be restricted from associating with or acquiring or maintaining an ownership interest in a competing business. We have agreed to use our best efforts to cause Mr. Neubauer to be a member of our board during the term of Mr. Neubauer’s employment agreement. In addition, if any payment or benefit payable to Mr. Neubauer after a change in ownership or control of the Company would be considered a parachute payment subject to a federal excise tax, then we will pay Mr. Neubauer an additional payment or benefit to gross-up the amount of the excise tax. This gross up provision in Mr. Neubauer’s agreement ensures that he would receive the full benefit of payments related to a change of control.
Other management committee members
In connection with the going-private transaction, we entered into new employment agreements relating to employment and post-employment competition with Messrs. Sutherland, Kerin, Vozzo and Saligram and Ms. McKee in July 2007. If any of the management committee members is terminated without “cause,” the agreements generally provide for severance payments on the basis of continuous service, generally equal to between 6 and 18 months of pay, plus the continuation of certain other benefits, including basic group medical and life insurance coverage, during the period of such payment. All of the members of the management committee would be entitled to an 18-month severance period. The agreements contain non-competition provisions pursuant to which the management committee member would be restricted from associating with or acquiring or maintaining an ownership interest in a competing business for a period of two years (or one year if employment is terminated by us other than for cause or is terminated by the employee for good reason after a change of control).
If ARAMARK or Holdings experiences a change of control as described in the agreements, these executives also would be entitled to lump sum payments and severance if their employment is terminated under certain circumstances. The agreements provide a payout in the event of a change of control based on a “double trigger” (more fully described under “Potential Post Employment Benefits”). The agreements, including the “double trigger” provision, were negotiated with the sponsors in connection with the going-private transaction. These provisions are intended to align executive and shareholder interests by enabling executives to consider corporate transactions that are in the best interests of the shareholders and other constituents of the Company without undue concern over whether the transactions may jeopardize the executives’ own employment. More detail on amounts and benefits in connection with termination, after a change of control or otherwise, is included in the Potential Post Employment Benefits section below.
69
Indemnification Agreements
We have entered into Indemnification Agreements with our executive officers, among others, that provide substantially similar rights to which they are currently entitled pursuant to the Company’s certificate of incorporation and by-laws and that spell out further the procedures to be followed in connection with indemnification.
2009 Outstanding Equity Awards at Fiscal Year-End
The following table provides information with respect to holdings of stock options by our named executive officers and one other member of our management committee at 2009 fiscal year-end.
| Option Awards | |||||||||||
| Name |
Number of Securities Underlying Unexercised Options Exercisable(1) |
Number of Securities Underlying Unexercised Options Unexercisable(2) |
Equity Incentive Plan Awards: Number of Securities Underlying Unexercised Unearned Options(3) |
Option Exercise Price |
Option Expiration Date | ||||||
| Neubauer |
210,938 | 112,500 | 126,562 | $ | 10.00 | 2/27/17 | |||||
| 32,813 | 56,250 | 60,937 | $ | 14.30 | 3/5/18 | ||||||
| Sutherland |
465,117 | 248,063 | 279,070 | $ | 10.00 | 1/26/17 | |||||
| 168,750 | 90,000 | 101,250 | $ | 10.00 | 2/27/17 | ||||||
| 16,407 | 28,125 | 30,468 | $ | 14.30 | 3/5/18 | ||||||
| 100,000 | 100,000 | $ | 13.15 | 9/2/19 | |||||||
| Kerin |
331,287 | 176,689 | 198,774 | $ | 10.00 | 1/26/17 | |||||
| 164,063 | 87,500 | 98,437 | $ | 10.00 | 2/27/17 | ||||||
| 16,407 | 28,125 | 30,468 | $ | 14.30 | 3/5/18 | ||||||
| 100,000 | 100,000 | $ | 13.15 | 9/2/19 | |||||||
| Vozzo |
371,190 | 197,970 | 222,716 | $ | 10.00 | 1/26/17 | |||||
| 150,000 | 80,000 | 90,000 | $ | 10.00 | 2/27/17 | ||||||
| 10,938 | 18,750 | 20,312 | $ | 14.30 | 3/5/18 | ||||||
| 25,000 | 25,000 | $ | 13.15 | 9/2/19 | |||||||
| Saligram |
324,315 | 172,970 | 194,591 | $ | 10.00 | 1/26/17 | |||||
| 140,625 | 75,000 | 84,375 | $ | 10.00 | 2/27/17 | ||||||
| 13,125 | 22,500 | 24,375 | $ | 14.30 | 3/5/18 | ||||||
| 25,000 | 25,000 | $ | 13.15 | 9/2/19 | |||||||
| McKee |
286,815 | 152,970 | 172,091 | $ | 10.00 | 1/26/17 | |||||
| 140,625 | 75,000 | 84,375 | $ | 10.00 | 2/27/17 | ||||||
| 10,938 | 18,750 | 20,312 | $ | 14.30 | 3/5/18 | ||||||
| (1) | These are both time-based and performance-based options that have vested. |
| (2) | These are options subject to time-based vesting and generally vest 25% per year over four years from the date of grant, provided that the management committee member is still employed by us. Stock options with an expiration date of January 26, 2017 were granted on January 26, 2007 and vest 25% on each of the first four anniversaries of the date of grant. Stock options with an expiration date of February 27, 2017 vest 25% on each of the first four anniversaries of January 26, 2007. Stock options with an expiration date of March 5, 2018 were granted on March 5, 2008 and vest 25% on each of the first four anniversaries of the date of grant. Stock options with an expiration date of September 2, 2019 were granted on September 2, 2009 and vest 25% on each of the first four anniversaries of the date of grant. |
| (3) | These options are subject to performance-based vesting and will vest 25% per year over four years, provided that certain performance targets are satisfied and the management committee member is still employed by us, with certain exceptions (disability, retirement or death). See the narrative following the “2009 Grants of Plan-Based Awards” table. |
70
2009 Options Exercised and Stock Vested
None of the members of our management committee (including our named executive officers) exercised stock options or had stock vest in fiscal 2009.
2009 Pension Benefits
Mr. Neubauer is the only member of our management committee who has a supplemental executive retirement benefit. He has been employed by us since 1979 and an earlier version of the benefit was included in his employment agreement when he was promoted to chief executive officer in 1983 (and in subsequent employment agreements he has entered into with us). His right to the benefit vested in 1988. The supplemental executive retirement benefit entitles him to receive benefits beginning on his termination of employment for any reason or on his retirement. The annual benefit, which is payable in monthly installments, equals 50% of Mr. Neubauer’s base salary plus 50% of his average bonus, calculated based on his bonus from 2001-2003, or the three full years immediately preceding his retirement, whichever is greater. Mr. Neubauer will receive the retirement benefit for the remainder of his life and, upon his death, his surviving spouse would receive one-half of the benefit for the remainder of her life. This benefit will be paid to Mr. Neubauer, or his surviving spouse, according to our normal payroll cycle. Any amounts payable under the Survivor Income Protection Plan will reduce Mr. Neubauer’s retirement benefit. If Mr. Neubauer experiences a permanent disability, this benefit would commence immediately. The table below lists the present value of his benefit, which is set forth in his employment agreement with the Company, rather than an actual plan document.
| Name |
Plan Name(1) | Number of Years of Credited Service (#)(2) |
Present Value of Accumulated Benefit ($)(3) |
Payments During Last Fiscal Year ($) | |||||
| Neubauer |
N/A | N/A | $ | 17,924,713 | — | ||||
| (1) | Mr. Neubauer is entitled to this benefit under his employment agreement with the Company. |
| (2) | Mr. Neubauer’s right to the benefit vested in 1988 and credited service is not taken into account in determining the amount of the benefit. |
| (3) | The assumptions used in determining the present value of the future payments for the supplemental retirement benefit as of October 2, 2009 are as follows: (a) a discount rate of 5.25%; (b) mortality assumption based on the UP-94 mortality table; (c) payment as a monthly annuity as described above; and (d) his applicable base salary and average bonus figures. The actuarial present value is calculated assuming a retirement age equal to two years past his current age, which represents the period that notice is required to be provided for termination under his employment agreement. The assumptions are adjusted annually, based on prevailing market conditions and actual experience. |
71
2009 Non Qualified Deferred Compensation
The members of our management committee other than Mr. Vozzo are eligible to participate in two deferred compensation plans: the 2007 Savings Incentive Retirement Plan and the 2005 Deferred Compensation Plan, each of which is discussed in “Other Components of Compensation” in the Compensation Discussion and Analysis above. Mr. Vozzo is eligible to participate in the 2005 Deferred Compensation Plan or its predecessor plans and the Company’s uniform division’s 401(k) plan. Members of the management committee participated in predecessor plans to the 2007 Savings Incentive Retirement Plan and the 2005 Deferred Compensation Plan and retain balances in these older plans, all of which are reflected in the table.
| Name |
Executive Contributions in Last FY ($)(1) |
Registrant Contributions in Last FY ($)(2) |
Aggregate Earning in Last FY ($)(3) |
Aggregate Withdrawals/ Distributions ($) |
Aggregate Balance at Last FYE ($)(3) | |||||
| Neubauer |
||||||||||
| SIRP |
130,000 | 8,250 | 342,895 | — | 4,408,484 | |||||
| Deferred Comp Plan |
— | — | 167,470 | — | 2,119,129 | |||||
| Sutherland |
||||||||||
| SIRP |
42,635 | 8,250 | 157,531 | — | 2,022,784 | |||||
| Deferred Comp Plan |
— | — | — | — | — | |||||
| Kerin |
||||||||||
| SIRP |
173,833 | 8,250 | 84,807 | — | 1,165,194 | |||||
| Deferred Comp Plan |
— | — | — | — | — | |||||
| Vozzo |
— | — | — | — | — | |||||
| Saligram |
||||||||||
| SIRP |
— | — | 17,219 | — | 217,887 | |||||
| Deferred Comp Plan |
— | — | 9,876 | — | 124,966 | |||||
| McKee |
||||||||||
| SIRP |
34,154 | 8,250 | 83,731 | — | 1,084,713 | |||||
| Deferred Comp Plan |
— | — | — | — | — | |||||
| (1) | All amounts in this column were deferred under the 2007 Savings Incentive Retirement Plan during fiscal 2009. All amounts deferred are included in the management committee member’s salary amount in the Summary Compensation Table. |
| (2) | With respect to members of the management committee, other than Mr.Vozzo (who participates in one of our 401(k) plans), constitutes the company match for fiscal 2009 which was made in November 2009. These amounts were reported in the Summary Compensation Table. |
| (3) | Messrs. Neubauer and Saligram have balances in both the 2007 Savings Incentive Retirement Plan and the 2005 Deferred Compensation Plan, or its predecessors. Our Summary Compensation Table for previous years included the amount of salary deferred and company match for those years. To the extent that earnings for the 2007 Savings Incentive Retirement Plan and the 2005 Deferred Compensation Plan exceeded 120% of the applicable federal rate, those excess earnings were reported in the Summary Compensation Table. |
The 2007 Savings Incentive Retirement Plan enables members of our management committee to defer up to 25% of their base salaries, which become unfunded deferral obligations of ARAMARK. We credit amounts deferred with interest at the Moody’s Long Term Corporate Baa Bond Index rate for October of the previous year; the rate was 8.88% for 2009. From October 3, 2008 until December 31, 2008, we credited amounts deferred with an interest rate equal to 6.48%. Employees who participate in the 2007 Savings Incentive Retirement Plan are eligible to receive a company matching contribution equal to 25-75% of the first 6% of their salary deferred up to the Internal Revenue Code maximum deferral limit ($16,500 for fiscal 2009). This match is intended to replicate what the employee would have received if he or she had been able to participate in our 401(k) plans. For fiscal 2009, the company matching contribution was 50%. Mr. Vozzo, who is a member of our management committee, is not eligible to participate in the 2007 Savings Incentive Retirement Plan, but is able to participate
72
in the 401(k) plan in our uniform division. His salary deferrals also are eligible for a company match at the same percentage as deferrals under the 2007 Savings Incentive Retirement Plan. The 2007 Savings Incentive Retirement Plan is settled in cash following termination of employment and in compliance with certain requirements of Section 409A of the Internal Revenue Code.
Management committee members may defer receipt of part or all of their cash compensation under our 2005 Deferred Compensation Plan. This Plan allows executives to save for retirement in a tax-deferred way at minimal cost to the Company. Under this unfunded Plan, amounts deferred by the executive are credited at an interest rate based on Moody’s Long Term Corporate Baa Bond Index rate for October of the previous year, which was 8.88% beginning January 1, 2009. From October 3, 2008 until December 31, 2008, we credited amounts deferred with an interest rate equal to 6.48%. Effective January 1, 2010, the rate for both the 2007 Savings Incentive Retirement Plan and the 2005 Deferred Compensation Plan will be adjusted to 6.29%, the Moody’s Long Term Corporate Baa Bond Index rate for October 2009. The 2005 Deferred Compensation Plan permits participants to select a payment schedule at the time they make their deferral election, subject to a three-year minimum deferral period as long as the participant remains employed by the Company.
Potential Post Employment Benefits
Members of our management committee may be eligible to receive benefits in the event their employment is terminated (1) upon their retirement, disability or death, (2) by ARAMARK without cause, (3) in certain circumstances following a change of control. The amount of benefits will vary based on the reason for the termination.
The following sections present a discussion and calculations, as of October 2, 2009, of the estimated benefits the members of our management committee would receive in these situations. Although the calculations are intended to provide reasonable estimates of the potential benefits, they are based on numerous assumptions discussed in the footnotes to the table and may not represent the actual amount an executive would receive if an eligible termination event were to occur.
In addition to the amounts disclosed in the following sections, each management committee member would retain the amounts which he or she has earned or accrued over the course of his or her employment prior to the termination event, such as the executive’s balances under our deferred compensation plans and, on death, disability and termination other than for cause, the proceeds of previously vested stock options and on death, disability or retirement, the proceeds of one additional tranche of unvested time-based options that will vest and the proceeds of any unvested performance-based options that would have otherwise vested in the year following termination. Mr. Neubauer is entitled to his supplemental executive retirement benefit upon his termination of employment. For further information about previously earned and accrued amounts, see “Summary Compensation Table,” “Outstanding Equity Awards at Fiscal Year-End,” “2009 Pension Benefits” and “2009 Non Qualified Deferred Compensation.”
Retirement, Death, Disability
Mr. Neubauer has an employment agreement with us under which he is entitled to receive benefits from a supplemental executive retirement benefit upon his termination of employment or retirement. See “2009 Pension Benefits” for more information on Mr. Neubauer’s supplemental retirement benefit.
Mr. Neubauer’s employment agreement provides that, upon his death, his estate will receive his accrued but unpaid salary and vacation and a portion of his average bonus prorated for the portion of the then current fiscal year, calculated based on his bonus from 2001-2003, or the three full years immediately preceding his termination, whichever is greater. In the event of his death, Mr. Neubauer’s stock options will be treated in accordance with the terms of the Holdings 2007 Management Stock Incentive Plan, meaning his estate or designated beneficiary will receive one additional vested tranche of time-based options and will have one year to
73
determine if an additional tranche of 25% of performance-based options will vest. His vested options will be exercisable for one year following his death. His surviving spouse will receive her portion of the supplemental retirement benefit described above.
If Mr. Neubauer is unable to engage in any substantial gainful activity by reason of any medically determinable physical or mental impairment which can be expected to result in death or can be expected to last for a continuous period of not less than 12 months, or if Mr. Neubauer is, by reason of any such condition, receiving income replacement benefits for a period of not less than 3 months under an accident and health plan, he will be considered permanently disabled and will receive all accrued but unpaid salary and vacation, continuation of salary for three years (offset by any amounts received under the survivor income protection plan and any disability plans), a portion of his bonus prorated for the portion of the then current fiscal year, calculated based on his average bonus from 2001-2003, or the three full years immediately preceding his termination, whichever is greater. In addition, all stock options held by Mr. Neubauer will become vested and immediately exercisable, but will remain subject to the terms of the Holdings 2007 Management Stock Incentive Plan. Accelerated vesting will occur for both Mr. Neubauer’s time-based and performance-based stock options. In addition, Mr. Neubauer may participate in the Executive Health Plan at his own expense for a period of three years following his permanent disability. Mr. Neubauer’s benefits on permanent disability would be in addition to amounts he would receive under the supplemental retirement benefit described above.
The other members of our management committee do not receive any special benefits upon retirement, disability or death, other than those under the Survivor Income Protection Plan and/or life insurance, as applicable, in the case of death as more fully described in the “Other Components of Compensation” section of the Compensation Discussion and Analysis, or with regard to their stock options that are more fully described above.
Termination for Cause, Resignation without Good Reason
If Mr. Neubauer’s employment is terminated by us for cause or if Mr. Neubauer resigns from ARAMARK without good reason, his employment agreement entitles him to receive accrued but unpaid base salary and vacation, a portion of his bonus prorated for the portion of the then current fiscal year, calculated based on his average bonus from 2001-2003, or the three full years immediately preceding his termination, whichever is greater, and his supplemental retirement benefit described above. Mr. Neubauer may also continue participation in the Executive Health Plan at his own expense for three years following his termination for cause or resignation without good reason. In addition, all of Mr. Neubauer’s stock options would remain subject to the terms of the Holdings 2007 Management Stock Incentive Plan. If Mr. Neubauer resigns without good reason two years following his notice to the Company of his intent to do so, all of his stock options will vest and become immediately exercisable upon the effective date of his resignation. If Mr. Neubauer does not provide two years’ notice of his intent to resign, his stock options will not be subject to accelerated vesting. Termination for cause means termination by the Holdings board for Mr. Neubauer’s willful failure to perform his duties or his willful misconduct that materially injures our reputation or financial condition, in each case if he fails to cure within 30 days of receiving notice of the events or circumstances that the board deems to be willful failure or willful misconduct. Good reason includes our material breach of his employment agreement and our failure to cure that breach or Mr. Neubauer’s resignation within 12 months after a change of control, which is defined below.
The other members of our management committee are not entitled to any benefits under their employment agreements upon termination for cause or resignation without good reason. With respect to the other members of our management committee, termination for cause means termination of employment due to conviction or plea of nolo contendere to a felony, intentional fraud or dishonesty with regard to ARAMARK that causes demonstrable harm to ARAMARK, willful and continuous failure to perform his or her duties, willful violation of ARAMARK’s Business Conduct Policy that causes material harm to ARAMARK or intentionally working against the best interests of ARAMARK, in each case after notice and failure to cure the conduct within 10 business days. Members of our management committee are subject to a two-year non competition prohibition if their employment is terminated for cause or they resign without good reason.
74
Termination without Cause
If Mr. Neubauer’s employment is terminated by us without cause, he is entitled to the following payments and benefits:
| • | A pro rata bonus for the year of termination based on his average bonus over the three immediately preceding years (or, if higher, 2001-2003); |
| • | Lump sum payments of two times his base salary; |
| • | A lump sum payment of two times his average bonus for the three years prior to his termination (or, if higher, his average bonus from 2001-2003); |
| • | The supplemental retirement benefit mentioned above; |
| • | Participation in the Company’s survivor income protection plan, if applicable, certain health and welfare plans and other perquisites (such as his company car) for up to three years; |
| • | Full vesting of his stock options—both time-based and performance-based stock options; |
| • | Participation in the Company’s Executive Health Plan at his own expense for three years; and |
| • | Other accrued but unpaid salary and benefits. |
If Mr. Neubauer’s termination occurs at least two years after our notice to Mr. Neubauer of our intent to terminate his employment, it will be considered an “Involuntary Termination with Notice” under his agreement and he will not receive the lump sum payment of two times his base salary and bonus or other perquisites, but will receive the other benefits outlined above.
If we terminate one of our other management committee members without cause, he or she will receive:
| • | Severance payments equal to his or her monthly base salary for 6 to 18 months, graduated depending on number of years of service (with less than 2 years of service entitling the management committee member to 6 months of severance and 5 or more years of service entitling the management committee member to 18 months of severance), made in the course of our normal payroll cycle (all members of our management committee would be entitled 18 months of severance); |
| • | Participation in our basic medical and life insurance programs during the period over which he or she receives severance payments, with the employee share of premiums deducted from the severance payments; |
| • | Use of his or her company car or continuation of his or her car allowance payments, as applicable, during the severance period; and |
| • | All of his or her vested stock options. |
Members of our management committee other than Mr. Neubauer are subject to a one-year non-competition covenant if their employment is terminated without cause or they terminate for good reason prior to January 26, 2010, or after a future change of control.
Resignation for Good Reason and Termination or Resignation for Good Reason after a Change of Control
As mentioned above, Mr. Neubauer may resign for good reason if we materially breach his employment agreement and fail to cure or Mr. Neubauer resigns within 12 months after a change of control. A change of control under Mr. Neubauer’s employment agreement includes a person’s acquisition of 35% or more of our outstanding voting stock, the change in a majority of our board membership over a two-year period, a sale or disposition of substantially all of our income-producing assets or property, the merger or consolidation of ARAMARK with another company and with our shareholders owning less than 50% of the voting stock of the surviving corporation after the merger or a change of control as defined by Form 8-K. A change of control will
75
not be deemed to have occurred under Mr. Neubauer’s employment agreement if Mr. Neubauer is a member of the group whose transaction with ARAMARK or its stockholders would result in the change of control. If Mr. Neubauer resigns for good reason, he is entitled to the amounts set forth above under the heading “termination without cause.” This would constitute a “single trigger” since Mr. Neubauer can resign for any reason within 12 months after a change of control and be paid out under his agreement. This “single trigger” provision has been included in Mr. Neubauer’s agreement for at least the past 10 years and was not triggered by the going-private transaction.
In connection with the going-private transaction, the members of our management committee other than Mr. Neubauer received payments and restricted stock equal to the value that they would have received had they been terminated after the change of control that occurred on January 26, 2007. Therefore, if one of our other management committee members resigns for good reason prior to January 26, 2010 and there has not been another change of control, he or she will not be entitled to severance payments, but will be entitled to receive all of his or her vested stock options, as well as medical, life insurance and disability coverage at the same level provided by us prior to the closing of the going-private transaction on January 26, 2007 for two years following his or her resignation for good reason. Good reason is defined in their agreements as any of the following actions occurring after a change of control:
| • | A decrease in base salary or target bonus; |
| • | A material decrease in aggregate employee benefits; |
| • | Diminution in title or substantial diminution in reporting relationship or responsibilities; or |
| • | Relocation of the management committee member’s principal place of business by 35 miles or more. |
With respect to each of our management committee members other than Mr. Neubauer, a change of control is deemed to occur if:
| • | an entity or group other than our sponsors acquire more than 50% of the Company’s voting stock; |
| • | the Company experiences a reorganization, merger or sale or disposition of substantially all of our assets or we purchase the assets or stock of another entity unless the shareholders prior to the transaction own at least 50% of the voting stock after the transaction and no person owns a majority of the voting stock (unless that ownership existed before the transaction); or |
| • | a majority of the members of our board are replaced during any 12-month period and the new directors are not endorsed by a majority of the Company’s board before the replacement or the replacement is not contemplated by our stockholders agreement. |
Our agreements with our management committee members other than Mr. Neubauer contain a “double trigger”—to be initiated, there must be a change of control followed by an involuntary loss of employment within three years thereafter or employment must be terminated in anticipation of a change of control. We chose to implement a “double trigger” because we were advised by Frederic W. Cook & Co., Inc. that a “double trigger” is more common in the market than a “single trigger.” In addition, in connection with the going-private transaction, change of control amounts were paid to our management committee members other than Mr. Neubauer under their previous employment agreements. Therefore, if a management committee member’s (other than Mr. Neubauer) employment is terminated by us without cause or if he or she resigns with good reason (as defined in his or her agreement) following a change of control other than the going-private transaction that was completed in January 2007, he or she is entitled to the following in addition to severance (see “Employment Agreements and Change of Control Arrangements.”):
| • | Cash severance benefits based on a multiple of two times his or her base salary and target bonus (or the prior year’s actual bonus, if higher) over a two year period according to the Company’s payroll cycle; |
| • | A lump sum payment, within 40 days after his or her termination date, equal to the portion of his or her target bonus attributable to the portion of the fiscal year served prior to termination, plus any earned but unpaid amounts; |
76
| • | Continued medical, life and disability insurance at our expense for a two year period following termination; |
| • | Outplacement counseling in an amount not to exceed 20% of base salary; and |
| • | Accelerated vesting of outstanding equity-based awards or retirement plan benefits as is specified under the terms of the applicable plans. See the narrative following the “2009 Grants of Plan-Based Awards” table. |
If the payments made to a member of our management committee were to result in excise tax or interest and penalties, the Company is required to gross up the management committee member for the income or excise tax imposed. This gross up provision ensures that management committee members receive the full benefit of payments related to a change of control to which they are entitled. If a change of control were to have occurred at the end of fiscal 2009, no excise tax would be imposed on the members of our management committee and, therefore, the table below does not include any gross up for excise taxes.
Estimated Benefits Upon Termination
The following table shows potential payments to members of our management committee under existing contracts, agreements, plans or arrangements, whether written or unwritten, for various scenarios involving a termination of employment, assuming an October 2, 2009 termination date and using the appraisal price of our common stock as of October 2, 2009 ($13.15). The covered employees would also be eligible to receive their supplemental retirement benefits (in the case of Mr. Neubauer) and accrued deferred compensation, which does not automatically accelerate upon a change of control. Some of the management committee members have optional life insurance for which they pay 100% of the premium.
This table shows amounts that would be payable under existing employment and post-employment competition and other agreements.
| Name |
Retirement | Permanent Disability |
Death(4) | Termination For Cause |
Resignation w/out Good Reason |
Voluntary Resignation with Notice |
Termination w/out Cause |
Involuntary Termination With Notice |
Resignation with Good Reason / Change of Control | ||||||||||||||||||
| Neubauer (3) |
|||||||||||||||||||||||||||
| Cash Payment (Lump Sum) |
$ | 1,300,000 | $ | 2,050,000 | $ | 4,350,000 | $ | 2,050,000 | $ | 2,050,000 | $ | 2,050,000 | $ | 8,750,000 | $ | 2,050,000 | $ | 8,750,000 | |||||||||
| Cash Payment (Over Time) |
$ | 3,900,000 | |||||||||||||||||||||||||
| Stock Options (1) (2) |
$ | 903,658 | $ | 1,417,500 | $ | 903,658 | $ | 664,455 | $ | 1,417,500 | $ | 1,417,500 | $ | 1,417,500 | $ | 1,417,500 | |||||||||||
| Perquisites (2) |
$ | 411,552 | $ | 411,552 | |||||||||||||||||||||||
| Total |
$ | 2,203,658 | $ | 7,367,500 | $ | 5,253,658 | $ | 2,050,000 | $ | 2,714,455 | $ | 3,467,500 | $ | 10,579,052 | $ | 3,467,500 | $ | 10,579,052 | |||||||||
77
| Name |
Retirement | Death(4) | Disability | Resignation for Good Reason |
Termination w/out cause |
Change of Control | |||||||||||
| Sutherland(5) |
|||||||||||||||||
| Cash Payment (Lump Sum) |
$ | 1,000,000 | $ | 600,000 | |||||||||||||
| Cash Payment (Over Time) |
$ | 3,625,000 | $ | 1,125,000 | $ | 3,525,000 | |||||||||||
| Stock Options (1) (2) |
$ | 2,715,485 | $ | 2,715,485 | $ | 1,996,681 | $ | 1,996,681 | $ | 3,993,363 | |||||||
| Perquisites (2) |
$ | 68,926 | $ | 38,176 | $ | 236,926 | |||||||||||
| Total |
$ | 7,340,485 | $ | 2,715,485 | $ | 2,065,607 | $ | 3,159,857 | $ | 8,355,289 | |||||||
| Kerin (6) |
|||||||||||||||||
| Cash Payment (Lump Sum) |
$ | 2,500,000 | $ | 600,000 | |||||||||||||
| Cash Payment (Over Time) |
$ | 1,125,000 | $ | 3,525,000 | |||||||||||||
| Stock Options (1) (2) |
$ | 2,122,078 | $ | 2,122,078 | $ | 1,560,353 | $ | 1,560,353 | $ | 3,120,715 | |||||||
| Perquisites (2) |
$ | 52,937 | $ | 47,529 | $ | 220,937 | |||||||||||
| Total |
$ | 4,622,078 | $ | 2,122,078 | $ | 1,613,290 | $ | 2,732,882 | $ | 7,466,652 | |||||||
| Vozzo (7) |
|||||||||||||||||
| Cash Payment (Lump Sum) |
$ | 1,000,000 | $ | 445,000 | |||||||||||||
| Cash Payment (Over Time) |
$ | 2,772,500 | $ | 892,500 | $ | 2,682,500 | |||||||||||
| Stock Options (1) (2) |
$ | 2,232,778 | $ | 2,232,778 | $ | 1,641,749 | $ | 1,641,749 | $ | 3,283,509 | |||||||
| Perquisites (2) |
$ | 44,177 | $ | 39,647 | $ | 181,177 | |||||||||||
| Total |
$ | 6,005,278 | $ | 2,232,778 | $ | 1,685,926 | $ | 2,573,896 | $ | 6,592,186 | |||||||
| Saligram (8) |
|||||||||||||||||
| Cash Payment (Lump Sum) |
$ | 1,000,000 | $ | 450,000 | |||||||||||||
| Cash Payment (Over Time) |
$ | 2,882,500 | $ | 922,500 | $ | 2,912,500 | |||||||||||
| Stock Options (1) (2) |
$ | 1,991,803 | $ | 1,991,803 | $ | 1,464,561 | $ | 1,464,561 | $ | 2,929,134 | |||||||
| Perquisites (2) |
$ | 56,151 | $ | 47,469 | $ | 197,151 | |||||||||||
| Total |
$ | 5,874,303 | $ | 1,991,803 | $ | 1,520,712 | $ | 2,434,530 | $ | 6,488,785 | |||||||
| McKee (9) |
|||||||||||||||||
| Cash Payment (Lump Sum) |
$ | 1,500,000 | $ | 425,000 | |||||||||||||
| Cash Payment (Over Time) |
$ | 2,662,500 | $ | 862,500 | $ | 2,762,500 | |||||||||||
| Stock Options (1) (2) |
$ | 1,831,153 | $ | 1,831,153 | $ | 1,346,436 | $ | 1,346,436 | $ | 2,692,884 | |||||||
| Perquisites (2) |
$ | 18,220 | $ | 24,281 | $ | 155,846 | |||||||||||
| Total |
$ | 5,993,653 | $ | 1,831,153 | $ | 1,364,656 | $ | 2,233,217 | $ | 6,036,230 | |||||||
| * | Change of control means termination without cause following a change of control or resignation for good reason following a change of control. |
| (1) | Calculations with regard to stock options are based upon the appraised value as of September 1, 2009. Stock option amounts include amounts attributable to vested stock options. Only Mr. Neubauer has attained the age of 60. Therefore, the accelerated vesting for stock options on retirement would apply only to Mr. Neubauer. Stock option amounts on a change of control for management committee members other than Mr. Neubauer, reflect, for fiscal years 2009 and later, performance-based options that vest at a rate of 87.5%, which is the blended rate for the vesting of performance-based stock options based upon the historical achievement of 2007 and 2008 EBIT targets, pursuant to the terms of the Non Qualified Stock Option Agreement. See “2009 Grants of Plan Based Awards” and the narrative following the table. |
| (2) | With regard to stock options, amounts were calculated using the appraisal price of $13.15 per share. In addition, in the case of death and disability, amounts were calculated assuming that all time-based options scheduled to vest in fiscal 2010 vest and 35% of the performance-based options scheduled to vest in fiscal 2010 vest. The following assumptions were used in our calculation of the cost of perquisites in connection |
78
| with termination of employment: for health insurance premiums, an 8% increase annually, for dental insurance premiums, a 6% increase annually, for vision insurance premiums, a 2% increase annually and no increase for excess health, life and accident insurance premiums. |
(3) (a) In addition to the amounts listed in this table, Mr. Neubauer also will receive his supplemental executive retirement benefit as described under “2009 Pension Benefits.”
(b) Included in Mr. Neubauer’s perquisites in the case of termination without cause or resignation for good reason following a change of control are health care, accident, disability and survivor insurance premiums for three years, use of a company leased vehicle and vehicle maintenance and insurance for three years and reimbursement for country club fees or financial planning services. Mr. Neubauer may also participate in the Executive Health Plan at his own expense.
| (4) | Includes amounts payable under the Survivor Income Protection Plan, various term life insurance policies and accidental death and dismemberment policy for which the Company pays all or part of the premium, which amounts are reflected in the “Summary Compensation Table.” |
| (5) | Included in Mr. Sutherland’s perquisites: (a) in the case of resignation for good reason, are health care, accident, disability and survivor insurance premiums over a two year period; (b) in the case of termination without cause, are basic medical and life insurance coverage and a car allowance over an 18 month severance period; and (c) in the case of a change of control, are health care, accident, disability and survivor insurance premiums for two years and a car allowance for eighteen months, as well as outplacement benefits of 20% of his base salary. |
| (6) | Included in Mr. Kerin’s perquisites: (a) in the case of resignation for good reason, are health care, accident, disability and survivor insurance premiums over a two year period; (b) in the case of termination without cause, are basic medical and life insurance coverage and a car allowance over an 18 month severance period; and (c) in the case of a change of control, are health care, accident, disability and survivor insurance premiums for two years, a car allowance for 18 months, as well as outplacement benefits of 20% of his base salary. |
| (7) | Included in Mr. Vozzo’s perquisites: (a) in the case of resignation for good reason, are health care, accident, disability and survivor insurance premiums over a two year period; (b) in the case of termination without cause, are basic medical and life insurance coverage and a car allowance over an 18 month severance period; and (c) in the case of a change of control, are health care, accident, disability and survivor insurance premiums for two years, a car allowance for 18 months, as well as outplacement benefits of 20% of his base salary. |
| (8) | Included in Mr. Saligram’s perquisites: (a) in the case of resignation for good reason, are health care, accident, disability and survivor insurance premiums over a two year period; (b) in the case of termination without cause, are basic medical and life insurance coverage and a car allowance over a 18 month severance period; and (c) in the case of a change of control, are health care, accident, disability and survivor insurance premiums for two years, a car allowance for 18 months, as well as outplacement benefits of 20% of his base salary. |
| (9) | Included in Ms. McKee’s perquisites: (a) in the case of resignation for good reason, are health care, accident, disability and survivor insurance premiums over a two year period; (b) in the case of termination without cause, are basic medical and life insurance coverage and a car allowance over an 18 month severance period; and (c) in the case of a change of control, are health care, accident, disability and survivor insurance premiums for two years, a car allowance for 18 months, as well as outplacement benefits of 20% of her base salary. |
Director Compensation
Three of our executive officers, Joseph Neubauer, L. Frederick Sutherland and Christopher Holland, serve as directors of ARAMARK Corporation. None of them receives any additional remuneration for serving as a director.
79
Item 12. Security Ownership of Certain Beneficial Owners and Management
Holdings owns 100% of the capital stock of ARAMARK Intermediate Holdco Corporation, which owns 100% of the capital stock of ARAMARK. Holdings has a board of directors consisting of the Chief Executive Officer, representatives of our four Sponsors and five other non-management directors. The board of directors of ARAMARK Intermediate Holdco Corporation consists of the same members as that of ARAMARK.
The following table sets forth information with respect to the beneficial ownership, as of November 27, 2009, of (i) each individual or entity known by us to own beneficially more than 5% of the common stock of Holdings, (ii) each of our Named Executive Officers, (iii) each of our directors and (iv) all of directors and our executive officers as a group.
The amounts and percentages of shares beneficially owned are reported on the basis of SEC regulations governing the determination of beneficial ownership of securities. Under SEC rules, a person is deemed to be a “beneficial owner” of a security if that person has or shares voting power or investment power, which includes the power to dispose of or to direct the disposition of such security. A person is also deemed to be a beneficial owner of any securities of which that person has a right to acquire beneficial ownership within 60 days. Securities that can be so acquired are deemed to be outstanding for purposes of computing such person’s ownership percentage, but not for purposes of computing any other person’s percentage. Under these rules, more than one person may be deemed to be a beneficial owner of the same securities and a person may be deemed to be a beneficial owner of securities as to which such person has no economic interest.
Except as otherwise indicated in the footnotes below, each of the beneficial owners has, to our knowledge, sole voting and investment power with respect to the indicated shares. Unless otherwise noted, the address of each beneficial owner is ARAMARK Corporation, ARAMARK Tower, 1101 Market Street, Philadelphia, Pennsylvania 19107.
| Name and Address of Beneficial Owner |
Beneficial Ownership of ARAMARK Corporation Common Stock(1) |
Percentage of ARAMARK Corporation Common Stock |
|||
| GS Capital Partners (2) |
208 | 20.76 | % | ||
| CCMP Capital Investors (3) |
104 | 10.38 | % | ||
| J.P. Morgan Partners (4) |
104 | 10.38 | % | ||
| Thomas H. Lee Partners (5) |
208 | 20.76 | % | ||
| Warburg Pincus LLC (6) |
212 | 21.20 | % | ||
| Joseph Neubauer (7) |
93 | 9.32 | % | ||
| L. Frederick Sutherland (8) |
12 | 1.16 | % | ||
| Thomas J. Vozzo (9) |
7 | * | |||
| Andrew C. Kerin (10) |
6 | * | |||
| Ravi K. Saligram (11) |
6 | * | |||
| Lynn B. McKee (12) |
5 | * | |||
| Christopher S. Holland (13) |
1 | * | |||
| Directors and Executive Officers as a Group (8 persons) (14) |
129 | 12.85 | % |
| * | Less than one percent or one share, as applicable. |
| (1) | ARAMARK has 1,000 shares of common stock outstanding, all of which are owned indirectly by Holdings. Share amounts indicated below reflect beneficial ownership, through Holdings, by such entities or individuals of these 1,000 shares of ARAMARK. |
| (2) | ARAMARK shares shown as beneficially owned by GS Capital Partners reflect an aggregate of the following record ownership: (i) 22,326,144 shares of Holdings held by GS Capital Partners V Fund, L.P.; (ii) 11,532,758 shares of Holdings held by GS Capital Partners V Offshore Fund, L.P.; (iii) 7,655,956 shares of Holdings held |
80
| by GS Capital Partners V Institutional, L.P.; and (iv) 885,142 shares of Holdings held by GS Capital Partners V GmbH & Co. KG (collectively, the “GS Entities”). The GS Entities, of which affiliates of the Goldman Sachs Group, Inc. are the general partner, managing general partner or investment manager, share voting and investment power with certain of its respective affiliates. The Goldman Sachs Group, Inc. disclaims beneficial ownership of the shares held directly or indirectly by the GS Entities, except to the extent of its pecuniary interest therein, if any. The address of GS Capital Partners is c/o The Goldman Sachs Group, 85 Broad Street, New York, New York 10004. |
| (3) | ARAMARK shares shown as beneficially owned by CCMP Capital Investors reflect an aggregate of the following record ownership: (i) 18,706,648 shares of Holdings held by CCMP Capital Investors II, L.P.; and (ii) 2,493,353 shares of Holdings held by CCMP Capital Investors (Cayman) II, L.P. The address of CCMP Capital Investors is 245 Park Avenue, 16th Floor, New York, New York 10167. |
| (4) | ARAMARK shares shown as beneficially owned by JP Morgan Partners reflect an aggregate of the following record ownership: (i) 11,955,003 shares of Holdings held by JP Morgan Partners (BHCA), LP; (ii) 2,865,797 shares of Holdings held by JP Morgan Partners Global Investors, L.P.; (iii) 440,340 shares of Holdings held by JP Morgan Partners Global Investors A, L.P.; (iv) 1,438,760 shares of Holdings held by JP Morgan Partners Global Investors (Cayman), L.P.; (v) 160,899 shares of Holdings held by JP Morgan Partners Global Investors (Cayman) II, L.P.; (vi) 970,308 shares of Holdings held by J.P. Morgan Partners Global Investors (Selldown), L.P.; and (vii) 3,368,893 shares of Holdings held by J.P. Morgan Partners Global Investors (Selldown) II, L.P. The address of JP Morgan Partners is 270 Park Avenue, 9th Floor, New York, New York 10017. |
| (5) | ARAMARK shares shown as beneficially owned by Thomas H. Lee Partners reflect an aggregate of the following record ownership: (i) 200,000 shares of Holdings held by THL Equity Fund VI Investors (ARAMARK), LLC; (ii) 23,347,540 shares of Holdings held by Thomas H. Lee Equity Fund VI, L.P.; (iii) 15,809,712 shares of Holdings held by Thomas H. Lee Parallel Fund VI, L.P.; (iv) 2,761,639 shares of Holdings held by Thomas H. Lee Parallel (DT) Fund VI, L.P.; (v) 119,161 shares of Holdings held by Putnam Investment Holdings, LLC; (vi) 119,115 shares of Holdings held by Putnam Investments Employees Securities Company III LLC; and (vii) 42,833 shares of Holdings held by THL Coinvestment Partners, L.P. The address of Thomas H. Lee Partners is 100 Federal Street, 35th Floor, Boston, Massachusetts 02110. |
| (6) | ARAMARK shares shown as beneficially owned by Warburg Pincus LLC reflect record ownership of 43,300,000 shares of Holdings held by Warburg Pincus Private Equity IX, L.P. (“WPIX”). Warburg Pincus Partners, LLC, a direct subsidiary of Warburg Pincus & Co. (“WP”), is the sole member of WPIX. Warburg Pincus IX, LLC, an indirect subsidiary of WP, is the sole general partner of WPIX. WPIX is managed by Warburg Pincus LLC. The address of Warburg Pincus LLC is 466 Lexington Avenue, 10th Floor, New York, New York 10017. |
| (7) | Includes beneficial ownership held by a trust for which Mr. Neubauer serves as trustee. ARAMARK Corporation shares shown as beneficially owned by Mr. Neubauer reflect 319,689 shares of Holdings subject to stock options exercisable currently, or within 60 days of November 27, 2009. |
| (8) | Includes beneficial ownership held by a family partnership for which Mr. Sutherland serves as a general partner. ARAMARK Corporation shares shown as beneficially owned by Mr. Sutherland reflect 878,466 shares of Holdings subject to stock options exercisable currently, or within 60 days of November 27, 2009. |
| (9) | Includes beneficial ownership held by a family trust for which Mr. Vozzo serves as trustee. ARAMARK Corporation shares shown as beneficially owned by Mr. Vozzo reflect 719,757 shares of Holdings subject to stock options exercisable currently, or within 60 days of November 27, 2009. |
| (10) | ARAMARK Corporation shares shown as beneficially owned by Mr. Kerin reflect 690,083 shares of Holdings subject to stock options exercisable currently, or within 60 days of November 27, 2009. |
| (11) | ARAMARK Corporation shares shown as beneficially owned by Mr. Saligram reflect 645,444 shares of Holdings subject to stock options exercisable currently, or within 60 days of November 27, 2009. |
| (12) | Includes beneficial ownership held by a general partnership for which Ms. McKee serves as a general partner. ARAMARK Corporation shares shown as beneficially owned by Ms. McKee reflect 592,257 shares of Holdings subject to stock options exercisable currently, or within 60 days of November 27, 2009. |
81
| (13) | ARAMARK Corporation shares shown as beneficially owned by Mr. Holland reflect 122,351 shares of Holdings subject to stock options exercisable currently, or within 60 days of November 27, 2009. |
| (14) | ARAMARK Corporation shares shown as beneficially owned by Directors and Executive Officers as a group reflect 4,024,044 shares of Holdings subject to stock options exercisable currently, or within 60 days of November 27, 2009. |
Item 13. Certain Relationships and Related Transactions, and Director Independence
Review of Related Person Transactions
The Board of Directors adopted a written Policy Regarding Transactions with Related Persons, which is administered by the Audit and Corporate Practices Committee of Holdings (the “Audit Committee”). This policy applies to any transaction or series of transactions in which the Company or a subsidiary is a participant, the amount involved exceeds $120,000 and a Related Person (as defined in Item 404(a) of SEC Regulation S-K) has a direct or indirect material interest. Under the Policy, a related person transaction other than as described below must be reported to the Company’s General Counsel and be reviewed and approved or ratified by the Audit Committee in accordance with the terms of this Policy, prior to the effectiveness or consummation of the transaction, whenever practicable. The Audit Committee will review all relevant information available to it about the potential Related Person Transaction. The Audit Committee, in its sole discretion, may impose such conditions as it deems appropriate on the Company or the Related Person in connection with the approval of the Related Person Transaction. In connection with transactions in which Mr. Neubauer, any of the directors of Holdings who are associated with the Sponsors or any of the Sponsors has a direct or indirect material interest, the provisions of the Stockholders Agreement of Holdings, which requires the consent of a majority of the disinterested directors of Holdings, will apply except that in the case of Mr. Neubauer, this requirement will not apply to compensation and incentive arrangements and other matters within the customary purview of and approved by the Compensation and Human Resources Committee of Holdings.
Certain Relationships and Related Transactions
We manage our exposure to interest rate changes with respect to our floating rate indebtedness through the use of interest rate swaps. Before and subsequent to the closing of the Transaction on January 26, 2007, our financial institution counterparties on these swaps have included entities affiliated with Goldman Sachs Capital Partners and with J.P. Morgan Partners. As of October 2, 2009, the notional value of interest rate swaps with entities affiliated with Goldman Sachs Capital Partners was $1,358 million, £25.0 million and ¥5.0 billion and with entities affiliated with J.P. Morgan Partners was $1,413 million and £25 million. In all of these swaps, we pay the counterparty a fixed interest rate in exchange for their payment of a floating interest rate. The net payments in fiscal 2009 to entities affiliated with Goldman Sachs Capital Partners and entities affiliated with J.P. Morgan Partners pursuant to interest rate swap transactions were approximately $45.7 million and $43.2 million, respectively.
Goldman Sachs Credit Partners, Goldman Sachs & Co. and William Street Credit Corporation are affiliates of GS Capital Partners, one of our Sponsors, and Sanjeev Mehra, a member of the board of directors of Holdings. JPMorgan Chase Bank, N.A. and J.P. Morgan Securities are affiliates of J.P. Morgan Partners, one of our Sponsors. Stephen P. Murray, who serves on the board of directors of Holdings, was employed by J.P. Morgan Partners until August 2006 and has been employed by CCMP Capital Advisors since August 2006.
Other Transactions
The Company employs the brother of Andrew C. Kerin, who is one of our executive officers, as a general manager in its uniform rental business. Mr. Kerin’s brother earned approximately $186,000 in salary and bonus in fiscal 2009.
82
We have a split dollar life insurance agreement with Mr. Neubauer. The agreement relates to life insurance policies owned by a trust created by Mr. Neubauer. Pursuant to the agreement, prior to 2003 we paid a substantial portion of the premiums on the policies, such amounts to be repaid from the proceeds of the policies upon their termination. At October 2, 2009, the amount of the premium repayment obligation was $2,497,692. We do not charge interest in each fiscal year on this amount. However, we have in the past captured at least some of the foregone interest because we reduced the amount of the interest that would otherwise accrue on Mr. Neubauer’s deferred compensation. We hold a security interest in the policies to secure the repayment of the premium amount paid by us. This arrangement terminates upon the termination of Mr. Neubauer’s employment (other than by reason of his retirement).
On May 12, 2009, the Company entered into a Letter Agreement (the “Agreement”) with Bart J. Colli, the Company’s Executive Vice President, General Counsel and Secretary, who retired on May 15, 2009, pursuant to which Mr. Colli will provide consulting services to the Company until May 16, 2010 (the “Consulting Period”) and will receive $500,000 for that year unless the Company terminates him for cause or he terminates for any reason. Mr. Colli will also be provided continued health insurance coverage under the terms of the Company’s welfare benefits program for executive officers of the Company until he and his wife attain the age of 65, a portion of the premiums for which will be reimbursed by the Company and a portion of which will be paid by Mr. Colli. On August 26, 2009, Mr. Colli exercised his put right under the Stockholders Agreement to sell his Holdings stock back to Holdings at the then fair market value of $12.89 per share. Mr. Colli received an aggregate of $6,504,371.34 in cash for his Holdings shares.
Director Independence
The Company’s Board of Directors is composed of Joseph Neubauer, L. Frederick Sutherland and Christopher S. Holland, each of whom is elected to serve until his successor is duly elected and qualified. Each of our directors is an employee of the Company and would not be considered independent for purposes of the New York Stock Exchange Listing Standards.
Item 14. Principal Accountant Fees and Services
Set forth below is information relating to the aggregate fees billed by KPMG LLP for professional services rendered for each of the last two fiscal years.
Audit Fees
The aggregate fees billed by KPMG LLP for each of fiscal 2009 and fiscal 2008 for professional services rendered for the audit of our consolidated financial statements, for the reviews of the unaudited consolidated financial statements included in our Quarterly Reports on Form 10-Q for the fiscal years, or for services normally provided by our independent public accountant in connection with statutory or regulatory filings or engagements, including reviews of registration statements, for those fiscal years were $4,001,585 and $4,560,518, respectively.
Audit-Related Fees
The aggregate fees billed by KPMG LLP in each of fiscal 2009 and fiscal 2008 for assurance and related services that were reasonably related to performance of the audit or review of our consolidated financial statements and that are not reported under “Audit Fees” above were $365,075 and $806,035, respectively. These services consisted of compliance and employee benefit plan audits, accounting consultation and other services.
Tax Fees
The aggregate fees billed by KPMG LLP in each of fiscal 2009 and fiscal 2008 for professional services rendered for tax compliance, tax advice and tax planning were $511,694 and $315,670, respectively. These services consisted primarily of international compliance assistance and tax planning advice.
83
All Other Fees
The aggregate fees billed by KPMG LLP in fiscal 2009 and 2008 for products and services provided, other than the services noted above, were $0 and $9,050, respectively. These fees primarily related to industry consultation outside the United States.
Pre-Approval of Services
The Audit Committee annually reviews and pre-approves the services that may be provided by the independent auditor without obtaining specific pre-approval from the Audit Committee. The Audit Committee has also adopted a Pre-Approval Policy that contains a list of pre-approved services, which the Audit Committee may revise from time to time, based on subsequent determinations. The Audit Committee has delegated pre-approval authority to the chairman of the Audit Committee, or in his absence or unavailability, to another specified member of the Audit Committee. The chairman of the Audit Committee or such specified member will report any pre-approval decisions to the Audit Committee at its next scheduled meeting. All of our audit-related fees and tax fees were pre-approved by the Audit Committee or the chairman of the Audit Committee.
PART IV
Item 15. Exhibits and Financial Statement Schedules
(a) Financial Statements
See Index to Financial Statements and Schedule at page S-1 and the Exhibit Index.
(b) Exhibits Required by Item 601 of Regulation S-K
See the Exhibit Index which is incorporated herein by reference.
(c) Financial Statement Schedules
See Index to Financial Statements and Schedule at page S-1.
SUPPLEMENTAL INFORMATION TO BE FURNISHED WITH REPORTS FILED PURSUANT TO SECTION 15(d) OF THE ACT BY REGISTRANTS WHICH HAVE NOT REGISTERED SECURITIES PURSUANT TO SECTION 12 OF THE ACT.
No annual report to security holders covering the registrant’s last fiscal year has been sent to security holders. No proxy statement, form of proxy or other proxy soliciting material has been sent to more than 10 of the registrant’s security holders with respect to any annual or other meeting of security holders.
84
SIGNATURES
Pursuant to the requirements of Section 13 or 15(d) of the Securities Exchange Act of 1934, as amended, the registrant has duly caused this annual report to be signed on its behalf by the undersigned, thereunto duly authorized.
| ARAMARK CORPORATION | ||||
| Date: December 15, 2009 |
By: | /s/ JOSEPH NEUBAUER | ||
| Name: | Joseph Neubauer | |||
| Title: | Chairman and Chief Executive Officer | |||
POWER OF ATTORNEY
KNOW ALL PERSONS BY THESE PRESENT, that each person whose name appears below hereby appoints Joseph Neubauer, L. Frederick Sutherland, and Christopher S. Holland, and each of them, as his or her true and lawful agent, with full power of substitution and resubstitution, for him or her and in his or her name, place and stead, in any and all capacities, to execute any and all amendments to the within annual report, and to file the same, together with all exhibits thereto, with the Securities and Exchange Commission, granting unto each said attorney-in-fact and agent, full power and authority to do and perform each and every act and thing requisite and necessary to be done in and about the premises, as fully to all intents and purposes as he or she might or could do in person, hereby ratifying and confirming all that each said attorney-in-fact and agent may lawfully do or cause to be done by virtue hereof.
Pursuant to the requirements of the Securities Exchange Act of 1934, as amended, this annual report has been signed below by the following persons on behalf of the registrant and in the capacities and on the dates indicated.
| Name |
Title |
Date | ||
| /s/ JOSEPH NEUBAUER Joseph Neubauer |
Chairman and Chief Executive Officer and Director (Principal Executive Officer) |
December 15, 2009 | ||
| /s/ L. FREDERICK SUTHERLAND L. Frederick Sutherland |
Executive Vice President and Chief Financial Officer and Director (Principal Financial Officer) |
December 15, 2009 | ||
| /s/ JOSEPH MUNNELLY Joseph Munnelly |
Senior Vice President, Controller and Chief Accounting Officer (Principal Accounting Officer) |
December 15, 2009 | ||
| /s/ CHRISTOPHER S. HOLLAND Christopher S. Holland |
Senior Vice President, Treasurer and Director | December 15, 2009 | ||
85
ARAMARK CORPORATION AND SUBSIDIARIES
INDEX TO FINANCIAL STATEMENTS AND SCHEDULE
| Management’s Report on Internal Control Over Financial Reporting |
S-2 | |
| S-3 | ||
| Consolidated Balance Sheets as of October 2, 2009 and October 3, 2008 |
S-4 | |
| S-5 | ||
| S-6 | ||
| S-7 | ||
| S-9 | ||
| S-59 |
All other schedules are omitted because they are not applicable, not required, or the information required to be set forth therein is included in the consolidated financial statements or in the notes thereto.
S-1
Management’s Report on Internal Control Over Financial Reporting
Management is responsible for establishing and maintaining adequate internal control over financial reporting of the Company. Internal control over financial reporting is a process designed to provide reasonable assurance regarding the reliability of financial reporting and the preparation of financial statements for external purposes in accordance with accounting principles generally accepted in the United States of America.
The Company’s internal control over financial reporting includes those policies and procedures that (i) pertain to the maintenance of records that, in reasonable detail, accurately and fairly reflect the transactions and dispositions of assets of the Company; (ii) provide reasonable assurance that transactions are recorded as necessary to permit preparation of financial statements in accordance with accounting principles generally accepted in the United States of America, and that receipts and expenditures of the Company are being made only in accordance with authorizations of management and directors of the Company; and (iii) provide reasonable assurance regarding prevention or timely detection of unauthorized acquisition, use, or disposition of the Company’s assets that could have a material effect on the financial statements.
Because of its inherent limitations, internal control over financial reporting may not prevent or detect misstatements. Also, projections of any evaluation of effectiveness to future periods are subject to the risk that controls may become inadequate because of changes in conditions, or that the degree of compliance with the policies or procedures may deteriorate.
Management conducted an evaluation of the effectiveness of internal control over financial reporting based on the framework in Internal Control—Integrated Framework issued by the Committee of Sponsoring Organizations of the Treadway Commission. Based on this evaluation, management concluded that the Company’s internal control over financial reporting was effective as of October 2, 2009.
This annual report does not include an attestation report of the Company’s independent registered public accounting firm regarding internal control over financial reporting pursuant to temporary rules of the Securities and Exchange Commission that permit the company to provide only management’s report in this annual report.
| /S/ JOSEPH NEUBAUER |
| Joseph Neubauer |
| Chairman and Chief Executive Officer |
| /S/ L. FREDERICK SUTHERLAND |
| L. Frederick Sutherland |
| Executive Vice President and Chief Financial Officer |
S-2
Report of Independent Registered Public Accounting Firm
The Board of Directors and Shareholder
ARAMARK Corporation:
We have audited the accompanying consolidated balance sheets of ARAMARK Corporation and subsidiaries as of October 2, 2009 and October 3, 2008 (Successor Periods), and the related consolidated statements of operations, cash flows and shareholders’ equity for the fiscal years ended October 2, 2009 and October 3, 2008 (Successor Periods), the period from January 27, 2007 through September 28, 2007 (Successor Period) and the period from September 30, 2006 through January 26, 2007 (Predecessor Period). In connection with our audits of the consolidated financial statements, we also have audited the financial statement schedule as listed in the accompanying index. These consolidated financial statements and financial statement schedule are the responsibility of the Company’s management. Our responsibility is to express an opinion on these consolidated financial statements and financial statement schedule based on our audits.
We conducted our audits in accordance with the standards of the Public Company Accounting Oversight Board (United States). Those standards require that we plan and perform the audit to obtain reasonable assurance about whether the financial statements are free of material misstatement. An audit includes examining, on a test basis, evidence supporting the amounts and disclosures in the financial statements. An audit also includes assessing the accounting principles used and significant estimates made by management, as well as evaluating the overall financial statement presentation. We believe that our audits provide a reasonable basis for our opinion.
In our opinion, the consolidated financial statements referred to above present fairly, in all material respects, the financial position of ARAMARK Corporation and subsidiaries as of October 2, 2009 and October 3, 2008 (Successor Periods), and the related consolidated statements of operations, cash flows and shareholders’ equity for the fiscal years ended October 2, 2009 and October 3, 2008 (Successor Periods), the period from January 27, 2007 through September 28, 2007 (Successor Period), and the period from September 30, 2006 through January 26, 2007 (Predecessor Period), in conformity with U.S. generally accepted accounting principles. Also in our opinion, the related financial statement schedule, when considered in relation to the basic consolidated financial statements taken as a whole, presents fairly, in all material respects, the information set forth therein.
As discussed in Note 1 to the consolidated financial statements, effective January 26, 2007, the Company was acquired through a merger transaction with RMK Acquisition Corporation in a business combination accounted for as a purchase. As a result of the acquisition, the consolidated financial information for periods after the acquisition is presented on a different cost basis than that for the periods before the acquisition and, therefore, is not comparable. Also, as discussed in Notes 8 and 9, effective January 26, 2007, the Company changed its method of accounting for defined benefit plans and effective January 27, 2007, the Company changed its method of accounting for uncertainty in income taxes.
| /s/ KPMG LLP |
| Philadelphia, Pennsylvania |
| December 15, 2009 |
S-3
ARAMARK CORPORATION AND SUBSIDIARIES
CONSOLIDATED BALANCE SHEETS
OCTOBER 2, 2009 AND OCTOBER 3, 2008
(in thousands, except share amounts)
| October 2, 2009 |
October 3, 2008 |
|||||||
| ASSETS | ||||||||
| Current Assets: |
||||||||
| Cash and cash equivalents |
$ | 224,644 | $ | 148,919 | ||||
| Receivables (less allowances: 2009—$38,366; 2008—$42,528) |
807,974 | 949,638 | ||||||
| Inventories |
464,157 | 535,746 | ||||||
| Prepayments and other current assets |
191,659 | 164,017 | ||||||
| Total current assets |
1,688,434 | 1,798,320 | ||||||
| Property and Equipment, at cost: |
||||||||
| Land, buildings and improvements |
531,118 | 543,156 | ||||||
| Service equipment and fixtures |
1,270,147 | 1,096,466 | ||||||
| 1,801,265 | 1,639,622 | |||||||
| Less-Accumulated depreciation |
(640,754 | ) | (416,526 | ) | ||||
| 1,160,511 | 1,223,096 | |||||||
| Goodwill |
4,526,376 | 4,512,133 | ||||||
| Other Intangible Assets |
2,056,337 | 2,215,321 | ||||||
| Other Assets |
867,767 | 774,533 | ||||||
| $ | 10,299,425 | $ | 10,523,403 | |||||
| LIABILITIES AND SHAREHOLDER’S EQUITY | ||||||||
| Current Liabilities: |
||||||||
| Current maturities of long-term borrowings |
$ | 43,943 | $ | 54,677 | ||||
| Accounts payable |
669,704 | 747,887 | ||||||
| Accrued payroll and related expenses |
407,011 | 390,324 | ||||||
| Accrued expenses and other current liabilities |
613,921 | 618,756 | ||||||
| Total current liabilities |
1,734,579 | 1,811,644 | ||||||
| Long-term borrowings |
5,721,683 | 5,859,557 | ||||||
| Less-Current portion |
(43,943 | ) | (54,677 | ) | ||||
| Total long-term borrowings |
5,677,740 | 5,804,880 | ||||||
| Deferred Income Taxes and Other Noncurrent Liabilities |
1,350,346 | 1,337,472 | ||||||
| Common Stock Subject to Repurchase |
176,395 | 229,628 | ||||||
| Shareholder’s Equity: |
||||||||
| Common stock, par value $.01 (authorized: 1,000 shares; issued and outstanding: 1,000 shares) |
— | — | ||||||
| Capital surplus |
1,445,451 | 1,391,550 | ||||||
| Earnings retained for use in the business |
48,608 | 55,519 | ||||||
| Accumulated other comprehensive loss |
(133,694 | ) | (107,290 | ) | ||||
| Total shareholder’s equity |
1,360,365 | 1,339,779 | ||||||
| $ | 10,299,425 | $ | 10,523,403 | |||||
The accompanying notes are an integral part of these consolidated financial statements.
S-4
ARAMARK CORPORATION AND SUBSIDIARIES
CONSOLIDATED STATEMENTS OF OPERATIONS
FOR THE FISCAL YEARS ENDED OCTOBER 2, 2009 (SUCCESSOR) AND OCTOBER 3, 2008 (SUCCESSOR), THE PERIOD FROM JANUARY 27, 2007 THROUGH SEPTEMBER 28, 2007 (SUCCESSOR) AND THE PERIOD FROM SEPTEMBER 30, 2006 THROUGH JANUARY 26, 2007 (PREDECESSOR)
(in thousands)
| Successor | Predecessor | |||||||||||||||
| Fiscal Year Ended October 2, 2009 |
Fiscal Year Ended October 3, 2008 |
Period from January 27, 2007 through September 28, 2007 |
Period from September 30, 2006 through January 26, 2007 | |||||||||||||
| Sales |
$ | 12,297,869 | $ | 13,470,152 | $ | 8,438,448 | $ | 3,945,868 | ||||||||
| Costs and Expenses: |
||||||||||||||||
| Cost of services provided |
11,173,725 | 12,218,089 | 7,623,684 | 3,586,961 | ||||||||||||
| Depreciation and amortization |
503,123 | 509,137 | 322,480 | 116,438 | ||||||||||||
| Selling and general corporate expenses |
183,492 | 176,790 | 126,874 | 173,934 | ||||||||||||
| Other (income) expense (Note 3) |
— | — | (21,177 | ) | — | |||||||||||
| 11,860,340 | 12,904,016 | 8,051,861 | 3,877,333 | |||||||||||||
| Operating Income |
437,529 | 566,136 | 386,587 | 68,535 | ||||||||||||
| Interest and Other Financing Costs, net |
472,305 | 514,690 | 365,887 | 48,672 | ||||||||||||
| Income (Loss) Before Income Taxes |
(34,776 | ) | 51,446 | 20,700 | 19,863 | |||||||||||
| Provision (Benefit) for Income Taxes |
(27,865 | ) | 11,986 | 4,641 | 5,063 | |||||||||||
| Net income (loss) |
$ | (6,911 | ) | $ | 39,460 | $ | 16,059 | $ | 14,800 | |||||||
The accompanying notes are an integral part of these consolidated financial statements.
S-5
ARAMARK CORPORATION AND SUBSIDIARIES
CONSOLIDATED STATEMENTS OF CASH FLOWS
FOR THE FISCAL YEARS ENDED OCTOBER 2, 2009 (SUCCESSOR) AND OCTOBER 3, 2008 (SUCCESSOR), THE PERIOD FROM JANUARY 27, 2007 THROUGH SEPTEMBER 28, 2007 (SUCCESSOR) AND THE PERIOD FROM SEPTEMBER 30, 2006 THROUGH JANUARY 26, 2007 (PREDECESSOR)
(in thousands)
| Successor | Predecessor | |||||||||||||||||
| Fiscal Year Ended October 2, 2009 |
Fiscal Year Ended October 3, 2008 |
Period from January 27, 2007 through September 28, 2007 |
Period from September 30, 2006 through January 26, 2007 |
|||||||||||||||
| Cash flows from operating activities: |
||||||||||||||||||
| Net income (loss) |
$ | (6,911 | ) | $ | 39,460 | $ | 16,059 | $ | 14,800 | |||||||||
| Adjustments to reconcile net income (loss) to net cash provided by (used in) operating activities: |
||||||||||||||||||
| Depreciation and amortization |
503,123 | 509,137 | 322,480 | 116,438 | ||||||||||||||
| Income taxes deferred |
(68,064 | ) | (18,264 | ) | (118,668 | ) | (11,640 | ) | ||||||||||
| Share-based compensation expense |
25,396 | 11,760 | 27,518 | 84,059 | ||||||||||||||
| Gain from sale of investment |
— | — | (21,177 | ) | — | |||||||||||||
| Changes in noncash working capital: |
||||||||||||||||||
| Receivables |
169,490 | (87,107 | ) | (8,622 | ) | (34,780 | ) | |||||||||||
| Inventories |
73,280 | (10,805 | ) | (29,443 | ) | 2,915 | ||||||||||||
| Prepayments |
7,184 | (8,325 | ) | 14,209 | (25,989 | ) | ||||||||||||
| Accounts payable |
(74,761 | ) | 9,930 | 172,786 | (100,451 | ) | ||||||||||||
| Accrued expenses |
26,934 | 8,007 | 153,792 | (111,424 | ) | |||||||||||||
| Net change in proceeds from sale of receivables |
(14,560 | ) | 17,000 | 22,000 | — | |||||||||||||
| Changes in other noncurrent liabilities |
34,572 | 22,693 | 14,551 | 3,122 | ||||||||||||||
| Changes in other assets |
26,475 | (3,896 | ) | (14,515 | ) | (13,491 | ) | |||||||||||
| Other operating activities |
5,077 | 4,560 | 9,427 | 290 | ||||||||||||||
| Net cash provided by (used in) operating activities |
707,235 | 494,150 | 560,397 | (76,151 | ) | |||||||||||||
| Cash flows from investing activities: |
||||||||||||||||||
| Purchases of property and equipment and client contract investments |
(358,247 | ) | (364,229 | ) | (248,943 | ) | (81,534 | ) | ||||||||||
| Disposals of property and equipment |
27,915 | 13,832 | 13,152 | 20,055 | ||||||||||||||
| Proceeds from sales and divestitures |
— | — | 285,982 | — | ||||||||||||||
| Acquisition of certain businesses: |
||||||||||||||||||
| Working capital other than cash acquired |
(86,738 | ) | (1,014 | ) | (2,395 | ) | (5,494 | ) | ||||||||||
| Property and equipment |
(2,504 | ) | (4,759 | ) | (301 | ) | (12,835 | ) | ||||||||||
| Additions to goodwill, other intangible assets and other assets, net |
(48,473 | ) | (49,182 | ) | (57,541 | ) | (63,389 | ) | ||||||||||
| Acquisition of ARAMARK Corporation |
— | — | (6,100,687 | ) | — | |||||||||||||
| Other investing activities |
3,250 | 163 | 5,153 | 3,245 | ||||||||||||||
| Net cash used in investing activities |
(464,797 | ) | (405,189 | ) | (6,105,580 | ) | (139,952 | ) | ||||||||||
| Cash flows from financing activities: |
||||||||||||||||||
| Proceeds from long-term borrowings |
711 | 5,583 | 5,918,842 | 416,956 | ||||||||||||||
| Payment of long-term borrowings |
(147,553 | ) | (26,173 | ) | (2,131,503 | ) | (130,986 | ) | ||||||||||
| Proceeds from issuance of Parent Company common stock |
3,380 | 5,417 | 1,844,136 | 9,666 | ||||||||||||||
| Repurchase of Parent Company common stock |
(22,989 | ) | (9,870 | ) | (750 | ) | — | |||||||||||
| Payment of dividends |
— | — | — | (12,624 | ) | |||||||||||||
| Other financing activities |
(262 | ) | 1,363 | (138,508 | ) | 22,016 | ||||||||||||
| Net cash provided by (used in) financing activities |
(166,713 | ) | (23,680 | ) | 5,492,217 | 305,028 | ||||||||||||
| Increase (Decrease) in cash and cash equivalents |
75,725 | 65,281 | (52,966 | ) | 88,925 | |||||||||||||
| Cash and cash equivalents, beginning of period |
148,919 | 83,638 | 136,604 | 47,679 | ||||||||||||||
| Cash and cash equivalents, end of period |
$ | 224,644 | $ | 148,919 | $ | 83,638 | $ | 136,604 | ||||||||||
The accompanying notes are an integral part of these consolidated financial statements.
S-6
ARAMARK CORPORATION AND SUBSIDIARIES
CONSOLIDATED STATEMENTS OF SHAREHOLDERS’ EQUITY
FOR THE FISCAL YEARS ENDED OCTOBER 2, 2009 (SUCCESSOR) AND OCTOBER 3, 2008 (SUCCESSOR), THE PERIOD FROM JANUARY 27, 2007 THROUGH SEPTEMBER 28, 2007 (SUCCESSOR) AND THE PERIOD FROM SEPTEMBER 30, 2006 THROUGH JANUARY 26, 2007 (PREDECESSOR)
(in thousands)
| Common Stock |
Class A Common Stock |
Class B Common Stock |
Capital Surplus |
Earnings Retained for Use in the Business |
Accumulated Other Comprehensive Income (Loss) |
Treasury Stock |
Total | |||||||||||||||||||||||
| Predecessor |
||||||||||||||||||||||||||||||
| Balance, September 30, 2006 |
$ | — | $ | 751 | $ | 1,562 | $ | 1,210,300 | $ | 1,538,760 | $ | 12,524 | $ | (1,242,305 | ) | $ | 1,521,592 | |||||||||||||
| Comprehensive income: |
||||||||||||||||||||||||||||||
| Net income |
14,800 | 14,800 | ||||||||||||||||||||||||||||
| Foreign currency translation adjustments (net of tax) |
525 | 525 | ||||||||||||||||||||||||||||
| Change in fair value of cash flow hedges (net of tax) |
8,926 | 8,926 | ||||||||||||||||||||||||||||
| Total comprehensive income |
24,251 | |||||||||||||||||||||||||||||
| Payment of dividends |
(12,624 | ) | (12,624 | ) | ||||||||||||||||||||||||||
| Conversion of Class A to Class B |
(51 | ) | 51 | — | ||||||||||||||||||||||||||
| Issuance of common stock |
7 | 3 | 20,095 | 20,105 | ||||||||||||||||||||||||||
| Compensation expense related to stock incentive plans |
84,059 | 84,059 | ||||||||||||||||||||||||||||
| Tax benefits related to stock incentive plans |
11,432 | 11,432 | ||||||||||||||||||||||||||||
| Reclassification of share-based awards from equity to liability |
(142,567 | ) | (142,567 | ) | ||||||||||||||||||||||||||
| Purchases of common stock for the treasury |
(3,602 | ) | (3,602 | ) | ||||||||||||||||||||||||||
| Adoption of accounting pronouncement related to pension and other postretirement plans (net of tax) |
(15,321 | ) | (15,321 | ) | ||||||||||||||||||||||||||
| Balance, January 26, 2007 |
$ | — | $ | 707 | $ | 1,616 | $ | 1,183,319 | $ | 1,540,936 | $ | 6,654 | $ | (1,245,907 | ) | $ | 1,487,325 | |||||||||||||
S-7
ARAMARK CORPORATION AND SUBSIDIARIES
CONSOLIDATED STATEMENTS OF SHAREHOLDERS’ EQUITY—(Continued)
FOR THE FISCAL YEARS ENDED OCTOBER 2, 2009 (SUCCESSOR) AND OCTOBER 3, 2008 (SUCCESSOR), THE PERIOD FROM JANUARY 27, 2007 THROUGH SEPTEMBER 28, 2007 (SUCCESSOR) AND THE PERIOD FROM SEPTEMBER 30, 2006 THROUGH JANUARY 26, 2007 (PREDECESSOR)
(in thousands)
| Common Stock |
Class A Common Stock |
Class B Common Stock |
Capital Surplus |
Earnings Retained for Use in the Business |
Accumulated Other Comprehensive Income (Loss) |
Total | |||||||||||||||||||
| Successor |
|||||||||||||||||||||||||
| Investment by Parent Company |
$ | — | $ | — | $ | — | $ | 1,848,527 | $ | — | $ | — | $ | 1,848,527 | |||||||||||
| Deemed dividend to continuing shareholder |
(408,000 | ) | (408,000 | ) | |||||||||||||||||||||
| Comprehensive income: |
|||||||||||||||||||||||||
| Net income |
16,059 | 16,059 | |||||||||||||||||||||||
| Pension plan adjustments (net of tax) |
2,131 | 2,131 | |||||||||||||||||||||||
| Foreign currency translation adjustments (net of tax) |
18,821 | 18,821 | |||||||||||||||||||||||
| Change in fair value of cash flow hedges (net of tax) |
(33,221 | ) | (33,221 | ) | |||||||||||||||||||||
| Total comprehensive income |
3,790 | ||||||||||||||||||||||||
| Compensation expense related to stock incentive plans |
27,518 | 27,518 | |||||||||||||||||||||||
| Tax benefits related to stock incentive plans |
15 | 15 | |||||||||||||||||||||||
| Increase in Parent Company common stock subject to repurchase obligation, net |
(31,541 | ) | (31,541 | ) | |||||||||||||||||||||
| Purchases of Parent Company common stock |
(750 | ) | (750 | ) | |||||||||||||||||||||
| Balance, September 28, 2007 |
$ | — | $ | — | $ | — | $ | 1,435,769 | $ | 16,059 | $ | (12,269 | ) | $ | 1,439,559 | ||||||||||
| Comprehensive loss: |
|||||||||||||||||||||||||
| Net income |
39,460 | 39,460 | |||||||||||||||||||||||
| Pension plan adjustments (net of tax) |
(13,370 | ) | (13,370 | ) | |||||||||||||||||||||
| Foreign currency translation adjustments (net of tax) |
(12,043 | ) | (12,043 | ) | |||||||||||||||||||||
| Change in fair value of cash flow hedges (net of tax) |
(69,608 | ) | (69,608 | ) | |||||||||||||||||||||
| Total comprehensive loss |
(55,561 | ) | |||||||||||||||||||||||
| Capital contributions from issuance of Parent Company common stock |
7,556 | 7,556 | |||||||||||||||||||||||
| Compensation expense related to stock incentive plans |
11,760 | 11,760 | |||||||||||||||||||||||
| Tax benefits related to stock incentive plans |
1,406 | 1,406 | |||||||||||||||||||||||
| Increase in Parent Company common stock subject to repurchase obligation, net |
(49,951 | ) | (49,951 | ) | |||||||||||||||||||||
| Purchases of Parent Company common stock |
(14,990 | ) | (14,990 | ) | |||||||||||||||||||||
| Balance, October 3, 2008 |
$ | — | $ | — | $ | — | $ | 1,391,550 | $ | 55,519 | $ | (107,290 | ) | $ | 1,339,779 | ||||||||||
| Comprehensive loss: |
|||||||||||||||||||||||||
| Net loss |
(6,911 | ) | (6,911 | ) | |||||||||||||||||||||
| Pension plan adjustments (net of tax) |
(6,459 | ) | (6,459 | ) | |||||||||||||||||||||
| Foreign currency translation adjustments (net of tax) |
15,433 | 15,433 | |||||||||||||||||||||||
| Change in fair value of cash flow hedges (net of tax) |
(35,378 | ) | (35,378 | ) | |||||||||||||||||||||
| Total comprehensive loss |
(33,315 | ) | |||||||||||||||||||||||
| Capital contributions from issuance of Parent Company common stock |
14,989 | 14,989 | |||||||||||||||||||||||
| Compensation expense related to stock incentive plans |
25,396 | 25,396 | |||||||||||||||||||||||
| Tax benefits related to stock incentive plans |
(262 | ) | (262 | ) | |||||||||||||||||||||
| Decrease in Parent Company common stock subject to repurchase obligation, net |
53,233 | 53,233 | |||||||||||||||||||||||
| Purchases of Parent Company common stock |
(39,455 | ) | (39,455 | ) | |||||||||||||||||||||
| Balance, October 2, 2009 |
$ | — | $ | — | $ | — | $ | 1,445,451 | $ | 48,608 | $ | (133,694 | ) | $ | 1,360,365 | ||||||||||
The accompanying notes are an integral part of these consolidated financial statements.
S-8
ARAMARK CORPORATION AND SUBSIDIARIES
NOTES TO CONSOLIDATED FINANCIAL STATEMENTS
NOTE 1. BASIS OF PRESENTATION AND SUMMARY OF SIGNIFICANT ACCOUNTING POLICIES:
ARAMARK Corporation (the “Company” or “ARAMARK”) was acquired on January 26, 2007 through a merger transaction with RMK Acquisition Corporation, a Delaware corporation controlled by investment funds associated with GS Capital Partners, CCMP Capital Advisors, J.P. Morgan Partners, Thomas H. Lee Partners and Warburg Pincus LLC (collectively, the “Sponsors”), Joseph Neubauer, Chairman and Chief Executive Officer of ARAMARK, and certain other members of the Company’s management. The acquisition was accomplished through the merger of RMK Acquisition Corporation with and into ARAMARK Corporation with ARAMARK Corporation being the surviving company (the “Transaction”).
The Company is a wholly-owned subsidiary of ARAMARK Intermediate Holdco Corporation, which is wholly-owned by ARAMARK Holdings Corporation (the “Parent Company”). ARAMARK Holdings Corporation, ARAMARK Intermediate Holdco Corporation and RMK Acquisition Corporation were formed for the purpose of facilitating the Transaction and have no operations other than ownership of the Company. ARAMARK Holdings Corporation has 600.0 million common shares authorized, approximately 208.3 million issued and approximately 204.2 million outstanding as of October 2, 2009. Although ARAMARK Corporation continued as the same legal entity after the Transaction, the accompanying consolidated statements of operations, cash flows and shareholders’ equity are presented for two periods: Predecessor and Successor, which relate to the period preceding the Transaction and the period succeeding the Transaction, respectively. As a result of the Transaction and the related purchase accounting described in Note 2, the Predecessor and Successor financial statements are not comparable. The Company refers to the operations of ARAMARK Corporation and subsidiaries for both the Predecessor and Successor periods.
On March 30, 2007, ARAMARK Corporation was merged with and into ARAMARK Services, Inc. with ARAMARK Services, Inc. being the surviving corporation. In connection with the consummation of the merger, ARAMARK Services, Inc. changed its name to ARAMARK Corporation.
The consolidated financial statements include the accounts of the Company and its majority-owned subsidiaries. All significant intercompany transactions and accounts have been eliminated. The consolidated financial statements exclude the accounts of ARAMARK Holdings Corporation and ARAMARK Intermediate Holdco Corporation, but do reflect the Sponsors’ investment cost basis allocated to the assets and liabilities acquired on January 26, 2007.
Fiscal Year
The Company’s fiscal year is the fifty-two or fifty-three week period which ends on the Friday nearest September 30th. The fiscal years ended October 2, 2009 and September 28, 2007 were each fifty-two week periods and the fiscal year ended October 3, 2008 was a fifty-three week period.
Reclassification
Certain prior period balances in the Company’s Consolidated Statement of Cash Flows related to cashless settlements of the exercise price and related employee minimum tax withholding liabilities of share-based payment awards have been reclassified to conform to current year presentation. The effect was not material.
New Accounting Pronouncements
In May 2009, the Financial Accounting Standards Board (“FASB”) issued a new accounting pronouncement which establishes general standards of accounting for and disclosure of events that occur after the balance sheet
S-9
ARAMARK CORPORATION AND SUBSIDIARIES
NOTES TO CONSOLIDATED FINANCIAL STATEMENTS—(Continued)
date but before the financial statements are issued or are available to be issued. The Company adopted this accounting pronouncement in the third quarter of fiscal 2009 (see “Subsequent Events” in Note 1).
In April 2009, the FASB issued a new accounting pronouncement which expands the fair value disclosures required for all financial instruments to interim periods for publicly traded entities. This accounting pronouncement also requires entities to disclose the method(s) and significant assumptions used to estimate the fair value of financial instruments on an interim basis and to highlight any changes of the methods and significant assumptions from prior periods. The Company adopted this accounting pronouncement in the third quarter of fiscal 2009.
In March 2008, the FASB issued a new accounting pronouncement which enhances and expands the disclosures for derivative instruments and hedging activities. The Company adopted this accounting pronouncement in the second quarter of fiscal 2009 (see Note 6).
In February 2007, the FASB issued a new accounting pronouncement which allows companies to elect fair-value measurement when an eligible financial asset or financial liability is initially recognized or when an event, such as a business combination, triggers a new basis of accounting for that financial asset or financial liability. The election must be applied to individual contracts, is irrevocable for every contract chosen to be measured at fair value, and must be applied to an entire contract, not to only specified risks, specific cash flows, or portions of that contract. Changes in the fair value of contracts elected to be measured at fair value are recognized in earnings each reporting period. The Company adopted this accounting pronouncement in fiscal 2009 with no effect on the Company’s consolidated financial statements as the Company did not use the fair-value measurement election for any eligible financial assets or financial liabilities.
In September 2006, the FASB issued a new accounting pronouncement which defines fair value, establishes a framework for measuring fair value under generally accepted accounting principles, and expands disclosures about fair value measurements. This accounting pronouncement is effective for ARAMARK beginning in fiscal 2009 for financial assets and financial liabilities and fiscal 2010 for nonfinancial assets and nonfinancial liabilities. The Company adopted this accounting pronouncement for financial assets and financial liabilities in fiscal 2009 (see Note 17). The Company is currently evaluating the impact this accounting pronouncement will have on nonfinancial assets and nonfinancial liabilities.
In June 2009, the FASB issued a new accounting pronouncement which identifies the sources of accounting principles and the framework for selecting the principles to be used in the preparation of financial statements that are presented in conformity with U.S. GAAP. This accounting pronouncement does not change the Company accounts for its transactions or the nature of related disclosures made. This accounting pronouncement affects the way the Company references U.S. GAAP in its consolidated financial statements. The Company adopted this accounting pronouncement in the fourth quarter of fiscal 2009.
In December 2008, the FASB issued a new accounting pronouncement to provide guidance on an employer’s disclosures about plan assets of a defined benefit pension or other postretirement plan. The disclosures about plan assets is required for annual periods only and is effective for ARAMARK in fiscal 2010. The Company is currently evaluating this pronouncement.
In April 2008, the FASB issued a new accounting pronouncement which amends the factors that should be considered in developing renewal or extension assumptions used to determine the useful life of a recognized intangible asset. This accounting pronouncement is effective for ARAMARK beginning in fiscal 2010. The Company is currently evaluating this pronouncement.
S-10
ARAMARK CORPORATION AND SUBSIDIARIES
NOTES TO CONSOLIDATED FINANCIAL STATEMENTS—(Continued)
In December 2007, the FASB issued a new accounting pronouncement which will significantly change the accounting for business combinations and will impact financial statements both on the acquisition date and in subsequent periods. Under this accounting pronouncement, an acquiring entity will be required to recognize the assets acquired, the liabilities assumed, and any noncontrolling interest in the acquiree, measured at their fair values as of the acquisition date, with limited exceptions. It further requires that acquisition-related costs be recognized separately from the acquisition and expensed as incurred, restructuring costs generally be expensed in periods subsequent to the acquisition date and changes in accounting for deferred tax asset valuation allowances and acquired income tax uncertainties after the measurement periods impact income tax expense. The accounting pronouncement also includes a substantial number of new disclosure requirements. This accounting pronouncement is effective for ARAMARK for business combinations finalized beginning in fiscal 2010.
In December 2007, the FASB issued a new accounting pronouncement which establishes new accounting and reporting standards for the noncontrolling interest in a subsidiary and for the deconsolidation of a subsidiary. Among other matters, it also requires the recognition of a noncontrolling interest as equity in the consolidated financial statements and separate from the parent’s equity. The amount of net income attributable to the noncontrolling interest will be included in consolidated net income on the face of the consolidated statement of income. This accounting pronouncement is effective for ARAMARK beginning in fiscal 2010. The Company is currently evaluating this pronouncement.
In June 2009, the FASB issued a new accounting pronouncement which amends certain requirements for enterprises involved with variable interest entities to improve financial reporting and to provide more relevant and reliable information to users of financial statements. This accounting pronouncement is effective for ARAMARK beginning in fiscal 2011. The Company is currently evaluating this pronouncement.
In June 2009, the FASB issued a new accounting pronouncement regarding transfers of financial assets which improves the relevance, representational faithfulness and comparability of the information that a reporting entity provides in its financial reports, including the effects of the transfer on an entity’s financial position, financial performance and cash flows and the transferor’s continuing involvement in transferred financial assets. This accounting pronouncement is effective for ARAMARK beginning in fiscal 2011. The Company is currently evaluating this pronouncement.
Revenue Recognition
In each of the Company’s operating segments, revenue is recognized in the period in which services are provided pursuant to the terms of the Company’s contractual relationships with its clients. Revenues from direct marketing activities are recognized upon shipment. All sales-related taxes are presented on a net basis in “Cost of services provided” in the Consolidated Statements of Operations.
Vendor Consideration
Consideration received from vendors is accounted for as an adjustment to the cost of the vendor’s products or services and reported as a reduction of “Cost of services provided” or “Inventories.”
Use of Estimates
The preparation of financial statements in conformity with generally accepted accounting principles in the United States requires management to make estimates and assumptions that affect the reported amounts of assets and liabilities and disclosure of contingent assets and liabilities at the date of the financial statements and the reported amounts of sales and expenses during the reporting period. Actual results could differ from those estimates.
S-11
ARAMARK CORPORATION AND SUBSIDIARIES
NOTES TO CONSOLIDATED FINANCIAL STATEMENTS—(Continued)
Comprehensive Income
Comprehensive income includes all changes to shareholders’ equity during a period, except those resulting from investments by and distributions to shareholders. As of October 2, 2009 and October 3, 2008, “Accumulated other comprehensive loss” consisted of pension plan adjustments of ($17.7) million and ($11.3) million, respectively, foreign currency translation adjustment of $22.2 million and $6.8 million, respectively, and fair value of cash flow hedges of ($138.2) million and ($102.8) million, respectively. During fiscal 2009, the tax effects on other comprehensive loss were $3.6 million for pension plan adjustments, ($14.1) million for foreign currency translation adjustment and $23.1 million for fair value of cash flow hedges. During fiscal 2008, the tax effects on other comprehensive loss were $7.3 million for pension plan adjustments, $0.5 million for foreign currency translation adjustment and $37.4 million for fair value of cash flow hedges. During the Successor period from January 27, 2007 through September 28, 2007, the tax effects on other comprehensive loss were ($1.1) million for pension plan adjustments, ($9.2) million for foreign currency translation adjustment and $21.7 million for fair value of cash flow hedges. During the Predecessor period from September 30, 2006 through January 26, 2007, the tax effects on other comprehensive income were ($0.3) million for foreign currency translation adjustment and ($5.7) million for fair value of cash flow hedges and the tax effects on the adoption of accounting pronouncement related to pension and other postretirement plans was $7.9 million.
Currency Translation
Gains and losses resulting from the translation of financial statements of non-U.S. subsidiaries are reflected as a component of accumulated other comprehensive income (loss) in shareholders’ equity. Currency transaction gains included in operating results for the Successor period from January 27, 2007 through September 28, 2007 were approximately $4.0 million. Transaction gains and losses included in operating results for fiscal 2009, fiscal 2008 and the Predecessor period were immaterial.
Current Assets
The Company considers all highly liquid investments with an original maturity of three months or less to be cash equivalents.
Inventories are valued at the lower of cost (principally the first-in, first-out method) or market. Personalized work apparel, linens and other rental items in service are recorded at cost and are amortized over their estimated useful lives, which primarily range from one to four years. The amortization rates used are based on the Company’s specific experience.
The components of inventories are as follows:
| October 2, 2009 |
October 3, 2008 |
|||||
| Food |
37.1 | % | 33.6 | % | ||
| Career apparel, safety equipment and linens |
58.6 | % | 62.6 | % | ||
| Parts, supplies and novelties |
4.3 | % | 3.8 | % | ||
| 100.0 | % | 100.0 | % | |||
Property and Equipment
Property and equipment are stated at cost and are depreciated over their estimated useful lives on a straight-line basis. Gains and losses on dispositions are included in operating results. Maintenance and repairs are charged to current operations, and replacements and significant improvements are capitalized. The estimated useful lives
S-12
ARAMARK CORPORATION AND SUBSIDIARIES
NOTES TO CONSOLIDATED FINANCIAL STATEMENTS—(Continued)
for the major categories of property and equipment are 10 to 40 years for buildings and improvements and 3 to 10 years for service equipment and fixtures. Depreciation expense during fiscal 2009, fiscal 2008, the Successor period from January 27, 2007 through September 28, 2007 and the Predecessor period from September 30, 2006 through January 26, 2007 was $255.5 million, $262.7 million, $169.9 million and $82.1 million, respectively.
Other Assets
Other assets consist primarily of investments in 50% or less owned entities, client contract investments, deferred financing costs, computer software costs and long-term receivables. Investments in which the Company owns more than 20% but less than a majority are accounted for using the equity method. Investments in which the Company owns less than 20% are accounted for under the cost method. Client contract investments generally represent a cash payment provided by the Company to help finance improvement or renovation at the facility from which the Company operates. These amounts are amortized over the contract period. If a contract is terminated prior to its maturity date, the Company is reimbursed for the unamortized client contract investment amount.
The Company’s principal equity method investment is its 50% ownership interest in AIM Services Co., Ltd., a Japanese food and support services company (approximately $212.3 million and $190.7 million at October 2, 2009 and October 3, 2008, respectively, which is included in “Other Assets” in the Consolidated Balance Sheets). Summarized financial information for AIM Services Co., Ltd. follows (in thousands):
| October 2, 2009 |
October 3, 2008 | |||||
| Current assets |
$ | 271,995 | $ | 255,836 | ||
| Noncurrent assets |
191,679 | 171,844 | ||||
| Current liabilities |
259,430 | 233,664 | ||||
| Noncurrent liabilities |
62,356 | 51,386 | ||||
| Minority interest |
525 | 396 | ||||
| Fiscal Year Ended October 2, 2009 |
Fiscal Year Ended October 3, 2008 | |||||
| Sales |
$ | 1,510,220 | $ | 1,383,076 | ||
| Gross profit |
181,082 | 164,207 | ||||
| Net income |
36,163 | 23,401 | ||||
ARAMARK’s equity in undistributed earnings of AIM Services Co., Ltd., net of amortization of allocated purchase consideration (see Note 2), was $13.2 million and $8.4 million for fiscal 2009 and fiscal 2008, respectively, and is recorded as a reduction of “Cost of services provided” in the Consolidated Statements of Operations. During fiscal 2009 and 2008, the Company received $24.2 million and $5.3 million of cash distributions from AIM Services Co., Ltd, respectively.
Other Accrued Expenses and Liabilities
Other accrued expenses and current liabilities consist principally of insurance accruals, advanced payments from clients, taxes, interest and accrued commissions. Advanced payments from clients as of October 2, 2009 and October 3, 2008 were $150.3 million and $136.1 million, respectively. Noncurrent liabilities consist primarily of deferred compensation, insurance accruals, pension liabilities, fair value of interest rate swaps and other hedging agreements and asset retirement obligations.
S-13
ARAMARK CORPORATION AND SUBSIDIARIES
NOTES TO CONSOLIDATED FINANCIAL STATEMENTS—(Continued)
The Company is self-insured for the risk retained under its health and welfare and general liability and workers’ compensation arrangements. Self-insurance reserves are recorded based on historical claims experience and actuarial analyses. As of October 2, 2009 and October 3, 2008, $86.1 million and $55.9 million of insurance accruals were included in accrued expenses and other current liabilities, respectively. The change in insurance accruals is primarily due to the increase of self-insurance retained by the Company under its arrangements.
Fair Value of Financial Instruments
The Company’s financial instruments consist primarily of cash and cash equivalents, accounts receivable, accounts payable, current and long-term borrowings, derivatives and common stock subject to repurchase. The Company believes that the carrying value of cash and cash equivalents, accounts receivable and accounts payable are representative of their respective fair values. See Note 17 for the fair value of the Company’s financial instruments.
Share-Based Compensation
The Company recognizes compensation cost related to share-based payment transactions in the consolidated financial statements. The cost is measured at the grant date, based on the estimated fair value of the award, and is recognized as an expense over the employee’s requisite service period (generally the vesting period of the equity award). See Note 11 for additional information on share-based compensation.
Supplemental Cash Flow Information
| Successor | Predecessor | |||||||||||||
| Fiscal Year Ended October 2, 2009 |
Fiscal Year Ended October 3, 2008 |
Period from January 27, 2007 through September 28, 2007 |
Period from September 30, 2006 through January 26, 2007 | |||||||||||
| (dollars in millions) | ||||||||||||||
| Interest paid |
$ | 427.7 | $ | 479.0 | $ | 335.6 | $ | 52.9 | ||||||
| Income taxes paid |
$ | 38.3 | $ | 60.7 | $ | 95.2 | $ | 50.0 | ||||||
Cash from other financing activities during the Successor period from January 27, 2007 through September 28, 2007 includes a use of approximately $141.1 million for deferred financing costs.
Significant noncash activities follow:
| • | During fiscal 2009, fiscal 2008, the Successor period from January 27, 2007 through September 28, 2007 and the Predecessor period from September 30, 2006 through January 26, 2007, the Company executed capital lease transactions. The present value of the future rental obligations was approximately $9.1 million, $19.8 million, $23.5 million and $0.4 million for the respective periods, which is included in property and equipment and long-term borrowings. |
| • | During fiscal 2009, approximately $5.1 million of common stock of the Parent Company was repurchased through the issuance of promissory notes. |
| • | During fiscal 2009, fiscal 2008, the Successor period from January 27, 2007 through September 28, 2007 and the Predecessor period from September 30, 2006 through January 26, 2007, cashless settlements of the exercise price and related employee minimum tax withholding liabilities of share-based payment awards were approximately $12.9 million, $4.3 million, $0 and $3.6 million, respectively. |
S-14
ARAMARK CORPORATION AND SUBSIDIARIES
NOTES TO CONSOLIDATED FINANCIAL STATEMENTS—(Continued)
Subsequent Events
The Company has evaluated the impact of subsequent events from October 3, 2009 through December 15, 2009, the date the consolidated financial statements herein were issued.
NOTE 2. ACQUISITION OF ARAMARK CORPORATION:
As discussed in Note 1, the Transaction was completed on January 26, 2007 and was financed by a combination of borrowings under a new senior secured credit agreement, the issuance of 8.50% senior notes due 2015 and senior floating rate notes due 2015, and equity investments by the Sponsors and certain members of ARAMARK’s management. See Note 5 for a description of the Company’s indebtedness.
The Transaction sources and uses of funds are summarized below (in millions):
| Sources |
|||
| Senior secured credit agreement borrowings |
$ | 4,314 | |
| 8.50% senior notes due 2015 |
1,280 | ||
| Senior floating rate notes due 2015 |
500 | ||
| Equity contributions |
1,839 | ||
| Total sources |
$ | 7,933 | |
| Uses |
|||
| Purchase price |
$ | 6,022 | |
| Refinance of existing indebtedness |
1,698 | ||
| Fees and expenses |
213 | ||
| Total uses |
$ | 7,933 | |
Purchase Price Allocation
Following business combination accounting, the total purchase price was allocated to the Company’s net tangible and identifiable intangible assets based on the estimated fair values as of January 26, 2007 as set forth below. The excess of the purchase price over the net tangible and identifiable intangible assets was recorded as goodwill. The allocation of the purchase price to property and equipment, intangible assets and deferred income taxes was based upon valuation data and estimates.
| (in millions) | ||||
| Purchase consideration, including carryover basis of $146 million |
$ | 6,168 | ||
| Direct acquisition costs |
71 | |||
| Deemed dividend adjustment |
(408 | ) | ||
| $ | 5,831 | |||
| Net current assets |
$ | 307 | ||
| Property and equipment |
1,197 | |||
| Customer relationship assets |
1,705 | |||
| Trade name |
764 | |||
| Other assets |
789 | |||
| Goodwill |
4,485 | |||
| Debt assumed |
(2,036 | ) | ||
| Non-current liabilities and deferred taxes |
(1,380 | ) | ||
| $ | 5,831 | |||
S-15
ARAMARK CORPORATION AND SUBSIDIARIES
NOTES TO CONSOLIDATED FINANCIAL STATEMENTS—(Continued)
Mr. Neubauer held an equity investment in the Company prior to the Transaction and continues to hold an equity interest in the Parent Company subsequent to the Transaction. In accordance with the accounting pronouncement for leveraged buyout transactions, Mr. Neubauer’s investment is included in the purchase consideration at the carryover basis and an adjustment of $408 million was made to reduce “Capital surplus” reflecting the deemed dividend.
Pro Forma Financial Information
The following unaudited pro forma results of operations (in millions) assume that the Transaction occurred at the beginning of fiscal 2007, adjusted for the impact of certain acquisition related items, such as: additional amortization of identified intangible assets, additional depreciation expense of property and equipment, increased interest expense on acquisition debt, exclusion of Transaction-related charges and the related income tax effects. This unaudited pro forma information should not be relied upon as necessarily being indicative of the results that would have been obtained if the Transaction had actually occurred at the beginning of the fiscal period, nor of the results that may be reported in the future.
| Fiscal Year Ended September 28, 2007 | |||
| Sales |
$ | 12,384.3 | |
| Operating income |
536.3 | ||
| Interest and other financing costs, net |
530.8 | ||
| Net income |
9.4 | ||
Transaction-Related Costs
During the Predecessor period from September 30, 2006 through January 26, 2007, the Company recorded costs of approximately $112.1 million related to the Transaction. These costs, which are included in “Selling and general corporate expenses,” consist of approximately $11.2 million of accounting, investment banking, legal and other costs associated with the Transaction, a compensation charge of approximately $77.1 million related to the accelerated vesting and buyout of employee stock options and restricted stock units, and a charge of approximately $23.8 million related to change in control payments to certain executives. During the Successor period from January 27, 2007 through September 28, 2007, the Company recorded costs of approximately $5.7 million related to legal fees associated with the Transaction, which are also included in “Selling and general corporate expenses.”
During the Successor period from January 27, 2007 through September 28, 2007, the Company also recorded a charge of $12.8 million for the cost of obtaining a bridge financing facility, which is included in “Interest and Other Financing Costs, net.” The cost was expensed in the Successor period since the bridge financing facility was entered into as part of the Transaction in the event the Company was unable to borrow funds in a public offering or a Rule 144A or other private placement; however, no funds were ever borrowed under the bridge financing facility since the Company was able to borrow the required funds in a Rule 144A transaction, and the bridge financing facility ceased to be available after the closing of the Transaction.
NOTE 3. ACQUISITIONS AND DIVESTITURES:
Fiscal 2009
During fiscal 2009, the Company paid approximately $26.7 million for the acquisition of the remaining 20% of its Chilean subsidiary. The Company also acquired a refreshment services business and several regional uniform rental companies. The Company’s pro forma results of operations for fiscal 2009, fiscal 2008, the
S-16
ARAMARK CORPORATION AND SUBSIDIARIES
NOTES TO CONSOLIDATED FINANCIAL STATEMENTS—(Continued)
Successor period from January 27, 2007 through September 28, 2007 and the Predecessor period from September 30, 2006 through January 26, 2007 would not have been materially different than reported, assuming the acquisitions had occurred at the beginning of the respective periods.
During fiscal 2009, the Company paid $85.0 million as additional consideration related to the fiscal 2006 acquisition of an online catering company per the terms of the acquisition agreement which was accrued as part of the purchase price allocation for the Transaction.
Subsequent to October 2, 2009, the Company completed the acquisition of the facilities management and property management businesses of Veris Plc, an Irish company, for consideration of approximately $75 million in cash.
Fiscal 2008
During fiscal 2008, the Company acquired various food, hospitality and facility services businesses, including a food and facility services company in India and several refreshment services businesses, as well as several regional uniform rental companies. The aggregate consideration for these acquisitions was approximately $55 million. The Company’s pro forma results of operations for fiscal 2008, the Successor period from January 27, 2007 through September 28, 2007 and the Predecessor period from September 30, 2006 through January 26, 2007 would not have been materially different than reported, assuming that the acquisitions had occurred at the beginning of the respective periods.
Successor Period from January 27, 2007 through September 28, 2007
During the Successor period, the Company sold its 50% partnership interest in SMG for approximately $285 million, net of transaction fees, which exceeded the historical basis of the investment prior to the Transaction by approximately $217 million. The excess was fully taxable and resulted in an income tax liability of approximately $76 million. In connection with the Transaction accounting, the SMG investment was written up to its estimated acquisition date fair value, except for the portion (approximately 10%) related to the carryover investor basis (see Note 2). As a result, for financial reporting purposes a gain of $21.2 million, related to the Predecessor basis portion of the investment, was recognized as “Other (income) expense.” The Company also acquired the remaining 10% ownership interest in its Irish food service affiliate, STAR Uniforms, Inc., a regional uniform rental company, and several refreshment services companies for approximately $56 million in cash. The Company’s pro forma results of operations for the Successor period from January 27, 2007 through September 28, 2007 and the Predecessor period from September 30, 2006 through January 26, 2007 would not have been materially different than reported, assuming that the divestiture and acquisitions had occurred at the beginning of the respective fiscal periods.
Predecessor Period from September 30, 2006 through January 26, 2007
During the Predecessor period from September 30, 2006 through January 26, 2007, the Company acquired Overall Laundry Services, Inc., a regional uniform rental company, for approximately $80 million in cash. The Company’s pro forma results of operations for the Predecessor period from September 30, 2006 through January 26, 2007 would not have been materially different than reported, assuming that the acquisition had occurred at the beginning of the fiscal period.
NOTE 4. GOODWILL AND OTHER INTANGIBLE ASSETS:
Goodwill represents the excess of the cost of an acquired entity over the fair value of assets acquired and liabilities assumed in a business combination. Goodwill is not amortized and is subject to an impairment test that
S-17
ARAMARK CORPORATION AND SUBSIDIARIES
NOTES TO CONSOLIDATED FINANCIAL STATEMENTS—(Continued)
we conduct annually or more frequently if a change in circumstances or the occurrence of events indicates that potential impairment exists, using discounted cash flows. The Company performs its assessment of goodwill at the operating segment level unless specific circumstances require evaluation at a lower level. Within the Food and Support Services—International segment, each country is evaluated separately since such operating units are relatively autonomous and separate goodwill balances have been recorded for each entity. The Company has completed the annual goodwill impairment test, which did not result in an impairment charge.
Goodwill, allocated by segment (see Note 16 for a description of segments), follows (in thousands):
| October 3, 2008 |
Acquisitions | Translation and Other |
October 2, 2009 | ||||||||||
| Food and Support Services—North America |
$ | 3,477,824 | $ | 7,017 | $ | — | $ | 3,484,841 | |||||
| Food and Support Services—International |
438,124 | 14,151 | (10,750 | ) | 441,525 | ||||||||
| Uniform and Career Apparel |
596,185 | 918 | 2,907 | 600,010 | |||||||||
| $ | 4,512,133 | $ | 22,086 | $ | (7,843 | ) | $ | 4,526,376 | |||||
The amounts for acquisitions during fiscal 2009 may be revised upon final determination of the purchase price allocations. The other adjustment to the Uniform and Career Apparel segment represents an immaterial correction related to environmental reserves for periods prior to the Transaction.
Other intangible assets consist of (in thousands):
| October 2, 2009 | October 3, 2008 | |||||||||||||||||||
| Gross Amount |
Accumulated Amortization |
Net Amount |
Gross Amount |
Accumulated Amortization |
Net Amount | |||||||||||||||
| Customer relationship assets |
$ | 1,780,875 | $ | (488,238 | ) | $ | 1,292,637 | $ | 1,757,818 | $ | (305,961 | ) | $ | 1,451,857 | ||||||
| Trade name |
763,700 | — | 763,700 | 763,464 | — | 763,464 | ||||||||||||||
| $ | 2,544,575 | $ | (488,238 | ) | $ | 2,056,337 | $ | 2,521,282 | $ | (305,961 | ) | $ | 2,215,321 | |||||||
Acquisition-related intangible assets consist of customer relationship assets and the ARAMARK trade name. Customer relationship assets are amortizable and are being amortized on a straight-line basis over the expected period of benefit, 3 to 17 years, with a weighted average life of about 10 years. The ARAMARK trade name is an indefinite lived intangible asset and is not amortizable but is evaluated for impairment at least annually.
Intangible assets of approximately $22 million were acquired through business combinations during fiscal 2009. Amortization of intangible assets for fiscal 2009, fiscal 2008, the Successor period from January 27, 2007 through September 28, 2007 and the Predecessor period from September 30, 2006 through January 26, 2007 was approximately $182 million, $188 million, $118 million and $18 million, respectively.
The estimated amortization expense of the amortizable intangible assets through 2014 reflects the Transaction and acquisitions since January 26, 2007. Based on the recorded balances at October 2, 2009, total estimated amortization of all acquisition-related intangible assets for fiscal years 2010 through 2014 follows (in thousands):
| 2010 |
$184,307 | |
| 2011 |
$183,937 | |
| 2012 |
$182,815 | |
| 2013 |
$183,008 | |
| 2014 |
$143,843 |
S-18
ARAMARK CORPORATION AND SUBSIDIARIES
NOTES TO CONSOLIDATED FINANCIAL STATEMENTS—(Continued)
NOTE 5. BORROWINGS:
Long-term borrowings at October 2, 2009 and October 3, 2008 are summarized in the following table (in thousands):
| October 2, 2009 |
October 3, 2008 |
|||||||
| Senior secured revolving credit facility (A) |
$ | — | $ | 2,771 | ||||
| Senior secured term loan facility (A) |
3,622,958 | 3,732,319 | ||||||
| 8.50% senior notes, due February 2015 (B) |
1,280,000 | 1,280,000 | ||||||
| Senior floating rate notes, due February 2015 (B) |
500,000 | 500,000 | ||||||
| 5.00% senior notes, due June 2012 (C) |
236,968 | 232,772 | ||||||
| Capital leases |
59,834 | 68,707 | ||||||
| Other (D) |
21,923 | 42,988 | ||||||
| 5,721,683 | 5,859,557 | |||||||
| Less—current portion |
(43,943 | ) | (54,677 | ) | ||||
| $ | 5,677,740 | $ | 5,804,880 | |||||
In connection with the completion of the Transaction on January 26, 2007, the Company (i) entered into a new $4.15 billion senior secured term loan facility, (ii) issued $1.28 billion of 8.50% senior notes due 2015 and $500 million of senior floating rate notes due 2015, (iii) entered into a new $600 million senior secured revolving credit facility with a six-year maturity (approximately $581.0 million available for borrowing as October 2, 2009), and (iv) entered into a new synthetic letter of credit facility for up to $250 million (which was reduced to $200 million in January 2008).
Senior Secured Credit Facilities
The senior secured revolving credit facility consists of the following subfacilities:
| • | A revolving credit facility available for loans in U.S. dollars to the Company with aggregate commitments of $435 million; |
| • | A revolving credit facility available for loans in sterling or U.S. dollars to the Company or a U.K. subsidiary with aggregate commitments of $40 million; |
| • | A revolving credit facility available for loans in Euros or U.S. dollars to the Company or an Irish subsidiary with aggregate commitments of $20 million; |
| • | A revolving credit facility available for loans in Euros or U.S. dollars to the Company or German subsidiaries with aggregate commitments of $30 million; and |
| • | A revolving credit facility available for loans in Canadian dollars or U.S. dollars to the Company or a Canadian subsidiary with aggregate commitments of $75 million. |
The senior secured term loan facility consists of the following subfacilities:
| • | A U.S. dollar denominated term loan to the Company in the amount of $3,547 million ($3,048.1 million as of October 2, 2009); |
| • | A yen denominated term loan to the Company in the amount of ¥5,422 million (¥5,273.0 million as of October 2, 2009); |
| • | A U.S. dollar denominated term loan to a Canadian subsidiary in the amount of $170 million ($165.3 million as of October 2, 2009); |
S-19
ARAMARK CORPORATION AND SUBSIDIARIES
NOTES TO CONSOLIDATED FINANCIAL STATEMENTS—(Continued)
| • | A Euro denominated term loan to an Irish subsidiary in an amount of €44 million (€42.8 million as of October 2, 2009); |
| • | A sterling denominated term loan to a U.K. subsidiary in an amount of £122 million (£118.6 million as of October 2, 2009); and |
| • | A Euro denominated term loan to German subsidiaries in the amount of €70 million (€68.1 million as of October 2, 2009). |
The senior secured credit facilities provide that the Company has the right at any time to request up to $750 million of incremental commitments in the aggregate under one or more incremental term loan facilities and/or synthetic letter of credit facilities and/or revolving credit facilities and/or by increasing commitments under the revolving credit facility. The Company’s ability to obtain extensions of credit under these incremental facilities or commitments will be subject to the same conditions as extensions of credit under the existing credit facilities. However, the lenders under these facilities will not be under any obligation to provide any such incremental facilities or commitments, and any such addition of or increase in facilities or commitments will be subject to pro forma compliance with an incurrence-based financial covenant and customary conditions precedent.
Borrowings under the senior secured credit facilities bear interest at a rate equal to an applicable margin plus, at the Company’s option, either (a) a LIBOR rate determined by reference to the costs of funds for deposits in the currency of such borrowing for the interest period relevant to such borrowing adjusted for certain additional costs, (b) with respect to borrowings denominated in U.S. Dollars, a base rate determined by reference to the higher of (1) the prime rate of the administrative agent, and (2) the federal funds rate plus 0.50% or (c) with respect to borrowings denominated in Canadian dollars, (1) a base rate determined by reference to the prime rate of Canadian banks or (2) a BA (bankers’ acceptance) rate determined by reference to the rate offered for bankers’ acceptances in Canadian dollars for the interest period relevant to such borrowing.
The applicable margin spread for borrowings under the revolving credit facility are 1.25% to 2.00% (as of October 2, 2009—2.00%) with respect to LIBOR borrowings and 0.25% to 1.00% (as of October 2, 2009—1.00%) with respect to base-rate borrowings.
Prior to April 16, 2007, the applicable margin spreads for borrowings under the term loan facilities were 2.00% to 2.125% with respect to LIBOR borrowings and 1.00% to 1.125% with respect to base-rate borrowings. On March 28, 2007, the Company amended the senior secured credit agreement (i) to lower the interest rate spread on the U.S. dollar and Euro term loans, (ii) to reduce the fees that it pays on the synthetic letter of credit facility, (iii) to add a provision requiring payment of a prepayment fee upon certain repayments for the purpose of reducing the interest rate spread effected within one year of the date of the amendment and (iv) to make certain other modifications set forth in the amendment. Effective on April 16, 2007, the applicable margin spreads under the U.S. dollar and Euro term loan facilities and the synthetic letter of credit facilities are 1.875% to 2.125% (as of October 2, 2009—1.875%) with respect to LIBOR borrowings and 0.875% to 1.125% (as of October 2, 2009—0.875%) with respect to base-rate borrowings. The applicable margin spreads under the yen and sterling term loan facilities are 2.00% to 2.125% (as of October 2, 2009—2.125%) with respect to LIBOR borrowings and 1.00% to 1.125% (as of October 2, 2009—1.125%) with respect to base-rate borrowings.
In addition to paying interest on outstanding principal under the senior secured credit facilities, the Company is required to pay a commitment fee to the lenders under the revolving credit facility in respect of the unutilized commitments thereunder. The commitment fee rate ranges from 0.375% to 0.50% per annum (as of October 2, 2009—0.50%).
S-20
ARAMARK CORPORATION AND SUBSIDIARIES
NOTES TO CONSOLIDATED FINANCIAL STATEMENTS—(Continued)
Prior to April 16, 2007, fees on the $200 million synthetic letter of credit facility ranged from 2.00% to 2.125%. Effective on April 16, 2007, fees on the synthetic letter of credit facilities are 1.875% to 2.125% (as of October 2, 2009—1.875%).
The actual spreads within all ranges referred to above are based on a ratio of Consolidated Secured Debt to EBITDA, each as defined in the senior secured credit agreement.
All obligations under the senior secured credit facilities are secured by a security interest in substantially all assets of the Company and its U.S. subsidiaries.
The senior secured credit facilities require the Company to prepay outstanding term loans, subject to certain exceptions, with (i) 50% of the Company’s Excess Cash Flow (as defined in the senior secured credit agreement) commencing with fiscal year 2008, (ii) 100% of the net cash proceeds of all nonordinary course asset sales or other dispositions of property subject to certain exceptions and customary reinvestment rights, and (iii) 100% of the net cash proceeds of any incurrence of debt, including debt incurred by any business securitization subsidiary in respect of any business securitization facility, but excluding proceeds from the Company’s receivables facilities and other debt permitted under the senior secured credit agreement. Any mandatory prepayments would be applied to the term loan facilities as directed by the Company. The Company may voluntarily repay outstanding loans under the senior secured credit facilities at any time without premium or penalty, other than customary “breakage” costs with respect to LIBOR loans. Prepaid term loans may not be reborrowed. In fiscal 2009, the Company prepaid outstanding term loan of $100.0 million based on 50% of the Company’s Excess Cash Flow (as defined in the senior secured credit agreement).
The Company is required to repay the senior secured term loan facilities in quarterly principal amounts of 0.25% of the funded total principal amount for the first six years and nine months, with the remaining amount payable on January 26, 2014. On March 30, 2007, June 29, 2007 and September 28, 2007, the Company voluntarily prepaid an additional $40.0 million, $300.0 million and $50.0 million, respectively. All required quarterly principal amounts of the U.S. term loan have been paid through its maturity in January 2014.
Principal amounts outstanding under the revolving credit facility are due and payable in full at maturity, January 26, 2013, on which day the commitments thereunder will terminate.
Principal amounts outstanding under the synthetic letter of credit facility are due and payable in full at maturity, January 26, 2014, on which day the commitments thereunder will terminate.
The senior secured credit agreement contains a number of covenants that, among other things, restrict, subject to certain exceptions, the Company’s ability to: incur additional indebtedness; issue preferred stock or provide guarantees; create liens on assets; engage in mergers or consolidations; sell assets; pay dividends, make distributions or repurchase its capital stock; make investments, loans or advances; repay or repurchase any notes, except as scheduled or at maturity; create restrictions on the payment of dividends or other amounts to the Company from its restricted subsidiaries; make certain acquisitions; engage in certain transactions with affiliates; amend material agreements governing the Company’s outstanding notes (or any indebtedness that refinances the notes); and fundamentally change the Company’s business. In addition, the senior secured revolving credit facility requires the Company to maintain a maximum senior secured leverage ratio and imposes limitations on capital expenditures. The senior secured credit agreement also contains certain customary affirmative covenants, such as financial and other reporting, and certain events of default. At October 2, 2009, the Company was in compliance with all of these covenants.
S-21
ARAMARK CORPORATION AND SUBSIDIARIES
NOTES TO CONSOLIDATED FINANCIAL STATEMENTS—(Continued)
Beginning with the twelve months ended March 30, 2007, the senior secured credit agreement requires the Company to maintain a maximum Consolidated Secured Debt Ratio, defined as consolidated total indebtedness secured by a lien to Adjusted EBITDA, of 5.875x, being reduced over time to 4.25x by the end of 2013 (as of October 2, 2009—5.25x). Consolidated total indebtedness secured by a lien is defined in the senior secured credit agreement as total indebtedness outstanding under the senior secured credit agreement, capital leases, advances under the Receivables Facility and any other indebtedness secured by a lien reduced by the lesser of the amount of cash and cash equivalents on the consolidated balance sheet that is free and clear of any lien $75 million. Non-compliance with the maximum Consolidated Secured Debt Ratio could result in the requirement to immediately repay all amounts outstanding under such agreement, which, if the Company’s lenders failed to waive any such default, would also constitute a default under the indenture. The actual ratio at October 2, 2009 was 3.72x.
The senior secured credit agreement establishes an incurrence-based minimum Interest Coverage Ratio, defined as Adjusted EBITDA to consolidated interest expense, the achievement of which is a condition for the Company to incur additional indebtedness and to make certain restricted payments. The minimum Interest Coverage Ratio is 2.00x for the term of the senior secured credit agreement. If the Company does not maintain this minimum Interest Coverage Ratio calculated on a pro forma basis for any such additional indebtedness or restricted payments, it could be prohibited from being able to incur additional indebtedness, other than the additional funding provided for under the senior secured credit agreement and pursuant to specified exceptions, and make certain restricted payments, other than pursuant to certain exceptions. Consolidated interest expense is defined in the senior secured credit agreement as consolidated interest expense excluding interest income, adjusted for acquisitions (including the Transaction) and dispositions, further adjusted for certain non-cash or nonrecurring interest expense and the Company’s estimated share of interest expense from one equity method investee. The actual ratio was 2.24x for the twelve months ended October 2, 2009.
8.50% Senior Notes due 2015 and Senior Floating Rate Notes due 2015
The senior floating rate notes due 2015 bear interest equal to three-month LIBOR (as defined in the indenture) plus a spread of 3.50%.
The 8.50% senior notes due 2015 and senior floating rate notes due 2015 are senior unsecured obligations of the Company.
The Company may redeem some or all of the 8.50% senior notes due 2015 at any time on or after February 1, 2011 and some or all of the senior floating rate notes due 2015 at any time, in each case at varying redemption prices that are stated in the indenture and generally include premiums. Prior to February 1, 2011, the Company may redeem some or all of the 8.50% senior notes due 2015 at a price equal to 100% of the principal amount of the notes redeemed plus the applicable “make-whole” premium as defined in the indenture. At any time before February 1, 2010, the Company may also redeem up to 35% of the 8.50% senior notes due 2015 at a redemption price equal to 108.5% of the principal amount using the proceeds of certain equity offerings.
If the Company experiences specific kinds of “changes in control,” it will be required to make an offer to purchase the 8.50% senior notes due 2015 and senior floating rate notes due 2015 at a purchase price of 101% of the principal amount thereof, plus accrued and unpaid interest to the purchase date. If the Company sells assets under certain circumstances, it will be required to make an offer to purchase the 8.50% senior notes due 2015 and senior floating rate notes due 2015 at a purchase price of 100% of the principal amount thereof, plus accrued and unpaid interest to the purchase date.
S-22
ARAMARK CORPORATION AND SUBSIDIARIES
NOTES TO CONSOLIDATED FINANCIAL STATEMENTS—(Continued)
The indenture governing the 8.50% senior notes due 2015 and the senior floating rate notes due 2015 restricts the Company’s ability to, among other things, incur additional indebtedness, pay dividends and make certain other distributions, investments and other restricted payments. As of October 2, 2009, the Company was in compliance with the covenants of the indenture.
5.00% Senior Notes due 2012
During the third quarter of fiscal 2005, ARAMARK Services, Inc. issued $250 million of 5.00% senior unsecured notes due 2012. The notes are recorded at $237.0 million as October 2, 2009 as a result of the fair value accounting adjustments made in connection with the Transaction. The discount of $13.0 million will be accreted as interest expense over the remaining period to maturity.
Repayment of Indebtedness
With a portion of the proceeds of the new borrowings and the equity contributions in connection with the Transaction, the Company repaid the outstanding balances of its senior unsecured revolving credit facility, senior European unsecured revolving credit facility, bank term loan due March 2007, Japanese borrowings due March 2007, 6.375% senior notes due 2008, 7.00% senior notes due 2007, 7.25% senior notes and debentures due 2007 and certain other obligations. In connection with the repayment of the 6.375% senior notes due 2008 and 7.00% senior notes due 2007, the Company incurred prepayment penalties of approximately $2.4 million and $0.8 million, respectively, which were included in the purchase price of the Transaction.
At October 2, 2009, annual maturities on long-term borrowings maturing in the next five fiscal years and thereafter (excluding the $13.0 million discount on the 5.00% senior notes due 2012) are as follows (in thousands):
| 2010 |
$ | 43,943 | |
| 2011 |
$ | 31,525 | |
| 2012 |
$ | 263,489 | |
| 2013 |
$ | 12,507 | |
| 2014 |
$ | 3,597,440 | |
| Thereafter |
$ | 1,785,811 |
The components of interest and other financing costs, net, are summarized as follows (in thousands):
| Successor | Predecessor | |||||||||||||||||
| Fiscal Year Ended October 2, 2009 |
Fiscal Year Ended October 3, 2008 |
Period from January 27, 2007 through September 28, 2007 |
Period from September 30, 2006 through January 26, 2007 |
|||||||||||||||
| Interest expense |
$ | 480,001 | $ | 505,661 | $ | 365,551 | $ | 45,300 | ||||||||||
| Interest income |
(12,827 | ) | (2,644 | ) | (9,491 | ) | (763 | ) | ||||||||||
| Other financing costs |
5,131 | 11,673 | 9,827 | 4,135 | ||||||||||||||
| Total |
$ | 472,305 | $ | 514,690 | $ | 365,887 | $ | 48,672 | ||||||||||
NOTE 6. DERIVATIVE INSTRUMENTS:
The Company enters into derivative contractual arrangements to manage changes in market conditions related to debt obligations, foreign currency exposures and exposure to fluctuating natural gas, gasoline and diesel fuel prices. Derivative instruments utilized during the period include interest rate swap agreements, foreign
S-23
ARAMARK CORPORATION AND SUBSIDIARIES
NOTES TO CONSOLIDATED FINANCIAL STATEMENTS—(Continued)
currency forward exchange contracts, and natural gas, gasoline and diesel fuel hedge agreements. All derivative instruments are recognized as either assets or liabilities on the balance sheet at fair value at the end of each quarter. The counterparties to the Company’s contractual derivative agreements are all major international financial institutions. The Company is exposed to credit loss in the event of nonperformance by these counterparties. The Company continually monitors its positions and the credit ratings of its counterparties, and does not anticipate nonperformance by the counterparties. For all hedging relationships the Company formally documents the hedging relationship and its risk management objective and strategy for undertaking the hedge, the hedging instrument, the hedged item, the nature of the risk being hedged, how the hedging instrument’s effectiveness in offsetting the hedged risk will be assessed prospectively and retrospectively, and a description of the method of measuring ineffectiveness. The Company also formally assesses, both at the hedge’s inception and on an ongoing basis, whether the derivatives that are used in hedging transactions are highly effective in offsetting cash flows of hedged items.
Successor
Cash Flow Hedges
The Company has entered into $3.98 billion, £50.0 million and ¥5.0 billion of interest rate swap agreements, fixing the rate on a like amount of variable rate term loan borrowings and floating rate notes. The Company entered into $500 million of these interest rate swap agreements during fiscal 2009, which will be effective beginning in fiscal 2010. Changes in the fair value of a derivative that is designated as and meets all the required criteria for a cash flow hedge are recorded in accumulated other comprehensive income (loss) and reclassified into earnings as the underlying hedged item affects earnings. As of October 2, 2009 and October 3, 2008, approximately ($128.1) million and ($90.0) million of unrealized net losses, net of tax, related to the interest rate swaps were included in “Accumulated other comprehensive loss,” respectively. The hedge ineffectiveness for these cash flow hedging instruments during fiscal 2009, fiscal 2008 and the Successor Period from January 27, 2007 through September 28, 2007 was immaterial.
The Company entered into a $169.6 million amortizing forward starting cross currency swap to mitigate the risk of variability in principal and interest payments on the Canadian subsidiary’s variable rate debt denominated in U.S. dollars. The agreement fixes the rate on the variable rate borrowings and mitigates changes in the Canadian dollar/U.S. dollar exchange rate. Changes in the fair value of a derivative that is designated as and meets all the required criteria for a cash flow hedge are recorded in accumulated other comprehensive income (loss) and reclassified into earnings as the underlying hedged item affects earnings. During fiscal 2009, fiscal 2008 and the Successor Period from January 27, 2007 through September 28, 2007, approximately ($0.8) million of net unrealized losses, net of tax, $4.4 million of net unrealized gains, net of tax, and ($19.7) million of net unrealized losses, net of tax, related to the swap were recorded in “Accumulated other comprehensive loss,” respectively. Approximately $0.2 million, ($9.2) million and $16.7 million were reclassified to offset net translation gains (losses) on the foreign currency denominated debt during fiscal 2009, fiscal 2008 and the Successor Period from January 27, 2007 through September 28, 2007, respectively. As of October 2, 2009 and October 3, 2008, unrealized losses of approximately ($8.4) million, net of tax, and ($7.8) million, net of tax, related to the cross currency swap were included in “Accumulated other comprehensive loss,” respectively. The hedge ineffectiveness for this cash flow hedging instrument during fiscal 2009, fiscal 2008 and the Successor Period from January 27, 2007 through September 28, 2007 was immaterial.
The Company entered into a series of pay fixed/receive floating natural gas hedge agreements based on a NYMEX price in order to limit its exposure to price increases for natural gas, primarily in the Uniform and Career Apparel segment. As of October 2, 2009, the Company has contracts for approximately 763,000 MMBtu’s outstanding for fiscal 2010 that are designated as cash flow hedging instruments. During fiscal 2009, the Company entered into contracts totaling approximately 568,000 MMBtu’s. These contracts are recorded in
S-24
ARAMARK CORPORATION AND SUBSIDIARIES
NOTES TO CONSOLIDATED FINANCIAL STATEMENTS—(Continued)
accumulated other comprehensive income (loss) and reclassified into earnings as the underlying hedged item affects earnings. As of October 2, 2009 and October 3, 2008, unrecognized net of tax losses of approximately ($0.6) million and ($1.7) million, respectively, were recorded in “Accumulated other comprehensive loss” for these contracts. There was no hedge ineffectiveness for fiscal 2009, fiscal 2008 and the Successor Period from January 27, 2007 through September 28, 2007.
The Company entered into a series of pay fixed/receive floating gasoline and diesel fuel hedge agreements based on the Department of Energy weekly retail on-highway index in order to limit its exposure to price fluctuations for gasoline and diesel fuel. As of October 2, 2009, the Company has contracts for approximately 7.7 million gallons outstanding for fiscal 2010 that are designated as cash flow hedging instruments. During fiscal 2009, the Company entered into contracts totaling approximately 10.6 million gallons. These contracts are recorded in accumulated other comprehensive income (loss) and reclassified into earnings as the underlying hedged item affects earnings. As of October 2, 2009 and October 3, 2008, unrecognized net of tax losses of approximately ($1.1) million and ($3.3) million, respectively, was recorded in “Accumulated other comprehensive loss” for these contracts. The hedge ineffectiveness for the gasoline and diesel fuel hedging instruments for fiscal 2009 and fiscal 2008 was immaterial.
The following table summarizes the effect of our derivatives designated as cash flow hedging instruments on Comprehensive Income (Loss) (in thousands):
| Fiscal Year Ended October 2, 2009 |
Fiscal Year Ended October 3, 2008 |
Period from January 27, 2007 through September 28, 2007 |
||||||||||
| Interest rate swap agreements |
$ | (38,080 | ) | $ | (59,973 | ) | $ | (30,048 | ) | |||
| Cross currency swap agreements |
(524 | ) | (4,837 | ) | (3,021 | ) | ||||||
| Natural gas hedge agreements |
992 | (1,469 | ) | (152 | ) | |||||||
| Gasoline and diesel fuel hedge agreements |
2,234 | (3,329 | ) | — | ||||||||
| $ | (35,378 | ) | $ | (69,608 | ) | $ | (33,221 | ) | ||||
Derivatives not Designated in Hedging Relationships
As of October 2, 2009, the Company had foreign currency forward exchange contracts outstanding with notional amounts of €12.1 million, £6.5 million and CAD 75.0 million to mitigate the risk of changes in foreign currency exchange rates on short-term intercompany loans to certain international subsidiaries. Gains and losses on these foreign currency exchange contracts are recognized in income currently as the contracts were not designated as hedging instruments, substantially offsetting currency transaction gains and losses on the short term intercompany loans.
S-25
ARAMARK CORPORATION AND SUBSIDIARIES
NOTES TO CONSOLIDATED FINANCIAL STATEMENTS—(Continued)
The following table summarizes the location and fair value of our derivatives designated and not designated as hedging instruments in our Consolidated Balance Sheets (in thousands):
| Balance Sheet Location | October 2, 2009 | October 3, 2008 | ||||||
| ASSETS |
||||||||
| Designated as hedging instruments: |
||||||||
| Interest rate swap agreements |
Other Assets | $ | — | $ | 589 | |||
| Not designated as hedging instruments: |
||||||||
| Foreign currency forward exchange contracts |
Prepayments | — | 926 | |||||
| Total derivatives |
$ | — | $ | 1,515 | ||||
| LIABILITIES |
||||||||
| Designated as hedging instruments: |
||||||||
| Natural gas hedge agreements |
Accounts Payable | $ | 1,039 | $ | 2,679 | |||
| Gasoline and diesel fuel hedge agreements |
Accounts Payable | 1,810 | 5,503 | |||||
| Interest rate swap agreements |
Accrued Expenses | 19,640 | — | |||||
| Interest rate swap agreements |
Other Noncurrent Liabilities |
196,039 | 153,383 | |||||
| Cross currency swap agreements |
Other Noncurrent Liabilities |
24,183 | 23,025 | |||||
| 242,711 | 184,590 | |||||||
| Not designated as hedging instruments: |
||||||||
| Foreign currency forward exchange contracts |
Accounts Payable | 392 | — | |||||
| Total derivatives |
$ | 243,103 | $ | 184,590 | ||||
The following table summarizes the location of (gain) loss reclassified from “Accumulated other comprehensive loss” into earnings for our derivatives designated as hedging instruments in our Consolidated Statements of Operations (in thousands):
| Account | Fiscal Year Ended October 2, 2009 |
Fiscal Year Ended October 3, 2008 |
Period from January 27, 2007 through September 28, 2007 |
||||||||||
| Interest rate swap agreements |
Interest Expense | $ | 117,827 | $ | 42,402 | $ | (1,638 | ) | |||||
| Cross currency swap agreements |
Interest Expense | 4,590 | 3,226 | (107 | ) | ||||||||
| Natural gas hedge agreements |
Cost of services provided | 5,621 | 23 | 637 | |||||||||
| Gasoline and diesel fuel hedge agreements |
Cost of services provided | 13,675 | (706 | ) | — | ||||||||
| $ | 141,713 | $ | 44,945 | $ | (1,108 | ) | |||||||
The following table summarizes the location of (gain) loss for our derivatives not designated as hedging instruments in our Consolidated Statements of Operations (in thousands):
| Account | Fiscal Year Ended October 2, 2009 |
Fiscal Year Ended October 3, 2008 |
Period from January 27, 2007 through September 28, 2007 |
|||||||||
| Foreign currency forward exchange contracts |
Interest Expense | $ | 773 | $ | 195 | $ | (697 | ) | ||||
S-26
ARAMARK CORPORATION AND SUBSIDIARIES
NOTES TO CONSOLIDATED FINANCIAL STATEMENTS—(Continued)
As part of the Transaction, the Company entered into a Japanese yen denominated term loan in the amount of ¥5,422 million (see Note 5). The term loan was designated as a hedge of the Company’s net Japanese currency exposure represented by the equity investment in our Japanese affiliate, AIM Services Co., Ltd.
Predecessor
The Company had $300 million and £93 million of interest rate swap agreements, which were designated as cash flow hedging instruments, fixing the rate on a like amount of variable rate borrowings, and $100 million of swap agreements designated as fair-value hedging instruments. Changes in the fair value of a derivative that is designated as and meets all the required criteria for a cash flow hedge are recorded in accumulated other comprehensive income (loss) and reclassified into earnings as the underlying hedged item affects earnings. Amounts reclassified into earnings related to interest rate swap agreements are included in interest expense. Changes in the fair value of a derivative that is designated as and meets all the required criteria for a fair value hedge are recognized currently in earnings, offset by recognizing currently in earnings the change in the fair value of the underlying hedged item. The hedge ineffectiveness for the Predecessor period from September 30, 2006 through January 26, 2007 was not material.
Both of the cash flows swaps and the fair value hedge were terminated in January 2007. The realized gain of approximately $14.0 million on the cash flow swaps was deferred and was to be amortized to interest expense over the remaining life of the original swaps. The loss of approximately $2.2 million on the fair value hedge was also deferred and was to be amortized to interest expense over the life of the hedged bonds. Upon completing the Transaction, the net deferred gain was considered as part of the preliminary purchase price allocation.
As of January 26, 2007, the Company had foreign currency forward exchange contracts outstanding with notional amounts of €7.1 million to mitigate the risk of changes in foreign currency exchange rates on short-term intercompany loans to certain international subsidiaries. Gains and losses on these foreign currency exchange contracts are recognized in income currently as the contracts were not designated as hedging instruments, substantially offsetting currency transaction gains and losses on the short-term intercompany loans. The fair value of these foreign exchange contracts was immaterial. Net foreign currency transaction gains and losses were not material during the Predecessor period from September 30, 2006 through January 26, 2007. The Successor assumed the contracts as part of the Transaction.
During prior fiscal years, the Company terminated $500 million of pay floating/receive fixed interest rate swaps designated as fair value hedges. The net gain of approximately $13.5 million was deferred and was being amortized to interest expense over the remaining life of the hedged bonds. Upon completing the Transaction, the net deferred gain was considered as part of the preliminary purchase price allocation.
During fiscal 2004, the Company entered into a Japanese yen denominated borrowing agreement and borrowed the equivalent of $50 million. The note was designated as a hedge of the Company’s net Japanese currency exposure represented by the equity investment in our Japanese affiliate, AIM Services Co., Ltd. As of January 26, 2007, hedge accounting was discontinued as a result of the borrowing being repaid as part of the Transaction.
Beginning in November 2005, the Company entered into a series of pay fixed/receive floating natural gas swap agreements based on a NYMEX price in order to limit its exposure to price increases for natural gas, primarily in the Uniform and Career Apparel segment. The Company had contracts for approximately 707,000 MMBtu’s outstanding on January 26, 2007 for the remainder of fiscal 2007 and fiscal 2008. The contracts, designated as cash flow hedging instruments, were recorded in accumulated other comprehensive income (loss) and reclassified into earnings as the underlying hedged item affected earnings. Amounts reclassified into
S-27
ARAMARK CORPORATION AND SUBSIDIARIES
NOTES TO CONSOLIDATED FINANCIAL STATEMENTS—(Continued)
earnings related to the natural gas swap agreements were included in “Cost of services provided.” The total realized loss reclassified into earnings during the Predecessor period from September 30, 2006 through January 26, 2007 was approximately $1.2 million. As of January 26, 2007, hedge accounting was discontinued and the Successor assumed the contracts at fair value. There was no hedge ineffectiveness for the Predecessor period from September 30, 2006 through January 26, 2007.
NOTE 7. ASSET RETIREMENT OBLIGATIONS:
The Company recognizes a liability for asset retirement obligations, which consist primarily of costs associated with the removal and disposal of regulated asbestos-containing material and the retirement of certain equipment and leasehold improvements, even if that activity can be deferred indefinitely. The liability is recorded at fair value in the period in which it is incurred. When the liability is initially recorded, the cost is capitalized by increasing the carrying amount of the related long-lived asset. Over time, the liability is accreted to its present value and the capitalized cost is depreciated over the estimated useful life of the related asset. Upon retirement of the long-lived asset, the obligation is settled.
The changes in the carrying amounts of the Company’s asset retirement obligations for fiscal 2009 are as follows (in thousands):
| Asset retirement obligations, October 3, 2008 |
$ | 7,147 | ||
| Asset retirement obligations incurred |
— | |||
| Asset retirement obligations settled |
(513 | ) | ||
| Accretion expense |
377 | |||
| Revisions in estimated cash flows |
— | |||
| Foreign currency translation |
(180 | ) | ||
| Asset retirement obligations, October 2, 2009 |
$ | 6,831 | ||
NOTE 8. EMPLOYEE PENSION AND PROFIT SHARING PLANS:
In the United States, the Company maintains qualified contributory and non-contributory defined contribution retirement plans for eligible employees, with Company contributions to the plans based on earnings performance or salary level. The Company also has a non-qualified retirement savings plan for certain employees. The total expense of the above plans for fiscal 2009, fiscal 2008, the Successor period from January 27, 2007 through September 28, 2007 and the Predecessor period from September 30, 2006 through January 26, 2007 was $25.0 million, $28.5 million, $18.9 million and $8.8 million, respectively. The Company participates in various multi-employer union administered pension and employee welfare plans. Contributions to these plans, which are primarily defined benefit plans, result from contractual provisions of labor contracts and were $33.9 million, $34.0 million, $22.2 million and $9.4 million for fiscal 2009, fiscal 2008, the Successor period from January 27, 2007 through September 28, 2007 and the Predecessor period from September 30, 2006 through January 26, 2007, respectively. Additionally, the Company maintains several contributory and non-contributory defined benefit pension plans, primarily in Canada and the United Kingdom.
In September 2006, the FASB issued a new accounting pronouncement for employers’ accounting for defined benefit pension and other postretirement plans, which requires an employer to recognize the overfunded or underfunded status of a defined benefit postretirement plan (other than a multiemployer plan) as an asset or liability in its statement of financial position and to recognize changes in that funded status in the year in which the changes occur through comprehensive income. The funded status for defined-benefit pension plans is measured as the difference between the fair value of plan assets and the projected benefit obligation on a
S-28
ARAMARK CORPORATION AND SUBSIDIARIES
NOTES TO CONSOLIDATED FINANCIAL STATEMENTS—(Continued)
plan-by-plan basis. This pronouncement also requires an employer to measure the funded status of a plan as of the date of its year-end statement of financial position, with limited exceptions. The Company early adopted this accounting pronouncement as of January 26, 2007. Upon adoption, the Company recorded a reduction in “Other Assets” of $17.5 million, an increase in “Other Noncurrent Liabilities” of $9.8 million, and a charge to “Accumulated other comprehensive income (loss)” of $27.3 million (before taxes).
The following table sets forth the components of net periodic pension cost for the Company’s single-employer defined benefit pension plans for fiscal 2009, fiscal 2008, the Successor period from January 27, 2007 through September 28, 2007 and the Predecessor period from September 30, 2006 through January 26, 2007 (in thousands):
| Successor | Predecessor | |||||||||||||||||
| Fiscal Year Ended October 2, 2009 |
Fiscal Year Ended October 3, 2008 |
Period from January 27, 2007 through September 28, 2007 |
Period from September 30, 2006 through January 26, 2007 |
|||||||||||||||
| Service cost |
$ | 6,636 | $ | 8,175 | $ | 6,222 | $ | 2,604 | ||||||||||
| Interest cost |
10,300 | 11,216 | 6,590 | 3,023 | ||||||||||||||
| Expected return on plan assets |
(8,695 | ) | (12,529 | ) | (7,806 | ) | (3,285 | ) | ||||||||||
| Settlements |
903 | 960 | — | — | ||||||||||||||
| Amortization of prior service cost |
5 | 6 | — | 25 | ||||||||||||||
| Recognized net (gain) loss |
649 | (119 | ) | — | 1,081 | |||||||||||||
| Net periodic pension cost |
$ | 9,798 | $ | 7,709 | $ | 5,006 | $ | 3,448 | ||||||||||
The following tables set forth changes in the projected benefit obligation and the fair value of plan assets for these plans as of and for the fiscal year ended October 2, 2009:
| Benefit obligation, beginning |
$ | 174,353 | ||||||||
| Foreign currency translation |
(5,832 | ) | Fair value of plan assets, beginning |
$ | 130,531 | |||||
| Service cost |
6,636 | Foreign currency translation |
(4,687 | ) | ||||||
| Interest cost |
10,300 | Employer contributions |
14,229 | |||||||
| Employee contributions |
3,137 | Employee contributions |
3,137 | |||||||
| Actuarial loss (gain) |
13,841 | Actual return on plan assets |
10,191 | |||||||
| Benefits paid |
(9,652 | ) | Settlement |
(2,430 | ) | |||||
| Settlement |
(2,430 | ) | Benefits paid |
(9,652 | ) | |||||
| Benefit obligation, end |
$ | 190,353 | Fair value of plan assets, end |
$ | 141,319 | |||||
| Amounts recognized in the balance sheet: |
||||||||||
| Noncurrent benefit asset (included in Other Assets) |
$ | 113 | ||||||||
| Current benefit liability (included in Accrued expenses and other current liabilities) |
(10,752 | ) | Amounts recognized in the Accumulated other comprehensive (income) loss (before taxes):
Net actuarial loss (gain) |
$ | 27,328 | |||||
| Noncurrent benefit liability (included in Other Noncurrent Liabilities) |
(38,395 | ) | Prior service cost |
72 | ||||||
| Net amount recognized |
$ | (49,034 | ) | Net amount recognized |
$ | 27,400 | ||||
S-29
ARAMARK CORPORATION AND SUBSIDIARIES
NOTES TO CONSOLIDATED FINANCIAL STATEMENTS—(Continued)
The settlement in fiscal 2009 primarily relates to the lump sum payments made to employees in the Company’s Korean pension plan.
The assumptions utilized in the determination of pension expense and the funded status information include a weighted average discount rate of 6.2% for pension expense, a weighted average discount rate of 5.8% for the funded status, a weighted average rate of compensation increase of 3.6% and a weighted average long-term rate of return on assets of 7.1%. Assumptions are adjusted annually, as necessary, based on prevailing market conditions and actual experience.
The accumulated benefit obligation as of October 2, 2009 was $171.4 million. During fiscal 2009, actuarial losses of approximately $11.8 million were recognized in other comprehensive loss (before taxes) and $0.5 million of amortization of actuarial losses was recognized as net periodic pension cost during such period. The estimated portion of net actuarial loss included in accumulated other comprehensive income (loss) as of October 2, 2009 expected to be recognized in net periodic pension cost during fiscal 2010 is approximately $1.1 million (before taxes).
The following tables set forth changes in the projected benefit obligation and the fair value of plan assets for these plans as of and for the fiscal year ended October 3, 2008 (in thousands):
| Benefit obligation, beginning |
$ | 198,539 | ||||||||
| Foreign currency translation |
(21,092 | ) | ||||||||
| Service cost |
8,175 | Fair value of plan assets, beginning |
$ | 165,477 | ||||||
| Interest cost |
11,216 | Foreign currency translation |
(16,280 | ) | ||||||
| Employee contributions |
3,548 | Employer contributions |
14,650 | |||||||
| Actuarial loss (gain) |
(13,647 | ) | Employee contributions |
3,548 | ||||||
| Benefits paid |
(9,492 | ) | Actual return on plan assets |
(24,458 | ) | |||||
| Settlement |
(2,858 | ) | Settlement |
(2,914 | ) | |||||
| Plan amendment |
(36 | ) | Benefits paid |
(9,492 | ) | |||||
| Benefit obligation, end |
$ | 174,353 | Fair value of plan assets, end |
$ | 130,531 | |||||
| Amounts recognized in the balance sheet: |
||||||||||
| Noncurrent benefit asset (included in Other Assets) |
$ | 204 | ||||||||
| Current benefit liability (included in Accrued expenses and other current liabilities) |
(296 | ) | Amounts recognized in the Accumulated other comprehensive (income) loss (before taxes):
Net actuarial loss (gain) |
$ | 17,278 | |||||
| Noncurrent benefit liability (included in Other Noncurrent Liabilities) |
(43,730 | ) | Prior service cost |
78 | ||||||
| Net amount recognized |
$ | (43,822 | ) | Net amount recognized |
$ | 17,356 | ||||
The settlement in fiscal 2008 primarily relates to the lump sum payments made to employees in the Company’s Korean pension plan.
The assumptions utilized in the determination of pension expense and the funded status information include a weighted average discount rate of 5.6% for pension expense, a weighted average discount rate of 6.2% for the funded status, a weighted average rate of compensation increase of 3.6% and a weighted average long-term rate of return on assets of 7.6%. Assumptions are adjusted annually, as necessary, based on prevailing market conditions and actual experience.
S-30
ARAMARK CORPORATION AND SUBSIDIARIES
NOTES TO CONSOLIDATED FINANCIAL STATEMENTS—(Continued)
The accumulated benefit obligation as of October 3, 2008 was $157.6 million. During fiscal 2008, actuarial losses of approximately $20.1 million were recognized in other comprehensive loss (before taxes) and $0.1 million of amortization of actuarial gains was recognized as net periodic pension cost during such period. The estimated portion of net actuarial loss included in accumulated other comprehensive income (loss) as of October 3, 2008 expected to be recognized in net periodic pension cost during fiscal 2009 is approximately $0.7 million (before taxes).
The following table sets forth information for the Company’s single-employer pension plans with an accumulated benefit obligation in excess of plan assets as of October 2, 2009 and October 3, 2008 (in thousands):
| October 2, 2009 |
October 3, 2008 | |||||
| Projected benefit obligation |
$ | 181,832 | $ | 150,406 | ||
| Accumulated benefit obligation |
163,812 | 136,235 | ||||
| Fair value of plan assets |
133,295 | 108,687 | ||||
Assets of the plans are invested with the goal of principal preservation and enhancement over the long-term. The primary goal is total return, consistent with prudent investment management. The current overall capital structure and targeted ranges for asset classes are 50-70% invested in equity securities and 30-50% invested in debt securities. As of October 2, 2009, the overall portfolio mix consisted of 58% equity securities, 41% debt securities and 1% cash and cash equivalents. As of October 3, 2008, the overall portfolio mix consisted of 60% equity securities, 31% debt securities and 9% cash and cash equivalents. Performance of the plans is monitored on a regular basis and adjustments of the asset allocations are made when deemed necessary.
The weighted-average long-term rate of return on assets has been determined based on an estimated weighted-average of long-term returns of major asset classes, taking into account historical performance of plan assets, the current interest rate environment, plan demographics, acceptable risk levels and the estimated value of active asset management.
It is the Company’s policy to fund at least the minimum required contributions as outlined in the required statutory actuarial valuation for each plan. The following table sets forth the benefits expected to be paid in the next five fiscal years and in aggregate for the five fiscal years thereafter by the Company’s defined benefit pension plans (in thousands):
| Fiscal 2010 |
$ | 10,681 | |
| Fiscal 2011 |
$ | 9,497 | |
| Fiscal 2012 |
$ | 9,762 | |
| Fiscal 2013 |
$ | 10,104 | |
| Fiscal 2014 |
$ | 10,598 | |
| Fiscal 2015 – 2019 |
$ | 58,600 |
The estimated benefit payments above are based on assumptions about future events. Actual benefit payments may vary significantly from these estimates.
The expected contributions to be paid to the Company’s defined benefit pension plans during fiscal 2010 are approximately $11.0 million.
S-31
ARAMARK CORPORATION AND SUBSIDIARIES
NOTES TO CONSOLIDATED FINANCIAL STATEMENTS—(Continued)
NOTE 9. INCOME TAXES:
The Company accounts for income taxes using the asset and liability method. Under this method, the provision for income taxes represents income taxes payable or refundable for the current year plus the change in deferred taxes during the year. Deferred taxes result from differences between the financial and tax bases of the Company’s assets and liabilities and are adjusted for changes in tax rates and tax laws when changes are enacted. Valuation allowances are recorded to reduce deferred tax assets when it is more likely than not that a tax benefit will not be realized. Interest and penalties related to income tax matters are included in the provision for income taxes.
The components of income (loss) before income taxes by source of income are as follows (in thousands):
| Successor | Predecessor | ||||||||||||||||
| Fiscal Year Ended October 2, 2009 |
Fiscal Year Ended October 3, 2008 |
Period from January 27, 2007 through September 28, 2007 |
Period from September 30, 2006 through January 26, 2007 | ||||||||||||||
| United States |
$ | (118,080 | ) | $ | (30,792 | ) | $ | (25,341 | ) | $ | 1,033 | ||||||
| Non-U.S. |
83,304 | 82,238 | 46,041 | 18,830 | |||||||||||||
| $ | (34,776 | ) | $ | 51,446 | $ | 20,700 | $ | 19,863 | |||||||||
The provision (benefit) for income taxes consists of (in thousands):
| Successor | Predecessor | |||||||||||||||||
| Fiscal Year Ended October 2, 2009 |
Fiscal Year Ended October 3, 2008 |
Period from January 27, 2007 through September 28, 2007 |
Period from September 30, 2006 through January 26, 2007 |
|||||||||||||||
| Current: |
||||||||||||||||||
| Federal |
$ | 981 | $ | (3,315 | ) | $ | 84,762 | $ | 8,756 | |||||||||
| State and local |
13,484 | 3,424 | 21,167 | 2,151 | ||||||||||||||
| Non-U.S. |
25,734 | 30,141 | 17,380 | 5,796 | ||||||||||||||
| $ | 40,199 | $ | 30,250 | $ | 123,309 | $ | 16,703 | |||||||||||
| Deferred: |
||||||||||||||||||
| Federal |
$ | (46,013 | ) | $ | (9,670 | ) | $ | (94,548 | ) | $ | (8,482 | ) | ||||||
| State and local |
(16,148 | ) | (424 | ) | (20,391 | ) | (1,544 | ) | ||||||||||
| Non-U.S. |
(5,903 | ) | (8,170 | ) | (3,729 | ) | (1,614 | ) | ||||||||||
| (68,064 | ) | (18,264 | ) | (118,668 | ) | (11,640 | ) | |||||||||||
| $ | (27,865 | ) | $ | 11,986 | $ | 4,641 | $ | 5,063 | ||||||||||
Current taxes receivable of $10.5 million and $16.1 million at October 2, 2009 and October 3, 2008 are included in “Prepayments and other current assets,” respectively.
S-32
ARAMARK CORPORATION AND SUBSIDIARIES
NOTES TO CONSOLIDATED FINANCIAL STATEMENTS—(Continued)
The provision (benefit) for income taxes varies from the amount determined by applying the United States Federal statutory rate to pretax income (loss) as a result of the following (all percentages are as a percentage of pretax income (loss)):
| Successor | Predecessor | |||||||||||||
| Fiscal Year Ended October 2, 2009 |
Fiscal Year Ended October 3, 2008 |
Period from January 27, 2007 through September 28, 2007 |
Period from September 30, 2006 through January 26, 2007 |
|||||||||||
| United States statutory income tax rate |
35.0 | % | 35.0 | % | 35.0 | % | 35.0 | % | ||||||
| Increase (decrease) in taxes, resulting from: |
||||||||||||||
| State income taxes, net of Federal tax benefit |
8.6 | 2.0 | 2.4 | 2.0 | ||||||||||
| Foreign tax benefits |
27.8 | (9.1 | ) | (8.3 | ) | (5.1 | ) | |||||||
| Permanent book/tax differences |
(6.4 | ) | 5.1 | 13.3 | 13.4 | |||||||||
| Uncertain tax positions |
(6.4 | ) | 4.2 | — | — | |||||||||
| Tax credits & other |
21.5 | (13.9 | ) | (20.0 | ) | (19.8 | ) | |||||||
| Effective income tax rate |
80.1 | % | 23.3 | % | 22.4 | % | 25.5 | % | ||||||
The effective tax rate is based on expected income, statutory tax rates and tax planning opportunities available to the Company in the various jurisdictions in which it operates. Judgment is required in determining the effective tax rate and in evaluating the Company’s tax positions. The Company establishes reserves when, despite the belief that the Company’s tax return positions are supportable, the Company believes that certain positions are likely to be challenged and that the Company may not succeed. The Company adjusts these reserves in light of changing facts and circumstances, such as the progress of a tax audit. The effective tax rate includes the impact of reserve provisions and changes to the reserve that the Company considers appropriate, as well as related interest. This rate is also applied to the quarterly operating results. In the event that there is a significant unusual or one-time item recognized in the Company’s operating results, the tax attributable to that item would be separately calculated and recorded at the same time as the unusual or one-time item.
A number of years may elapse before a particular tax reporting year is audited and finally resolved. The number of years with open tax audits varies depending on the tax jurisdiction. In the United States, the statutes for state income taxes for 1998 and forward remain open and the Internal Revenue Service has settled the examination of the Company’s tax returns through 2006. While it is often difficult to predict the final outcome or the timing of resolution of any particular tax matter, the Company believes that its income tax accruals reflect the probable outcome of known tax contingencies. Unfavorable settlement of any particular issue would require use of the Company’s cash.
As of October 2, 2009, certain subsidiaries have accumulated state and foreign net operating loss carryforwards of $7.4 million. The Company has a $5.5 million valuation allowance as of October 2, 2009 against these carryforwards due to the uncertainty of its realization. In addition, certain subsidiaries have accumulated state net operating loss carryforwards for which no benefit has been recorded as they are attributable to uncertain tax positions. The unrecognized tax benefits as of October 2, 2009, attributable to these net operating losses was approximately $18.6 million. Due to the uncertain tax position, these net operating losses are not included as components of deferred tax assets as of October 2, 2009. The state and foreign net operating loss carryforwards will expire from 2010 through 2030.
As of October 2, 2009, the Company has approximately $19.5 million of foreign tax credit carryforwards, which expire in 2019 and $3.1 million general business tax credit carryforward, which expire in 2029. The Company believes it is more likely than not that it will be able to generate taxable income in the future sufficient to utilize these carryforwards, and no valuation allowance is necessary.
S-33
ARAMARK CORPORATION AND SUBSIDIARIES
NOTES TO CONSOLIDATED FINANCIAL STATEMENTS—(Continued)
As of October 2, 2009 and October 3, 2008, the components of deferred taxes are as follows (in thousands):
| October 2, 2009 |
October 3, 2008 |
|||||||
| Deferred tax liabilities: |
||||||||
| Property and equipment |
$ | 99,828 | $ | 92,517 | ||||
| Investments |
84,076 | 73,493 | ||||||
| Other intangible assets, including goodwill |
788,616 | 806,956 | ||||||
| Other |
18,028 | 10,618 | ||||||
| Gross deferred tax liability |
990,548 | 983,584 | ||||||
| Deferred tax assets: |
||||||||
| Insurance |
39,995 | 22,890 | ||||||
| Employee compensation and benefits |
170,842 | 160,624 | ||||||
| Accruals and allowances |
41,745 | 36,559 | ||||||
| Derivatives |
85,157 | 60,715 | ||||||
| Net operating loss/credit carryforwards and other |
24,674 | 3,257 | ||||||
| Gross deferred tax asset, before valuation allowances |
362,413 | 284,045 | ||||||
| Valuation allowances |
(5,450 | ) | (3,257 | ) | ||||
| Net deferred tax liability |
$ | 633,585 | $ | 702,796 | ||||
Current deferred tax assets of $87.6 million and $65.5 million at October 2, 2009 and October 3, 2008 are included in “Prepayments and other current assets,” respectively. Deferred tax liabilities of $721.2 million and $768.3 million at October 2, 2009 and October 3, 2008 are included in “Deferred Income Taxes and Other Noncurrent Liabilities.”
In June 2006, the FASB issued a new accounting pronouncement which clarifies the accounting for uncertainty in income taxes recognized in an enterprise’s financial statements. The Company adopted the accounting pronouncement on January 27, 2007. The transition adjustment, although not material, was recorded as an adjustment to goodwill in the Successor period from January 27, 2007 through September 28, 2007.
The Company had approximately $39.8 million of total unrecognized tax benefits as of October 2, 2009, all of which, if recognized, would impact the effective tax rate. A reconciliation of the beginning and ending amount of gross unrecognized tax benefits follows (in thousands):
| October 2, 2009 |
||||
| Gross unrecognized tax benefits at October 3, 2008 |
$ | 45,569 | ||
| Additions based on tax positions taken in the current year |
1,006 | |||
| Additions for tax positions taken in prior years |
5,728 | |||
| Reductions for settlements and payments |
(12,141 | ) | ||
| Reductions due to statute expiration |
(372 | ) | ||
| Gross unrecognized tax benefits at October 2, 2009 |
$ | 39,790 | ||
S-34
ARAMARK CORPORATION AND SUBSIDIARIES
NOTES TO CONSOLIDATED FINANCIAL STATEMENTS—(Continued)
| October 3, 2008 |
||||
| Gross unrecognized tax benefits upon adoption on September 28, 2007 |
$ | 39,699 | ||
| Additions based on tax positions related to the current year |
15,103 | |||
| Additions for tax provisions of prior years |
2,983 | |||
| Reductions for settlements and payments |
(11,257 | ) | ||
| Reductions due to statute expiration |
(959 | ) | ||
| Gross unrecognized tax benefits at October 3, 2008 |
$ | 45,569 | ||
The Company had approximately $9.2 million and $11.1 million accrued for interest and penalties as of October 2, 2009 and October 3, 2008, respectively, and recorded approximately $3.2 million and $2.2 million in interest and penalties during fiscal 2009 and fiscal 2008, respectively.
ARAMARK and its subsidiaries are subject to U.S. federal income tax as well as income tax of multiple state and foreign jurisdictions. The Company has substantially concluded all U.S. federal income tax matters for years through 2006, with the exception of certain Work Opportunity Tax Credits and Welfare to Work Tax Credits which are pending the outcome of Protective Refund Claims filed for 1998 through 2006.
ARAMARK and its subsidiaries have significant operations in approximately 20 state and foreign taxing jurisdictions. The Company has open tax years in these jurisdictions ranging from 3 to 11 years. ARAMARK does not anticipate the adjustments would result in a material change to the results of operations or financial condition.
The Company does not expect the amount of unrecognized tax benefits to significantly change within the next 12 months.
NOTE 10. CAPITAL STOCK:
Successor
Effective January 26, 2007 upon completion of the Transaction, the Certificate of Incorporation of the Company was amended to provide for the authorization of 1,000 shares of common stock to replace the previously authorized, issued and outstanding Class A common stock and Class B common stock. Each share of common stock entitles the holder to one vote per share. Upon completion of the Transaction, ARAMARK Intermediate Holdco Corporation held all 900 shares of common stock issued by the Company. On March 30, 2007, ARAMARK Corporation and ARAMARK Services, Inc. merged, with ARAMARK Services, Inc. being the surviving company and being renamed ARAMARK Corporation. As a result of that merger, ARAMARK Intermediate Holdco Corporation holds 1,000 shares of the Company’s common stock, which represent all of the authorized and issued capital stock.
Pursuant to the Stockholders Agreement of the Parent Company, commencing on January 26, 2008, upon termination of employment from the Company or one of its subsidiaries, members of the Company’s management (other than Mr. Neubauer) who hold shares of common stock of the Parent Company can cause the Parent Company to repurchase all of their initial investment shares at fair market appraised value. Generally, payment for shares repurchased could be, at the Parent Company’s option, in cash or installment notes, which would be effectively subordinated to all indebtedness of the Company. The amount of this potential repurchase obligation has been classified outside of shareholders’ equity as part of the Transaction accounting which reflects the Parent Company’s investment basis and capital structure in the Company’s consolidated financial statements. The amount of common stock subject to repurchase as of October 2, 2009 and October 3, 2008 was $176.4
S-35
ARAMARK CORPORATION AND SUBSIDIARIES
NOTES TO CONSOLIDATED FINANCIAL STATEMENTS—(Continued)
million and $229.6 million, which is based on approximately 13.4 million and 15.2 million shares of common stock of the Parent Company valued at $13.15 and $15.15 per share, respectively. The fair value of our common stock subject to repurchase is calculated using discounted cash flow techniques, comparable public company trading multiples and transaction multiples. During fiscal 2009 and fiscal 2008, approximately $39.5 million and $15.0 million of common stock of the Parent Company was repurchased, respectively. The Stockholders Agreement, the senior secured credit agreement and the indenture governing the 8.50% senior notes due 2015 and the senior floating rate notes due 2015 contain limitations on the amount the Company can expend for such share repurchases.
Predecessor
During the Predecessor period from September 30, 2006 through January 26, 2007, the Company paid cash dividends totaling $12.6 million ($0.07/share in the first quarter of fiscal 2007).
NOTE 11. SHARE-BASED COMPENSATION:
Successor
In connection with the Transaction, the Parent Company established the ARAMARK Holdings Corporation 2007 Management Stock Incentive Plan (2007 MSIP). Incentive awards under the 2007 MSIP may be granted to employees or directors of, or consultants to, the Parent Company or one of its affiliates, including the Company, in the form of non-qualified stock options, unvested shares of common stock, the opportunity to purchase shares of common stock and other awards that are valued in whole or in part by reference to, or are otherwise based on, the fair market value of the Parent Company’s shares. The 2007 MSIP permits the granting of awards of up to 38.0 million shares of common stock of the Parent Company. As of October 2, 2009, there were 13.5 million shares available for grant. Under the 2007 MSIP, the terms of the awards are fixed at the grant date.
Compensation expense charged to expense by the Successor for fiscal 2009, fiscal 2008 and the period from January 27, 2007 through September 28, 2007 for share-based compensation programs was approximately $25.4 million, before taxes of approximately $9.9 million, $11.8 million, before taxes of approximately $4.6 million, and $27.5 million, before taxes of approximately $10.8 million, respectively. The compensation expense recognized is classified as “Selling and general corporate expenses” in the Consolidated Statements of Operations. No compensation expense was capitalized.
Cash received from option exercises during fiscal 2009, fiscal 2008 and the period from January 27, 2007 through September 28, 2007 was $1.3 million, $0.6 million and $0, respectively. For fiscal 2009, fiscal 2008 and the period from January 27, 2007 through September 28, 2007, the amount of tax benefits included in “Other financing activities” in the Consolidated Statement of Cash Flows was ($0.3) million, $1.4 million and $0, respectively.
Stock Options
Each award of stock options under the 2007 MSIP is comprised of two types of stock options. One-half of the options awarded vest solely based upon continued employment over a specific period of time, generally four years (“Time-Based Options”). One-half of the options awarded vest based both upon continued employment and upon the achievement of a predetermined level of earnings before interest and taxes (“EBIT”) over time, generally four years (“Performance-Based Options”). The Performance-Based Options may also vest in part or in full upon the occurrence of specific return-based events. The exercise price for Time-Based Options and Performance-Based Options equals the fair value of the Parent Company’s stock on the date of the grant. All options remain exercisable for ten years from the date of grant.
S-36
ARAMARK CORPORATION AND SUBSIDIARIES
NOTES TO CONSOLIDATED FINANCIAL STATEMENTS—(Continued)
Time-Based Options
The fair value of the Time-Based Options granted was estimated using the Black-Scholes option pricing model and the weighted-average assumptions noted in the table below. Since the Company’s stock is not publicly traded, the expected volatility is based on an average of the historical volatility of the Company’s competitors’ stocks over the expected term of the stock options. The expected life represents the period of time that options granted are expected to be outstanding and is calculated using the simplified method prescribed by Securities and Exchange Commission (“SEC”) rules and regulations due to the lack of history. The risk-free rate is based on the U.S. Treasury security with terms equal to the expected life of the option as of the grant date.
| Fiscal Year Ended October 2, 2009 |
Fiscal Year Ended October 3, 2008 |
Period from January 27, 2007 through September 28, 2007 | ||||
| Expected volatility |
35% | 21% | 20% | |||
| Expected dividend yield |
0% | 0% | 0% | |||
| Expected life (in years) |
6.25 | 6.25 | 6.25 | |||
| Risk-free interest rate |
1.60% - 3.37% | 2.78% - 3.81% | 4.32% - 5.09% |
The weighted-average grant-date fair value of Time-Based Options granted during fiscal 2009, fiscal 2008 and the period from January 27, 2007 through September 28, 2007 was $5.14, $4.18 and $3.33 per option, respectively.
Compensation expense for Time-Based Options is recognized on a straight-line basis over the vesting period during which employees perform related services. Approximately $11.2 million, $11.2 million and $6.9 million was charged to expense during fiscal 2009, fiscal 2008 and the period from January 27, 2007 through September 28, 2007 for Time-Based Options, respectively. The Company has applied a forfeiture assumption of 8.7% per annum in the calculation of such expense.
As of October 2, 2009, there was approximately $16.5 million of unrecognized compensation expense related to nonvested Time-Based Options, which is expected to be recognized over a weighted-average period of approximately 1.9 years.
A summary of Time-Based Options activity is presented below:
| Options |
Shares (000s) |
Weighted- Average Exercise Price |
Aggregate Intrinsic Value ($000s) | ||||||
| Outstanding at October 3, 2008 |
13,814 | $ | 10.59 | ||||||
| Granted |
554 | $ | 13.02 | ||||||
| Exercised |
(733 | ) | $ | 10.08 | |||||
| Forfeited |
(708 | ) | $ | 10.87 | |||||
| Outstanding at October 2, 2009 (weighted-average remaining term of 7.6 years) |
12,927 | $ | 10.70 | $ | 33,276 | ||||
| Exercisable at October 2, 2009 (weighted-average remaining term of 7.4 years) |
5,841 | $ | 10.39 | $ | 16,551 | ||||
| Expected to vest at October 2, 2009 (weighted-average remaining term of 7.6 years) |
6,441 | $ | 10.92 | $ | 15,431 | ||||
S-37
ARAMARK CORPORATION AND SUBSIDIARIES
NOTES TO CONSOLIDATED FINANCIAL STATEMENTS—(Continued)
The total intrinsic value of Time-Based Options exercised during fiscal 2009, fiscal 2008 and the period from January 27, 2007 through September 28, 2007 was $2.2 million, $0.6 million and $0, respectively. The total fair value of Time-Based Options that vested during fiscal 2009, fiscal 2008 and the period from January 27, 2007 through September 28, 2007 was $12.0 million, $10.7 million and $0, respectively.
Performance-Based Options
The fair value of the Performance-Based Options was estimated using the Black-Scholes option pricing model and the weighted-average assumptions noted in the table below. Since the Company’s stock is not publicly traded, the expected volatility is based on an average of the historical volatility of the Company’s competitors’ stocks over the expected term of the stock options. The expected life represents the period of time that options granted are expected to be outstanding and is calculated using the simplified method prescribed by SEC rules and regulations due to the lack of history. The risk-free rate is based on the U.S. Treasury security with terms equal to the expected life of the option as of the grant date.
| Fiscal Year Ended October 2, 2009 |
Fiscal Year Ended October 3, 2008 |
Period from January 27, 2007 through September 28, 2007 | ||||
| Expected volatility |
35% | 21% | 20% | |||
| Expected dividend yield |
0% | 0% | 0% | |||
| Expected life (in years) |
5.5 - 7.0 | 5.5 - 7.0 | 5.5 - 7.0 | |||
| Risk-free interest rate |
1.40% - 3.37% | 2.36% - 3.81% | 4.20% - 5.09% |
The weighted-average grant-date fair value of the Performance-Based Options granted during fiscal 2009, fiscal 2008 and the period from January 27, 2007 through September 28, 2007 was $5.06, $4.10 and $3.33 per option, respectively.
Compensation expense for Performance-Based Options is recognized on an accelerated basis over the requisite performance and service periods. The Company recognized compensation expense of approximately $13.8 million, ($2.9) million and $13.4 million during fiscal 2009, fiscal 2008 and the period from January 27, 2007 through September 28, 2007 for Performance-Based Options. The Company has applied a forfeiture assumption of 8.7% per annum in the calculation of such expense. During the fourth quarter of fiscal 2008, the Company reversed approximately $13.3 million of compensation expense related to expense previously recognized for the Performance-Based Options tied to fiscal 2008 through fiscal 2011. On December 10, 2008, the Parent Company Board waived the EBIT target for fiscal 2008 with respect to approximately 2.6 million options representing 75% of the portion of the Performance-Based Options whose vesting was subject to the achievement of the Company’s fiscal 2008 EBIT target. Accordingly, such portion of the Performance-Based Options vest when the time-based vesting requirement of such options is satisfied. In addition on December 10, 2008, the Parent Company Board approved new annual and cumulative EBIT targets for fiscal 2009 that were revised to recognize the effects of the economic environment on the Company’s business and correspondingly reduced the cumulative targets for fiscal 2010 and beyond. The fair value of these Performance-Based Options were revalued at the award modification date in accordance with authoritative accounting guidance. The fair value of the Performance-Based Options was estimated using the Black-Scholes option pricing model and the following weighted-average assumptions: expected volatility (35%), expected dividend yield (0%), expected life (4.10-5.80 years) and risk-free interest rate (1.62%). The weighted-average fair value of the Performance-Based Options modified on December 10, 2008 was $5.54 per option. On December 9, 2009, the Parent Company Board waived the EBIT target for fiscal 2009 with respect to approximately 1.2 million options representing 35% of the portion of the Performance-Based Options whose vesting was subject to the achievement of the Company’s fiscal 2009 EBIT target. Accordingly, such portion of the Performance-Based Options vest when the
S-38
ARAMARK CORPORATION AND SUBSIDIARIES
NOTES TO CONSOLIDATED FINANCIAL STATEMENTS—(Continued)
time-based vesting requirement of such options is satisfied. In addition on December 9, 2009, the Parent Company Board approved new annual and cumulative EBIT targets for fiscal 2010 that were revised to recognize the effects of the economic environment on the Company’s business. Approximately 3.4 million options were affected by the new annual and cumulative EBIT targets for fiscal 2010. The accounting for these modifications will be reflected beginning in the first quarter of fiscal 2010.
A summary of Performance-Based Options activity is presented below:
| Options |
Shares (000s) |
Weighted- Average Exercise Price |
Aggregate Intrinsic Value ($000s) | ||||||
| Outstanding at October 3, 2008 |
13,828 | $ | 10.59 | ||||||
| Granted |
554 | $ | 13.02 | ||||||
| Exercised |
(546 | ) | $ | 10.09 | |||||
| Forfeited/Cancelled |
(637 | ) | $ | 10.89 | |||||
| Outstanding at October 2, 2009 (weighted-average remaining term of 7.6 years) |
13,199 | $ | 10.69 | $ | 34,096 | ||||
| Exercisable at October 2, 2009 (weighted-average remaining term of 7.4 years) |
5,000 | $ | 10.32 | $ | 14,428 | ||||
| Expected to vest at October 2, 2009 |
— | $ | — | $ | — | ||||
The total intrinsic value of Performance-Based Options exercised during fiscal 2009, fiscal 2008 and the period from January 27, 2007 through September 28, 2007 was $1.7 million, $0.6 million and $0, respectively. The total fair value of Performance-Based Options that vested during fiscal 2009, fiscal 2008 and the period from January 27, 2007 through September 28, 2007 was $13.7 million, $9.6 million and $0, respectively.
Nonvested Shares
The grant-date fair value of nonvested shares is based on the fair value of the Parent Company’s common stock, and compensation expense is amortized to expense on a straight-line basis over the vesting period during which employees perform related services, generally one year. The compensation expense charged to expense during fiscal 2009, fiscal 2008 and the period from January 27, 2007 through September 28, 2007 for nonvested share awards was approximately $0, $3.1 million and $6.9 million, respectively.
Deferred Stock Units
Deferred stock units are issued only to non-employee members of the Board of Directors who are not representatives of one of the Sponsors and represent the right to receive shares of the Parent Company’s common stock in the future. Each deferred stock unit will be converted to one share of the Parent Company’s common stock six months and one day after the date on which such director ceases to serve as a member of the Board of Directors. The grant-date fair value of deferred stock units is based on the fair value of the Parent Company’s common stock. Since the deferred stock units are fully vested upon grant, compensation expense for the entire award is recognized immediately upon grant. The Company granted 31,920 deferred stock units during fiscal 2009. The compensation expense during fiscal 2009, fiscal 2008 and the period from January 27, 2007 through September 28, 2007 for deferred stock units was approximately $0.4 million, $0.4 million and $0.3 million, respectively.
S-39
ARAMARK CORPORATION AND SUBSIDIARIES
NOTES TO CONSOLIDATED FINANCIAL STATEMENTS—(Continued)
Predecessor
Prior to the Transaction, the Company had various share-based compensation programs, which included stock options and restricted stock units. The ARAMARK 2001 Equity Incentive Plan (2001 EIP) provided for the initial issuance of up to 30 million shares of either Class A or Class B common stock, with an additional 3% of the Company’s common stock outstanding as of the end of the prior calendar year becoming available under the plan on each January 1 following the adoption of the plan. Pursuant to the Transaction (described in Notes 1 and 2), all outstanding stock options and restricted stock units became fully vested and the holders became entitled to receive cash consideration equal to the difference between the exercise price and $33.80 per share for stock options and $33.80 per share for restricted stock units. The Predecessor share-based compensation programs were discontinued in connection with the Transaction. Under all programs, the terms of the awards were fixed at the grant date.
For the Predecessor period from September 30, 2006 through January 26, 2007, approximately $11.2 million of tax benefits were included in “Other financing activities.”
Compensation expense in the Predecessor period from September 30, 2006 through January 26, 2007 for share-based compensation programs was approximately $84.1 million, before taxes of $31.9 million. The compensation expense recognized is classified as “Selling and general corporate expenses” in the Consolidated Statements of Operations. No cost was capitalized.
Stock Options
Compensation expense was recognized on a straight-line basis over the vesting period during which employees performed the related services. Approximately $51.4 million was charged to expense during the Predecessor period from September 30, 2006 through January 26, 2007. Using the Black-Scholes option pricing model, the weighted-average grant-date fair value of options granted during the Predecessor period from September 30, 2006 through January 26, 2007 was $8.46. The Company applied a forfeiture assumption of 8.7% per annum in the calculation of expense for the Predecessor period from September 30, 2006 through January 26, 2007.
Pursuant to the Transaction, all nonvested stock options vested immediately, which resulted in a charge of approximately $21.1 million during the Predecessor period from September 30, 2006 through January 26, 2007 for the recognition of all unrecognized compensation expense. In addition, due to provisions included in the 2001 EIP that allowed for the cash settlement of stock options upon a change in control, the Predecessor period from September 30, 2006 through January 26, 2007 also includes a charge of approximately $26.1 million for the reclassification of stock options from equity awards to liability awards.
Restricted Stock Units
Compensation expense was recognized on a straight-line basis over the vesting period during which employees perform related services. Approximately $32.7 million was charged to expense during the Predecessor period from September 30, 2006 through January 26, 2007. The Company applied a forfeiture assumption of 8.7% per annum in the calculation of such expense during the Predecessor period from September 30, 2006 through January 26, 2007.
Pursuant to the Transaction, all nonvested restricted stock units vested immediately, which resulted in a charge of approximately $21.1 million during the Predecessor period from September 30, 2006 through January 26, 2007 for the recognition of all unrecognized compensation expense. In addition, due to provisions included in the 2001 EIP that allowed for the cash settlement of restricted stock units upon a change in control,
S-40
ARAMARK CORPORATION AND SUBSIDIARIES
NOTES TO CONSOLIDATED FINANCIAL STATEMENTS—(Continued)
the Predecessor period from September 30, 2006 through January 26, 2007 also includes a charge of approximately $8.8 million for the reclassification of restricted stock units from equity awards to liability awards.
NOTE 12. ACCOUNTS RECEIVABLE SECURITIZATION:
The Company has an agreement (the Receivables Facility) with several financial institutions whereby it sells on a continuous basis an undivided interest in all eligible trade accounts receivable, as defined in the Receivables Facility. As part of the Transaction, the Company amended and restated the Receivables Facility, increasing the maximum sales amount from $225 million to $250 million. Pursuant to the Receivables Facility, the Company formed ARAMARK Receivables, LLC, a wholly-owned, consolidated, bankruptcy-remote subsidiary. ARAMARK Receivables, LLC was formed for the sole purpose of buying and selling receivables generated by certain subsidiaries of the Company. Under the Receivables Facility, the Company and certain of its subsidiaries transfer without recourse all of their accounts receivable to ARAMARK Receivables, LLC. ARAMARK Receivables, LLC, in turn, has sold and, subject to certain conditions, may from time to time sell an undivided interest in these receivables. As collections reduce previously sold interests, interests in new, eligible receivables can be sold, subject to meeting certain conditions. This two-step transaction is accounted for as a sale of receivables following the provisions of the authoritative accounting guidance.
The Company has retained an undivided interest in the transferred receivables of approximately $264.3 million and $296.2 million at October 2, 2009 and October 3, 2008, respectively, which is subject to a security interest. Because the sold accounts receivable underlying the retained ownership interest are generally short-term in nature, the fair value of the retained interest approximated its carrying value at both October 2, 2009 and October 3, 2008. The fair value of the retained interest is measured based on expected future cash flows adjusted for unobservable inputs used to assess the risk of credit losses. Those inputs reflect the diversified customer base, the short-term nature of the securitized asset, aging trends and historic collections experience. The Company believes that the allowance for doubtful accounts balance is a reasonable approximation of any credit risk of the customers that generated the receivables. At October 2, 2009 and October 3, 2008, approximately $235.4 million and $250.0 million of accounts receivable were sold and removed from the Consolidated Balance Sheets, respectively. The Company has retained collection and administrative responsibility for the participating interest sold but has not recorded an asset or liability related to the servicing responsibility retained as the fees earned for servicing were estimated to approximate fair value of the services provided. During fiscal 2009 and fiscal 2008, ARAMARK Receivables, LLC sold an undivided interest in approximately $2.90 billion and $2.96 billion of trade account receivables, respectively, and remitted to bank conduits, pursuant to the servicing agreement, approximately $2.91 billion and $2.95 billion in collections on trade account receivables previously sold, respectively. The discount on the sale of the undivided interest in the transferred receivables is based on the cost of the commercial paper borrowings of the buyers. The loss on the sale of receivables was approximately $5.1 million, $11.7 million, $9.9 million and $4.1 million for fiscal 2009, fiscal 2008, the Successor period from January 27, 2007 through September 28, 2007 and the Predecessor period from September 30, 2006 through January 26, 2007, respectively, and is included in “Interest and Other Financing Costs, net” in the Consolidated Statements of Operations.
NOTE 13. DEVELOPMENTS IN THE UNIFORM AND CAREER APPAREL SEGMENT
During the second quarter of fiscal 2009, the Company initiated a repositioning effort to reduce the cost structure and address the demand softness in the WearGuard direct marketing business. The Company will be exiting a portion of its direct marketing business directed at consumers and very small businesses by the second quarter of fiscal 2010 and migrating its distribution and customization functions from its facilities in Norwell, Massachusetts to its facilities in Salem, Virginia and Reno, Nevada. In addition, the Company has been reducing its headcount in all the businesses in the Uniform and Career Apparel segment. As a result of these actions, the
S-41
ARAMARK CORPORATION AND SUBSIDIARIES
NOTES TO CONSOLIDATED FINANCIAL STATEMENTS—(Continued)
Company recorded a total charge of approximately $34.2 million during the second quarter of fiscal 2009 for severance and other related costs (approximately $8.5 million), inventory write-downs (approximately $18.5 million primarily as a result of the exit from a portion of its direct marketing business and approximately $2.2 million at other businesses within the segment in response to demand softness) and other asset write-downs (approximately $5.0 million, of which $2.0 million related to additional reserves for receivables and $3.0 million related to facility and equipment write-downs), which is included in “Cost of services provided” in the Consolidated Statements of Operations. The Company expects to incur additional costs of approximately $1.1 million in association with the repositioning efforts over the next two fiscal quarters as the relocation of the WearGuard distribution and operations functions are completed.
NOTE 14. COMMITMENTS AND CONTINGENCIES:
The Company has capital and other purchase commitments of approximately $299.3 million at October 2, 2009, primarily in connection with commitments for capital projects, client contract investments and business acquisitions. At October 2, 2009, the Company also has letters of credit outstanding in the amount of $199.5 million.
Certain of the Company’s lease arrangements, primarily vehicle leases, with terms of one to eight years, contain provisions related to residual value guarantees. The maximum potential liability to ARAMARK under such arrangements was approximately $96.3 million at October 2, 2009 if the terminal fair value of vehicles coming off lease was zero. Consistent with past experience, management does not expect any significant payments will be required pursuant to these arrangements. No amounts have been accrued for guarantee arrangements at October 2, 2009.
Rental expense for all operating leases was $168.1 million, $179.8 million, $110.8 million and $55.0 million for fiscal 2009, fiscal 2008, the Successor period from January 27, 2007 through September 28, 2007 and the Predecessor period from September 30, 2006 through January 26, 2007, respectively. Following is a schedule of the future minimum rental and similar commitments under all noncancelable operating leases as of October 2, 2009 (in thousands):
| Fiscal Year |
|||
| 2010 |
$ | 189,637 | |
| 2011 |
78,590 | ||
| 2012 |
64,459 | ||
| 2013 |
52,491 | ||
| 2014 |
46,682 | ||
| Subsequent years |
171,937 | ||
| Total minimum rental obligations |
$ | 603,796 | |
From time to time, the Company is a party to various legal actions and investigations involving claims incidental to the conduct of its business, including actions by clients, customers, employees, government entities and third parties, including under federal and state employment laws, wage and hour laws, immigration laws, customs, import and export control laws, environmental laws, false claims statutes and dram shop laws. Based on information currently available, advice of counsel, available insurance coverage, established reserves and other resources, the Company does not believe that any such actions are likely to be, individually or in the aggregate, material to its business, financial condition, results of operations or cash flows. However, in the event of unexpected further developments, it is possible that the ultimate resolution of these matters, or other similar matters, if unfavorable, may be materially adverse to the Company’s business, financial condition, results of operations or cash flows.
S-42
ARAMARK CORPORATION AND SUBSIDIARIES
NOTES TO CONSOLIDATED FINANCIAL STATEMENTS—(Continued)
On October 3, 2008, the Company and a subsidiary were served with a complaint in a Qui Tam action filed by Relator Robert Pritsker (which was originally filed on October 30, 2003) naming the Company and certain other companies in its industry in the United States District Court, E.D.PA. and alleging, among other things, that the defendants, including the Company, caused the making of certain false certifications to the federal government of compliance with U.S.D.A. regulations and seeking unspecified damages. The United States declined to join in this action in 2005. On March 6, 2009, in response to motions by all defendants, the Court dismissed this action with prejudice. On April 3, 2009, the Relator filed notice of an appeal to the United States Court of Appeals for the Third Circuit, which appeal is still pending. The Company intends to continue to vigorously defend against these claims.
On July 29, 2009, Genaro Zendejas Morales, a former employee of the Company, and Ricky Silva and Cristian Sanchez, current employees of ARAMARK Sports, LLC, filed a proposed class action complaint against the Company, ARAMARK Sports, Inc., and ARAMARK Sports, LLC in the United States District Court, Central District of California. The complaint, as filed, purports to assert class claims that defendants did not pay all monies due under California wage and hour laws. The plaintiffs are seeking unspecified monetary damages and injunctive relief. The case is being vigorously defended by the Company.
NOTE 15. QUARTERLY RESULTS (Unaudited):
The following table summarizes quarterly financial data for fiscal 2009 and fiscal 2008 (in thousands):
| 2009 |
Quarter Ended January 2, 2009 |
Quarter Ended April 3, 2009 |
Quarter Ended July 3, 2009 |
Quarter Ended October 2, 2009 |
Year Ended October 2, 2009 |
|||||||||||||
| Sales |
$ | 3,173,957 | $ | 3,029,301 | $ | 3,022,067 | $ | 3,072,544 | $ | 12,297,869 | ||||||||
| Cost of services provided |
2,863,198 | 2,782,289 | 2,754,385 | 2,773,853 | 11,173,725 | |||||||||||||
| Net income (loss) |
8,171 | (25,354 | ) | (6,159 | ) | 16,431 | (6,911 | ) | ||||||||||
| 2008 |
Quarter Ended December 28, 2007 |
Quarter Ended March 28, 2008 |
Quarter Ended June 27, 2008 |
Quarter Ended October 3, 2008 |
Year Ended October 3, 2008 | ||||||||||||
| Sales |
$ | 3,350,620 | $ | 3,173,177 | $ | 3,380,078 | $ | 3,566,277 | $ | 13,470,152 | |||||||
| Cost of services provided |
3,015,337 | 2,891,566 | 3,087,803 | 3,223,383 | 12,218,089 | ||||||||||||
| Net income (loss) |
26,083 | (16,608 | ) | (3,639 | ) | 33,624 | 39,460 | ||||||||||
In the first and second fiscal quarters, within the “Food and Support Services—North America” segment, historically there has been a lower level of activity at the higher margin sports, entertainment and recreational food service operations that is partly offset by increased activity in the educational operations. However, in the third and fourth fiscal quarters, historically there has been a significant increase at sports, entertainment and recreational accounts that is partially offset by the effect of summer recess on the educational accounts. In addition, there is a seasonal increase in volume of directly marketed work clothing during the first fiscal quarter.
See Note 16 for a description of Transaction-related items and other events that had an effect on interim operating results.
S-43
ARAMARK CORPORATION AND SUBSIDIARIES
NOTES TO CONSOLIDATED FINANCIAL STATEMENTS—(Continued)
NOTE 16. BUSINESS SEGMENTS:
The Company provides or manages services in two strategic areas: Food and Support Services and Uniform and Career Apparel, which are organized and managed in the following reportable business segments:
Food and Support Services—North America—Food, refreshment, specialized dietary and support services, including facility maintenance and housekeeping, provided to business, educational and healthcare institutions and in sports, entertainment, recreational and other facilities serving the general public in the United States and Canada. Food and Support Services—North America operating income for fiscal 2009 includes severance related expenses of $11.5 million. Food and Support Services—North America operating income for fiscal 2007 includes approximately $2.9 million of insurance proceeds related to business disruptions in the Gulf Coast region caused by Hurricane Katrina.
Food and Support Services—International—Food, refreshment, specialized dietary and support services, including facility maintenance and housekeeping, provided to business, educational and healthcare institutions and in sports, entertainment, recreational and other facilities serving the general public. Operations are conducted in 20 countries, including the U.K., Germany, Chile, Ireland, Spain, Belgium, China, Korea, Mexico and Japan. Food and Support Services—International operating income for fiscal 2009 includes severance related expenses of $8.2 million and a favorable non-income tax settlement in the U.K. of $8.4 million.
Uniform and Career Apparel—Rental, sale, cleaning, maintenance and delivery of personalized uniform and career apparel and other textile items on a contract basis and direct marketing of personalized uniforms and career apparel, public safety equipment and accessories to businesses, public institutions and individuals. Also provided are walk-off mats, cleaning cloths, disposable towels and other environmental control items. The segment operating income in fiscal 2009 includes a charge of approximately $34.2 million related to the Company’s repositioning effort to reduce the cost structure and address the demand softness in the WearGuard direct marketing business (see Note 13). The segment operating income in the Successor period from January 27, 2007 through September 28, 2007 includes a technology asset impairment charge of approximately $4.2 million.
Sales by segment are substantially comprised of services to unaffiliated customers and clients. Operating income reflects expenses directly related to individual segments plus an allocation of corporate expenses applicable to more than one segment.
Corporate—Corporate includes general corporate expenses not specifically allocated to an individual segment. During fiscal 2009, the Company recorded share-based compensation expense of $25.4 million, including approximately $13.8 million for the modification of the portion of the Performance-Based Options whose vesting was subject to the achievement of the Company’s fiscal 2008 EBIT target. During fiscal 2008, the Company recorded share-based compensation expense of $11.8 million, which included a reversal of approximately $13.3 million of share-based compensation expense during the fourth quarter of fiscal 2008 related to expense previously recognized for Performance-Based Options (see Note 11). During the Successor period from January 27, 2007 through September 28, 2007, the Company recorded share-based compensation expense of approximately $27.5 million, approximately $5.7 million of costs related to the Transaction and a currency transaction gain of approximately $3.8 million. During the Predecessor period from September 30, 2006 through January 26, 2007, the Company recorded costs of approximately $112.1 million related to the Transaction, which included approximately $11.2 million of accounting, investment banking, legal and other costs associated with the Transaction, a compensation charge of approximately $77.1 million related to the accelerated vesting and buyout of employee stock options and restricted stock units, and a charge of approximately $23.8 million related to change in control payments to certain executives. During the Predecessor period from September 30, 2006 through January 26, 2007, the Company recorded share-based compensation
S-44
ARAMARK CORPORATION AND SUBSIDIARIES
NOTES TO CONSOLIDATED FINANCIAL STATEMENTS—(Continued)
expense of approximately $84.1 million, which includes the approximately $77.1 million related to the accelerated vesting and buyout of employee stock options and restricted stock units.
During the Successor period from January 27, 2007 through September 28, 2007, the Company recorded a charge of approximately $12.8 million for the cost of obtaining a bridge financing facility for the Transaction, which is included in “Interest and other financing costs, net.”
Financial information by segment follows (in millions):
| Sales | ||||||||||||||||||
| Successor | Predecessor | |||||||||||||||||
| Fiscal Year Ended October 2, 2009 |
Fiscal Year Ended October 3, 2008 |
Period from January 27, 2007 through September 28, 2007 |
Period from September 30, 2006 through January 26, 2007 |
|||||||||||||||
| Food and Support Services—North America |
$ | 8,393.5 | $ | 8,924.9 | $ | 5,759.0 | $ | 2,674.4 | ||||||||||
| Food and Support Services—International |
2,326.7 | 2,783.0 | 1,561.5 | 714.6 | ||||||||||||||
| Uniform and Career Apparel |
1,577.7 | 1,762.3 | 1,117.9 | 556.9 | ||||||||||||||
| $ | 12,297.9 | $ | 13,470.2 | $ | 8,438.4 | $ | 3,945.9 | |||||||||||
| Operating Income | ||||||||||||||||||
| Successor | Predecessor | |||||||||||||||||
| Fiscal Year Ended October 2, 2009 |
Fiscal Year Ended October 3, 2008 |
Period from January 27, 2007 through September 28, 2007 |
Period from September 30, 2006 through January 26, 2007 |
|||||||||||||||
| Food and Support Services—North America |
$ | 349.3 | $ | 386.8 | $ | 267.5 | $ | 130.7 | ||||||||||
| Food and Support Services—International |
83.4 | 97.2 | 64.7 | 22.6 | ||||||||||||||
| Uniform and Career Apparel |
61.8 | 126.6 | 82.0 | 51.2 | ||||||||||||||
| 494.5 | 610.6 | 414.2 | 204.5 | |||||||||||||||
| Corporate |
(57.0 | ) | (44.5 | ) | (48.8 | ) | (136.0 | ) | ||||||||||
| Other income (expense) (Note 3) |
— | — | 21.2 | — | ||||||||||||||
| Operating income |
437.5 | 566.1 | 386.6 | 68.5 | ||||||||||||||
| Interest and other financing costs, net |
(472.3 | ) | (514.7 | ) | (365.9 | ) | (48.7 | ) | ||||||||||
| Income (loss) before income taxes |
$ | (34.8 | ) | $ | 51.4 | $ | 20.7 | $ | 19.8 | |||||||||
| Depreciation and Amortization | ||||||||||||||
| Successor | Predecessor | |||||||||||||
| Fiscal Year Ended October 2, 2009 |
Fiscal Year Ended October 3, 2008 |
Period from January 27, 2007 through September 28, 2007 |
Period from September 30, 2006 through January 26, 2007 | |||||||||||
| Food and Support Services—North America |
$ | 327.4 | $ | 329.0 | $ | 210.7 | $ | 72.6 | ||||||
| Food and Support Services—International |
55.7 | 61.4 | 36.4 | 15.5 | ||||||||||
| Uniform and Career Apparel |
119.4 | 118.1 | 74.6 | 27.6 | ||||||||||
| Corporate |
0.6 | 0.6 | 0.8 | 0.7 | ||||||||||
| $ | 503.1 | $ | 509.1 | $ | 322.5 | $ | 116.4 | |||||||
S-45
ARAMARK CORPORATION AND SUBSIDIARIES
NOTES TO CONSOLIDATED FINANCIAL STATEMENTS—(Continued)
Depreciation and amortization increased significantly in the Successor periods compared to the Predecessor periods as a result of purchase accounting for the Transaction, which resulted in the allocation of approximately $1.7 billion of purchase consideration to amortizable customer relationship intangible assets and fair value adjustments to property and equipment.
| Capital Expenditures and Client Contract Investments * | ||||||||||||||
| Successor | Predecessor | |||||||||||||
| Fiscal Year Ended October 2, 2009 |
Fiscal Year Ended October 3, 2008 |
Period from January 27, 2007 through September 28, 2007 |
Period from September 30, 2006 through January 26, 2007 | |||||||||||
| Food and Support Services—North America |
$ | 282.2 | $ | 258.8 | $ | 161.9 | $ | 59.0 | ||||||
| Food and Support Services—International |
44.0 | 47.9 | 35.7 | 11.3 | ||||||||||
| Uniform and Career Apparel |
34.4 | 62.3 | 51.6 | 24.0 | ||||||||||
| Corporate |
0.2 | — | — | 0.1 | ||||||||||
| $ | 360.8 | $ | 369.0 | $ | 249.2 | $ | 94.4 | |||||||
| * | Includes amounts acquired in business combinations |
| Identifiable Assets | ||||||
| October 2, 2009 |
October 3, 2008 | |||||
| Food and Support Services—North America |
$ | 6,795.6 | $ | 6,848.8 | ||
| Food and Support Services—International |
1,378.0 | 1,399.1 | ||||
| Uniform and Career Apparel |
1,866.0 | 2,072.3 | ||||
| Corporate |
259.8 | 203.2 | ||||
| $ | 10,299.4 | $ | 10,523.4 | |||
Sales and net property & equipment classified as domestic or foreign operations follow (in millions):
| Sales | ||||||||||||||
| Successor | Predecessor | |||||||||||||
| Fiscal Year Ended October 2, 2009 |
Fiscal Year Ended October 3, 2008 |
Period from January 27, 2007 through September 28, 2007 |
Period from September 30, 2006 through January 26, 2007 | |||||||||||
| United States |
$ | 9,286.8 | $ | 9,998.0 | $ | 6,488.9 | $ | 3,034.5 | ||||||
| Foreign |
3,011.1 | 3,472.2 | 1,949.5 | 911.4 | ||||||||||
| $ | 12,297.9 | $ | 13,470.2 | $ | 8,438.4 | $ | 3,945.9 | |||||||
| Net Property & Equipment | ||||||
| October 2, 2009 |
October 3, 2008 | |||||
| United States |
$ | 965.8 | $ | 1,053.3 | ||
| Foreign |
194.7 | 169.8 | ||||
| $ | 1,160.5 | $ | 1,223.1 | |||
S-46
ARAMARK CORPORATION AND SUBSIDIARIES
NOTES TO CONSOLIDATED FINANCIAL STATEMENTS—(Continued)
NOTE 17. FAIR VALUE OF FINANCIAL ASSETS AND FINANCIAL LIABILITIES:
In the first quarter of fiscal 2009, the Company adopted the accounting pronouncement related to fair value measurements for financial assets and financial liabilities, which defines fair value, provides guidance for measuring fair value and requires certain disclosures. The cumulative effect of adoption resulted in a reduction to “Accumulated other comprehensive loss” of approximately $7.5 million, net of tax, related to considering both the Company’s and the counterparties’ credit risk in the fair value measurement of our interest rate swaps. This pronouncement does not require any new fair value measurements, but rather applies to all other accounting pronouncements that require or permit fair value measurements. It also discusses valuation techniques, such as the market approach (comparable market prices), the income approach (present value of future income or cash flow), and the cost approach (cost to replace the service capacity of an asset or replacement cost). The pronouncement utilizes a fair value hierarchy that prioritizes the inputs to valuation techniques used to measure fair value into three broad levels. The following is a brief description of those three levels:
| • | Level 1—inputs to the valuation methodology are quoted prices (unadjusted) for identical assets or liabilities in active markets |
| • | Level 2—inputs to the valuation methodology include quoted prices for similar assets and liabilities in active markets, and inputs that are observable for the asset or liability, either directly or indirectly, for substantially the full term of the financial instrument |
| • | Level 3—inputs to the valuation methodology are unobservable and significant to the fair value measurement |
The Company’s financial instruments consist primarily of cash and cash equivalents, accounts receivable, accounts payable, borrowings and derivatives. Management believes that the carrying value of cash and cash equivalents, accounts receivable and accounts payable are representative of their respective fair values. The fair value of the Company’s debt at October 2, 2009 and October 3, 2008 was $5,414.0 million and $5,050.8 million, respectively. The carrying value of the Company’s debt at October 2, 2009 and October 3, 2008 was $5,721.7 million and $5,859.6 million, respectively. The fair values were computed using market quotes, if available, or based on discounted cash flows using market interest rates as of the end of the respective periods.
At October 2, 2009, the following financial assets and financial liabilities were measured at fair value on a recurring basis using the type of inputs shown (in thousands):
| October 2, 2009 |
Quoted prices in active markets Level 1 |
Significant other observable inputs Level 2 |
Significant unobservable inputs Level 3 | |||||||||
| Assets: |
||||||||||||
| Undivided retained interest in trade receivables sold under the Company’s Receivable Facility |
$ | 264,335 | $ | — | $ | — | $ | 264,335 | ||||
| Liabilities: |
||||||||||||
| Interest rate swap agreements |
$ | 215,679 | $ | — | $ | 215,679 | $ | — | ||||
| Cross currency swap agreements |
24,183 | — | 24,183 | — | ||||||||
| Natural gas hedge agreements |
1,039 | — | 1,039 | — | ||||||||
| Gasoline and diesel fuel hedge agreements |
1,810 | — | 1,810 | — | ||||||||
| Foreign currency forward exchange contracts |
392 | — | 392 | — | ||||||||
| Total liabilities measured at fair value on a recurring basis |
$ | 243,103 | $ | — | $ | 243,103 | $ | — | ||||
| Common Stock Subject to Repurchase |
$ | 176,395 | $ | — | $ | — | $ | 176,395 | ||||
S-47
ARAMARK CORPORATION AND SUBSIDIARIES
NOTES TO CONSOLIDATED FINANCIAL STATEMENTS—(Continued)
The following table presents the changes in financial instruments for which Level 3 inputs were significant to their valuation for fiscal 2009 (in thousands):
| Undivided retained interest in trade receivables |
Common Stock Subject to Repurchase |
|||||||
| Balance at October 3, 2008 |
$ | 296,200 | $ | 229,628 | ||||
| Net realized gains/(losses) included in earnings |
(5,113 | ) | — | |||||
| Net purchases, issuances and settlements |
(26,752 | ) | (23,198 | ) | ||||
| Change in fair market value of common stock of the Parent Company |
— | (30,035 | ) | |||||
| Balance at October 2, 2009 |
$ | 264,335 | $ | 176,395 | ||||
Net realized gain/(losses) are included in “Cost of services provided” in the Consolidated Statements of Operations.
NOTE 18. RELATED PARTY TRANSACTIONS:
In connection with the Transaction, the Company and its Parent Company paid the Sponsors and certain affiliates $27.0 million of transaction fees, $30.0 million for acquisition advisory services, approximately $105.2 million in underwriting discount, commitment, arranging and similar fees related to the senior secured credit agreement and the issuance of the $1.28 billion of 8.50% senior notes due 2015 and $500 million of senior floating rate notes due 2015, and approximately $1.1 million for the reimbursement of out-of-pocket expenses. These amounts have been included in the total purchase price of the Transaction, recorded as debt issue cost or expensed as incurred, as appropriate.
As of October 2, 2009, the notional value of interest rate swaps with entities affiliated with Goldman Sachs Capital Partners was $1,358 million, £25.0 million and ¥5.0 billion and with entities affiliated with J.P. Morgan Partners was $1,413 million and £25 million. As of October 3, 2008, the notional value of interest rate swaps with entities affiliated with Goldman Sachs Capital Partners was $1,410 million, £37.5 million and ¥5.0 billion and with entities affiliated with J.P. Morgan Partners was $1,340 million £37.5 million. In all of these swaps, we pay the counterparty a fixed interest rate in exchange for their payment of a floating interest rate. The net payments in fiscal 2009, fiscal 2008 and the Successor period from January 27, 2007 through September 28, 2007 to entities affiliated with Goldman Sachs Capital Partners pursuant to interest rate swap transactions were approximately $45.7 million, $17.3 million and $0.4 million, respectively. The net payments in fiscal 2009, fiscal 2008 and the Successor period from January 27, 2007 through September 28, 2007 to entities affiliated with J.P. Morgan Partners pursuant to interest rate swap transactions were approximately $43.2 million, $16.2 million and $0.4 million, respectively.
NOTE 19. CONDENSED CONSOLIDATING FINANCIAL STATEMENTS OF ARAMARK CORPORATION AND SUBSIDIARIES:
The following condensed consolidating financial statements of ARAMARK Corporation (the “Company”) and subsidiaries have been prepared pursuant to Rule 3-10 of Regulation S-X.
These condensed consolidating financial statements have been prepared from the Company’s financial information on the same basis of accounting as the consolidated financial statements. The prior period income statement presentation format has been modified to conform to the current period presentation. Interest expense and certain other costs are partially allocated to all of the subsidiaries of the Company. Goodwill and other intangible assets have been allocated to the subsidiaries based on management’s estimates. On January 26, 2007, in connection with the Transaction, the Company issued 8.50% senior notes due 2015 and senior floating rate notes due 2015 as described in Note 5. The senior notes are jointly and severally guaranteed on a senior unsecured basis by substantially all of the Company’s existing and future U.S. subsidiaries (excluding the receivables facility subsidiary) (“Guarantors”). Each of the Guarantors is wholly-owned, directly or indirectly, by the Company. All other subsidiaries of the Company, either direct or indirect, do not guarantee the senior notes (“Non-Guarantors”). The Guarantors also guarantee certain other unregistered debt.
S-48
ARAMARK CORPORATION AND SUBSIDIARIES
NOTES TO CONSOLIDATED FINANCIAL STATEMENTS—(Continued)
CONDENSED CONSOLIDATING BALANCE SHEETS
October 2, 2009
(in millions)
| ARAMARK Corporation |
Guarantors | Non Guarantors |
Eliminations | Consolidated | ||||||||||||
| ASSETS | ||||||||||||||||
| Current Assets: |
||||||||||||||||
| Cash and cash equivalents |
$ | 156.8 | $ | 26.6 | $ | 41.2 | $ | — | $ | 224.6 | ||||||
| Receivables |
6.1 | 140.5 | 661.4 | — | 808.0 | |||||||||||
| Inventories, at lower of cost or market |
16.7 | 376.7 | 70.7 | — | 464.1 | |||||||||||
| Prepayments and other current assets |
43.2 | 126.2 | 22.3 | — | 191.7 | |||||||||||
| Total current assets |
222.8 | 670.0 | 795.6 | — | 1,688.4 | |||||||||||
| Property and Equipment, net |
39.5 | 895.0 | 226.0 | — | 1,160.5 | |||||||||||
| Goodwill |
173.1 | 3,902.0 | 451.3 | — | 4,526.4 | |||||||||||
| Investment in and Advances to Subsidiaries |
6,740.0 | 179.8 | 232.2 | (7,152.0 | ) | — | ||||||||||
| Other Intangible Assets |
70.2 | 1,747.8 | 238.4 | — | 2,056.4 | |||||||||||
| Other Assets |
104.7 | 489.4 | 275.6 | (2.0 | ) | 867.7 | ||||||||||
| $ | 7,350.3 | $ | 7,884.0 | $ | 2,219.1 | $ | (7,154.0 | ) | $ | 10,299.4 | ||||||
| LIABILITIES AND SHAREHOLDER’S EQUITY | ||||||||||||||||
| Current Liabilities: |
||||||||||||||||
| Current maturities of long-term borrowings |
$ | 9.4 | $ | 14.2 | $ | 20.4 | $ | — | $ | 44.0 | ||||||
| Accounts payable |
104.3 | 312.4 | 253.0 | — | 669.7 | |||||||||||
| Accrued expenses and other liabilities |
163.0 | 667.9 | 190.0 | — | 1,020.9 | |||||||||||
| Total current liabilities |
276.7 | 994.5 | 463.4 | — | 1,734.6 | |||||||||||
| Long-Term Borrowings |
5,121.2 | 39.4 | 517.1 | — | 5,677.7 | |||||||||||
| Deferred Income Taxes and Other Noncurrent Liabilities |
415.6 | 813.5 | 121.2 | — | 1,350.3 | |||||||||||
| Intercompany Payable |
— | 5,864.3 | 1,000.9 | (6,865.2 | ) | — | ||||||||||
| Common Stock Subject to Repurchase |
176.4 | — | — | — | 176.4 | |||||||||||
| Shareholder’s Equity |
1,360.4 | 172.3 | 116.5 | (288.8 | ) | 1,360.4 | ||||||||||
| $ | 7,350.3 | $ | 7,884.0 | $ | 2,219.1 | $ | (7,154.0 | ) | $ | 10,299.4 | ||||||
S-49
ARAMARK CORPORATION AND SUBSIDIARIES
NOTES TO CONSOLIDATED FINANCIAL STATEMENTS—(Continued)
CONDENSED CONSOLIDATING BALANCE SHEETS
October 3, 2008
(in millions)
| ARAMARK Corporation |
Guarantors | Non Guarantors |
Eliminations | Consolidated | ||||||||||||
| ASSETS | ||||||||||||||||
| Current Assets: |
||||||||||||||||
| Cash and cash equivalents |
$ | 78.4 | $ | 31.7 | $ | 38.8 | $ | — | $ | 148.9 | ||||||
| Receivables |
— | 230.9 | 718.8 | — | 949.7 | |||||||||||
| Inventories, at lower of cost or market |
18.3 | 446.2 | 71.3 | — | 535.8 | |||||||||||
| Prepayments and other current assets |
32.3 | 111.8 | 19.9 | — | 164.0 | |||||||||||
| Total current assets |
129.0 | 820.6 | 848.8 | — | 1,798.4 | |||||||||||
| Property and Equipment, net |
47.1 | 972.1 | 203.9 | — | 1,223.1 | |||||||||||
| Goodwill |
173.1 | 3,900.9 | 438.1 | — | 4,512.1 | |||||||||||
| Investment in and Advances to Subsidiaries |
6,929.4 | 186.3 | 235.1 | (7,350.8 | ) | — | ||||||||||
| Other Intangible Assets |
79.6 | 1,895.4 | 240.3 | — | 2,215.3 | |||||||||||
| Other Assets |
124.2 | 399.1 | 253.2 | (2.0 | ) | 774.5 | ||||||||||
| $ | 7,482.4 | $ | 8,174.4 | $ | 2,219.4 | $ | (7,352.8 | ) | $ | 10,523.4 | ||||||
| LIABILITIES AND SHAREHOLDER’S EQUITY | ||||||||||||||||
| Current Liabilities: |
||||||||||||||||
| Current maturities of long-term borrowings |
$ | 2.2 | $ | 16.2 | $ | 36.3 | $ | — | $ | 54.7 | ||||||
| Accounts payable |
135.1 | 356.6 | 256.2 | — | 747.9 | |||||||||||
| Accrued expenses and other liabilities |
172.5 | 668.0 | 168.5 | — | 1,009.0 | |||||||||||
| Total current liabilities |
309.8 | 1,040.8 | 461.0 | — | 1,811.6 | |||||||||||
| Long-Term Borrowings |
5,217.9 | 44.3 | 542.7 | — | 5,804.9 | |||||||||||
| Deferred Income Taxes and Other Noncurrent Liabilities |
385.2 | 817.7 | 134.5 | — | 1,337.4 | |||||||||||
| Intercompany Payable |
— | 6,099.8 | 966.9 | (7,066.7 | ) | — | ||||||||||
| Common Stock Subject to Repurchase |
229.6 | — | — | — | 229.6 | |||||||||||
| Shareholder’s Equity |
1,339.9 | 171.8 | 114.3 | (286.1 | ) | 1,339.9 | ||||||||||
| $ | 7,482.4 | $ | 8,174.4 | $ | 2,219.4 | $ | (7,352.8 | ) | $ | 10,523.4 | ||||||
S-50
ARAMARK CORPORATION AND SUBSIDIARIES
NOTES TO CONSOLIDATED FINANCIAL STATEMENTS—(Continued)
CONDENSED CONSOLIDATING STATEMENT OF OPERATIONS
For the year ended October 2, 2009 (Successor)
(in millions)
| ARAMARK Corporation |
Guarantors | Non Guarantors |
Eliminations | Consolidated | |||||||||||||||
| Sales |
$ | 978.7 | $ | 8,092.3 | $ | 3,226.9 | $ | — | $ | 12,297.9 | |||||||||
| Costs and Expenses: |
|||||||||||||||||||
| Cost of services provided |
921.9 | 7,274.4 | 2,977.5 | — | 11,173.8 | ||||||||||||||
| Depreciation and amortization |
21.9 | 390.7 | 90.5 | — | 503.1 | ||||||||||||||
| Selling and general corporate expenses |
64.6 | 97.6 | 21.2 | — | 183.4 | ||||||||||||||
| Interest and other financing costs |
439.7 | 1.4 | 31.2 | — | 472.3 | ||||||||||||||
| Expense allocations |
(428.2 | ) | 395.9 | 32.3 | — | — | |||||||||||||
| 1,019.9 | 8,160.0 | 3,152.7 | — | 12,332.6 | |||||||||||||||
| Income (Loss) before income taxes |
(41.2 | ) | (67.7 | ) | 74.2 | — | (34.7 | ) | |||||||||||
| Provision (Benefit) for Income Taxes |
(15.7 | ) | (28.9 | ) | 16.8 | — | (27.8 | ) | |||||||||||
| Equity in Net Income of Subsidiaries |
18.6 | — | — | (18.6 | ) | — | |||||||||||||
| Net income (loss) |
$ | (6.9 | ) | $ | (38.8 | ) | $ | 57.4 | $ | (18.6 | ) | $ | (6.9 | ) | |||||
S-51
ARAMARK CORPORATION AND SUBSIDIARIES
NOTES TO CONSOLIDATED FINANCIAL STATEMENTS—(Continued)
CONDENSED CONSOLIDATING STATEMENTS OF OPERATIONS
For the year ended October 3, 2008 (Successor)
(in millions)
| ARAMARK Corporation |
Guarantors | Non Guarantors |
Eliminations | Consolidated | |||||||||||||
| Sales |
$ | 1,108.6 | $ | 8,577.9 | $ | 3,783.7 | $ | — | $ | 13,470.2 | |||||||
| Costs and Expenses: |
|||||||||||||||||
| Cost of services provided |
1,038.9 | 7,680.4 | 3,498.8 | — | 12,218.1 | ||||||||||||
| Depreciation and amortization |
25.8 | 387.8 | 95.5 | — | 509.1 | ||||||||||||
| Selling and general corporate expenses |
52.3 | 98.2 | 26.3 | — | 176.8 | ||||||||||||
| Interest and other financing costs |
449.8 | 2.9 | 62.0 | — | 514.7 | ||||||||||||
| Expense allocations |
(413.9 | ) | 401.3 | 12.6 | — | — | |||||||||||
| 1,152.9 | 8,570.6 | 3,695.2 | — | 13,418.7 | |||||||||||||
| Income (Loss) before income taxes |
(44.3 | ) | 7.3 | 88.5 | — | 51.5 | |||||||||||
| Provision (Benefit) for Income Taxes |
(15.3 | ) | 5.0 | 22.3 | — | 12.0 | |||||||||||
| Equity in Net Income of Subsidiaries |
68.5 | — | — | (68.5 | ) | — | |||||||||||
| Net income |
$ | 39.5 | $ | 2.3 | $ | 66.2 | $ | (68.5 | ) | $ | 39.5 | ||||||
S-52
ARAMARK CORPORATION AND SUBSIDIARIES
NOTES TO CONSOLIDATED FINANCIAL STATEMENTS—(Continued)
CONDENSED CONSOLIDATING STATEMENTS OF OPERATIONS
For the period from January 27, 2007 through September 28, 2007 (Successor)
(in millions)
| ARAMARK Corporation |
Guarantors | Non Guarantors |
Eliminations | Consolidated | ||||||||||||||
| Sales |
$ | 782.2 | $ | 5,503.8 | $ | 2,152.5 | $ | — | $ | 8,438.5 | ||||||||
| Costs and Expenses: |
||||||||||||||||||
| Cost of services provided |
765.5 | 4,880.1 | 1,978.1 | — | 7,623.7 | |||||||||||||
| Depreciation and amortization |
14.2 | 252.4 | 55.9 | — | 322.5 | |||||||||||||
| Selling and general corporate expenses |
52.1 | 59.8 | 15.0 | — | 126.9 | |||||||||||||
| Other income |
— | (21.2 | ) | — | — | (21.2 | ) | |||||||||||
| Interest and other financing costs |
328.4 | 1.4 | 36.1 | — | 365.9 | |||||||||||||
| Expense allocations |
(473.7 | ) | 444.0 | 29.7 | — | — | ||||||||||||
| 686.5 | 5,616.5 | 2,114.8 | — | 8,417.8 | ||||||||||||||
| Income (Loss) before income taxes |
95.7 | (112.7 | ) | 37.7 | — | 20.7 | ||||||||||||
| Provision (Benefit) for Income Taxes |
43.3 | (50.9 | ) | 12.2 | — | 4.6 | ||||||||||||
| Equity in Net Loss of Subsidiaries |
(36.3 | ) | — | — | 36.3 | — | ||||||||||||
| Net income (loss) |
$ | 16.1 | $ | (61.8 | ) | $ | 25.5 | $ | 36.3 | $ | 16.1 | |||||||
S-53
ARAMARK CORPORATION AND SUBSIDIARIES
NOTES TO CONSOLIDATED FINANCIAL STATEMENTS—(Continued)
CONDENSED CONSOLIDATING STATEMENTS OF OPERATIONS
For the period from September 30, 2006 through January 26, 2007 (Predecessor)
(in millions)
| ARAMARK Corporation |
Guarantors | Non Guarantors |
Eliminations | Consolidated | |||||||||||||
| Sales |
$ | 357.4 | $ | 2,608.5 | $ | 980.0 | $ | — | $ | 3,945.9 | |||||||
| Costs and Expenses: |
|||||||||||||||||
| Cost of services provided |
360.2 | 2,314.3 | 912.5 | — | 3,587.0 | ||||||||||||
| Depreciation and amortization |
9.2 | 84.8 | 22.4 | — | 116.4 | ||||||||||||
| Selling and general corporate expenses |
137.8 | 29.0 | 7.1 | — | 173.9 | ||||||||||||
| Interest and other financing costs |
35.2 | 0.6 | 12.9 | — | 48.7 | ||||||||||||
| Expense allocations |
(42.6 | ) | 34.6 | 8.0 | — | — | |||||||||||
| 499.8 | 2,463.3 | 962.9 | — | 3,926.0 | |||||||||||||
| Income (Loss) before income taxes |
(142.4 | ) | 145.2 | 17.1 | — | 19.9 | |||||||||||
| Provision (Benefit) for Income Taxes |
(55.4 | ) | 55.1 | 5.4 | — | 5.1 | |||||||||||
| Equity in Net Income of Subsidiaries |
101.8 | — | — | (101.8 | ) | — | |||||||||||
| Net income |
$ | 14.8 | $ | 90.1 | $ | 11.7 | $ | (101.8 | ) | $ | 14.8 | ||||||
S-54
ARAMARK CORPORATION AND SUBSIDIARIES
NOTES TO CONSOLIDATED FINANCIAL STATEMENTS—(Continued)
CONDENSED CONSOLIDATING STATEMENTS OF CASH FLOWS
For the year ended October 2, 2009 (Successor)
(in millions)
| ARAMARK Corporation |
Guarantors | Non Guarantors |
Eliminations | Consolidated | ||||||||||||||||
| Net cash provided by (used in) operating activities |
$ | (29.4 | ) | $ | 590.6 | $ | 223.9 | $ | (77.9 | ) | $ | 707.2 | ||||||||
| Cash flows from investing activities: |
||||||||||||||||||||
| Purchases of property and equipment and client contract investments |
(6.6 | ) | (267.2 | ) | (84.5 | ) | — | (358.3 | ) | |||||||||||
| Disposals of property and equipment |
2.2 | 21.6 | 4.1 | — | 27.9 | |||||||||||||||
| Acquisitions of certain businesses |
(85.0 | ) | (22.8 | ) | (29.9 | ) | — | (137.7 | ) | |||||||||||
| Other investing activities |
(0.6 | ) | 3.0 | 0.9 | — | 3.3 | ||||||||||||||
| Net cash used in investing activities |
(90.0 | ) | (265.4 | ) | (109.4 | ) | — | (464.8 | ) | |||||||||||
| Cash flows from financing activities: |
||||||||||||||||||||
| Proceeds from additional long-term borrowings |
— | — | 0.7 | — | 0.7 | |||||||||||||||
| Payment of long-term borrowings |
(102.2 | ) | (16.1 | ) | (29.2 | ) | — | (147.5 | ) | |||||||||||
| Proceeds from issuance of Parent Company common stock |
3.4 | — | — | — | 3.4 | |||||||||||||||
| Repurchase of Parent Company common stock |
(23.0 | ) | — | — | — | (23.0 | ) | |||||||||||||
| Other financing activities |
(0.3 | ) | — | — | — | (0.3 | ) | |||||||||||||
| Change in intercompany, net |
319.9 | (314.2 | ) | (83.6 | ) | 77.9 | — | |||||||||||||
| Net cash provided by (used in) financing activities |
197.8 | (330.3 | ) | (112.1 | ) | 77.9 | (166.7 | ) | ||||||||||||
| Increase (Decrease) in cash and cash equivalents |
78.4 | (5.1 | ) | 2.4 | — | 75.7 | ||||||||||||||
| Cash and cash equivalents, beginning of period |
78.4 | 31.7 | 38.8 | — | 148.9 | |||||||||||||||
| Cash and cash equivalents, end of period |
$ | 156.8 | $ | 26.6 | $ | 41.2 | $ | — | $ | 224.6 | ||||||||||
S-55
ARAMARK CORPORATION AND SUBSIDIARIES
NOTES TO CONSOLIDATED FINANCIAL STATEMENTS—(Continued)
CONDENSED CONSOLIDATING STATEMENTS OF CASH FLOWS
For the year ended October 3, 2008 (Successor)
(in millions)
| ARAMARK Corporation |
Guarantors | Non Guarantors |
Eliminations | Consolidated | ||||||||||||||||
| Net cash provided by (used in) operating activities |
$ | (7.9 | ) | $ | 378.3 | $ | 150.2 | $ | (26.4 | ) | $ | 494.2 | ||||||||
| Cash flows from investing activities: |
||||||||||||||||||||
| Purchases of property and equipment and client contract investments |
(8.1 | ) | (268.1 | ) | (88.0 | ) | — | (364.2 | ) | |||||||||||
| Disposals of property and equipment |
1.5 | 7.4 | 5.0 | — | 13.9 | |||||||||||||||
| Acquisitions of certain businesses |
— | (39.9 | ) | (15.1 | ) | — | (55.0 | ) | ||||||||||||
| Other investing activities |
0.3 | (8.0 | ) | 7.8 | — | 0.1 | ||||||||||||||
| Net cash used in investing activities |
(6.3 | ) | (308.6 | ) | (90.3 | ) | — | (405.2 | ) | |||||||||||
| Cash flows from financing activities: |
||||||||||||||||||||
| Proceeds from additional long-term borrowings |
— | — | 5.5 | — | 5.5 | |||||||||||||||
| Payment of long-term borrowings |
(2.1 | ) | (10.0 | ) | (14.1 | ) | — | (26.2 | ) | |||||||||||
| Proceeds from issuance of Parent Company common stock |
5.4 | — | — | — | 5.4 | |||||||||||||||
| Repurchase of Parent Company common stock |
(9.8 | ) | — | — | — | (9.8 | ) | |||||||||||||
| Other financing activities |
1.4 | — | — | — | 1.4 | |||||||||||||||
| Change in intercompany, net |
63.3 | (56.5 | ) | (33.2 | ) | 26.4 | — | |||||||||||||
| Net cash provided by (used in) financing activities |
58.2 | (66.5 | ) | (41.8 | ) | 26.4 | (23.7 | ) | ||||||||||||
| Increase in cash and cash equivalents |
44.0 | 3.2 | 18.1 | — | 65.3 | |||||||||||||||
| Cash and cash equivalents, beginning of period |
34.4 | 28.5 | 20.7 | — | 83.6 | |||||||||||||||
| Cash and cash equivalents, end of period |
$ | 78.4 | $ | 31.7 | $ | 38.8 | $ | — | $ | 148.9 | ||||||||||
S-56
ARAMARK CORPORATION AND SUBSIDIARIES
NOTES TO CONSOLIDATED FINANCIAL STATEMENTS—(Continued)
CONDENSED CONSOLIDATING STATEMENTS OF CASH FLOWS
For the period from January 27, 2007 through September 28, 2007 (Successor)
(in millions)
| ARAMARK Corporation |
Guarantors | Non Guarantors |
Eliminations | Consolidated | ||||||||||||||||
| Net cash provided by (used in) operating activities |
$ | 799.5 | $ | (356.4 | ) | $ | (226.7 | ) | $ | 344.0 | $ | 560.4 | ||||||||
| Cash flows from investing activities: |
||||||||||||||||||||
| Purchases of property and equipment and client contract investments |
(9.8 | ) | (186.0 | ) | (53.1 | ) | — | (248.9 | ) | |||||||||||
| Disposals of property and equipment |
1.5 | 9.9 | 1.7 | — | 13.1 | |||||||||||||||
| Proceeds from sale of investment |
— | 286.0 | — | — | 286.0 | |||||||||||||||
| Acquisitions of businesses, net of cash acquired |
— | (36.3 | ) | (23.9 | ) | — | (60.2 | ) | ||||||||||||
| Acquisition of ARAMARK Corporation |
(6,100.7 | ) | — | — | — | (6,100.7 | ) | |||||||||||||
| Other investing activities |
36.5 | (31.9 | ) | (1.7 | ) | 2.2 | 5.1 | |||||||||||||
| Net cash provided by (used in) investing activities |
(6,072.5 | ) | 41.7 | (77.0 | ) | 2.2 | (6,105.6 | ) | ||||||||||||
| Cash flows from financing activities: |
||||||||||||||||||||
| Proceeds from additional long-term borrowings |
5,371.7 | — | 547.1 | — | 5,918.8 | |||||||||||||||
| Payment of long-term borrowings |
(1,681.2 | ) | (11.8 | ) | (438.5 | ) | — | (2,131.5 | ) | |||||||||||
| Proceeds from issuance of Parent Company common stock |
1,844.1 | — | — | — | 1,844.1 | |||||||||||||||
| Repurchase of Parent Company common stock |
(0.8 | ) | — | — | — | (0.8 | ) | |||||||||||||
| Other financing activities |
(137.1 | ) | — | (1.3 | ) | — | (138.4 | ) | ||||||||||||
| Change in intercompany, net |
(166.7 | ) | 323.8 | 189.1 | (346.2 | ) | — | |||||||||||||
| Net cash provided by financing activities |
5,230.0 | 312.0 | 296.4 | (346.2 | ) | 5,492.2 | ||||||||||||||
| Decrease in cash and cash equivalents |
(43.0 | ) | (2.7 | ) | (7.3 | ) | — | (53.0 | ) | |||||||||||
| Cash and cash equivalents, beginning of period |
77.4 | 31.2 | 28.0 | — | 136.6 | |||||||||||||||
| Cash and cash equivalents, end of period |
$ | 34.4 | $ | 28.5 | $ | 20.7 | $ | — | $ | 83.6 | ||||||||||
S-57
ARAMARK CORPORATION AND SUBSIDIARIES
NOTES TO CONSOLIDATED FINANCIAL STATEMENTS—(Continued)
CONDENSED CONSOLIDATING STATEMENTS OF CASH FLOWS
For the period from September 30, 2006 through January 26, 2007 (Predecessor)
(in millions)
| ARAMARK Corporation |
Guarantors | Non Guarantors |
Eliminations | Consolidated | ||||||||||||||||
| Net cash provided by (used in) operating activities |
$ | (624.5 | ) | $ | 366.9 | $ | 183.2 | $ | (1.9 | ) | $ | (76.3 | ) | |||||||
| Cash flows from investing activities: |
||||||||||||||||||||
| Purchases of property and equipment and client contract investments |
(4.0 | ) | (64.6 | ) | (12.9 | ) | — | (81.5 | ) | |||||||||||
| Disposals of property and equipment |
0.5 | 16.9 | 2.6 | — | 20.0 | |||||||||||||||
| Acquisitions of businesses, net of cash acquired |
— | (80.0 | ) | (1.7 | ) | — | (81.7 | ) | ||||||||||||
| Other investing activities |
(18.7 | ) | 27.8 | (3.6 | ) | (2.2 | ) | 3.3 | ||||||||||||
| Net cash used in investing activities |
(22.2 | ) | (99.9 | ) | (15.6 | ) | (2.2 | ) | (139.9 | ) | ||||||||||
| Cash flows from financing activities: |
||||||||||||||||||||
| Proceeds from additional long-term borrowings |
260.0 | — | 157.0 | — | 417.0 | |||||||||||||||
| Payment of long-term borrowings |
(126.6 | ) | (4.4 | ) | — | — | (131.0 | ) | ||||||||||||
| Proceeds from issuance of common stock |
9.7 | — | — | — | 9.7 | |||||||||||||||
| Payment of dividends |
(12.6 | ) | — | — | — | (12.6 | ) | |||||||||||||
| Other financing activities |
22.0 | — | — | — | 22.0 | |||||||||||||||
| Change in intercompany, net |
567.8 | (251.5 | ) | (320.4 | ) | 4.1 | — | |||||||||||||
| Net cash provided by (used in) financing activities |
720.3 | (255.9 | ) | (163.4 | ) | 4.1 | 305.1 | |||||||||||||
| Increase in cash and cash equivalents |
73.6 | 11.1 | 4.2 | — | 88.9 | |||||||||||||||
| Cash and cash equivalents, beginning of period |
3.8 | 20.1 | 23.8 | — | 47.7 | |||||||||||||||
| Cash and cash equivalents, end of period |
$ | 77.4 | $ | 31.2 | $ | 28.0 | $ | — | $ | 136.6 | ||||||||||
S-58
ARAMARK CORPORATION AND SUBSIDIARIES
NOTES TO CONSOLIDATED FINANCIAL STATEMENTS—(Continued)
SCHEDULE II—VALUATION AND QUALIFYING ACCOUNTS AND RESERVES
For the Fiscal Years Ended October 2, 2009 (Successor) and October 3, 2008 (Successor), the Period from January 27, 2007 through September 28, 2007 (Successor) and the Period from September 30, 2006 through January 26, 2007 (Predecessor)
| Additions | Reductions | |||||||||||||||||
| Balance, Beginning of Period |
Acquisition of Businesses |
Charged to Income |
Divestiture of Businesses |
Deductions from Reserves(1) |
Balance, End of Period | |||||||||||||
| (in thousands) | ||||||||||||||||||
| Description |
||||||||||||||||||
| Fiscal Year 2009 (Successor) |
||||||||||||||||||
| Reserve for doubtful accounts, advances & current notes receivable |
$ | 42,528 | $ | — | $ | 16,896 | $ | — | $ | 21,058 | $ | 38,366 | ||||||
| Fiscal Year 2008 (Successor) |
||||||||||||||||||
| Reserve for doubtful accounts, advances & current notes receivable |
$ | 40,022 | $ | 25 | $ | 22,895 | $ | — | $ | 20,414 | $ | 42,528 | ||||||
| For the Period from January 27, 2007 through September 28, 2007 (Successor) |
||||||||||||||||||
| Reserve for doubtful accounts, advances & current notes receivable |
$ | 40,899 | $ | 94 | $ | 11,683 | $ | — | $ | 12,654 | $ | 40,022 | ||||||
| For the Period from September 30, 2006 through January 26, 2007 (Predecessor) |
||||||||||||||||||
| Reserve for doubtful accounts, advances & current notes receivable |
$ | 37,222 | $ | 138 | $ | 7,562 | $ | — | $ | 4,023 | $ | 40,899 | ||||||
| (1) | Allowances granted, amounts determined not to be collectible and translation. |
S-59
EXHIBIT INDEX
Copies of any of the following exhibits are available to Stockholders for the cost of reproduction upon written request from the Secretary, ARAMARK Corporation, 1101 Market Street, Philadelphia, PA 19107.
| 2.1 | Agreement and Plan of Merger dated as of August 8, 2006 between ARAMARK Corporation, RMK Acquisition Corporation and RMK Finance LLC (incorporated by reference to exhibit 2.1 to ARAMARK Corporation’s Current Report on Form 8-K filed with the SEC on August 8, 2006, pursuant to the Exchange Act (file number 001-16807)). | |
| 2.2 | Certificate of Ownership and Merger (merging ARAMARK Corporation into ARAMARK Services, Inc.) (incorporated by reference to Exhibit 99.1 to ARAMARK Corporation’s Current Report on Form 8-K filed with the SEC on April 5, 2007, pursuant to the Exchange Act (file number 001-16807)). | |
| 3.1 | Certificate of Incorporation of ARAMARK Corporation (incorporated by reference to Exhibit 3.1 to ARAMARK Corporation’s Current Report on Form 8-K filed with the SEC on April 5, 2007, pursuant to the Exchange Act (file number 001-16807)). | |
| 3.2 | By-laws of ARAMARK Corporation (incorporated by reference to Exhibit 3.2 to ARAMARK Corporation’s Current Report on Form 8-K filed with the SEC on April 5, 2007, pursuant to the Exchange Act (file number 001-16807)). | |
| 4.1 | Form of Guaranteed Indenture, among ARAMARK Services, Inc., ARAMARK Corporation, as guarantor, and Bank One Trust Company, National Association, as trustee (incorporated by reference to Exhibit 4.4 to ARAMARK Corporation’s Registration Statement on Form S-3 filed with the SEC on March 27, 2002, pursuant to the Securities Act (Registration No. 33-85050)). | |
| 4.2 | Indenture, dated as of January 26, 2007, among the Company, RMK Acquisition Corporation, the Guarantors party thereto and The Bank of New York, as Trustee (incorporated by reference to Exhibit 4.1 to ARAMARK Corporation’s Current Report on Form 8-K filed with the SEC on February 1, 2007, pursuant to the Exchange Act (file number 001-16807)). | |
| 4.3 | Registration Rights Agreement, dated as of January 26, 2007, among RMK Acquisition Corporation, the Company, the Guarantors party thereto, and JP Morgan Securities, Inc. and Goldman, Sachs & Co., as representatives of the initial purchasers (incorporated by reference to Exhibit 4.2 to ARAMARK Corporation’s Current Report on Form 8-K filed with the SEC on February 1, 2007, pursuant to the Exchange Act (file number 001-16807)). | |
| 4.4 | Supplemental Indenture, dated as of March 30, 2007, to the Indenture dated as of January 26, 2007 among ARAMARK Corporation, the Guarantors listed on the signature page thereto and The Bank of New York, as Trustee (incorporated by reference to Exhibit 99.3 to ARAMARK Corporation’s Current Report on Form 8-K filed with the SEC on April 5, 2007, pursuant to the Exchange Act (file number 001-16807)). | |
| 10.1 | Employment Agreement dated November 2, 2004 between ARAMARK Corporation and Joseph Neubauer (incorporated by reference to exhibit 10.1 to the Company’s Current Report on Form 8-K/A filed with the SEC on November 8, 2004, pursuant to the Exchange Act (file number 001-16807)).** | |
| 10.2 | Amendment, effective as of January 26, 2007, to the Employment Agreement dated November 2, 2004 between ARAMARK Corporation and Joseph Neubauer (incorporated by reference to Exhibit 10.3 to ARAMARK Corporation’s Current Report on Form 8-K filed with the SEC on February 1, 2007, pursuant to the Exchange Act (file number 001-16807)).** | |
| 10.3 | Amendment, effective as of November 15, 2007, to the Employment Agreement dated November 2, 2004 between ARAMARK Corporation and Joseph Neubauer (incorporated by reference to Exhibit 10.1 to ARAMARK Corporation’s Current Report on Form 8-K filed with the SEC on November 16, 2007, pursuant to the Exchange Act (file number 001-04762)). | |
| 10.4 | Letter relating to Joseph Neubauer’s Employment Agreement dated November 14, 2008. (incorporated by reference to Exhibit 10.4 to ARAMARK Corporation’s Annual Report on Form 10-K filed with the SEC on December 15, 2008, pursuant to the Exchange Act (file number 001-04762)).** | |
| 10.5 | Form of Agreement Relating to Employment and Post-Employment Competition and Schedule 1 listing each Executive Officer who is a party to such Agreement (Incorporated by reference to exhibit 10.1 to the Company’s Current Report on Form 8-K filed with the SEC on July 19, 2007, pursuant to the Exchange Act (file number 001-04762)).** | |
| 10.6 | Agreement Relating to Employment and Post-Employment Competition dated November 14, 2007 between ARAMARK Corporation and Joseph Munnelly (incorporated by reference to Exhibit 10.2 to ARAMARK Corporation’s Quarterly Report on Form 10-Q filed with the SEC on February 6, 2008, pursuant to the Exchange Act (file number 001-04762)).** | |
| 10.7 | Agreement Relating to Employment and Post-Employment Competition dated November 12, 2003 between ARAMARK Corporation and Christopher Holland (incorporated by reference to Exhibit 10.14 to ARAMARK Corporation’s Annual Report on Form 10-K filed with the SEC on December 10, 2004, pursuant to the Exchange Act (file number 001-16807)).** | |
| 10.8 | Form of Amendment to Agreement Relating to Employment and Post-Employment Competition (incorporated by reference to Exhibit 10.8 to ARAMARK Corporation’s Annual Report on Form 10-K filed with the SEC on December 15, 2008, pursuant to the Exchange Act (file number 001-04762)).** | |
| 10.9 | Letter Agreement dated May 12, 2009 between ARAMARK Corporation and Bart J. Colli (incorporated by reference to Exhibit 10.1 to the Quarterly Report on Form 10-Q filed with the SEC on May 13, 2009, pursuant to the Exchange Act (file number 001-04762)) . | |
| 10.10 | Form of Indemnification Agreement and attached schedule (incorporated by reference to Exhibit 10.4 to the Company’s Current Report on Form 8-K filed with the SEC on August 10, 2005, pursuant to the Exchange Act (file number 001-16807)).** | |
| 10.11 | ARAMARK Holdings Corporation 2007 Management Stock Incentive Plan, as amended and restated (incorporated by reference to Exhibit 10.2 to ARAMARK Corporation’s Current Report on Form 8-K filed with the SEC on November 16, 2007, pursuant to the Exchange Act (file number 001-04762)).** | |
| 10.12 | First Amendment to ARAMARK Holdings Corporation 2007 Management Stock Incentive Plan (incorporated by reference to Exhibit 10.1 to ARAMARK Corporation’s Quarterly Report on Form 10-Q filed with the SEC on February 6, 2008, pursuant to the Exchange Act (file number 001-04762)).** | |
| 10.13 | Second Amendment to ARAMARK Holdings Corporation 2007 Management Stock Incentive Plan.* ** | |
| 10.14 | Form of Non-Qualified Stock Option Agreement with ARAMARK Holdings Corporation (incorporated by reference to Exhibit 10.5 to ARAMARK Corporation’s Current Report on Form 8-K filed with the SEC on February 1, 2007, pursuant to the Exchange Act (file number 001-16807)).** | |
| 10.15 | Form of Non-Qualified Stock Option Agreement with ARAMARK Holdings Corporation (incorporated by reference to Exhibit 10.2 to ARAMARK Corporation’s Quarterly Report on Form 10-Q filed with the SEC on August 8, 2007, pursuant to the Exchange Act (file number 001-04762)).** | |
| 10.16 | Form of Non-Qualified Stock Option Agreement with ARAMARK Holdings Corporation (incorporated by reference to Exhibit 10.3 to ARAMARK Corporation’s Current Report on Form 8-K filed with the SEC on November 16, 2007, pursuant to the Exchange Act (file number 001-04762)).** | |
| 10.17 | Form of Restricted Stock Award Agreement with ARAMARK Holdings Corporation (incorporated by reference to Exhibit 10.7 to ARAMARK Corporation’s Current Report on Form 8-K filed with the SEC on February 1, 2007, pursuant to the Exchange Act (file number 001-16807)).** | |
| 10.18 | Schedule 1s to Outstanding Non-Qualified Stock Option Agreements.* ** | |
| 10.19 | Form of Schedule 1 to Form of Non-Qualified Stock Option Agreement (beginning with 2010 EBIT targets).* ** | |
| 10.20 | Amended and Restated ARAMARK 2001 Stock Unit Retirement Plan (incorporated by reference to Exhibit 10.22 to ARAMARK Corporation’s Annual Report on Form 10-K filed with the SEC on December 19, 2003, pursuant to the Exchange Act (File No. 001-16807)).** | |
| 10.21 | ARAMARK Savings Incentive Retirement Plan (A Successor Plan to the “ARAMARK 2005 Stock Unit Retirement Plan”) (incorporated by reference to Exhibit 10.1 to ARAMARK Corporation’s Current Report on Form 8-K filed with the SEC on February 9, 2007, pursuant to the Exchange Act (file number 001-16807)).** | |
| 10.22 | Amended and Restated Savings Incentive Retirement Plan (incorporated by reference to Exhibit 10.4 to the Company’s Quarterly Report on Form 10-Q filed with the SEC on August 8, 2007, pursuant to the Exchange Act (file number 001-04762).** | |
| 10.23 | ARAMARK 2001 Deferred Compensation Plan (incorporated by reference to Exhibit 10.1 to ARAMARK Corporation’s Registration Statement on Form S-8 filed with the Commission on May 24, 2002, pursuant to the Securities Act (Registration No. 333-89120)).** | |
| 10.24 | Amended and Restated 2005 Deferred Compensation Plan (incorporated by reference to Exhibit 10.3 to the Company’s Quarterly Report on Form 10-Q filed with the SEC on August 8, 2007, pursuant to the Exchange Act (file number 001-04762)).** | |
| 10.25 | Senior Executive Annual Performance Bonus Plan (incorporated by reference to Exhibit 10.4 to ARAMARK Corporation’s Current Report on Form 8-K filed with the SEC on November 16, 2007, pursuant to the Exchange Act (file number 001-04762)).** | |
| 10.26 | Amended Survivor Income Protection Plan (incorporated by reference to Exhibit 10.5 to the Company’s Quarterly Report on Form 10-Q filed with the SEC on August 8, 2007, pursuant to the Exchange Act (file number 001-04762)).** | |
| 10.27 | Credit Agreement, dated as of January 26, 2007, among the financial institutions parties thereto, as the lenders, Citibank, N.A., as Administrative Agent and Collateral Agent, and RMK Acquisition Corporation, ARAMARK Canada Ltd., ARAMARK Investments Limited, ARAMARK Ireland Holdings Limited, ARAMARK Holdings GmbH & Co. KG and ARAMARK GmbH, as borrowers, and the guarantors from time to time party thereto, and Goldman Sachs Credit Partners L.P. and J.P. Morgan Securities Inc., as Joint Lead Arrangers, Joint Bookrunners and Co-Syndication Agents, and Barclays Bank PLC and Wachovia Bank, National Association, as Co-Documentation Agents (incorporated by reference to Exhibit 10.1 to ARAMARK Corporation’s Current Report on Form 8-K filed with the SEC on February 1, 2007, pursuant to the Exchange Act (file number 001-16807)). | |
| 10.28 | U.S. Pledge and Security Agreement, dated as of January 26, 2007, among ARAMARK Intermediate Holdco Corporation, RMK Acquisition Corporation, the Company, the Subsidiary Parties from time to time party thereto and Citibank, N.A., as collateral agent (incorporated by reference to Exhibit 10.2 to ARAMARK Corporation’s Current Report on Form 8-K filed with the SEC on February 1, 2007, pursuant to the Exchange Act (file number 001-16807)). | |
| 10.29 | Amendment No. 1, dated as of March 28, 2007 to the Credit Agreement, dated as of January 26, 2007, among ARAMARK Corporation (as successor to RMK Acquisition Corporation), ARAMARK Canada Ltd., ARAMARK Investments Limited, ARAMARK Ireland Holdings Limited, ARAMARK Holdings GmbH & CO. KG, ARAMARK GmbH, ARAMARK Intermediate Holdco Corporation, the Subsidiary Guarantors (as defined therein), the Lenders (as defined therein), Citibank, N.A., as administrative agent and collateral agent for the Lenders and the other parties thereto from time to time (incorporated by reference to Exhibit 10.1 to ARAMARK Corporation’s Current Report on Form 8-K filed with the SEC on April 2, 2007, pursuant to the Exchange Act (file number 001-16807)). | |
| 10.30 | Assumption Agreement, dated as of March 30, 2007, relating to the Credit Agreement dated as of January 26, 2007 among ARAMARK Corporation, the other Borrowers and Loan Guarantors party thereto, the Lenders party thereto, Citibank, N.A., as administrative agent and collateral agent for the Lenders, and the other parties thereto from time to time (incorporated by reference to Exhibit 99.2 to ARAMARK Corporation’s Current Report on Form 8-K filed with the SEC on April 5, 2007, pursuant to the Exchange Act (file number 001-16807)). | |
| 10.31 | Master Distribution Agreement effective as of November 25, 2006, between SYSCO Corporation and ARAMARK Food and Support Services Group, Inc. (incorporated by reference to Exhibit 10.1 to ARAMARK Corporation’s Quarterly Report on Form 10-Q filed with the SEC on February 7, 2007, pursuant to the Exchange Act (File No. 001-16807)).† | |
| 10.32 | Stock Purchase Agreement dated March 3, 2003 among Knowledge Schools, Inc., Children’s Discovery Centers of America, Inc. (to be renamed Knowledge Learning Corporation), ARAMARK Corporation, ARAMARK Organizational Services, Inc. and ARAMARK Educational Resources, Inc. (incorporated by reference to Exhibit 10.1 to ARAMARK Corporation’s Quarterly Report on Form 10-Q filed with the SEC on May 12, 2003, pursuant to the Exchange Act (File No. 001-16807)). | |
| 10.33 | First Amendment to Stock Purchase Agreement dated March 14, 2003 among Knowledge Schools, Inc., Children’s Discovery Centers of America, Inc. (to be renamed Knowledge Learning Corporation), ARAMARK Corporation, ARAMARK Organizational Services, Inc. and ARAMARK Educational Resources, Inc. (incorporated by reference to Exhibit 10.2 to ARAMARK Corporation’s Quarterly Report on Form 10-Q filed with the SEC on May 12, 2003, pursuant to the Exchange Act (File No. 001-16807)). | |
| 10.34 | Second Amendment to Stock Purchase Agreement, dated May 9, 2003, among Knowledge Schools, Inc., Knowledge Learning Corporation formerly known as Children’s Discovery Centers of America, Inc., ARAMARK Corporation, ARAMARK Organizational Services, Inc. and ARAMARK Educational Resources, Inc. (incorporated by reference to Exhibit 10.1 to ARAMARK Corporation’s Quarterly Report on Form 10-Q filed with the SEC on August 11, 2003, pursuant to the Exchange Act (File No. 001-16807)). | |
| 12 | Ratio of Earnings to Fixed Charges.* | |
| 21 | List of subsidiaries of ARAMARK Corporation.* | |
| 23.1 | Consent of Independent Registered Public Accounting Firm—KPMG LLP.* | |
| 23.2 | Consent of Independent Auditors—Deloitte Touche Tohmatsu.* | |
| 24 | Power of Attorney (included on the signature page hereto). | |
| 31.1 | Certification of Joseph Neubauer pursuant to Section 302 of the Sarbanes-Oxley Act of 2002.* | |
| 31.2 | Certification of L. Frederick Sutherland pursuant to Section 302 of the Sarbanes-Oxley Act of 2002.* | |
| 32.1 | Certification of Joseph Neubauer pursuant to Section 906 of the Sarbanes-Oxley Act of 2002.* | |
| 32.2 | Certification of L. Frederick Sutherland pursuant to Section 906 of the Sarbanes-Oxley Act of 2002.* | |
| 99.1 | Audited Financial Statements of AIM SERVICES Co., Ltd.* | |
| † | Portions omitted pursuant to a request for confidential treatment. |
| * | Filed herewith. |
| ** | Management contract or compensatory plan or arrangement required to be filed or incorporated as an exhibit. |